X-Ray sum frequency generation; direct imaging of ultrafast electron dynamics
Abstract
X-ray diffraction from molecules in the ground state produces an image of their charge density, and time-resolved X-ray diffraction can thus monitor the motion of the nuclei. However, the density change of excited valence electrons upon optical excitation can barely be monitored with regular diffraction techniques due to the overwhelming background contribution of the core electrons. We present a nonlinear X-ray technique made possible by novel free electron laser sources, which provides a spatial electron density image of valence electron excitations. The technique, sum frequency generation carried out with a visible pump and a broadband X-ray diffraction pulse, yields snapshots of the transition charge densities, which represent the electron density variations upon optical excitation. The technique is illustrated by ab initio simulations of transition charge density imaging for the optically induced electronic dynamics in a donor/acceptor substituted stilbene.
X-ray diffraction has been used for over a century to determine the structure of molecular crystals. The experimental acquisition of time-dependent charge density movies by high resolution diffraction is now a reality thanks to recent advances in intense femtosecond X-ray free electron lasers (XFELs) emma2010first ; Ding09prstab ; natphotChini ; miller2014femtosecond and tabletop ultrafast electron diffraction sources Miller14ar ; Baum09cp . The static ground state charge density is commonly probed suryanarayana2013x , with steady progress to tackle various difficulties, like the crystallization of large biomolecules and the phase recovery of the signal taylor2003phase , yielding the molecular structure by revealing the location of the nuclei. Time-resolved X-ray diffraction bennett2014time ; schotte2003watching ; glownia2016self can provide stroboscopic snapshots of time-evolving excited state charge densities. The resulting real-time movies miller2010making ; dixit2012imaging ; vrakking2012x monitor the optically triggered evolution of the molecular geometry. Optical excitations typically involve few valence electrons (e.g., excitation from the highest occupied to the lowest unoccupied molecular orbital). The ground and excited state charge densities are thus very similar and X-ray diffraction is dominated by the highly localized atomic core electrons. Despite this difficulty, variations of few electrons over a strong background have been reported experimentallydixit2012imaging ; vrakking2012x .
In this paper, we propose a technique that directly images the change in the charge density upon optical excitation and is thus particularly sensitive to the optically active electrons. The technique can simultaneously monitor the rearrangement of the nuclei and the valence electrons in a photochemical reaction. It offers the direct observation of transition charge densities (TCDs), which contribute to time-resolved diffraction when the molecule is initially prepared in a superposition of states. Our derivation for the diffraction image is based on the minimal coupling field-matter interaction Hamiltonian salammolQED :
| (1) |
where and are the current and charge density operators and is the vector potential. The term is responsible for the off resonant diffraction as it is commonly used for X-Ray structure determination. The charge density is given by
| (2) |
where are the electronic eigenstates and are the electronic coordinates. The TCDs are the off diagonal elements, , which carry valuable chemical information about the molecular orbitals involved in the excitation (details can be found in supplementary materials). When the ground and the excited states can each be described by a single Slater determinant, the TCD is given by the product of the two molecular orbitals differing between the two configurations. The TCD thus provides a direct image of the electronic excitation and the location of the electron promotion. Another way to view the TCD is as follows: if we prepare a superposition of the excited state and ground state , the expectation value of the charge density is given by a sum of , and the TCD . The latter thus represents an interference contribution to the charge density. In the next section, we present the proposed technique in general terms. Then, we present short time electron dynamics simulations for a donor/acceptor molecule, 4-amino-4’nitrostilbene, which demonstrates how the TCD and time-evolving electron image of the valence electrons can be directly recovered. Finally, we discuss possible extensions in the conclusion.
Ultrafast sum-frequency X-ray diffraction
The technique proposed here is a combined optical/X-ray nonlinear sum-frequency-generation (SFG) that provides images of electron dynamics through the TCDs (see Fig. 1(a)). This technique can also be seen as an anti-Stokes Raman scattering following a single interaction with an actinic pump. It is the lowest order nonlinear extension of time-resolved diffraction.
The proposed SFG technique, which records the image is laid out schematically in Figs. 1(a) and (b), combines a visible pump and an X-ray probe to study electronic coherences stiopkin2008heterodyne . This is a direct analogue of the IR/visible setup commonly used to monitor vibrational coherences stiopkin2008heterodyne ; shen1989surface . Time-domain SFG is routinely performed in the optical or infrared (IR) regime, most common in IR SFG from molecules on surfaces laaser2011time ; Bethune:79 . A visible/UV pulse first brings the molecule into a superposition of electronic ground state and excited states, which is then probed by a broadband hard X-ray pulse after a delay . Diagrams representing a time-dependent perturbation on the molecule density matrix mukamel1999principles for the heterodyne and the homodyne detection schemes of SFG are sketched in Figs. 1(c) and (d).
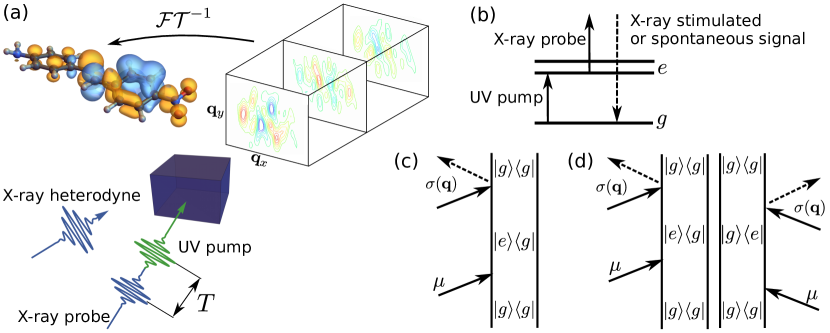
X-ray diffraction is commonly carried out in the spontaneous (homodyne) detection mode roslyak2010unified where the signal is the diffraction image yang2016diffractive . The phase of the charge density in momentum -space is thus lost, requiring to perform a phase retrieval algorithm taylor2003phase . Time-independent holographic stimulated (heterodyne) diffraction Martin14nat ; Tegze96nat with a local reference oscillator can recover the phase of the scattered wave. This common detection mode in the infrared and visible has been recently extended to the soft X-ray regime marchesini2008massively . It requires an additional X-ray heterodyne pulse that interferes with the spontaneously emitted photons. This heterodyne pulse must be coincident with the X-ray probe pulse and relatively weak in order to be measured by an intensity detector. Additionally, its phase must be controlled in order to recover the phase of the signal. The scanning in momentum space can be done by rotating the sample and the heterodyne pulse (see supplementary materials) or by varying the spatial variation of the heterodyne pulse.
An interaction with a visible pulse first creates a valence electronic wavepacket. If the pump selects a single electronic excited state, the signal provides a static image of a single TCD. However, when the pump creates a superposition of several states, the technique can provide images of the dynamics of electronic wavepackets. This adds valuable spectroscopic information to the structural information provided by ordinary diffraction.
Off-resonant diffraction processes are described by the term in the minimal coupling field-matter interaction Hamiltonian, where is the charge density operator and is the vector potential of the radiation field. In the heterodyne case, the emitted photon fields are superimposed with a classical field , and the stimulated signal is defined as the field intensity in the direction minus the intensity of the heterodyne pulse. Alternatively the experiment can be done by imaging the coherent spontaneous emission and using a phase recovery. The heterodyne detected diffraction image does not require long range order in the sample, and can in principle be obtained with (oriented) molecules spence2004single ; chatterley2017three . The homodyne (spontaneous) detected diffraction image relies on intermolecular interference and requires a crystalline sample. We focus on the heterodyne detected diffraction image (see supplementary materials for derivation and discussion on the scaling of the signals) in the following.
The signal can be expressed in terms of a two-time correlation function of the charge density and dipole operator of the valence transition
| (3) |
where is the momentum transfer, is the X-ray probe, is the heterodyne reference pulse, is the pump-pulse, and is the dipole operator given by the integrated current density. Using integrated current densities is equivalent to invoking the electric dipole approximation for the pump interaction. Note that the heterodyne detected intensities are interferences measured relative to the probe beam and thus can become negative, depending on the phase of . Expanding Eq. 3 in electronic eigenstates yields
| (4) |
where the lineshape function which contains the integrated pulse envelopes is given in supplementary materials. This function induces coherences between the ground state and excited states as permitted by pump the bandwidth. The X-ray probe-pulse and the heterodyne reference pulse need to be shifted in energy corresponding (see Fig. 1(b)) to the molecular valence excitation and are required to be phase stable with respect to each other.
The spontaneous coherent signal can be written as a modulus square of an amplitude (see supplementary materials, Eq. 34), making it not sensitive to the phase of the X-ray probe-pulse. The heterodyne detected image contains the same structural information as their spontaneous counterparts but resolve the phase problem since they give itself rather than its modulus square. The stimulated signal intensities are stronger than their spontaneous counterparts.
Monitoring electronic dynamics via transition charge densities
We have calculated the stimulated SFG diffraction signals for 4-oriented amino-4’nitrostilbene (Fig. 2). The TCDs and the integrated transition current densities in Eq. 4 are obtained from ab initio calculation at the CASSCF(4/5)/6-31G* level of theory. We work in the short time (few femtosecond) regime where we can neglect nuclear dynamics and radiation damage Amin17jpcb . The time evolution between the pump and the probe pulse is then determined solely by the electron dynamics.
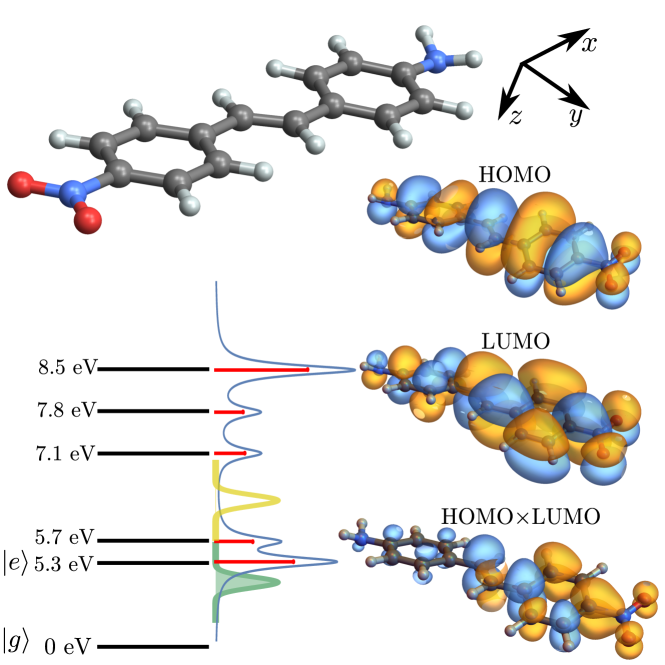
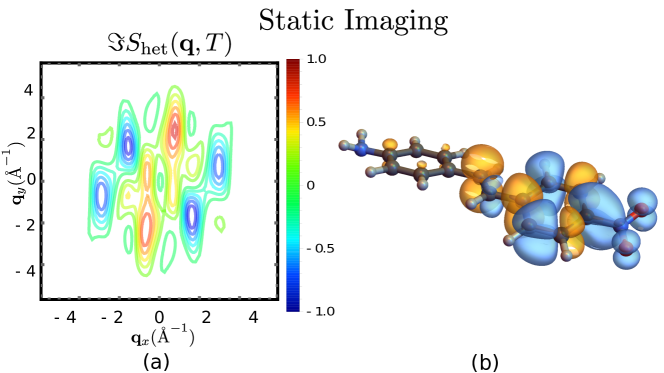
Fig. 3 depicts the static imaging diffraction SFG patterns, Eq.4, in the plane (see Fig. 2 for the scattering geometry). The -polarized pump-pulse (Fourier-transform limited with temporal spread (width) fs and frequency eV) creates a superposition between and a single excited state . A 2 fs off-resonant X-ray probe pulse is used to interrogate the superposition. The heterodyne diffraction pattern in Fig. 3(a) carries the phase information of the TCD. The 3D SFG diffraction pattern can be Fourier transformed back into its real-space representation shown in Fig. 3(b), which corresponds to the TCD. The signal oscillation period corresponds to the difference between the pump and the matter transition frequencies. The shape of the signal, i.e. , closely resembles a product of the HOMO and LUMO as can be seen from comparison with Fig. 2.
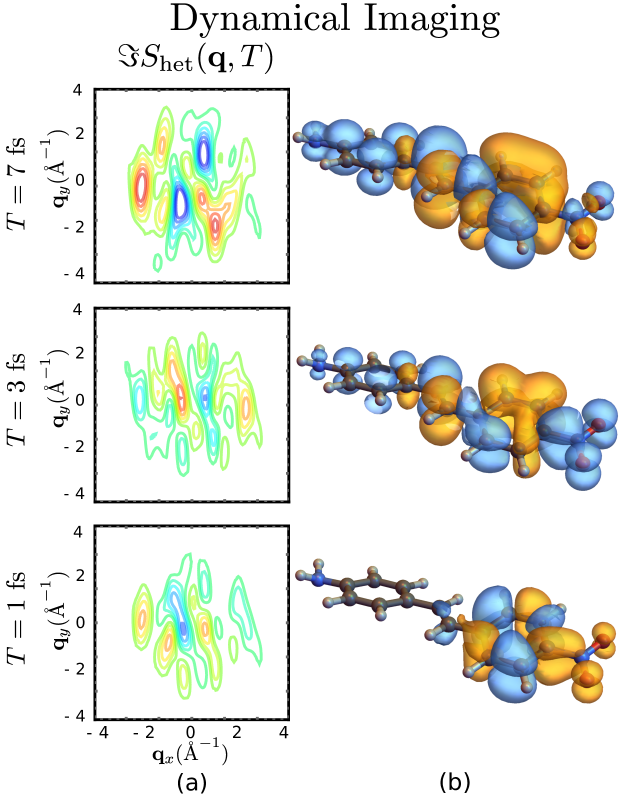
Dynamical imaging follows the evolution of an electronic wavepacket (superposition of excited state). A movie of this evolution is available in supplementary materials.
Few snapshots of this movie are displayed in Fig. 4.
Here, a UV pump-pulse (temporal spread (width) fs and frequency eV)
creates an electron wavepacket composed of three excited states, as displayed in Fig. 2.
The signal is dominated by three transition matrix elements of the charge density operator : has only a minor contribution to the motion, which is mainly localized near the NO2 (acceptor) group and also contains contribution in the NH2 (donor) group.
Initially, we observe a linear superposition of comparable weight between and but as the time evolves, we see a beating between the two. For example, the signal at 5.5 fs is almost uniquely a contribution for while at 7.5 fs, strongly dominates the signal.
The time-resolved diffraction pattern then carries dynamical information through the TCDs between and the set of excited states .
Conclusions
We have demonstrated the capacity of time-resolved SFG diffraction to image the promotion of an electron into an excited state orbit. The signal provides access to an important matter quantity, the TCDs, and its heterodyne detected version can circumvent the phase problem. The SFG diffraction patterns directly reveal the TCD, which can be interpreted as the quantum interference term between the ground and excited state charge densities. When the pump selectively excites a single state, the diffraction pattern directly reveals a single TCD matrix element , which carries information on the excited state orbitals in the corresponding valence excited state. When an electronic wavepacket is prepared by a superposition of several states, the TCD carries both dynamical and structural information. Ground state diffraction, in contrast, only monitors diagonal charge density matrix element . Indirect reconstruction of orbital shapes from high harmonic spectroscopy worner2010following , photoelectrons Villeneuve17sci and time-resolved scanning tunneling microscopy Cocker16nat has been reported. SFG diffraction in contrast gives direct access to the electron density. Such experiments should be feasible in a near future sun2018current : XFEL pulses possess the brilliance and the time duration necessary to detect nonlinear processes and electronic wavepacket evolution. The necessary phase stability may be achieved by seeded FELs bencivenga2016four .
The proposed technique can be extended in various ways. First, scanning the pump/probe delay can be used to monitor molecular dynamical processes. The pump can launch nuclear dynamics and the time-resolved X-ray signal then reveals how the valence excited-to-ground TCD evolves in time, provided the pulse is short enough. The necessary X-ray pulses can be generated by existing XFEL sources Huang14prac . The proposed technique require stable pulses at the edge of experimental capabilities cao2016noncollinear ; glover2012x ; bencivenga2016four ; bencivenga2015four , providing a path for X-ray sources improvement.
Second, the visible pump used in this work can be replaced by an X-ray pulse that creates valence electronic coherences through a stimulated Raman process mukamelSXRS1 . This should offer a much broader excitation bandwidth and higher time resolution. Diffraction experiments are usually performed on ordered samples (crystals, oriented molecules) kupper2014x ; chapman2011femtosecond ; zhou2016x . Using heterodyne detection of the diffraction image puts more constraints on the X-Ray probe pulses but in return delivers the phase of the charge density. Alternative to physically scanning the reference beam, spatial control of the pulse phase could be explored in the future gu2004spatial ; zhu2014arbitrary combinded with phase cycling methods as they are used in non-linear spectroscopy with Yan09cp optical pulses.
Third, in a liquid or gas phase sample, some structural information is lost upon rotational averaging worner2010following ; Villeneuve17sci . However, the present diffraction scheme could still yield valuable information. The visible and the Raman excitations are of different order in the exciting fields. In an isotropic sample, the Raman (odd-order ) signal vanishes while the (even-order ) SFG one does not, making the latter a new probe for time-resolved chirality 1508.02890 . This will require extending the present work to include orientational averaging. Finally, by frequency dispersing the probe and repeating the acquisition for multiple delays , one can record a 3D -- signal, revealing state selective spatial information when the system undergoes a complex electron and nuclear dynamics.
Acknowledgments
The support of the Chemical Sciences, Geosciences, and Biosciences division, Office of Basic Energy Sciences, Office of Science, U.S. Deparment of Energy through Award No. DE-FG02-04ER15571 and of the National Science Foundation (Grant No CHE-1663822) is gratefully acknowledged. K.B. was supported by DOE.
References
- (1) P. Emma, et al., nature photonics 4, 641 (2010).
- (2) Y. Ding, Z. Huang, D. Ratner, P. Bucksbaum, H. Merdji, Phys. Rev. ST Accel. Beams 12, 060703 (2009).
- (3) M. Chini, K. Zhao, Z. Chang, Nature Photonics 8, 178 (2014).
- (4) R. D. Miller, Science 343, 1108 (2014).
- (5) R. J. D. Miller, Annu. Rev. Phys. Chem. 65, 583 (2014).
- (6) P. Baum, A. H. Zewail, Chem. Phys. 366, 2 (2009).
- (7) C. Suryanarayana, M. G. Norton, X-ray diffraction: a practical approach (Springer Science & Business Media, 2013).
- (8) G. Taylor, Acta Crystallographica Section D: Biological Crystallography 59, 1881 (2003).
- (9) K. Bennett, J. D. Biggs, Y. Zhang, K. E. Dorfman, S. Mukamel, The Journal of chemical physics 140, 204311 (2014).
- (10) F. Schotte, et al., Science 300, 1944 (2003).
- (11) J. Glownia, et al., Physical Review Letters 117, 153003 (2016).
- (12) R. D. Miller, et al., Acta Crystallographica Section A: Foundations of Crystallography 66, 137 (2010).
- (13) G. Dixit, O. Vendrell, R. Santra, Proceedings of the National Academy of Sciences 109, 11636 (2012).
- (14) M. J. Vrakking, T. Elsaesser, Nature Photonics 6, 645 (2012).
- (15) A. Salam, Molecular Quantum Electrodynamics : Long-Range Intermolecular Interactions (2009).
- (16) I. V. Stiopkin, H. D. Jayathilake, A. N. Bordenyuk, A. V. Benderskii, J. Am. Chem. Soc. 130, 2271 (2008).
- (17) Y. Shen, Nature 337, 519 (1989).
- (18) J. E. Laaser, W. Xiong, M. T. Zanni, The Journal of Physical Chemistry B 115, 2536 (2011).
- (19) D. S. Bethune, J. R. Lankard, P. P. Sorokin, Opt. Lett. 4, 103 (1979).
- (20) S. Mukamel, Principles of nonlinear optical spectroscopy, no. 6 (Oxford University Press on Demand, 1999).
- (21) O. Roslyak, S. Mukamel, EVU Lecture Notes, Lectures of Virtual University, Max-Born Institute (2010).
- (22) J. Yang, et al., Physical Review Letters 117, 153002 (2016).
- (23) A. V. Martin, et al., Nature Commun. 5, 4661+ (2014).
- (24) M. Tegze, G. Faigel, Nature 380, 49 (1996).
- (25) S. Marchesini, et al., Nature photonics 2, 560 (2008).
- (26) J. C. Spence, R. B. Doak, Physical review letters 92, 198102 (2004).
- (27) A. S. Chatterley, B. Shepperson, H. Stapelfeldt, Physical Review Letters 119, 073202 (2017).
- (28) M. Amin, M. Askerka, V. S. Batista, G. W. Brudvig, M. R. Gunner, J. Phys. Chem. B 121, 9382 (2017).
- (29) H. Wörner, J. Bertrand, D. Kartashov, P. Corkum, D. Villeneuve, Nature 466, 604 (2010).
- (30) D. M. Villeneuve, P. Hockett, M. J. J. Vrakking, H. Niikura, Science 356, 1150 (2107).
- (31) T. L. Cocker, D. Peller, P. Yu, J. Repp, R. Huber, Nature 539, 263 (2016).
- (32) Z. Sun, J. Fan, H. Li, H. Jiang, Applied Sciences 8, 132 (2018).
- (33) F. Bencivenga, et al., Faraday discussions 194, 283 (2016).
- (34) S. Huang, Y. Ding, Z. Huang, J. Qiang, Physical Review Special Topics - Accelerators and Beams 17 (2014).
- (35) W. Cao, E. R. Warrick, A. Fidler, D. M. Neumark, S. R. Leone, Physical Review A 94, 053846 (2016).
- (36) T. Glover, et al., Nature 488, 603 (2012).
- (37) F. Bencivenga, et al., Nature 520, 205 (2015).
- (38) J. D. Biggs, Y. Zhang, D. Healion, S. Mukamel, J. Chem. Phys. 136 (2012).
- (39) J. Küpper, et al., Physical Review Letters 112, 083002 (2014).
- (40) H. N. Chapman, et al., Nature 470, 73 (2011).
- (41) X. E. Zhou, et al., Scientific data 3, 160021 (2016).
- (42) X. Gu, S. Akturk, R. Trebino, Opt. Commun. 242, 599 (2004).
- (43) L. Zhu, J. Wang, Sci. Rep. 4, 7441 (2014).
- (44) S. Yan, H.-S. Tan, Chem. Phys. 360, 110 (2009).
- (45) O. Smirnova, Y. Mairesse, S. Patchkovskii, J. Phys. B At. Mol. Phys. 48, 234005 (2015).