A fallback accretion model for the unusual type II-P supernova iPTF14hls
Abstract
The Intermediate Palomar Transient Factory reported the discovery of an unusual type II-P supernova iPTF14hls. Instead of a 100-day plateau as observed for ordinary type II-P supernovae, the light curve of iPTF14hls has at least five distinct peaks, followed by a steep decline at days since discovery. Until 500 days since discovery, the effective temperature of iPTF14hls is roughly constant at 5000-. In this paper we propose that iPTF14hls is likely powered by intermittent fallback accretion. It is found that the light curve of iPTF14hls can be well fit by the usual accretion law until days post discovery when the light curve transitions to a steep decline. To account for this steep decline, we suggest a power-law density profile for the late accreted material, rather than the constant profile as appropriated for the accretion law. Detailed modeling indicates that the total fallback mass is , with an ejecta mass . We find the third peak of the light curve cannot be well fit by the fallback model, indicating that there could be some extra rapid energy injection. We suggest that this extra energy injection may be a result of a magnetic outburst if the central object is a neutron star. These results indicate that the progenitor of iPTF14hls could be a massive red supergiant.
Subject headings:
stars: massive — supernovae: general — supernovae: individual (iPTF14hls) — X-rays: bursts1. Introduction
Recently, the discovery of an unusual supernova (SN), iPTF14hls, was reported by Arcavi et al. (2017). iPTF14hls, at a redshift of , was first discovered in band on September 22, 2014 UT (Arcavi et al., 2017). Before its discovery, the position of iPTF14hls was not monitored for approximately 100 days. At beginning, astronomers did not pay much attention to iPTF14hls during its decline in brightness. Intense multiband observations were deployed only when iPTF14hls began to rebrighten after about 100 days since its discovery.
Although identified as a type II-P SN according to its spectroscopic features (Li et al., 2015), iPTF14hls is very unique among currently discovered SNe. The light curve of iPTF14hls lasts for more than 1200 days (Sollerman et al., 2018) and has at least five distinct peaks, while an ordinary type II-P SN has a 100-day plateau in brightness. The spectral evolution of iPTF14hls is 10 times slower than typical SNe II-P (Arcavi et al., 2017). The photospheric velocities measured by Fe ii 5169 stay at a constant value of .
Arcavi et al. (2017) discussed several possible theoretical models, e.g., interaction between SN ejecta and circumstellar material (Chevalier, 1982; Chevalier & Fransson, 1994; Chugai & Danziger, 1994; Chatzopoulos et al., 2012; Moriya et al., 2013; Wang et al., 2016b, 2017a), spin-down of a magnetar (Kasen & Bildsten, 2010; Woosley, 2010), fallback accretion onto a black hole (Michel, 1988; Dexter & Kasen, 2013), and suggested that the most likely model may be fallback accretion. However, Dessart (2018) proposed that the magnetar model can fit the light curve, while Soker & Gilkis (2018) explained iPTF14hls as a common-envelope jets SN. Chugai (2018) and Woosley (2018) discussed the models that might explain the light curve and spectral features.
Here we suggest that the multiple peaks in the light curve of iPTF14hls could be powered by intermittent fallback accretion of the SN ejecta. In a successful SN, the material remaining bound could fallback and eventually accrete onto the central object. Accretions onto compact objects (black holes or neutron stars) are usually accompanied by powerful outflows (Mirabel & Rodríguez, 1998; Fender et al., 2004), which can carry away about 10% of the gravitational binding energy of the accreted material. Such powerful outflows can aid the explosion of the SN, and on the other hand, a fraction of this energy would be thermalized to power a bright light curve (Dexter & Kasen, 2013).
2. Fallback accretion
After the explosion of a core-collapse SN, a rebounce outward shock is launched at the base of the central compact core, which further collapses into a neutron star or black hole. This shock imparts a typical kinetic energy of to the still-infalling material and reverses it to move outward. The outward-moving material (ejecta) adjusts itself quickly into a homologous expansion phase, that is, the expansion velocity of a material element is proportional to its distance to the central compact object. Although most of the ejecta becomes unbound to the central compact object, a fraction of the ejecta with mass is bound and finally falls back (Colgate, 1971) and accretes onto the central compact object. Based on some arguments presented in Section 4, hereafter we assume that the remnant of iPTF14hls is a neutron star.
The material accreted at early times comes from the slowly moving inner ejecta. Assuming a power-law density profile of the inner shell of the progenitor star , where is the density of the shell at radius , the fallback accretion rate is (for ; Quataert & Kasen, 2012; Dexter & Kasen, 2013)
| (1) |
This accretion rate is usually rising because typically for inner shells. Here is defined as111Note that this definition of is different from that given in Dexter & Kasen (2013) by an extra factor .
| (2) |
This accretion phase will transition to a long-term accretion phase when the expansion velocity of the bound material is comparable to the escape velocity . In this case the material can reach a maximum radius (Dexter & Kasen, 2013) and then falls back with a free-fall timescale (Michel, 1988)
| (3) |
where is the free-fall collapse time to form from material at rest. Assuming a constant density profile, the accretion rate decays according to (Michel, 1988).
At very late phase, instead of a constant profile, the density may be a steep power law, with , the enclosed mass is effectively constant, and the accretion rate is (Dexter & Kasen, 2013)
| (4) |
where
| (5) |
Because the early rising phase in the light curve of iPTF14hls is missing, we will model the light curve only by the law and at very late phase law with some .
Assuming a spherical accretion, Chevalier (1989) and Houck & Chevalier (1991) studied the structure of the accretion flow that may operate in the famous SN 1987A. To power an SN like iPTF14hls by accretion, the accretion rate (see Section 3) should be high (in the range ) and the gravitational accretion energy is carried away by neutrinos produced near the neutron star (Chevalier, 1989; Houck & Chevalier, 1991). However, this does not mean that the photons in the accretion flow cannot heat the ejecta.
To determine whether the radiation advected with the accretion flow is able to diffuse out, the trapping radius (Katz, 1977; Begelman, 1978; Flammang, 1982; Blondin, 1986)
| (6) |
is defined at which the inwardly advected radiation flux balances the outward diffusion flux. Photons outside this radius can diffuse out and heat the ejecta, while the photons inside this radius are trapped. Because iPTF14hls is hydrogen-rich, here we take the electron Thomson scattering opacity (e.g., Moriya et al., 2011; Chatzopoulos et al., 2012), which is suitable for fully ionized material with solar metallicity.
The inner regions of the accretion flow achieve supersonic free fall (Chevalier, 1989), which, upon reaching the neutron star surface, generates a strong shock moving outward. The energy is mainly stored inside but close to the shock radius. The shock radius is determined by neutrino cooling efficiency. Photons inside act as potential heating source of the SN. Whether the photons inside can diffuse out depends on if the condition is satisfied. Here we simply assume that this condition is satisfied and leave the justification in Section 4.
At the accretion rate mentioned above, the accretion is super-Eddington. During accretion the infalling material is compressed and becomes hot and geometrically thick because of the inability of the advected photons to escape from the accretion flow. As a result, the accretion is accompanied by powerful outflow (Narayan & Yi, 1994; Blandford & Begelman, 1999; Igumenshchev & Abramowicz, 2000; McKinney et al., 2012), as verified by the observation of ultra-relativistic outflow from a neutron star accreting gas from a companion (Fender et al., 2004). Usually the accretion rate is assumed to be a power-law in radius (e.g., Kohri et al., 2005; Dexter & Kasen, 2013), where is the mass accretion rate at the fallback radius , and . It should be stressed that is not the mass accretion rate onto the compact object because a large fraction of the accretion flow is channeled as an outflow. The net accretion rate onto the neutron star is usually only of , namely with . About 10% of the accreted matter is converted as radiation energy. Consequently, the accretion energy rate is with (Dexter & Kasen, 2013).
Because of the existence of powerful outflows, the accretion cannot be strictly spherical. The aspherical accretion may be induced by the spiral modes of the standing accretion shock instability (SASI; Burrows et al., 1995; Janka & Müller, 1996; Blondin et al., 2003; Marek & Janka, 2009; Fernández, 2010) or the convection in the pre-collapse envelope (Gilkis & Soker, 2014). Recently, the jet-feedback mechanism (Gilkis et al., 2016) based on SASI is suggested to carry out the accretion energy. In this scenario the energy may be carried out by jets accreted near the equatorial plane, as indicated by observations (Fender et al., 2004).
The fallback mass is a function of the compactness of the progenitor stars and explosion energy (Chevalier, 1989; Zhang et al., 2008). For loose progenitors with typical explosion energies , like red supergiants (RSGs), the fallback mass is usually small, . However, for more compact progenitors, e.g., blue supergiants, the H/He interface triggers the formation of a strong reverse shock, which decelerates the ejecta and enhances the fallback mass significantly. For weak explosions, most of the mass may fall back (Moriya et al., 2010). The metallicity of the progenitor stars influences the mass loss history before explosion and therefore is another factor that impacts the fallback mass. As a result, fallback accretion influences the final mass of the central compact objects. For population III (zero metallicity) stars above and explosion energies less than , the central compact objects are more likely black holes (Zhang et al., 2008) because of large amount of fallback. For population I (solar metallicity) stars, black hole production is much less frequent because of large scale mass loss before explosion.
3. The model and fitting results
The accretion outflows not only heat the SN ejecta, but also accelerate the ejecta. We use the method outlined in Wang et al. (2016a) to calculate the light curve and the evolution of the photospheric velocities. In this model the photospheric radius is at the position outside of which the optical depth is equal to (Wang et al., 2016a). The acceleration of the ejecta by the energy injection has been taken into account by this model, which assumes a homologous expansion of the SN ejecta, with a homogeneous density distribution. The energy injection from the energy sources, which may be a spinning-down magnetar, 56Ni cascade decay, or fallback accretion, will be trapped by the ejecta. The trapped energy undergoes adiabatic expansion, which accelerates the ejecta according to the following equation (Wang et al., 2016a)
| (7) |
where is the power trapped by the ejecta, is the SN luminosity, and is the kinetic energy of the SN. The expansion velocity (which is approximately equal to the observed photospheric velocity for massive ejecta at early epoch) is calculated according to (Arnett, 1982), where is the ejecta mass. A part of the trapped energy diffuses out of the ejecta, resulting in the multiband optical emission of the SN.
To account for the multiple peaks in the light curve of iPTF14hls, we propose that the accretion is episodic. Such episodes are not rare in astrophysics. For example, episodic accretion may be caused by instabilities of disks around protostars (Sakurai et al., 2016; Küffmeier et al., 2018), or by knotty jets in young protostellar disks (Vorobyov et al., 2018).
For fallback accretion, the energy input is
| (8) |
where takes the expression
| (9) |
during the constant density accretion phase and
| (10) |
for the final power-law density accretion. Here is the mass fallback rate at time when the th fallback episode begins. To calculate the light curve of an SN powered by fallback accretion, the energy input given by Equation takes the place of the magnetar spinning-down power in the case of a magnetar-powered SN. In both the magnetar-powered case and the accretion-powered case, the energy is assumed to be deposited at the center of the SN ejecta. The photospheric emission is a result of photon diffusion.
In this work we use the bolometric luminosity data of iPTF14hls provided by Sollerman et al. (2018) who extended the observation to more than 1200 days since discovery. We neglect the possible contribution of 56Ni and 56Co to the light curve of iPTF14hls. The SN explosion would have surely synthesized some amount of 56Ni. However, because of the finite lifetimes of 56Ni () and 56Co (), such contribution is only limited to the first since explosion, which were largely missed by the observation.
The fitting results (solid lines), including the light curve and photospheric velocity evolution, are shown in Figure 1, with the 19 fitting parameters listed in Table 1. It can be found that the fallback rates listed in Table 1 are similar to that given by Moriya et al. (2018), who interpret OGLE-2014-SN-073 as a fallback accretion powered type II supernova. To give a decent fit to the light curve, eight episodes are needed. In Figure 1 we mark as vertical blue ticks. It is found that the first seven accretion episodes can be fit by the law, whereas the last episode ( and ) can only be fit by a steep decay with a density power-law index . With this , the late-time light curve decay index is , slightly steeper than that measured by Sollerman et al. (2018), who gave a decay index .
| 21 | 4200 | 4.9 | 20 | 0.75 | 186 | 0.43 | 321 | 0.5 | 380 | 0.4 | 494 | 0.24 | 550 | 0.065 | 832 | 0.043 | 1078 |
Notes. and are in units of and , respectively. The accretion rates at fallback radius are in units of , while are in units of since SN explosion. In this fit we fixed . Because of the lack of observational data between the third and fourth peaks, cannot be accurately constrained, so is because of the missing of observational data around the first peak. The first seven accretion episodes can be fit by the law, whereas the last episode ( and ) can only be fit by a steep decay with a density power-law index .
The explosion date is before the first observational data point. In Table 1 is the initial expansion velocity of the surface of the ejecta. Assuming homologous expansion of the ejecta, the initial explosion energy of this SN is . This energy can be attributed to neutrino-driven mechanism, which may drive an explosion up to energy (Janka et al., 2016; Bollig et al., 2017).
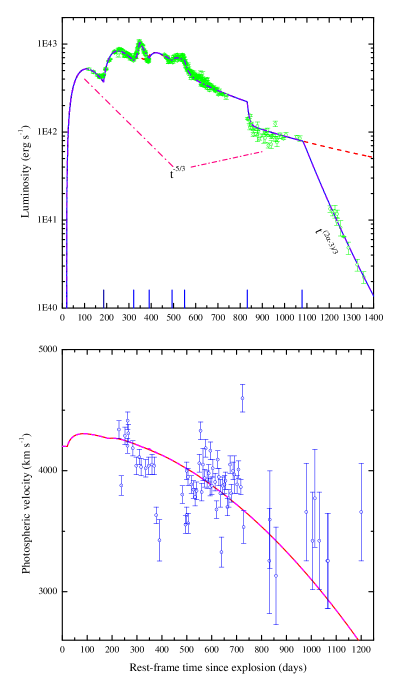
Figure 1 shows that the fallback accretion model gives a reasonably good fit to both the light curve and velocity evolution of iPTF14hls. However, the third peak in the light curve cannot be fitted. Such a steep peak require a very rapid energy release rate. This may suggest some activity in the central compact object. At such late times () since explosion, the energy may be released by a magnetic outburst (Gavriil et al., 2002; Rea et al., 2009, 2012) if the central object is a neutron star. Indeed, stellar evolution model predicts that a single star with initial masses between and will explode as an SN II-P, leaving behind a neutron star remnant (Heger et al., 2003).
To quantify the outburst power, we assume a power-law injection
| (11) |
followed by a rapid shutoff of the outburst
| (12) |
Here and are the times at which the outburst begins and ends, respectively; and are the durations for the rise and fall of the outburst, respectively. Obviously, . We set in Equation during the fitting. This power exponent does not result from the fitting constraints but was appropriately selected. To give a good fit to the light curve, we found . The 5 fitting parameters for the outburst are listed in Table 2, with the resulting light curve depicted in Figure 1 as dashed lines. Here we choose another set of values for and (see Section 4 for some discussion). It can be seen that the model including a magnetic outburst can fit the light curve very closely.
From Table 2 we see that the outburst lasted for , and released in total. This is in accordance with observations, which show that some X-ray pulsars may experience sporadic giant X-ray outbursts lasting weeks to years followed by a long-term quiescence (Gavriil et al., 2002; Kaspi et al., 2003; Rea et al., 2012; Cusumano et al., 2016).
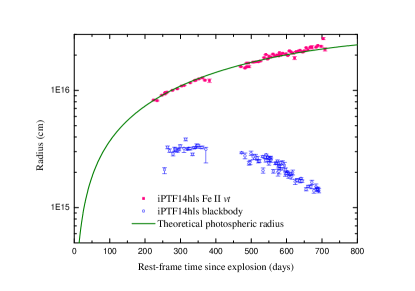
One intriguing feature of iPTF14hls is that the radius derived by the Fe ii expansion velocity times the elapsed rest-frame time is not equal to the radius determined by blackbody fits (see Figure 2). Spectrum measurements of Fe ii indicate that iron expands at roughly a constant velocity , from which the so-called line-forming radius can be derived (pink points in Figure 2). This radius is, however, much larger than the blackbody-determined radius (blue circles in Figure 2). As can be seen from Figure 2, the photospheric radius predicted by this model closely follows the line-forming radius. We discuss this feature in Section 4.
4. Discussion and conclusions
To date, many SNe were found to be double-peaked (Arnett et al., 1989; Richmond et al., 1994; Mazzali et al., 2008; Nicholl et al., 2015; Nicholl & Smartt, 2016), in which case the first short-lived peak has been attributed to shock cooling (Piro, 2015; Vreeswijk et al., 2017; Wang et al., 2017c), although sometimes the cooling peak could merge with the second main peak (Wang et al., 2017a). The first peak in the light curve of iPTF14hls is unlikely the result of shock cooling because that would require a very massive and extended envelope.
Because of the lack of observational data between the third and fourth peaks of the light curve, and also the missing of observational data around the first peak, and in Table 1 cannot be accurately constrained. As a demonstration of this uncertainty, in Figure 1 we choose different for the solid and dashed curves. However, as can be seen from Figure 1, an earlier , as depicted by the dashed curve, is preferred because of the light-curve decline rate between and . For the dashed line (the curve including the energy injection of a magnetic outburst), we choose and .
The most likely progenitor of iPTF14hls is a red supergiant since observations have demonstrated that the progenitors of several type II-P SNe are RSGs (e.g., Smartt 2009; Davies 2017; Van Dyk 2017; Huang et al. 2018). This is consistent with the fact that the total fallback mass is about , as expected for a RSG progenitor (Chevalier, 1989; Dexter & Kasen, 2013). The ejecta mass, , is also consistent with a RSG (Davies & Beasor, 2018), though at the high end of the distribution of the SNe II-P ejecta masses.
The remnant of a RSG explosion is believed to be a neutron star. This is consistent with the study of remnant mass distribution of massive star explosions (Zhang et al., 2008). iPTF14hls occurred on the outskirts of a low-mass star-forming galaxy, indicating low metallicity (Arcavi et al., 2017). For population III star explosions with progenitor mass larger than and explosion energies less than , black holes are more frequent outcome. The progenitor mass of iPTF14hls, (the sum of and remnant mass, which is assumed to be ), combined with its explosion energy , indicates that the remnant of iPTF14hls is more likely a neutron star. On the other hand, despite the possible low metallicity of iPTF14hls, Arcavi et al. (2017) estimated a metallicity of , which is more compatible with a population I star explosion. In this case the production of a black hole remnant is highly suppressed (Zhang et al., 2008).
The production of a neutron star remnant is also partially supported by the need to fit the third peak of the light curve by a magnetic outburst. Inspection of Table 1 shows that the mass fallback rates decrease monotonically, as expected. However, is much larger than . This is in sharp contrast to the mass fallback rates that follow. could be reduced if there is some contribution from the energy injection of the neutron star. We have neglected the contribution of 56Ni and 56Co because their contribution is short-lived, but the contribution of a neutron star (or magnetar) could be long-lived (Kasen & Bildsten, 2010; Woosley, 2010; Inserra et al., 2013; Nicholl et al., 2014; Metzger et al., 2015; Wang et al., 2015, 2017b; Dai et al., 2016; Liu et al., 2017).
To examine the properties (dipole magnetic field , and initial spin period ) of the neutron star, we set (somewhat arbitrarily) and found , . With these parameters, the first peak can be closely fitted while the remaining peaks are affected negligibly by the contribution of the magnetar. We will not show the fitting results by this model because the resulting light curve closely follows the curves presented in Figure 1. It is found that cannot be too large, say , because in that case the magnetar would contribute too much at late times so that the late-time light curve deviates from the law. We note that the above constraints on and should not be taken seriously because they are degenerated with .
As we said, the third peak cannot be explained by fallback accretion, and magnetic activity is therefore proposed as its energy source. For the fallback rate at the third peak, , the corresponding accretion rate indicates a trapping radius . For the energy in the magnetic activity to diffuse out, the dissipation radius of the magnetic energy should be larger than , namely . To estimate , let us first assume a spherical accretion. The balance of stellar wind pressure with the ram pressure of the infalling material gives a radius
| (13) |
where the typical value of pulsar luminosity at the time of the third peak, the neutron star mass , accretion rate have been substituted. This balance is unstable. During the accretion phase, mater falls within . During the magnetic outburst phase, the central neutron star inflates a bubble, known as pulsar wind nebula (PWN), whose radius is much larger than , which is also larger than . As a result, the magnetic energy stored within the PWN can diffuse out of the accretion flow.
During the normal accretion phase the balance between the magnetic pressure and the accretion ram pressure cannot be maintained and the material falls well within . The magnetic outburst is usually triggered by some instability of the PWN. The energy released by the spinning-down pulsar does not lose immediately as radiation. It is estimated that about half of the energy lost by Crab () is still resident within the synchrotron nebula (Hester, 2008). This energy is very close to the energy assumed here to power the third peak of iPTF14hls. The magnetic activity may interplay with and even quench the accretion. If the accretion is quenched by the magnetic activity, then the third peak is purely powered by the magnetic activity. This argument also applies to the first peak where a magnetar spin-down was proposed to contribute most part of the SN luminosity.
For a rapidly spinning magnetar, outside of the light cylinder, , the magnetic field lines of the magnetar cannot corotate with the magnetar (Shapiro & Teukolsky, 1983), and therefore the field lines in the PWN wind tightly to form a spindle nebula (see Figure 3 of Hester, 2008), whose toroidal field is amplified significantly and much stronger than its poloidal field. The lower bound of given by Equation yields an upper limit of the strength of the magnetic field within the PWN, , where is the lower limit of the volume of the PWN, and is the magnetic outburst energy.
The total magnetic outburst energy, , should be accumulated during the first before the third peak. This requires an average energy injection rate during this period.222The true energy injection rate should be somewhat higher because a part of the injected energy will leak out of the PWN. We found that with the magnetar parameters (, ) listed above to explain the first peak of iPTF14hls, it is just right to give such an average energy injection rate. At day since explosion, the magnetar’s energy injection rate declines to , which is lower than but comparable to the observed luminosity of iPTF14hls. After since explosion, the magnetar’s energy injection rate dominates over the accretion energy injection rate. Therefore the suggestion of magnetic outburst scenario for the third peak can be falsified if future observation does not reveal a flattening of the luminosity of iPTF14hls after .
As mentioned in Section 3, the initial explosion energy () of this SN can be attributed to neutrino heating. However, for an SN that is powered by fallback accretion, the explosion energy may also be partially provided by accretion, especially the recently proposed jet-feedback mechanism (Gilkis et al., 2016; Soker, 2016, 2017).
We mentioned in Section 1 that for spherical accretion, the photons behind the accretion shock can diffuse out and heat the ejecta if the condition is fulfilled. Assuming a power-law neutrino cooling function, the shock position takes the approximate form (Houck & Chevalier, 1991)
| (14) |
With the peak accretion rate , the above equation gives , which is at its face value smaller than the trapping radius . However, the above estimate of should be treated as a lower limit because of the uncertainties in neutrino cooling function and relativistic corrections (Houck & Chevalier, 1991). It is actually found that the condition is satisfied when (Houck & Chevalier, 1991), which is the case for the accretion episodes listed in Table 1, except for the first accretion episode because for the fallback rate (see Table 1), the accretion rate is . For the scenario proposed in this paper to be valid, a magnetar energy input is necessary for the first accretion episode. This also strengthens the hypothesis of the formation of a magnetar in this SN explosion.
With the condition , the shock radius is about four orders of magnitude larger than the Schwarzschild radius and it seems unlikely to convert 10% of the gravitational binding energy of the accreted material into radiation energy. However, the exact accretion process is that the accretion flow reaches at the neutron star surface, where shock is formed and energy is advected along with the outmoving shock and carried far away from the neutron star surface. The shock eventually stops at because of efficient neutrino cooling. During this process, a significant fraction (approximately 10%) of the gravitational binding energy is converted into shock energy. Note that the fallback energy conversion factor consists of two factors: the ratio of accretion rate to the fallback rate () and the conversion efficiency (10%) of the gravitational binding energy.
To account for the late steep decline of the light curve, we suggest that accreted material has a power-law density profile with at late time. If we adopt the light curve decay index , as measured by Sollerman et al. (2018), we found . This density profile is very steep and may be formed by the interaction between the bound and unbound material. Future numerical simulations are encouraged to test this hypothesis.
We propose that the third, brightest peak is mainly powered by a magnetic outburst. Such outburst is usually accompanied by X-ray emission, which is however not detected (Arcavi et al., 2017). The nondetection of X-ray emission can be understood by considering the optical depth of the ejecta in the X-ray band
| (15) | |||||
where the values of X-ray opacity , SN expansion velocity , and the time since explosion have been substituted. Here is slightly larger than the initial expansion velocity because of the energy injection. We see that at the time the third peak was observed, the ejecta are still opaque to X-rays. In the above estimate, is taken to be the same as , that is, the electron Thomson scattering opacity. This should be a lower limit to the true X-ray opacity because other heavier elements could make a significant contribution to .
Despite the nondetection of X-ray emission, the detection of -ray emission, temporally and positionally consistent with iPTF14hls, in the energy band between 0.2 and was report by Yuan et al. (2018). The -ray source appears after the first optical detection of iPTF14hls and is still detectable up to . Translated to the time since SN explosion in our model, the -ray source appears to . According to Equation , assuming a lower limit to -ray opacity ,333At late stage, the -ray photons come from 56Co decay with typical energy . At this energy, the atomic scattering opacity (Kotera et al., 2013) of a type II SN is approximately equal to the electron Thomson scattering opacity. the SN ejecta are still opaque to -ray emission at time . Therefore, in our model the -ray emission cannot come from the deep interior of the SN ejecta.
This -ray emission may alternatively result from the interaction between the ejecta and circumstellar medium (CSM) or produced by a blazar because there is a blazar candidate within the error circle of the -ray source (Yuan et al., 2018). Late-time observation of iPTF14hls revealed narrow H emission (Andrews & Smith, 2018), which may be evidence for circumstellar interaction where unshocked circumstellar material is ionized by the shock emission and recombines. However, such evidence for interaction only appears at 3 years after the first optical detection of iPTF14hls. The interaction origin of the -ray emission is also in tension with the aforementioned nondetection of X-ray and radio emission. Sollerman et al. (2018) argue that the narrow H emission may come from H II region which is located just at the SN position. Because the -ray association with iPTF14hls is only tentative, we consider it more likely that the -ray emission is produced by the blazar.
Observations indicate that the photospheric radius of iPTF14hls is quite different from the line-forming region. Arcavi et al. (2017) estimate the latter at position of , where is the SN expansion velocity. Although the photospheric radius of an SN recedes as the SN expands and inner material is observed, the large ejecta mass, as inferred from light curve modeling, implies that the photospheric recession should be negligible during the first two years since its discovery. The discrepancy of these two radii might be linked to the existence of persistent Balmer series P Cygni lines observed in the spectra of iPTF14hls (Arcavi et al., 2017). The presence of P-Cygni profiles betrays the existence of a stellar wind, as observed in Wolf-Rayet stars (Willis, 1982) and luminous blue variables (Israelian & de Groot, 1999). We suggest that this wind is far above the photosphere and is responsible for the spectral lines.
The rarity of iPTF14hls among SNe II-P may be understood because of its extreme ejecta mass. This large ejecta mass may also account for the reason why so much mass falls back so as to give a multi-peaked light curve.
In summary, iPTF14hls can be explained by the episodic fallback accretion model.444Alternatively, the CSM interaction is also a plausible model. Liu et al. (2018) propose a multiple ejecta-CSM interaction model and employed it to model multi-peak SNe iPTF15esb and iPTF13dcc. The fitting parameters suggest a RSG as the progenitor. Although the central object cannot be identified, the rapid third peak and other considerations might indicate the formation of a neutron star that experienced a magnetic outburst lasting for with a total burst energy .
References
- Andrews & Smith (2018) Andrews, J. E., & Smith, N. 2018, MNRAS, 477, 74
- Arcavi et al. (2017) Arcavi, I., Howell1, D. A., Kasen, D., et al. 2017, Natur, 551, 210
- Arnett (1982) Arnett, W. D. 1982, ApJ, 253, 785
- Arnett et al. (1989) Arnett, W. D., Bahcall, J. N., Kirshner, R. P., & Woosley, S. E. 1989, ARA&A, 27, 629
- Begelman (1978) Begelman, M. C. 1978, MNRAS, 184, 53
- Blandford & Begelman (1999) Blandford, R. D., & Begelman, M. C. 1999, MNRAS, 303, L1
- Blondin (1986) Blondin, J. M. 1986, ApJ, 308, 755
- Blondin et al. (2003) Blondin, J. M., Mezzacappa, A., & DeMarino, C. 2003, ApJ, 584, 971
- Bollig et al. (2017) Bollig, R., Janka, H.-T., Lohs, A., et al. 2017, PhRvL, 119, 242702
- Burrows et al. (1995) Burrows, A., Hayes, J., & Fryxell, B. A. 1995, ApJ, 450, 830
- Chatzopoulos et al. (2012) Chatzopoulos, E., Wheeler, J. C., & Vinko, J. 2012, ApJ, 746, 121
- Chevalier (1982) Chevalier, R. A. 1982, ApJ, 258, 790
- Chevalier (1989) Chevalier, R. A. 1989, ApJ, 346, 847
- Chevalier & Fransson (1994) Chevalier, R. A., & Fransson, C. 1994, ApJ, 420, 268
- Chugai (2018) Chugai, N. N. 2018, AstL, 44, 370
- Chugai & Danziger (1994) Chugai, N. N., & Danziger, I. J. 1994, MNRAS, 268, 173
- Colgate (1971) Colgate, S. A. 1971, ApJ, 163, 221
- Cusumano et al. (2016) Cusumano, G., La Parola, V., D’Aì, A., et al. 2016, MNRAS, 460, L99
- Dai et al. (2016) Dai, Z. G., Wang, S. Q., Wang, J. S., Wang, L. J., Yu, Y. W. 2016, ApJ, 817, 132
- Davies (2017) Davies, B. 2017, RSPTA, 375, 20160270
- Davies & Beasor (2018) Davies, B., & Beasor, E. R. 2018, MNRAS, 474, 2116
- Dessart (2018) Dessart, L. 2018, A&A, 610, L10
- Dexter & Kasen (2013) Dexter, J., & Kasen, D. 2013, ApJ, 772, 30
- Fender et al. (2004) Fender, R., Wu, K., Johnston, H., et al. 2004, Natur, 427, 222
- Fernández (2010) Fernández, R. 2010, ApJ, 725, 1563
- Flammang (1982) Flammang, R. A. 1982, MNRAS, 199, 833
- Gavriil et al. (2002) Gavriil, F. P., Kaspi, V. M., & Woods, P. M. 2002, Natur, 419, 142
- Gilkis & Soker (2014) Gilkis, A., & Soker, N. 2014, MNRAS, 439, 4011
- Gilkis et al. (2016) Gilkis, A., Soker, N., & Papish, O. 2016, ApJ, 826, 178
- Heger et al. (2003) Heger, A., Fryer, C. L., Woosley, S. E., et al. 2003, ApJ, 591, 288
- Hester (2008) Hester, J. J. 2008, ARA&A, 46, 127
- Houck & Chevalier (1991) Houck, J. C., & Chevalier, R. A. 1991, ApJ, 376, 234
- Huang et al. (2018) Huang, F., Wang, X.-F., Hosseinzadeh, G., et al. 2018, MNRAS, 475, 3959
- Igumenshchev & Abramowicz (2000) Igumenshchev, I. V., & Abramowicz, M. A. 2000, ApJS, 130, 463
- Inserra et al. (2013) Inserra, C., Smartt, S. J., Jerkstrand, A., et al. 2013, ApJ, 770, 128
- Israelian & de Groot (1999) Israelian, G., & de Groot, M. 1999, SSRv, 90, 493
- Janka et al. (2016) Janka, H.-T., Melson, T., & Summa, A. 2016, ARNPS, 66, 341
- Janka & Müller (1996) Janka, H.-T., & Müller, E. 1996, A&A, 306, 167
- Kasen & Bildsten (2010) Kasen, D., & Bildsten, L. 2010, ApJ, 717, 245
- Kaspi et al. (2003) Kaspi, V. M., Gavriil, F. P., Woods, P. M., et al. 2003, ApJL, 588, L93
- Katz (1977) Katz, J. I. 1977, ApJ, 215, 265
- Kohri et al. (2005) Kohri, K., Narayan, R., & Piran, T. 2005, ApJ, 629, 341
- Kotera et al. (2013) Kotera, K., Phinney, E. S., & Olinto, A. V. 2013, MNRAS, 432, 3228
- Küffmeier et al. (2018) Küffmeier, M., Frimann, S., Jensen, S. S., & Haugbølle, T. 2018, MNRAS, 475, 2642
- Li et al. (2015) Li, W. X., Wang, X. F., & Zhang, T. M. 2015, ATel, 6898
- Liu et al. (2018) Liu, L. D., Wang, L. J., Wang, S. Q., Dai, Z. G. 2018, ApJ, 856, 59
- Liu et al. (2017) Liu, L. D., Wang, S. Q., Wang, L. J., et al. 2017, ApJ, 842, 26
- Marek & Janka (2009) Marek, A., & Janka, H.-T. 2009, ApJ, 694, 664
- Mazzali et al. (2008) Mazzali, P. A., Valenti, S., Della Valle, M., et al. 2008, Sci, 321, 1185
- McKinney et al. (2012) McKinney, J. C., Tchekhovskoy, A., & Blandford, R. D. 2012, MNRAS, 423, 3083
- Metzger et al. (2015) Metzger, B. D., Margalit, B., Kasen, D., Quataert, E. 2015, MNRAS, 454, 3311
- Michel (1988) Michel, F. C. 1988, Natur, 333, 644
- Mirabel & Rodríguez (1998) Mirabel, I. F., & Rodríguez, L. F. 1998, Natur, 392, 673
- Moriya et al. (2013) Moriya, T. J., Maeda, K., Taddia, F., et al. 2013, MNRAS, 435, 1520
- Moriya et al. (2018) Moriya, T. J., Terreran, G., & Blinnikov, S. I. 2018, MNRAS, 475, L11
- Moriya et al. (2011) Moriya, T., Tominaga, N., Blinnikov, S. I., Baklanov, P. V., & Sorokina, E. I. 2011, MNRAS, 415, 199
- Moriya et al. (2010) Moriya, T., Tominaga, N., Tanaka, M., et al. 2010, ApJ, 719, 1445
- Narayan & Yi (1994) Narayan, R., & Yi, I. 1994, ApJL, 428, L13
- Nicholl & Smartt (2016) Nicholl, M., & Smartt, S. J. 2016, MNRAS, 457, L79
- Nicholl et al. (2014) Nicholl, M., Smartt, S. J., Jerkstrand, A., et al. 2014, MNRAS, 444, 2096
- Nicholl et al. (2015) Nicholl, M., Smartt, S. J., Jerkstrand, A., et al. 2015, ApJL, 807, L18
- Piro (2015) Piro, A. L. 2015, ApJL, 808, L51
- Quataert & Kasen (2012) Quataert, E., & Kasen, D. 2012, MNRAS, 419, L1
- Rea et al. (2012) Rea, N., Israel, G. L., Esposito, P., et al. 2012, ApJ, 754, 27
- Rea et al. (2009) Rea, N., Israel, G. L., Turolla, R., et al. 2009, MNRAS, 396, 2419
- Richmond et al. (1994) Richmond, M. W., Treffers, R. R., Filippenko, A. V., et al. 1994, AJ, 107, 1022
- Sakurai et al. (2016) Sakurai, Y., Vorobyov, E. I., Hosokawa, T., et al. 2016, MNRAS, 459, 1137
- Shapiro & Teukolsky (1983) Shapiro, S. L., & Teukolsky, S. A. 1983, Black Holes, White Dwarfs, and Neutron Stars: The Physics of Compact Objects (New York: Wiley)
- Smartt (2009) Smartt, S. J. 2009, ARA&A, 47, 63
- Soker (2016) Soker, N. 2016, NewAR, 75, 1
- Soker (2017) Soker, N. 2017, RAA, 17, 113
- Soker & Gilkis (2018) Soker, N., & Gilkis, A. 2018, MNRAS, 475, 1198
- Sollerman et al. (2018) Sollerman, J., Taddia, F., Arcavi, I., et al. 2018, arXiv:1806.10001
- Van Dyk (2017) Van Dyk, S. D. 2017, RSPTA, 375, 20160277
- Vorobyov et al. (2018) Vorobyov, E., Elbakyan, V., Plunkett, A., et al. 2018, A&A, 613, A18
- Vreeswijk et al. (2017) Vreeswijk, P. M., Leloudas, G., Gal-Yam, A., et al. 2017, ApJ, 835, 58
- Wang et al. (2016a) Wang, L. J., Wang, S. Q., Dai, Z. G., et al. 2016a, ApJ, 821, 22
- Wang et al. (2017a) Wang, L. J., Wang, X. F., Cano, Z., et al. 2017a, ApJ, submitted (arXiv:1712.07359)
- Wang et al. (2017b) Wang, L. J., Yu, H., Liu, L. D., et al. 2017b, ApJ, 837, 128
- Wang et al. (2017c) Wang, S. Q., Cano, Z., Wang, L. J., et al. 2017c, ApJ, 850, 148
- Wang et al. (2016b) Wang, S. Q., Liu, L. D., Dai, Z. G., Wang, L. J., & Wu, X. F. 2016b, ApJ, 828, 87
- Wang et al. (2015) Wang, S. Q., Wang, L. J., Dai, Z. G., & Wu, X. F. 2015, ApJ, 799, 107
- Willis (1982) Willis, A. J. 1982, MNRAS, 198, 897
- Woosley (2010) Woosley, S. E. 2010, ApJL, 719, L204
- Woosley (2018) Woosley, S. E. 2018, ApJ, 863, 105
- Yuan et al. (2018) Yuan, Q., Liao, N. H., Xin, Y. L., et al. 2018, ApJL, 854, L18
- Zhang et al. (2008) Zhang, W., Woosley, S. E., & Heger, A. 2008, ApJ, 679, 639