Correlation between Superconductivity and Magnetic Fluctuations in FeSe1-xSx Revealed by 77Se NMR
Abstract
We present 77Se-NMR measurements on FeSe1-xSx samples with sulfur content and . Twinned nematic domains are observed in the NMR spectrum for all samples except . The NMR spin-lattice relaxation rate shows that magnetic fluctuations are initially enhanced between and , but are strongly suppressed for higher values. The observed behavior of the magnetic fluctuations parallels the superconducting transition temperature in these materials, providing strong evidence for the primary importance of magnetic fluctuations for superconductivity, despite the presence of nematic quantum criticality in this system.
Critical fluctuations of an ordered phase found in the proximity to unconventional superconductivity have frequently been discussed as a source of superconducting pairing Scalapino2012 ; Curro2005 ; Hattori2012 ; Bertel2016 . In the iron-based superconductors Canfield2010 ; Johnston2010 , superconductivity (SC) is found in the vicinity of two types of long-range order: the stripe-type antiferromagnetic (AFM) order and the nematic order, which breaks in the in-plane rotational symmetry while preserving time reversal symmetry. While dynamical AFM fluctuations are well known to support SC, experimental and theoretical studies have suggested that nematic fluctuations may also be important for high- SC Kuo2016 ; Lederer2015 ; Lederer2017 .
In this context, FeSe has emerged as a key material since it undergoes a nematic phase transition from a tetragonal to an orthorhombic structure at K and develops superconductivity below K, but does not display static magnetic ordering Hsu2008 ; McQueen2009 ; Bohmer2018 . This suggests an opportunity to study the behavior of near a nematic quantum critical point (QCP) isolated from a magnetic QCP. The nematic phase can be suppressed by pressure application, with reaching 32 K at GPa. However, an AFM ordered state emerges above GPa Terashima2015 ; Bendele2010 and merges with the nematic state above GPa Kothapalli2016 . Non-monotonic behavior of is seen near the onset of the magnetic order Kaluarachchi2016 , but overall is strongly enhanced up to 37 K at GPa Mizuguchi2008 ; Margadonna2009 ; Medvedev2009 . While early nuclear magnetic resonance (NMR) measurements connected the enhancement of to enhanced spin fluctuations under pressure Imai2009 , the recently revealed complexity of the phase diagram raises new questions. Notably, the role of nematic fluctuations in the superconductivity remains unclear.
The nematic phase can also be suppressed by S substitution in FeSe1-xSx at ambient pressure, with the nematic phase disappearing around . Importantly, no long-range magnetic order can be observed at ambient pressure, which implies an isolated nematic QCP Hosoi2016 . initially increases slightly to K at Abdel2015 from K at , but then decreases, reaching K by . The application of pressure induces magnetic order in S substituted samples Xiang2017 ; Matsuura2017 .
Recent results have highlighted the rich interplay between magnetic, nematic and superconducting orders in the FeSe1-xSx system. Elastoresistivity measurements found that nematic fluctuations are divergently enhanced near the nematic QCP near Hosoi2016 . The full three-dimensional -- dependent phase diagram revealed strongly enhanced in regions lacking both nematic and AFM long-range orders Matsuura2017 . Furthermore, several studies have suggested that does not appear to correlate with nematicity in FeSe1-xSx Hosoi2016 ; Matsuura2017 ; Watson2015 ; Coldea2016 . On the other hand, no direct measurements of the concentration dependence of magnetic fluctuations have been reported yet.
Since magnetic fluctuations are considered to be one of the key ingredients for the appearance of SC in iron pnictides, it is crucial to reveal how magnetic fluctuations vary with S substitution in FeSe1-xSx. NMR is an ideal tool for the microscopic study of low-energy magnetic fluctuations in correlated electron systems. Here, we carried out 77Se NMR measurements to investigate static and dynamic magnetic properties of FeSe1-xSx. Our NMR data clearly show that stripe-type AFM fluctuations are initially slightly enhanced by S doping up to from = 0 but are strongly suppressed thereafter, particularly beyond the nematic dome above . This behavior shows a strong correlation with , providing clear evidence for the primary importance of AFM fluctuations over critical nematic fluctuations for SC in the FeSe1-xSx system.
77Se NMR measurements have been carried out under a fixed magnetic external field of T applied either along the axis or in the plane ([110] tetragonal direction). The crystals were grown using chemical vapor transport as outlined in Ref. Bohmer2016 ; SM . The four different S-content crystals used in this study are ( = 90 K, = 8.5 K), ( = 68 K, = 10 K), ( = 45 K, = 8 K), and ( = 5 K). Further experimental details are described in the Supplemental Material (SM) SM .
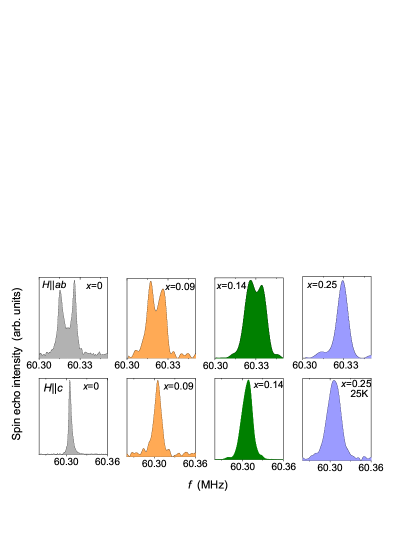
In pure FeSe, the single peak observed in the NMR spectrum at high splits into two peaks below due to nematic order, where the two peaks arise from the presence of twinned nematic domains Baek2015 ; Bohmer2015 ; Wiecki2017 . Representative NMR spectra at K for both field directions are shown in Fig. 1. Splittings of the spectra below are also observed in FeSe1-xSx except for where only a single peak is observed down to the lowest temperature, consistent with the lack of nematic order seen by resistivity SM .
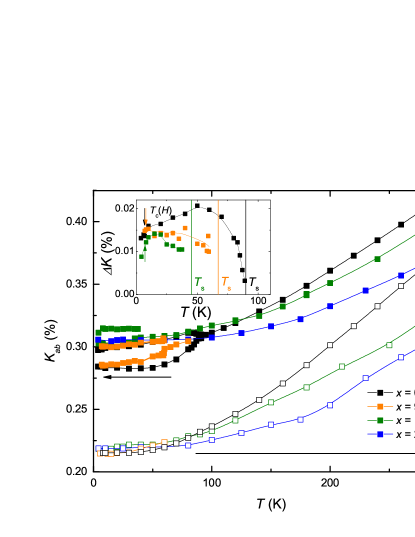
The dependence of the NMR shift for all samples and both directions is shown in Fig. 2. As in pure FeSe, all values increase monotonically with increasing . is greater than for all samples with almost no dependence at low . On the other hand, the high temperature value of shows a large concentration dependence, where decreases with increasing .
The inset of Fig. 2 shows the and dependence of the spectral splitting (the difference of the Knight shifts of the two peaks), which is a measure of the local nematic order parameter Baek2015 . For the pure sample, increases sharply below and shows a broad maximum near K, as reported previously Baek2015 ; Wang2016 ; Wiecki2017 . In contrast to pure FeSe, for = 9% and = 15% does not exhibit this maximum. While the of the = 0% and = 9% samples show no clear kinks at , the = 15% sample shows a noticeable drop in the SC state. In the S-doped samples, we could not resolve the splitting all the way up to the bulk identified by resistivity measurements SM , likely due to the broadening of the two individual lines (see Fig. 1) by microscopic disorder from dopants and/or small variations in the local S composition. Due to the broad spectra relative to pure FeSe, no clear evidence for the local nematicity above , observed in pure FeSe from FWHM measurements Wiecki2017 ; Wang2017 , could be found.
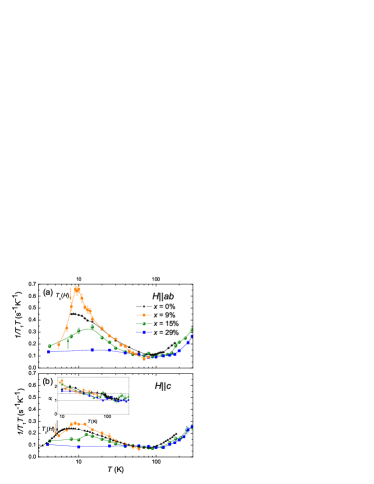
We now discuss the behavior of the low-energy magnetic fluctuations based the NMR spin-lattice relaxation rate () data. for all samples and both directions are shown in Fig. 3 T1_ab . In general, 1/ is related to the dynamical magnetic susceptibility as , where is the wave-vector dependent form factor and is the imaginary part of the dynamic susceptibility at the Larmor frequency Smerald2011 . Above K, shows a similar dependence as the NMR shift which measures the uniform susceptibility . In contrast, below K a strong upturn of is observed which is not seen in . The enhancement of at low is therefore attributed to the growth of AFM spin fluctuations with . The AFM fluctuations appear below K for all samples, but the enhancement of the AFM fluctuations shows a strong dependence.
In order to characterize the AFM fluctuations, we plotted the ratio of 1/ for the two field directions, . According to previous NMR studies performed on Fe pnictides and related materials Kitagawa2009 ; Kitagawa2010 ; Hirano2012 ; Furukawa2014 ; Pandey2013 ; Ding2016 , depends on the wavevector of the spin correlations. Assuming isotropic spin correlations, one expects for stripe-type, for Néel-type. As plotted in the inset of Fig. 3(b), 1 at high and increases to starting below K. The value of observed here at low is consistent with stripe-type spin correlations. The dependence of is independent of doping within experimental error, indicating no change in the character of magnetic fluctuations with doping.

To discuss magnetic fluctuations in more detail, it is convenient to isolate the component-resolved hyperfine field (HF) fluctuations from the measured data. probes the sum of fluctuations of HF at perpendicular to the applied field according to , where are mutually orthogonal directions and represents the -dependent power spectral density of the -th component of HF at the nuclear site. Therefore, we define the quantities and Wiecki2015 . Note that, for simplicity, we have neglected any -plane anisotropy due to nematicity (). Thus defined, () directly measures the () component of HF fluctuations ().
In Fermi liquid systems, one expects that . Here , where is the -independent chemical shift. probes the uniform susceptibility according to , where is the hyperfine coupling constant. Therefore, to examine the contribution of correlations one can compare to . The quantities and should be compared to and , respectively Wiecki2015 . The experimentally observed can then be decomposed into and AFM () components as . We have , where is a proportionality constant determined empirically from the high data SM .
In Fig. 4, we compare the angle-resolved pairs of and . Above K, it is clear that , indicating that the relaxation is being driven primarily by the component. In contrast, the difference between and can be clearly seen below K and is attributed to the contribution from the stripe-type AFM fluctuations, . Relative to pure FeSe, spin fluctuations are enhanced at , slightly suppressed at and strongly suppressed for . The dependence of the magnetic-fluctuation enhancement closely parallels the dependence of , which shows a slight enhancement between and and is suppressed at higher doping levels. The suppression of magnetic fluctuations for is consistent with ARPES data Reiss2017 .
In all cases, we find that at low , indicating that is greater than . The hyperfine field at the Se nuclear site is determined from the magnetic moments on the Fe sites by the hyperfine coupling tensor. Since the stripe-type AFM fluctuations produce the HF fluctuations at the Se site though off-diagonal components of the hyperfine coupling tensor Kitagawa2008 ; Johnston2010 , the fact that is greater than shows that the -plane polarized stripe-type AFM fluctuations are more developed than the corresponding -axis polarized fluctuations, similar to the BaFe2As2-based superconductors Wiecki2015 .
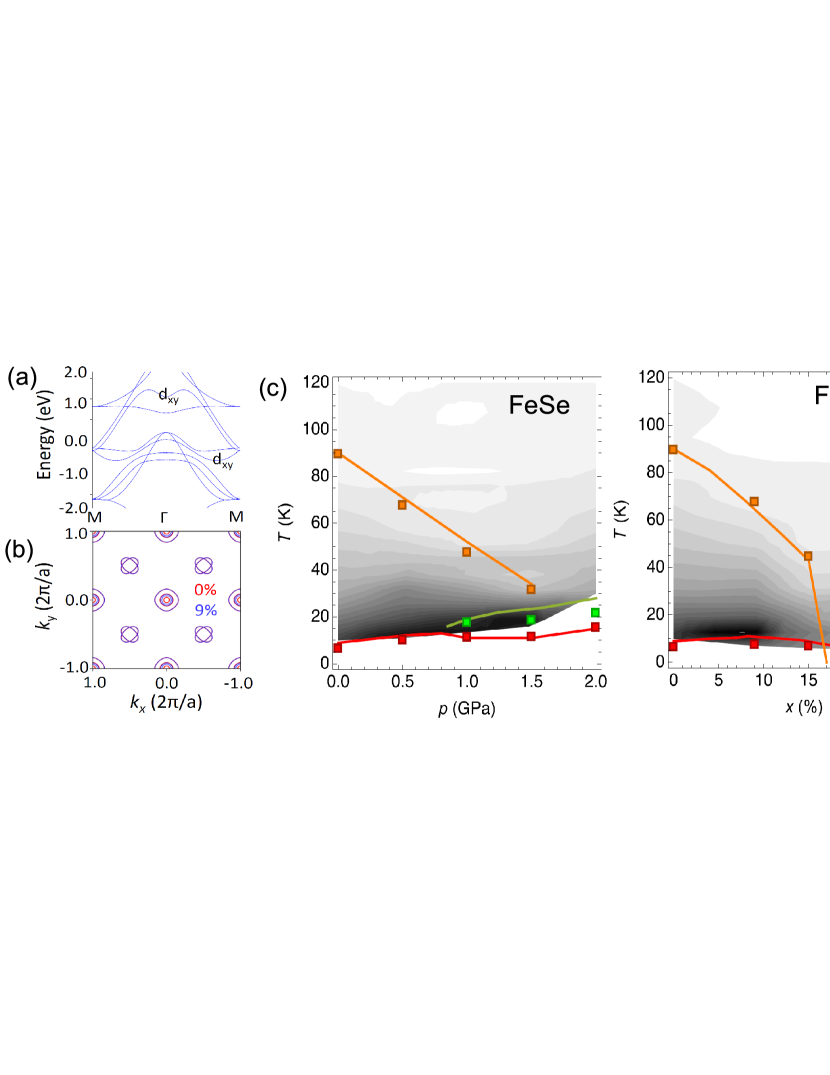
Within an itinerant picture, the change in the AFM spin correlations with doping would be associated with a change in the nesting condition due to modification of the Fermi surface with S substitution. To understand the band structure of FeSe1-xSx, we performed electronic structure calculations Yongbin using the full-potential linearized augmented plane wave method Blaha2001 with a generalized gradient approximation Perdew1996 . Here we calculate the band structure for the tetragonal phases in FeSe1-xSx using an FeSe unit cell, adopting chemical pressure effects on the and lattice parameters. The calculated band dispersion is shown in Fig. 5(a), which is in good agreement with the previous report Watson2015 . The calculated Fermi surface has three hole pockets around the point and two electron pockets at the point along the [110] direction (Fig. 5(b)). We find that the size of the smallest of the three hole pockets, originating from the orbital, is increased by S doping. In contrast, the other pockets, originating from and orbitals, do not change. These results continue to hold for a reduction of the chalcogen height, which also occurs by S doping Matsuura2017 . Thus the orbital can be considered to play an important role in AFM spin correlations and also in the appearance of SC in FeSe1-xSx.
Finally let us comment on the temperature dependence of observed in and (see Fig. 3). For , the maximum of has been reported to occur close to Baek2015 ; Wang2016 . However, for and , we find that the maximum of instead occurs well above as determined by our in situ ac-susceptibility measurements SM . At , we find K and K, while peaks at K for both directions. At , we find K and K. However, for both directions, peaks at K. These results imply a suppression of magnetic fluctuations just above in the S-doped samples. The effect is more apparent for data. Furthermore, the difference between and the peak of appears to increase with doping. It is interesting to point out that similar behavior has been observed in pure FeSe and discussed in terms of a possible superconducting fluctuation effect Kasahara2016 ; Shi2018 . Detailed field-dependent measurements on the S-doped samples will be needed to confirm this scenario.
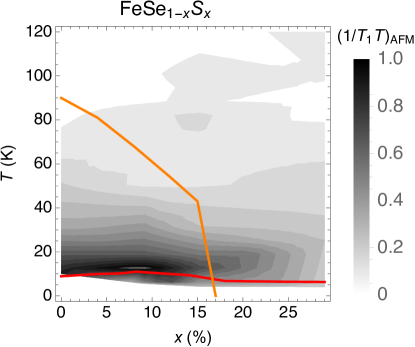
Our main results are summarized in the phase diagram of Fig. 5(c), which shows a contour plot of the AFM contribution to as a function of and . For comparison, a similar plot for pure FeSe under pressure is also shown. In both cases, the bulk nematic order is suppressed. In pure FeSe, the magnetic fluctuations are roughly independent of pressure or slightly enhanced. In contrast, magnetic fluctuations are ultimately strongly suppressed by S doping, after an initial slight enhancement for . Magnetic fluctuations are strongly correlated with in the FeSe1-xSx system. In contrast, nematic fluctuations are most strongly enhanced near the nematic critical quantum point at Hosoi2016 and show no correlation with . These NMR results demonstrate the primary importance of magnetic fluctuations to superconductivity in the FeSe system, and help to disentangle the roles of magnetic and nematic fluctuations in iron-based superconductors in general.
The research was supported by the U.S. Department of Energy, Office of Basic Energy Sciences, Division of Materials Sciences and Engineering. Ames Laboratory is operated for the U.S. Department of Energy by Iowa State University under Contract No. DE-AC02-07CH11358.
References
- (1) D. J. Scalapino, Rev. Mod. Phys. 84, 1383 (2012).
- (2) N. J. Curro, T. Caldwell, E. D. Bauer, L. A. Morales, M. J. Graf, Y. Bang, A. V. Balatsky, J. D. Thompson and J. L. Sarrao, Nature 434, 622 (2005).
- (3) T. Hattori, Y. Ihara, Y. Nakai, K. Ishida, Y. Tada, S. Fujimoto, N. Kawakami, E. Osaki, K. Deguchi, N. K. Sato, and I. Satoh, Phys. Rev. Lett. 108, 066403 (2012).
- (4) E. Bertel and A. Menzel, Symmetry 2016, 8(6), 45; doi:10.3390/sym8060045
- (5) P. C. Canfield and S. L. Bud’ko, Annu. Rev. Condens. Matter Phys. 1, 27 (2010).
- (6) D. C. Johnston, Adv. Phys. 59, 803 (2010).
- (7) H.-H. Kuo, J.-H. Chu, J. C. Palmstrom, S. A. Kivelson, I. R. Fisher, Science 352 958 (2016).
- (8) S. Lederer, Y. Schattner, E. Berg, S. A. Kivelson, Phys. Rev. Lett. 114, 097001 (2015).
- (9) S. Lederer, Y. Schattner, E. Berg, and S. A. Kivelson, Proc. Natl. Acad. Sci. USA 114 4905 (2017).
- (10) F.-C. Hsu, J.-Y. Luo, K.-W. Yeh, T.-K. Chen, T.-W. Huang, P. M. Wu, Y.-C. Lee, Y.-L. Huang, Y.-Y. Chu, D.-C. Yan, and M.-K. Wu, Proc. Natl. Acad. Sci. U.S.A. 105, 14262 (2008).
- (11) T. M. McQueen, A. J. Williams, P. W. Stephens, J. Tao, Y. Zhu, V. Ksenofontov, F. Casper, C. Felser, and R. J. Cava Phys. Rev. Lett. 103, 057002 (2009).
- (12) A. E. Böhmer and A. Kreisel, J. Phys.: Condens. Matter 30 023001 (2018).
- (13) T. Terashima, N. Kikugawa, S. Kasahara, T. Watashige, T. Shibauchi, Y. Matsuda, T. Wolf , A. E. Böhmer, F. Hardy, C. Meingast, H. v. Löhneysen, and S. Uji, J. Phys. Soc. Jpn. 84 063701 (2015).
- (14) M. Bendele, A. Amato, K. Conder, M. Elender, H. Keller, H.-H. Klauss, H. Luetkens, E. Pomjakushina, A. Raselli, and R. Khasanov, Phys. Rev. Lett. 104, 087003 (2010).
- (15) K. Kothapalli, A. E. Böhmer, W. T. Jayasekara, B. G. Ueland, P. Das, A. Sapkota, V. Taufour, Y. Xiao, E. Alp, S. L. Bud’ko, P. C. Canfield, A. Kreyssig, and A. I. Goldman, Nat. Commu. 7, 12728 (2016).
- (16) U. S. Kaluarachchi, V. Taufour, A. E. Böhmer, M. A. Tanatar, S. L. Bud’ko, V. G. Kogan, R. Prozorov, and P. C. Canfield, Phys. Rev. B 93, 064503 (2016).
- (17) Y. Mizuguchi, F. Tomioka, S. Tsuda, T. Yamaguchi and Y. Takano, Appl. Phys. Lett. 93, 152505 (2008).
- (18) S. Margadonna, Y. Takabayashi, Y. Ohishi, Y. Mizuguchi, Y. Takano, T. Kagayama, T. Nakagawa, M. Takata, and K. Prassides Phys. Rev. B 80, 064506 (2009).
- (19) S. Medvedev, T. M. McQueen, I. A. Troyan, T. Palasyuk, M. I. Eremets, R. J. Cava, S. Naghavi, F. Casper, V. Ksenofontov, G. Wortmann and C. Felser, Nat. Mat. 8, 630 (2009)
- (20) T. Imai, K. Ahilan, F. L. Ning, T. M. McQueen, and R. J. Cava Phys. Rev. Lett. 102, 177005 (2009).
- (21) S. Hosoi, K. Matsuura, K. Ishida, H. Wang, Y. Mizukami, T. Watashige, S. Kasahara, Y. Matsuda, and T. Shibauchi, Proc. Natl. Acad. Sci. USA 113, 8139 (2016).
- (22) Mahmoud Abdel-Hafiez, Yuan-Yuan Zhang, Zi-Yu Cao, Chun-Gang Duan, G. Karapetrov, V. M. Pudalov, V. A. Vlasenko, A. V. Sadakov, D. A. Knyazev, T. A. Romanova, D. A. Chareev, O. S. Volkova, A. N. Vasiliev, and Xiao-Jia Chen Phys. Rev. B 91, 165109 (2015).
- (23) L. Xiang, U. S. Kaluarachchi, A. E. Böhmer, V. Taufour, M. A. Tanatar, R. Prozorov, S. L. Bud’ko, and P. C. Canfield, Phys. Rev. B 96, 024511 (2017).
- (24) K. Matsuura, Y. Mizukami, Y. Arai, Y. Sugimura, N. Maejima, A. Machida, T. Watanuki, T. Fukuda, T. Yajima, Z. Hiroi, K. Y. Yip, Y. C. Chan, Q. Niu, S. Hosoi, K. Ishida, K. Mukasa, T. Watashige, S. Kasahara, J.-G. Cheng, S. K. Goh, Y. Matsuda, Y. Uwatoko, T. Shibauchi, Nat. Comm. 8, 1143 (2017).
- (25) M. D. Watson, T. K. Kim, A. A. Haghighirad, S. F. Blake, N. R. Davies, M. Hoesch, T. Wolf, and A. I. Coldea Phys. Rev. B 92, 121108(R) (2015).
- (26) A. I. Coldea, S. F. Blake, S. Kasahara, A. A. Haghighirad, M. D. Watson, W. Knafo, E. S. Choi, A. McCollam, P. Reiss, T. Yamashita, M. Bruma, S. Speller, Y. Matsuda, T. Wolf, T. Shibauchi, A. J. Schofield, arXiv:1611.07424
- (27) A. E. Böhmer, V. Taufour, W. E. Straszheim, T. Wolf, and P. C. Canfield, Phys. Rev. B 94, 024526 (2016).
- (28) See Supplemental Material for the sample growth and characterization, the experimental details, the scaling analysis of 1/ and , the contour plot of (1/ and plot analysis.
- (29) S-H. Baek, D. V. Efremov, J. M. Ok, J. S. Kim, J. van den Brink, and B. Büchner, Nat. Mater. 14, 210 (2015).
- (30) A. E. Böhmer, T. Arai, F. Hardy, T. Hattori, T. Iye, T. Wolf, H. v. Löhneysen, K. Ishida, and C. Meingast, Phys. Rev. Lett. 114, 027001 (2015).
- (31) P. Wiecki, M. Nandi, A. E. Böhmer, S. L. Bud’ko, P. C. Canfield, Y. Furukawa, Phys. Rev. B, 96, 180502(R) (2017).
- (32) P. S. Wang, S. S. Sun, Y. Cui, W. H. Song, T. R. Li, R. Yu, H. Lei, and W. Yu, Phys. Rev. Lett. 117, 237001 (2016).
- (33) P. S. Wang, P. Zhou, S. S. Sun, Y. Cui, T. R. Li, H. Lei, Z. Wang, W. Yu, Phys. Rev. B 96, 094528 (2017).
- (34) Here, is averaged over any plane anisotropy due to nematicity SM .
- (35) A. Smerald and N. Shannon, Phys. Rev. B 84 184437 (2011).
- (36) K. Kitagawa, N. Katayama, K. Ohgushi, and M. Takigawa, J. Phys. Soc. Jpn. 78, 063706 (2009).
- (37) S. Kitagawa, Y. Nakai, T. Iye, K. Ishida, Y. Kamihara, M. Hirano, and H. Hosono, Phys. Rev. B 81, 212502 (2010).
- (38) M. Hirano, Y. Yamada, T. Saito, R. Nagashima, T. Konishi, T. Toriyama, Y. Ohta, H. Fukazawa, Y. Kohori, Y. Furukawa, K. Kihou, C-H. Lee, A. Iyo, and H. Eisaki, J. Phys. Soc. Jpn. 81, 054704 (2012).
- (39) Y. Furukawa, B. Roy, S. Ran, S. L. Bud’ko, and P. C. Canfield, Phys. Rev. B 89, 121109(R) (2014).
- (40) A. Pandey, D. G. Quirinale, W. Jayasekara, A. Sapkota, M. G. Kim, R. S. Dhaka, Y. Lee, T. W. Heitmann, P. W. Stephens, V. Ogloblichev, A. Kreyssig, R. J. McQueeney, A. I. Goldman, A. Kaminski, B. N. Harmon, Y. Furukawa, and D. C. Johnston, Phys. Rev. B 88, 014526(2013).
- (41) Q.-P. Ding, P. Wiecki, V. K. Anand, N. S. Sangeetha, Y. Lee, D. C. Johnston, and Y. Furukawa, Phys. Rev. B 93, 140502 (2016).
- (42) P. Wiecki, B. Roy, D. C. Johnston, S. L. Bud’ko, P. C. Canfield, and Y. Furukawa, Phys. Rev. Lett. 115, 137001 (2015).
- (43) P. Reiss, M. D. Watson, T. K. Kim, A. A. Haghighirad, D. N. Woodruff, M. Bruma, S. J. Clarke, and A. I. Coldea Phys. Rev. B 96, 121103(R) (2017).
- (44) K. Kitagawa, N. Katayama, K. Ohgushi, M. Yoshida, and M. Takigawa, J. Phys. Soc. Jpn. 77, 114709 (2008).
- (45) For obtaining self-consistent charge density, we employed muffin-tin radii a.u. for Fe and Se, respectively, and and which set the maximum value in the expansion of plane waves. The Se atom position was relaxed until the force on the Se atom was less than 0.1 mRy/a.u. Calculations were iterated, with 4800 -points for whole Brillouin zone, to reach the total energy convergence criterion that was 0.01 mRy/cell. For the Fermi surface calculations, we choose we chose plane and divide region by 200*220 mesh that resulted in 40401 k-points.
- (46) P. Blaha, K. Schwarz, G. K. H. Madsen, D. Kvasnick, and J. Luitz, WIEN2K, an Augmented Plane Wave + Local Orbitals Program for Calculation Crystal Properties (Karlheinz Schwarz, Technical Universität Wien, Austria), 2001.
- (47) J. P. Perdew, K. Burke and M. Ernzerhof, Phys. Rev. Lett. 77, 3865 (1996).
- (48) S. Kasahara, T. Yamashita, A. Shi, R. Kobayashi, Y. Shimoyama, T. Watashige, K. Ishida, T. Terashima, T Wolf, F. Hardy, C. Meingast, H. v. Löhneysen, A. Levchenko, T. Shibauchi and Y. Matsuda, Nat. Comm. 7, 12843 (2016).
- (49) A. Shi, T. Arai, S. Kitagawa, T. Yamanaka, K. Ishida, A. E. Böhmer, C. Meingast, T. Wolf, M. Hirata, T. Sasaki, J. Phys. Soc. Jpn. 87, 013704 (2018).
I Supplementary Material
II Sample growth and characterization
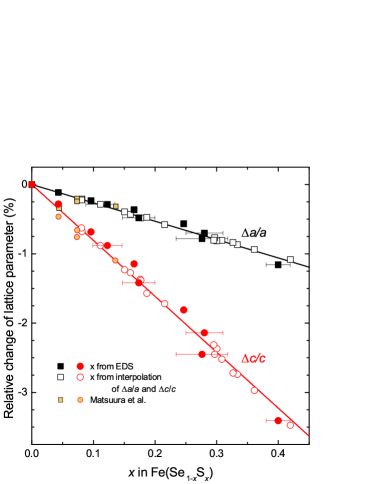
The Fe(Se1-xSx) crystals were grown using chemical vapor transport similar to the description in Ref. Bohmer2016, . Fe, Se and S powder were mixed in a ratio of 1.5:(1-): and sealed in a quartz ampoule together with a eutectic mix of AlCl3 and KCl. The materials were let to react at 390∘C for 1-2 days before the ampoules were placed under a temperature gradient and chemical vapor transport was initiated. The sulfur content , which varied from the nominal sulfur content , of several batches (shown as a full symbol in Fig. 1) was determined by energy-dispersive x-ray spectroscopy on 3-5 freshly cleaved crystals with an average of 4 different spots per crystal. The error bar indicates one standard deviation. Some early batches in which the initial reaction at 390∘C was omitted show quite substantial variations in sulfur content. The average lattice parameters of each batch were determined by powder x-ray diffraction in a Rigaku Miniflex diffractometer with Cu K radiation. A minority hexagonal phase could sometimes be identified, however, the phase majority always was consistent with the tetragonal P4/nmm space group. The variation of lattice parameters with sulfur content is presented in Fig. 1. The results are consistent with findings in Ref. Matsuura2017, . Furthermore, a linear extrapolation to yields almost perfectly the lattice parameters of FeS reported in Ref. Lai2015, , indicating that Vegard’s law is obeyed for the whole series.
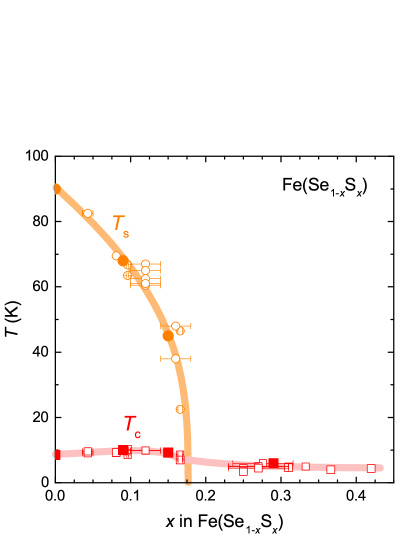
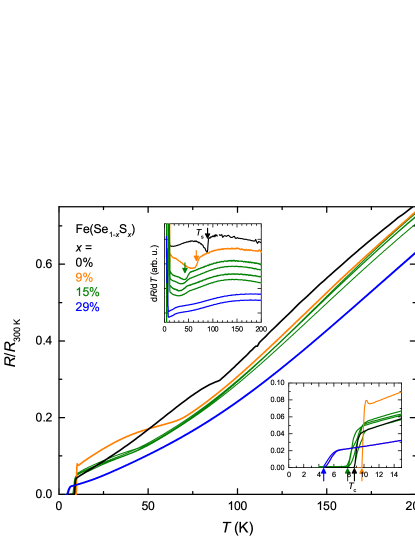
Figures 2 and 3 show the phase diagram of Fe(Se1-xSx) and the resistance data characterizing the NMR samples, respectively. The phase diagram reflects the variation in within some of the batches as individual samples of the same batch can exhibit varying . To determine the sulfur content of the NMR samples as accurately as possible, we refer to the phase diagram, the EDS results and the average lattice parameters of the respective batches. The structural transition temperature of the samples was determined from resistivity measurements by the midpoint of the step in as in Refs. Kaluarachchi2016, ; Xiang2017, . For the sample, EDS of a selection of samples from the same batch indicates . However, the resistance measurement in Fig. 3 reveals that K for this sample. Thus, from the phase diagram, the specimen selected for NMR seems to be more accurately described by . The four samples with show K in Fig. 3, located at in the phase diagram. The interpolation of lattice parameters for the batch yields , in good agreement. For the samples with highest sulfur content, resistivity measurements do not find the signature of the structural phase transition and indicate K at zero field. The sulfur content is determined by interpolation of its lattice parameters, since the transition temperature barely varies with in this range and can therefore not be used as an indicator of sulfur content.
III Methods
III.1 NMR experimental details
We conducted 77Se NMR (; MHz/T) measurements under a fixed external field of T applied either in the plane or along the axis. The external field in the -plane was applied along the in-plane [110] tetragonal direction in order resolve the splitting of the NMR spectrum below for . Measurements at were conducted on a single crystal of mass mg, with K and K. However, low NMR signal intensity prevented measurements above K. To improve the signal intensity for the measurements, four single crystals of total mass mg were each cleaved into 2 to 3 pieces. The samples were co-aligned by eye based on exterior faces of the crystals and affixed to a glass plate with GE varnish. There was some variation of among this batch of crystals used for NMR measurements due to slight variations in sulfur content, with the average being K, see Figure 3. The variation is to be expected because the dependence of on doping is quite steep in this concentration range. All the samples showed K at zero field. For the measurements, individual single crystals of total mass mg were fixed to a glass plate with GE varnish. The plane orientation of the samples was not precisely controlled as no nematicity was expected.
The 77Se NMR spin-lattice relaxation rate was measured with a recovery method using a single /2 saturation pulse. The at each was determined by fitting the nuclear magnetization versus time using the exponential function , where and are the nuclear magnetization at time after the saturation and the equilibrium nuclear magnetization at , respectively. In the nematic state, no attempt was made to resolve the of the two peaks separately. We have measured only the plane average . NMR spectra were measured by FFT of the NMR spin echo.
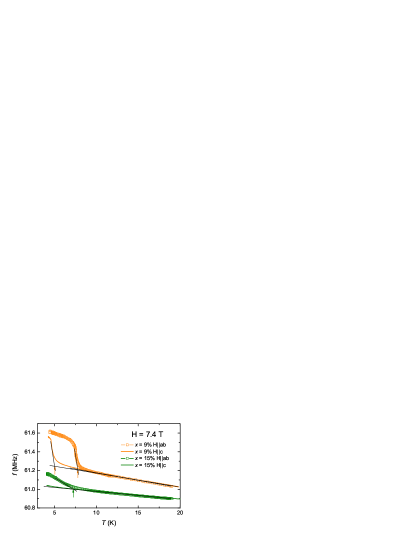
The superconducting transition temperature at the NMR measurement field ( T) was determined by in situ ac-susceptibility measurements down to K, as shown in Fig 4. The stronger suppression of for is consistent with Ref. Abdel2015, . No superconductivity was observed above K at T for samples.
III.2 Scaling analysis of and
In the main paper we decomposed . The term will show Korringa behavior
| (1) |
To obtain one needs the chemical shift , which is obtained from a vs. plot analysis (see below). The proportionality constant in Eq. 1 is given by , where is the Korringa constant ( Ks for 77Se) and the Korringa ratio parameterizes deviations of from the theoretical value Wiecki2015 .
The necessary scaling factors were empirically determined from a plot of against () with as an implicit parameter. The points above K showed linear behavior, the slope of which determines . Since we measure in units of , this analysis determines determines in units of (, as reported in the main paper. For the sample, we assumed the same values of and as for since we lack the high- data due to low signal intensity.
IV Additional data
IV.1 Contour Plot
In the final plot of the main paper, we compared the AFM contribution to in pressurized and sulfur-doped FeSe. Obviously, we would like to compare the same quantity for both systems. However, in the case of pressurized FeSe, we lack data for making the full analysis involving and impossible. We therefore simply used the definition for the comparison. However, as we describe in the paper, it is preferable to define , which consistently compares the susceptibility of the -axis component of the hyperfine field. We include this contour plot here for comparison in Fig 5. The plot is qualitatively similar to the one used in the main text and thus the definition of has no effect on our physical conclusions.
IV.2 NMR Shift in FeSe under pressure
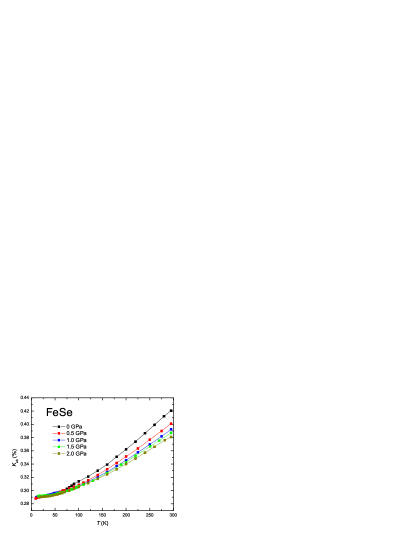
Fig. 6 shows the NMR shift with in pure FeSe under pressure. Here, for simplicity, we show the -plane average in the orthorhombic phase. As in the case of S doping in the main paper, is pressure independent at low , but depends on pressure at high . Here, the high- value of decreases with increasing pressure, similar to the behavior with increasing S doping.
IV.3 vs Analysis
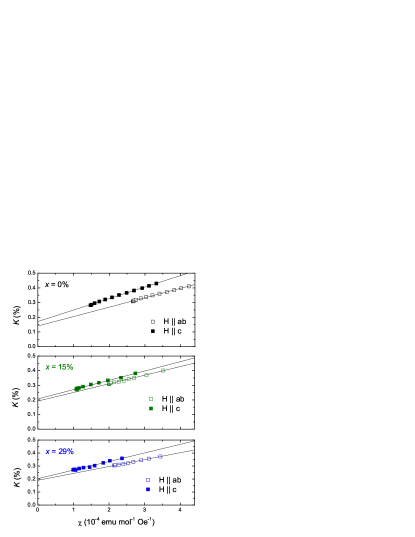
We performed a vs plot analysis to determine the -independent chemical shift and hyperfine coupling constants and . In Fig. 7, we plot as a function of with as an implicit parameter. The range is chosen so as to avoid low- upturns of due to magnetic impurities to which NMR, a local probe, is insensitive. For , such an analysis is not possible because we lack data over the entire range due to signal intensity problems at high . In these plots, is the -intercept. The hyperfine coupling constants are determined by the slope. For , we obtain T/ and T/. For , we obtain T/ and T/. For , we obtain T/ and T/.
References
- (1) A. E. Böhmer, V. Taufour, W. E. Straszheim, T. Wolf, and P. C. Canfield, Phys. Rev. B 94, 024526 (2016).
- (2) K. Matsuura, Y. Mizukami, Y. Arai, Y. Sugimura, N. Maejima, A. Machida, T. Watanuki, T. Fukuda, T. Yajima, Z. Hiroi, K. Y. Yip, Y. C. Chan, Q. Niu, S. Hosoi, K. Ishida, K. Mukasa, T. Watashige, S. Kasahara, J.-G. Cheng, S. K. Goh, Y. Matsuda, Y. Uwatoko, T. Shibauchi, Nat. Comm. 8, 1143 (2017).
- (3) X. Lai, H. Zhang, Y. Wang, X. Wang, X. Zhang, J. Lin, and F. Huang, J. Am. Chem. Soc., 137 10148 (2015). (DOI: 10.1021/jacs.5b06687)
- (4) U. S. Kaluarachchi, V. Taufour, A. E. Böhmer, M. A. Tanatar, S. L. Bud’ko, V. G. Kogan, R. Prozorov, and P. C. Canfield, Phys. Rev. B 93, 064503 (2016).
- (5) L. Xiang, U. S. Kaluarachchi, A. E. Böhmer, V. Taufour, M. A. Tanatar, R. Prozorov, S. L. Bud’ko, and P. C. Canfield, Phys. Rev. B 96, 024511 (2017).
- (6) M. A. Tanatar, A. E. Böhmer, E. I. Timmons, M. Schütt, G. Drachuck, V. Taufour, K. Kothapalli, A. Kreyssig, S. L. Bud’ko, P. C. Canfield, R. M. Fernandes, and R. Prozorov,
- (7) Mahmoud Abdel-Hafiez, Yuan-Yuan Zhang, Zi-Yu Cao, Chun-Gang Duan, G. Karapetrov, V. M. Pudalov, V. A. Vlasenko, A. V. Sadakov, D. A. Knyazev, T. A. Romanova, D. A. Chareev, O. S. Volkova, A. N. Vasiliev, and Xiao-Jia Chen Phys. Rev. B 91, 165109 (2015).
- (8) P. Wiecki, B. Roy, D. C. Johnston, S. L. Bud’ko, P. C. Canfield, and Y. Furukawa, Phys. Rev. Lett. 115, 137001 (2015).