FERMILAB-PUB-18-018-T
Nikhef/2017-068
OUTP-17-16P
Direct photon production and PDF fits reloaded
John M. Campbell,1 Juan Rojo,2 Emma Slade,3 and Ciaran Williams.4
1Fermilab, P.O. Box 500, Batavia, IL 60510, USA.
2Department of Physics and Astronomy, VU University, NL-1081 HV Amsterdam,
and Nikhef Theory Group, Science Park 105, 1098 XG Amsterdam, The Netherlands.
3Rudolf Peierls Centre for Theoretical Physics, 1 Keble Road,
University of Oxford, OX1 3NP Oxford, United Kingdom.
4Department of Physics, University at Buffalo,
The State University of New York, Buffalo 14260, USA.
Abstract
Direct photon production in hadronic collisions provides a handle on the gluon PDF by means of the QCD Compton scattering process. In this work we revisit the impact of direct photon production on a global PDF analysis, motivated by the recent availability of the next-to-next-to-leading (NNLO) calculation for this process. We demonstrate that the inclusion of NNLO QCD and leading-logarithmic electroweak corrections leads to a good quantitative agreement with the ATLAS measurements at 8 TeV and 13 TeV, except for the most forward rapidity region in the former case. By including the ATLAS 8 TeV direct photon production data in the NNPDF3.1 NNLO global analysis, we assess its impact on the medium- gluon. We also study the constraining power of the direct photon production measurements on PDF fits based on different datasets, in particular on the NNPDF3.1 no-LHC and collider-only fits. We also present updated NNLO theoretical predictions for direct photon production at 13 TeV that include the constraints from the 8 TeV measurements.
1 Introduction
The determination of parton distribution functions (PDFs) of the proton [1, 2, 3, 4] is an important component of the LHC program for many analyses, from precision tests of the Standard Model to searches for new physics beyond it. Within the global fitting framework, the gluon PDF has been traditionally constrained by the scaling violations of deep-inelastic scattering (DIS) structure functions and from inclusive jet production [5]. More recently, a number of additional collider observables have demonstrated their constraining power on the gluon PDF, from differential distributions in top-quark pair production [6] to the boson transverse momentum [7] and meson production in the forward region [8, 9]. In this respect, the recent NNPDF3.1 global analysis [10] demonstrated how a robust determination of the medium and large- NNLO gluon PDF can be achieved by the combination of LHC measurements of top-quark pair, , and inclusive jet production — see also the discussion in [11].
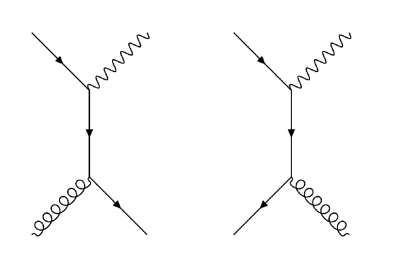
Another process that has been advocated to constrain the gluon in a global PDF analysis is direct (or “prompt”) photon production at hadron colliders. Indeed, direct photon production, , probes the gluon directly at leading order through the QCD Compton scattering process shown in Fig. 1.1. Taking into account the kinematics of available LHC data, direct photon measurements provide information on the gluon in the range between and [12, 13]. In addition, direct photons can also be produced via quark-antiquark annihilation (also shown in Fig. 1.1), such that this process also allows us to probe the contribution of different quark flavours in the same region.
However, exploiting collider measurements of direct photon production to constrain the gluon PDF is complicated by the fact that high- photons can also be produced via the collinear splitting of a final-state quark. These emissions have associated collinear singularities that are absorbed into non-perturbative quark-to-photon and gluon-to-photon fragmentation functions (FFs). This fragmentation component is only loosely constrained by LEP data [14], therefore inducing a potentially large source of theoretical uncertainty.
In spite of these complications, direct photon production data from fixed-target experiments were used in early global PDF fits, such as those of [15, 16, 17]. However, the increased availability of jet production data from the Tevatron, together with the difficulties in reconciling NLO QCD theory with some fixed-target measurements, led to the abandonment of using photon data to constrain the large- gluon. However, this general feeling that direct photon production data was not suitable for PDF fits was demonstrated to be incorrect by the analysis of Ref. [13]. There it was shown that a good agreement between NLO theory and direct (isolated) photon production measurements could be obtained for a wide range of collider energies from RHIC and SPS to the Tevatron and the LHC at TeV. This analysis also found that the LHC measurements lead to a moderate reduction of the gluon PDF uncertainties in the region around .
Despite the results of this study, none of the most recently-updated global PDF fits [18, 10, 19, 20] include collider direct photon measurements. The reason for this is twofold. On the one hand, the NLO QCD calculations are affected by large scale uncertainties, thus making direct photon production inappropriate for NNLO global analyses that require precision theoretical predictions. On the other hand, in order to relate theory calculations with experimental measurements one needs to account for the poorly-understood fragmentation component.
The first of these objections was removed by the availability of the NNLO QCD calculation [21], which together with the corresponding electroweak corrections [22] was found to provide a good quantitative description of the ATLAS measurements at TeV [23] at central photon rapidities [21]. The second objection can be somewhat alleviated by applying the smooth cone isolation prescription proposed by Frixione [24]. This isolation condition removes the need for fragmentation functions from the theoretical calculation, at the cost of introducing a difference between the isolation definitions used in the theoretical and the experimental analyses. However, as will be discussed later, this difference has been studied at NLO in great detail and found to be of limited practical consequence.
In addition to their relevance for PDF fits, photon production at the LHC is of great interest in searches for new physics beyond the standard model (BSM). For instance, recent searches for BSM physics with photons in the final state from ATLAS and CMS include searches for new particles by looking for high-mass resonances [25, 26, 27], anomalous couplings [28, 29, 30, 31], and by measuring missing distributions [32, 33, 34, 35]. These searches rely on a good understanding of the QCD background for photon production. It is therefore necessary to account for higher order QCD and electroweak corrections and to use recent global PDF fits that can properly model the background and signal events.
With this motivation, the goal of this paper is to revisit the impact of available LHC direct photon production measurements on a global NNLO PDF analysis. Specifically, we will include the ATLAS 8 TeV measurements [23] into the NNPDF3.1 analysis, in order to quantify the agreement between data and NNLO QCD theory and the corresponding impact on the gluon PDF. We find that a good description of this dataset is achieved, except for the most forward rapidity bin, and show that the inclusion of the photon data leads to a moderate reduction of the gluon PDF uncertainties at medium . These fit results are cross-checked with those of the Monte Carlo Bayesian reweighting procedure [36, 37]. In addition, we aim to study the constraining power of the direct photon production measurements on PDF fits based on different datasets, in particular on the NNPDF3.1 no-LHC and collider-only sets. We also show that using state-of-the-art theory and including the constraints from the 8 TeV direct photon measurements leads to an excellent description of the recent ATLAS 13 TeV data [38].
The paper is organised as follows. In Sect. 2 we review existing measurements of direct photon production, focusing on the ATLAS data used in the present study. In Sect. 3 we discuss the theoretical setup for computing the theoretical predictions for direct photon production. The impact of the photon data upon the gluon PDF is presented in Sect. 4, and in Sect. 5 we provide updated predictions for direct photon production at 13 TeV. Finally, in Sect. 6 we conclude with a summary of the results and outline possible future developments. We assess the impact of the correlations among systematic uncertainties in Appendix A, and compare the results of the fits with those obtained with the Bayesian reweighting method in Appendix B.
2 Experimental data
There exist many measurements of direct photon production both at fixed-target and at collider experiments (we refer the reader to ref. [13] for a detailed list). The measurements performed at the highest centre-of-mass energies are those from the LHC and from the Tevatron. At the Tevatron, the CDF and DØ experiments have measured direct photon cross-sections at GeV [39, 40], 1.8 TeV [41, 42, 43, 44, 45] and 1.96 TeV [46, 47, 48]. More recently, the ATLAS and CMS experiments during Run I have performed similar measurements at 7 TeV [49, 50, 51, 52, 53] and at 8 TeV [23], while thus far during Run II only ATLAS has measured direct photon production at 13 TeV [38].
In this work, we will concentrate on the ATLAS measurements at 8 TeV and 13 TeV. The 8 TeV data exhibits reduced statistical and systematic uncertainties as compared to their 7 TeV counterparts [51, 53], and is thus suitable for inclusion in a global PDF analysis. The 13 TeV measurements will be used only to compare with our theoretical predictions, but will not be included in the fit since the experimental uncertainties are larger than the 8 TeV data due to the limited integrated luminosity, fb-1.
The ATLAS 8 TeV direct photon production measurement is presented as differential distributions in the photon transverse energy () in four photon pseudorapidity () bins:
| (2.1) | ||||
The measurements cover the transverse energy range GeV, though the upper limit is reduced in the more forward bins. As we will discuss in Sect. 3, the kinematic cuts applied constrain the number of points included in the fit to .
For each of the experimental bins, the information on the statistical, total systematic, and luminosity uncertainties is provided by ATLAS. The full breakdown of the experimental systematic uncertainties including the information on cross-correlations corresponding to this measurement was only posted in HepData after the completion of the main results of this work. For this reason, the fits presented here are based on a constructed by adding the total systematic and statistical uncertainties in quadrature. The luminosity uncertainty on the other hand is taken to be fully correlated among all the bins, and correlated to other ATLAS measurements at 8 TeV included in the PDF fit. In Appendix A we assess the impact that including the correlation between the experimental systematic uncertainties in the definition has at the level of both PDFs and at the level of fit quality.
As will be discussed in Sect. 4, the most forward rapidity bin, , is excluded from the fit due to the tensions between the experimental data and the theoretical predictions. In this respect, the fact that the covariance matrix was not available at the time of the completion of the main results of this work implies that we cannot quantitatively study the origin of the tension in this forward bin. We discuss in Appendix A the description of the 4th rapidity bin upon the inclusion of the covariance matrix. Therefore, we have taken a conservative approach and excluded the anomalous bin; in Sect. 4.1 we discuss the impact in the fit of this bin and motivate in more detail its exclusion from our analysis.
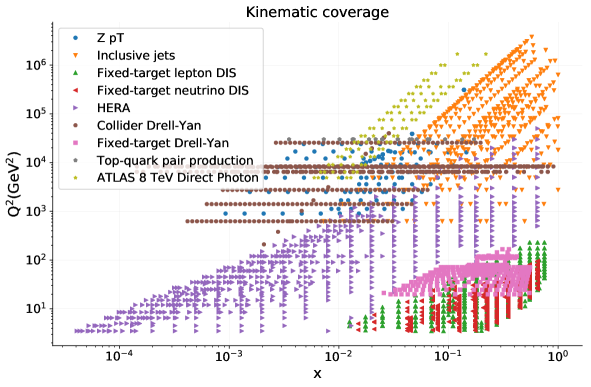
In Fig. 2.1 we show the kinematic coverage of the ATLAS 8 TeV data in the plane computed using LO kinematics, alongside with that of the dataset used in the global NNPDF3.1 fit. At LO one may write , so that each datapoint of the 8 TeV measurement corresponds to two points in the plane. From this comparison, we observe that the photon data probes a region only partly covered by other experiments; specifically the medium- range for over two orders of magnitude in . Therefore including the photon data allows one to constrain a new kinematic region beyond the range of previous PDF fits.
Concerning the ATLAS 13 TeV measurements, the data is presented in the same format as at 8 TeV and covers a range between GeV, for a total of datapoints. The covariance matrix is constructed in the same way as for the 8 TeV data, namely by adding statistical and total systematic uncertainties in quadrature, and treating the luminosity uncertainty as fully correlated among all the bins.
In order to distinguish prompt photons (produced in the hard-scattering process) from secondary photons (which occur copiously in decays of hadrons) the experimental analyses apply isolation criteria to the measured photons. Since secondary photons are predominantly associated with a large amount of hadronic activity, the experiments restrict the hadronic radiation that is present in a cone around the photon candidate. The isolation requirement used in the ATLAS analysis is -dependent, optimised to obtain the best signal-to-background ratio. The additional advantage of the relatively tight isolation applied by ATLAS is that it significantly reduces the contribution from prompt photons which are produced in the fragmentation of a hard parton. These contributions also have significant hadronic activity near the photon and are hence suppressed by the isolation condition.
3 Theoretical setup
In this section we outline the NNLO QCD and LL electroweak calculations that are used to compare with the ATLAS direct photon production data. We also describe the settings adopted in the calculation of the NLO QCD predictions, in particular the fast NLO APPLgrid interpolation [54] that is required to include the photon data in the global analysis.
As discussed in the introduction, direct photon production in hadronic collisions can proceed via two different types of processes. The photon can either be directly emitted as part of the hard-scattering interaction, as in Fig. 1.1, or alternatively can be produced via the collinear fragmentation of a parton. Taking into account these two contributions, the differential cross-section as a function of can be written as
| (3.1) | ||||
where is the fragmentation function of a parton to a photon carrying momentum fraction and is the PDF of a parton . While and are the standard renormalization and factorization scales, note the appearance of a new scale , known as the fragmentation scale. The NNLO QCD corrections to the direct component of the partonic cross-section have been computed in [21], while the fragmentation component is only known at NLO.
The need to account for the fragmentation functions can be eliminated by adopting the smooth cone isolation criterion [24],
| (3.2) |
with being the hadronic transverse energy contained in a cone of radius around a photon of , and where , and are parameters of the algorithm. Here the term suppresses the collinear singularity present as , but arbitrarily soft radiation is allowed inside the cone in order to preserve the cancellation of infrared poles in the calculation.
The granularity of an experimental calorimeter is such that this smooth cone isolation can never be directly replicated in experimental analyses, thereby introducing an unwelcome disconnect between theoretical calculations and the data. However, the parameters appearing in the above isolation definition, and , are arbitrary and this allows them to be tuned to replicate the features of a full calculation including fragmentation, Eq. (3.1). Such a study was first performed at NLO in [55], finding that the values and result in good agreement between the full calculation and the smooth cone result to within a few percent. A similar study was undertaken in the context of di-photon production at NNLO in [56], for which the parameters and were found to agree well with the fragmentation calculation.
The differences between the two types of isolation criteria were further studied recently at NLO in [57], finding a small ( correction that is independent of over a range of values similar to the one studied in this paper. This correction is the same approximate size as the missing higher-order uncertainty associated to the NNLO calculation. A full quantitative description of these theoretical uncertainties is beyond the scope of this work, so we therefore do not account for the uncertainty due to the choice of isolation algorithm. In this work, we adopt the smooth cone isolation, Eq. (3.2), with parameters and , and motivated by the above studies we assume that the residual uncertainties due to the choice of isolation prescription are negligible and should not have a bearing on the PDF fits that we perform.
In order to account for the impact of Sudakov effects induced by virtual loops of heavy electroweak gauge bosons, we include the resummation of the electroweak Sudakov logarithms at leading-logarithmic (LL) accuracy. Following the procedure in [22, 58], we set the QED coupling constant to be in the calculation.
The electroweak effects may be accounted for by an overall rescaling of the cross-section of the form
| (3.3) |
where the LL electroweak correction is given by [22, 58]
| (3.4) |
with , and being the hadronic center-of-mass energy expressed in TeV.
Since Eq. (3.4) is only valid for , we include in the fit only data such that GeV. This way, we can consistently use NNLO QCD and LL EW theory for all the data bins in the fit. In the central rapidity bin, this extra cut has the additional advantage of minimising the contribution from fragmentation photons, which are not included in our analysis, as the size of the fragmentation component decreases with . After applying this kinematic cut, we have datapoints to include in the fit. In addition, after removing the data from the most forward rapidity bin due to the poor , as mentioned in Sect. 2, we are left with datapoints.
Concerning the calculation of the NNLO QCD cross-sections, we start by computing theoretical predictions at NLO accuracy using MCFM [59] interfaced with LHAPDF6 [60] and APPLgrid using the NNPDF3.1 NNLO PDF set [10] with the dynamical renormalization and factorization scales set equal to . The output of this calculation is a fast NLO interpolation grid, as required for the inclusion of these measurements in a PDF fit. Subsequently, the NNLO QCD corrections from Ref. [21] are included in the form of bin-by-bin -factors, defined as:
| (3.5) |
so that only the perturbative order of the partonic cross-section is varied, but the PDFs are kept the same.
The technical details regarding this NNLO QCD computation can be found in the original publications [21, 57], and we refer the interested reader to these works for more detail. The only non-trivial change from these works is the manner in which the slicing variable is defined. In the original calculations this is set at a fixed value for the entire phase space, GeV. In the present analysis we instead use a dynamic cut that is determined by the photon transverse momentum, . We find that this improves the overall performance of the computation, particularly in the determination of the NNLO corrections at high .
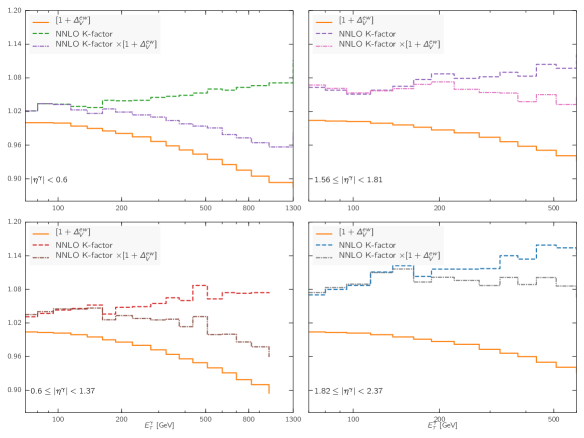
We show in Fig. 3.1 the NNLO QCD -factors, Eq. (3.5), as well as the LL electroweak correction , Eq. (3.4), in the four rapidity bins of the ATLAS 8 TeV measurement [23]. Both corrections become more important in the high regions, where they deviate significantly from 1. We also show in Fig. 3.1 the results of the multiplicative combination of the NNLO QCD -factor and of the LL EW effects, which represents the overall correction applied to the NLO QCD cross-section. We can observe that there is a partial cancellation between the two higher-order effects, since each pulls the NLO cross-section in an opposite direction.
As mentioned above, a fast interpolation of the NLO QCD calculation, required for the subsequent PDF fit, is constructed by interfacing APPLgrid with MCFM. These fast grids may be used to compute the cross-sections for any PDF set other than the one used in the original calculation with a very small calculational overhead. Specifically, we have used MCFM v6.8 interfaced with the MCFM/APPLgrid bridge code and with the HOPPET [61] PDF evolution program. Note that in this respect MCFM v6.8 had to be patched to reproduce the results of v8.0, which in turn correspond to the results of Ref. [21], as we verified explicitly.
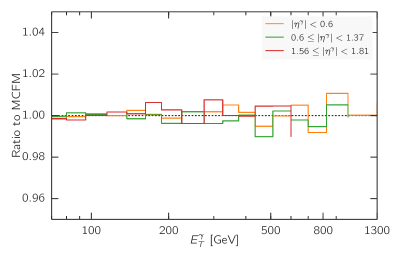
In order to obtain sufficiently high numerical precision, we ran MCFM in 10 batches with different random seeds and combined the resulting grids using the applgrid-combine script. This MCFM/APPLgrid computation was successfully benchmarked with the NLO code of Ref. [21], finding excellent agreement. In Fig. 3.2 we plot the ratio of the APPLgrid computations of the NLO QCD cross-section to the corresponding MCFM v6.8 result for the kinematics of the first three rapidity bins of the ATLAS 8 TeV measurement, using in both cases the NNPDF3.1 set as input. We find good agreement between the two methods within the uncertainties from the finite MC integration statistics, which are typically at the permille level.111These fast NLO APPLgrids, matching the selection cuts and the binning of the ATLAS 8 and 13 TeV direct photon production measurements, are available from the authors.
4 Results
In this section we present the main results of this work, namely the impact of the ATLAS direct photon production data at TeV on the NNPDF3.1 global analysis. NNPDF3.1 is the most up-to-date NNPDF release, including a wealth of new Tevatron and LHC datasets from processes such as Drell-Yan and pair-production and the transverse momentum of bosons. In contrast to previous fits, NNPDF3.1 independently parameterizes the charm content of the proton, eliminating any possible bias related to the assumption that the charm PDF is generated perturbatively [62].
In this context, an important difference of the present work as compared to the study of Ref. [13] is that the latter was based on the NNPDF2.1 fit, where the information on the gluon PDF was limited. This is not the case in NNPDF3.1, where the gluon PDF is already reasonably well constrained at medium and small- from the combination of jet, , and data, and therefore we expect the impact of the direct photon data on the gluon to be moderate.
Here we will also study the impact of the direct photon production data on fits based on reduced datasets, in particular the NNPDF3.1 no-LHC data and collider-only fits. We also compare other global PDF sets to the direct photon measurements, specifically MMHT14, CT14, and ABMP16. The corresponding comparisons with the ATLAS 13 TeV measurements as well as with the 13/8 cross-section ratio will then be presented in the next section.
4.1 Comparison to the experimental data
To begin with, using the NNLO QCD theory supplemented with LL electroweak corrections described in Sect. 3, we have computed the differential cross-sections for the distributions of the ATLAS 8 TeV measurement for different PDF sets. In all cases we use their default value for the strong coupling constant; for NNPDF3.1, MMHT14 and CT14 this is and for ABMP16, . In Fig. 4.1 we show the comparison of these theoretical predictions normalized to the central value of the ATLAS measurements, where the error bars on the experimental data are the sum in quadrature of the statistical and systematic uncertainties, while the error bands for the theory predictions include only the PDF uncertainties.
From the comparisons of Fig. 4.1 we see that across the first three rapidity bins, the various sets are in good agreement; in particular in the 3rd bin, NNPDF, CT14 and MMHT14 are very close to each other. We also find that the NNPDF3.1 and ABMP16 sets lead to a better description of the high region in the central bin. On the other hand, one can clearly observe in the most forward bin a large disagreement between theory and data, in particular for ABMP16.
These trends are further examined in Table 4.1, where we compare the total for the different PDF sets. We note that in this computation the experimental definition of the covariance matrix is used [63], as opposed to the definition [64] which is only used during the fitting. From Table 4.1 we see that none of the four PDF sets manage to describe the most forward rapidity bin in a satisfactory way. We have verified that this is still the case even when this bin is included in the PDF fit. We show in Appendix A that even upon the inclusion of the covariance matrix, the poor description of the still exists in the 4th rapidity bin. We therefore exclude this 4th rapidity bin from the analysis.
Then in Table LABEL:table:chi2_globalfits_nlo we show the same comparison but now using only NLO QCD theory and without the LL electroweak corrections. In this case we find that the in all bins is rather poor. Interestingly, the most forward rapidity bin exhibits a slight improvement in the values, which however, remain large. As the most forward rapidity bin corresponds to the small- region of one of the incoming partons, it would be interesting to verify if the theoretical description of this bin would be improved by including NLL resummation of direct photon production, similar as what was done in [65, 66] for the HERA data. For the three rapidity bins used in the fit, one finds a dramatic improvement in the description of the data upon including the higher-order QCD and EW effects. This comparison highlights the phenomenological importance of the recent NNLO QCD calculation, and why only now we can robustly include the direct photon measurements into the global PDF fits.
| 1st bin | 2nd bin | 3rd bin | 4th bin | Total | Total excluding | |
| 4th bin | ||||||
| NNPDF3.1 | 0.81 | 1.61 | 0.89 | 1.97 | 1.83 | 1.12 |
| MMHT14 | 1.94 | 2.49 | 1.02 | 2.19 | 2.31 | 1.89 |
| CT14 | 1.63 | 2.18 | 0.96 | 2.02 | 2.01 | 1.65 |
| ABMP16 | 1.38 | 2.70 | 1.27 | 7.78 | 3.50 | 1.91 |
![[Uncaptioned image]](/html/1802.03021/assets/x9.png)
4.3 Impact on fits based on reduced datasets
In addition to assessing the impact of the ATLAS direct photon production data when added to the NNPDF3.1 dataset, we have also studied its impact on fits using reduced datasets, specifically the NNPDF3.1 collider-only fit and no-LHC fits. The former excludes all DIS and Drell-Yan fixed-target data, with the motivation that collider observables might be cleaner and under better theoretical control, while the latter excludes all LHC measurements for specific applications such as in searches for BSM physics.
In the two cases, we find a good overall agreement between theory and data, as indicated in Table 4.6. For the fit without LHC data, the total is reduced from 1.49 to 1.00. Recall that in this fit the constraints on the medium and large- gluon are much looser, basically coming only from the Tevatron jet data, and thus one expects the impact of the ATLAS direct photon data to be more significant. For the collider only fit, the total is already very good to begin with, 0.94, and is further reduced to upon the addition of the photon data. This moderate improvement is consistent with the fact that the bulk of the gluon-sensitive datasets in NNPDF3.1 are already included in the collider-only dataset. Another interesting result from Table 4.6 is that in all cases an improved description of the three rapidity bins is obtained.
| PDF set | ||||
|---|---|---|---|---|
| 1st bin | 2nd bin | 3rd bin | Total | |
| NNPDF3.1 no LHC data | 1.26 | 2.07 | 0.96 | 1.49 |
| NNPDF3.1 no LHC data+ATLAS | 0.66 | 1.39 | 0.84 | 1.00 |
| NNPDF3.1 collider only | 0.89 | 1.29 | 0.68 | 0.94 |
| NNPDF3.1 collider only+ATLAS | 0.92 | 1.15 | 0.64 | 0.87 |
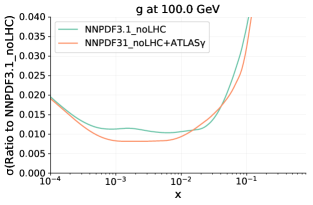
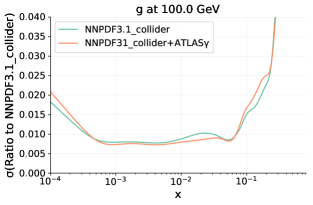
Next in Fig. 4.5 we show the same comparisons as in Fig. LABEL:fig:gluon_ratio but now for the NNPDF3.1 no-LHC and collider-only fits. In the case of the no-LHC fit, we find that the impact of adding the ATLAS photon data is larger than in the global fit, both in terms of the shift in the gluon central values and in the reduction of its PDF uncertainties. This is consistent with the fact that is less constrained in the no-LHC fit than in the global fit. The trend in central values is the same for the collider-only fits: moderate enhancement at medium followed by a suppression at large . The impact of the ATLAS photon data is also moderate at the level of PDF uncertainties in the collider-only fit.
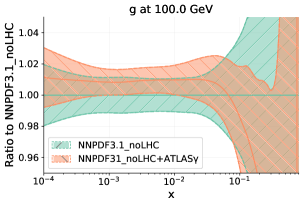
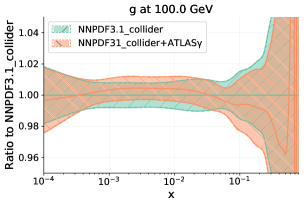
To summarize, the results of this study demonstrate that the qualitative impact of the ATLAS 8 TeV direct photon production data on the gluon PDF in the fits based on reduced datasets is consistent with that of the global analysis. In all cases, we find an improvement in the quantitative description of the ATLAS data, as shown in Table 4.6. Interestingly, we also find that the direct photon data prefer a softer gluon at large irrespective of the input dataset used, a trend that is similar to the one induced by the top-quark pair differential cross-sections.
5 Direct photon production at 13 TeV
In this section we present the comparison between state-of-the-art theoretical predictions and experimental data for the recent ATLAS measurements of direct photon production at 13 TeV [38]. The motivation is two-fold. On the one hand, we want to verify whether or not we can quantitatively describe direct photon production at 13 TeV, and in particular understand if the disagreement found for the most forward bin at 8 TeV (see Sect. 4.1) is also present at a higher center-of-mass energy. On the other hand, we aim to provide predictions for direct photon production at 13 TeV that include the constraints from the same process at 8 TeV: we will do this by using the NNPDF3.1+ATLAS fit constructed in the previous section.
To begin with, in Table 5.1 we provide the values for different NNLO PDF sets to the ATLAS 13 TeV measurements using the theory settings described in Sect. 3. We also include here the predictions using the NNPDF3.1+ATLAS set, which accounts for the constraints of the 8 TeV photon measurements. We find that the different PDF sets provide an equally satisfactory description of this dataset, with the total in all cases. In particular, we find an excellent description of the most forward rapidity bin (with the exception perhaps of ABMP16), in contrast to what was found at 8 TeV. One should note, however, that this measurement is based on a relatively small integrated luminosity, fb-1, and therefore its uncertainties are larger than for the 8 TeV case, explaining the reduced discrimination power.
| PDF set | |||||
|---|---|---|---|---|---|
| 1st bin | 2nd bin | 3rd bin | 4th bin | Total | |
| NNPDF3.1 | 0.68 | 0.53 | 0.28 | 0.47 | 0.65 |
| NNPDF3.1+ATLAS | 0.70 | 0.49 | 0.30 | 0.46 | 0.65 |
| MMHT14 | 0.81 | 0.73 | 0.27 | 0.45 | 0.70 |
| CT14 | 0.75 | 0.65 | 0.28 | 0.41 | 0.64 |
| ABMP16 | 0.82 | 0.89 | 0.20 | 1.56 | 1.05 |
As can be seen from Table 5.1, the differences in the values of between NNPDF3.1 and NNPDF3.1+ATLAS are small. This may be further observed in Fig. 4.1, where we compare the theory predictions for the 13 TeV data with both NNPDF3.1 and NNPDF3.1+ATLAS. In addition to the PDF uncertainties shown in the previous cases (darker bands), here we also include the scale uncertainties associated with the NNLO QCD calculation (lighter bands), as discussed below. The two PDF sets are in good agreement with each other and the limited statistics of the measurement do not allow us to discriminate among them. This can also be seen from the fact that the experimental uncertainties are significantly larger than the differences between the two theoretical predictions. It is also interesting to take a closer look at the most forward rapidity bin of the 13 TeV measurement, which in the 8 TeV case had to be excluded from the fit. Here instead we find reasonably good agreement between theory and data, although again, there are larger experimental errors in this bin and therefore one cannot conclude that the description of the 13 TeV data is better than at 8 TeV.
As mentioned above, we also indicate in Fig. 4.1 the scale uncertainties associated with the NNLO QCD calculation (shown as the lighter error bands) in addition to the standard PDF uncertainties. These scale uncertainties have been estimated using the standard practice of independently varying the renormalization and factorization scales by a factor of two. For the majority of bins, the scale uncertainty is , reaching a maximum of in the most forward rapidity bin at high . At NLO, we find the typical size of the scale uncertainty to be approximately double that of the NNLO one, thus compounding the requirement to have the NNLO predictions in order to adequately describe the direct photon data.
![[Uncaptioned image]](/html/1802.03021/assets/x14.png)
![[Uncaptioned image]](/html/1802.03021/assets/x15.png)
![[Uncaptioned image]](/html/1802.03021/assets/x16.png)
![[Uncaptioned image]](/html/1802.03021/assets/x17.png)
One of the main differences that arises in the comparison between data and theory at 8 TeV and 13 TeV, as we discussed, is that the most forward rapidity bin is poorly described in the former case, while it is reasonably well described in the latter. A possible way forward to understand the origin of this discrepancy is to take ratios of the cross-section measurements at the two centre-of-mass energies. Such ratios are useful since many theoretical and experimental systematic uncertainties cancel out [67], allowing us to elucidate possible issues arising for individual center-of-mass energies. With this motivation, we have constructed the following ratio
| (5.1) |
for those bins where both and overlap between the two center of mass energies, corresponding to a total of 47 bins. Since the experimental covariance matrix is not available at 13 TeV and the description of the 4th rapidity bin is poor at 8 TeV both with and without the covariance matrix, the uncertainty on the ratio Eq. (5.1) is obtained by adding in quadrature the total experimental errors in the numerator and the denominator. For the theoretical calculation of Eq. (5.1), the correlation between the PDF uncertainties at 8 TeV and 13 TeV is accounted for.
In Fig. 4.1 we show a comparison between the experimental measurements of the ratio, Eq. (5.1), with the corresponding calculations using the NNPDF3.1 and NNPDF3.1+ATLAS sets, normalized to the central value of the experimental data. Here the theoretical uncertainty band includes only the contribution from the PDF uncertainties. From this comparison we find that there is good agreement between data and theory for all the bins, including for the most forward rapidity bin which was problematic at 8 TeV. The results of Fig. 4.1 suggest that the underlying reason for the disagreement at 8 TeV in the most forward bin, either an inadequacy of the theory calculation or some issue with the experimental measurement, is a common effect between the two center of mass energies which mostly cancels out when computing their ratio.
![[Uncaptioned image]](/html/1802.03021/assets/x18.png)
![[Uncaptioned image]](/html/1802.03021/assets/x19.png)
![[Uncaptioned image]](/html/1802.03021/assets/x20.png)
![[Uncaptioned image]](/html/1802.03021/assets/x21.png)
In order to further understand how the cross-section ratio Eq. (5.1) behaves as a function of and , in Fig. 4.1 we show the same comparison as in Fig. 4.1 but this time without normalizing to the experimental data. We can see that there is excellent agreement between theory and data in all rapidity bins, both at low and high values of ; moreover, we can also observe that the trend in the data-theory agreement is consistent across all the rapidity bins. These results therefore compound the argument that there is some inadequacy in either the theory or the experimental analysis for the most forward bin at TeV.
![[Uncaptioned image]](/html/1802.03021/assets/x22.png)
![[Uncaptioned image]](/html/1802.03021/assets/x23.png)
![[Uncaptioned image]](/html/1802.03021/assets/x24.png)
![[Uncaptioned image]](/html/1802.03021/assets/x25.png)
In order to substantiate this point, in Table 5.2 we provide the values for the ratio of cross-sections between 13 TeV and 8 TeV, Eq. (5.1), with different input PDFs. As we can see from this comparison, all PDF sets are in agreement with the cross-section ratios, both for the total dataset and for the individual rapidity bins. In particular, we find that the description of the cross-section ratio in the most forward bin is the best with NNPDF3.1+ATLAS. Table 5.2 provides further evidence that the origin of the disagreement between theory and data at 8 TeV in this bin is common with the 13 TeV case, since it mostly cancels in the ratio.
| PDF set | |||||
|---|---|---|---|---|---|
| 1st bin | 2nd bin | 3rd bin | 4th bin | Total | |
| NNPDF3.1 | 0.66 | 0.75 | 0.79 | 0.45 | 0.68 |
| NNPDF3.1+ATLAS | 0.58 | 0.72 | 0.77 | 0.41 | 0.64 |
| MMHT14 | 0.96 | 0.85 | 0.83 | 0.50 | 0.82 |
| CT14 | 0.90 | 0.80 | 0.80 | 0.52 | 0.79 |
| ABMP16 | 0.84 | 0.90 | 0.95 | 0.69 | 0.87 |
6 Summary
The quantitative understanding of the detailed features of photon production at the LHC is of crucial importance for a wide range of analyses, from searches for Higgs decays and BSM resonances to precision Standard Model measurements. In this work, we have revisited the possibility of using direct photon production from the LHC to constrain the parton distribution functions of the proton within a global QCD fit. By using state-of-the-art NNLO QCD calculations combined with LL electroweak corrections, we have quantified the impact of the ATLAS 8 TeV photon production data on the gluon PDF from the NNPDF3.1 global analysis.
Our results indicate that the LHC direct photon production data leads to both a moderate reduction of the gluon uncertainties at medium- and a preference for a somewhat softer central value at large-. These effects are more marked when the direct photon data is added on top of fits based on reduced datasets, in particular the NNPDF3.1 no-LHC fit. We have also demonstrated that including both NNLO QCD and LL electroweak corrections is required in order to achieve a quantitative agreement with the experimental data for the entire kinematic range in and . Moreover, we find that the constraints from the direct photon data are consistent with those of other gluon-sensitive measurements included in NNPDF3.1 such as the , inclusive jets, and differential distributions.
Here we have also provided theoretical predictions for the ATLAS measurements of direct photon production at 13 TeV as well as for the ratio of cross-sections between 13 TeV and 8 TeV. In this case, we find that due to the relatively small integrated luminosity used for the 13 TeV measurement, its discrimination power is rather limited. It would therefore be important to repeat the 13 TeV analysis using the full integrated luminosity of Run II, in order to complement the information provided by the 8 TeV data. In this respect, it is essential that the experimental collaborations make public the covariance matrices of their measurements, else their lack of availability limits the physics output that can be extracted from their own data.
Our results demonstrate that there is no reason, neither in principle nor in practice, for excluding collider direct photon data from a global PDF analysis. Indeed, the most precise LHC measurements available agree well with state-of-the-art theoretical predictions, and the latter can be included in global PDF analyses using fast interpolation tables. The information provided by the ATLAS 8 TeV direct photon measurements turns out to be consistent with the constraints provided by other gluon-sensitive datasets included in NNPDF3.1, and leads to a moderate reduction of the gluon uncertainties. For these reasons, collider direct photon production should be rightfully restored to its well-deserved position as a full member of the global PDF analysis toolbox.
The main output of this work, the NNPDF3.1+ATLAS NNLO fit, is available in the LHAPDF6 format [60] from the NNPDF collaboration webpage
http://nnpdf.mi.infn.it/for-users/unpolarized-pdf-sets/
with the file name NNPDF31_nnlo_as_0118_directphoton. In addition, the fast NLO tables computed using MCFM and APPLgrid for the ATLAS 8 TeV and 13 TeV direct photon measurements produced in this work, together with the corresponding NNLO/NLO -factors Eq. (3.5), are also publicly available from the same website.
Acknowledgments
We thank Ulla Blumenschein, Ana Cueto Gómez, Jan Kretzschmar, Claudia Glasman, Matthias Schott, and Juan Terrón Cuadrado for information and discussions concerning the ATLAS direct photon measurements. J. R. and E. S. are grateful to our colleagues of the NNPDF collaboration for their support and useful discussions. E. S. thanks Rhorry Gauld for providing useful scripts and Alberto Guffanti for help with the production of APPLgrids. J. R. and E. S. are supported by the ERC Starting Grant “PDF4BSM”. The work of J. R. is also supported by the Dutch Organization for Scientific Research (NWO). C.W. is supported by a National Science Foundation CAREER award PHY-1652066. This manuscript has been authored by Fermi Research Alliance, LLC under Contract No. DE-AC02-07CH11359 with the U.S. Department of Energy, Office of Science, Office of High Energy Physics.
Appendix A The impact of correlations in the systematic uncertainties
The baseline results of this work, presented in Sect. 4, have been obtained by adding in quadrature the statistical and experimental uncertainties, except for the luminosity uncertainty which is treated as fully correlated among all the data bins. As mentioned in Sect. 2, we only realised after the completion of this work that the full breakdown of the experimental systematic uncertainties corresponding to the ATLAS 8 TeV measurement had just been posted in HepData. The same breakdown of the experimental systematic uncertainties, however, is not yet available for the 13 TeV data. In this appendix, we study the impact of accounting for the effects of the correlations among the systematic uncertainties of the 8 TeV ATLAS data both at the level of parton distributions and of the values of the .
We will consider here two scenarios for the correlation model. In the first one, all sources of systematic uncertainty are fully correlated among the data bins. In the second one, a subset of sources of systematic errors will be considered as uncorrelated between data bins. Specifically, using the notation used in the corresponding HepData entry222https://hepdata.net/record/ins1457605, the following sources are treated as point-to-point uncorrelated: sysPhotonID, sysPhotonIsolation, sysBackgroundID, sysBackgroundIsolation sysEnergyResolution. The reason for these two choices is that, initially, the ATLAS analyzers recommended to treat all errors as fully correlated, but at a later stage they provided us with an updated recommendation for their correlation model based on the decorrelation of some systematic sources.
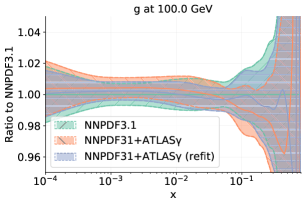
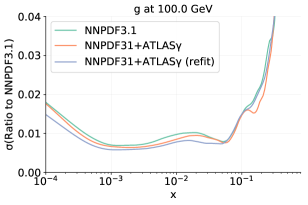
Let us first of all discuss the impact of the experimental correlations at the PDF level. We will show results with the first correlation model, where all sources of systematic uncertainties are fully correlated bin-to-bin. In Fig. A.1 we show the same comparison as in Fig. LABEL:fig:gluon_ratio, now adding the results of the fit including the correlations between the experimental systematic uncertainties (labelled as “refit”). Reassuringly, the results are reasonably similar as compared to the fit where these correlations are neglected, though there are some small differences. In particular, concerning the PDF central values, the shift as compared to NNPDF3.1 is reduced once the correlations are accounted for. At the level of uncertainties, we also find a similar pattern as the one shown in Fig. LABEL:fig:gluon_ratio, with the main differences being that the PDF error reduction is a bit more marked for and is somewhat less important for larger values of . All in all, the qualitative impact of the ATLAS 8 TeV direct photon data on the PDFs is similar irrespective of whether or not one includes the information on correlations in the definition.
Turning now to the comparison at the fit quality level, in Table A.1 we show the values of the per data point including the information on the correlation of systematic uncertainties. We display the results for three fits: the baseline NNPDF3.1, the NNPDF3.1+ATLAS fit presented in Sect. 4, and the corresponding fit using the correlated for the minimisation (labelled as “refit”) and shown in Fig. A.1. Note that the first two of these fits have been obtained from the minimisation of which does not include the information on the correlations of experimental systematic uncertainties. The consistent values of the for these two fits were reported in Table LABEL:table:chi2_NNPDF_comp, where excellent agreement with the data was found.
| 1st bin | 2nd bin | 3rd bin | Total | |
| NNPDF3.1 | 1.52 | 3.95 | 2.57 | 3.03 |
| NNPDF31+ATLAS | 1.40 | 3.90 | 2.53 | 3.02 |
| NNPDF31+ATLAS (refit) | 1.51 | 3.93 | 2.57 | 3.00 |
From the comparison between the results of Tables A.1 and LABEL:table:chi2_NNPDF_comp we find that the fit quality is poorer once the information on correlated systematics is accounted for. In particular one gets a total for the NNPDF3.1+ATLAS fit as compared to in the corresponding case where these correlations are neglected. The description of the first rapidity bin is still satisfactory, but not that of the second and third rapidity bins. While the origin of these poor values is still not understood, similar issues have been reported in the case of the ATLAS inclusive jet measurements by different groups (see e.g. [68, 10]). Here we have tried to vary the nominal correlation model, for instance by neglecting the correlations between different rapidity bins, but this does not modify the numbers in Table A.1 in any significant way.
We have also verified that the most forward rapidity bin is still very poorly described once the full information on experimental correlations is taken into account. Using NNPDF3.1 as input, one finds for the fourth rapidity bin of the ATLAS 8 TeV measurement, a number which is mostly unchanged when this bin is included in the fit. This result provides further evidence in support of our decision to exclude this bin from our baseline fits.
Let us now turn to discuss the case of the second correlation model mentioned above, namely the one where a selected number of sources of systematic error are treated as uncorrelated. In Table A.2 we show the same comparison as in Table A.1 where now the numbers in the second row have been computed using the partial decorrelation model for the experimental covariance matrix. We can observe a marked improvement as compared to the case where all systematic errors are treated as fully correlated among data bins, although the data/theory agreement is still not ideal. This result suggests that a further study of the correlation model of this measurement might further improve the numerical agreement between theory and data, for example in the case of a partial decorrelation of some of the other systematic sources. Such a study, which might be advantageous also for other LHC measurements such as jet production, is however beyond the scope of this paper.
| 1st bin | 2nd bin | 3rd bin | Total | |
| NNPDF3.1 | 1.52 | 3.95 | 2.57 | 3.03 |
| NNPDF3.1 (part. decorr.) | 1.09 | 2.64 | 1.88 | 1.98 |
To summarise, we find that once the information on the experimental correlated systematics is included in the definition, the differences at the PDF level are rather moderate and consistent with our baseline results, but that the numerical values of the are higher. We also find that these values are rather sensitive to the underlying correlation model, in particular to whether some specific sources of systematic errors are correlated or not between data bins. These poor values deserve further investigation in the future in order to elucidate their underlying origin. It is in any case reassuring that the impact of the ATLAS direct photon data at the PDF level is mostly unaffected by this, validating the results presented in Sects. 4 and 5 of this work.
Appendix B Reweighting study
An alternative strategy to quantify the impact of the ATLAS direct photon production measurements on the NNPDF3.1 global analysis is the Bayesian reweighting procedure [36, 37]. This technique allows one to determine the effects of a new dataset onto a Monte Carlo PDF set without refitting, and is therefore less computationally intensive. The only required inputs are the values of the figure of merit to the new dataset computed using each of the replicas of the prior PDF set.
Given a dataset with data points, the Bayesian reweighting procedure assigns a weight to the -th Monte Carlo replica given by
| (B.1) |
so that replicas that lead to theoretical predictions in disagreement with the new dataset (and that thus lead to larger ) receive a small weight and are thus effectively discarded. The reweighting procedure also defines the effective number of replicas, , given by the Shannon entropy:
| (B.2) |
which allow us to quantify how strongly the new data restricts the prior PDF set by how many replicas are left. The interpretation of Eq. (B.2) is that the smaller the ratio , the higher the amount of new information that is being added by this specific experiment into the fit.
Using identical experimental data, kinematic cuts, and theoretical settings adopted to produce the NNPDF3.1+ATLAS set described in Sect. 4, we have reweighted the NNPDF3.1 NNLO set with replicas using Eq. (B.1). The resulting reweighted PDF set is denoted by NNPDF3.1+ATLAS(rw). This reweighted set has been subsequently unweighted to a reduced number of replicas equal to the effective number of replicas , which can then be directly compared with the results of Sect. 4. For the total ATLAS direct photon production 8 TeV dataset, we find that . In other words, , reflecting the moderate impact of the direct photon data on the NNPDF3.1 analysis
In Table B.1 we provide the same comparison as in Table LABEL:table:chi2_NNPDF_comp, now adding as well the values corresponding to NNPDF3.1+ATLAS(rw) set. We also indicate the value for corresponding to the total dataset. Note that we evaluate the reweighted in each of the rapidity bin using the weights computed from the full dataset. The overall agreement between the fitted the reweighted versions of NNPDF3.1+ATLAS(rw) is reasonably good, with residual differences traced back to the moderate loss of information involved in the reweighting. From Table B.1 we observe that the value of for the ATLAS direct photon data is 1.12 before the fit, reduced to 0.96 in the fit and 1.03 after reweighting, so both methods yield consistent results taking into account the statistical fluctuations of the itself.
| NNPDF3.1 | NNPDF3.1+ATLAS (fit) | NNPDF3.1+ATLAS (rw) | ||
|---|---|---|---|---|
| 1st bin | 0.81 | 0.66 | 0.71 | - |
| 2nd bin | 1.61 | 1.37 | 1.53 | - |
| 3rd bin | 0.89 | 0.82 | 0.88 | - |
| Total | 1.12 | 0.96 | 1.03 | 91 |
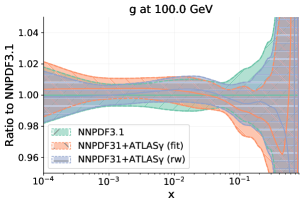
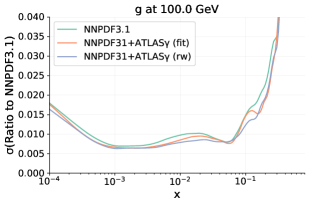
Concerning the comparison between fitting and reweighting at the PDF level, in Fig. B.1 we show an updated version of Fig. LABEL:fig:gluon_ratio now adding also the results of the NNPDF3.1+ATLAS(rw) set. We see that the results of both gluons are close to each other, and in particular that both the fitted and reweighted versions of NNPDF3.1+ATLAS(rw) exhibit the clear preference for a somewhat softer gluon at large . In terms of the gluon PDF uncertainty, also here the results of the fitted and reweighted sets are reasonably similar. Note that in particular in the large- region, , the reduction of the PDF uncertainties as compared to the baseline determined using the two methods is identical.
To summarize, the fitted and the reweighted versions of the NNPDF3.1+ATLAS PDF set are in good agreement with each other. This agreement could be further improved if a larger prior would have been used, specifically the NNPDF3.1 NNLO set with replicas. This is however not required here, since our goal was limited to providing a validation of the qualitative features of the fit results by means of an independent technique.
References
- [1] S. Forte and G. Watt, Progress in the Determination of the Partonic Structure of the Proton, Ann.Rev.Nucl.Part.Sci. 63 (2013) 291, [1301.6754].
- [2] J. Butterworth et al., PDF4LHC recommendations for LHC Run II, J. Phys. G43 (2016) 023001, [1510.03865].
- [3] J. Rojo et al., The PDF4LHC report on PDFs and LHC data: Results from Run I and preparation for Run II, J. Phys. G42 (2015) 103103, [1507.00556].
- [4] J. Gao, L. Harland-Lang and J. Rojo, The Structure of the Proton in the LHC Precision Era, 1709.04922.
- [5] J. Rojo, Constraints on parton distributions and the strong coupling from LHC jet data, Int. J. Mod. Phys. A30 (2015) 1546005, [1410.7728].
- [6] M. Czakon, N. P. Hartland, A. Mitov, E. R. Nocera and J. Rojo, Pinning down the large-x gluon with NNLO top-quark pair differential distributions, JHEP 04 (2017) 044, [1611.08609].
- [7] R. Boughezal, A. Guffanti, F. Petriello and M. Ubiali, The impact of the LHC Z-boson transverse momentum data on PDF determinations, JHEP 07 (2017) 130, [1705.00343].
- [8] R. Gauld and J. Rojo, Precision determination of the small- gluon from charm production at LHCb, Phys. Rev. Lett. 118 (2017) 072001, [1610.09373].
- [9] R. Gauld, J. Rojo and E. Slade, The small-x gluon from forward charm production: implications for a 100 TeV proton collider, in 25th International Workshop on Deep Inelastic Scattering and Related Topics (DIS 2017) Birmingham, UK, April 3-7, 2017, 2017, 1705.04217.
- [10] NNPDF collaboration, R. D. Ball et al., Parton distributions from high-precision collider data, Eur. Phys. J. C77 (2017) 663, [1706.00428].
- [11] E. R. Nocera and M. Ubiali, Constraining the gluon PDF at large x with LHC data, 2017, 1709.09690, http://inspirehep.net/record/1627625/files/arXiv:1709.09690.pdf.
- [12] R. Ichou and D. d’Enterria, Sensitivity of isolated photon production at TeV hadron colliders to the gluon distribution in the proton, Phys. Rev. D82 (2010) 014015, [1005.4529].
- [13] D. d’Enterria and J. Rojo, Quantitative constraints on the gluon distribution function in the proton from collider isolated-photon data, Nucl. Phys. B860 (2012) 311–338, [1202.1762].
- [14] L. Bourhis, M. Fontannaz and J. P. Guillet, Quarks and gluon fragmentation functions into photons, Eur. Phys. J. C2 (1998) 529–537, [hep-ph/9704447].
- [15] M. Diemoz, F. Ferroni, E. Longo and G. Martinelli, Parton Densities from Deep Inelastic Scattering to Hadronic Processes at Super Collider Energies, Z. Phys. C39 (1988) 21.
- [16] P. N. Harriman, A. D. Martin, W. J. Stirling and R. G. Roberts, Parton distributions extracted from data on deep-inelastic lepton scattering, prompt photon production, and the drell-yan process, Phys. Rev. D 42 (Aug, 1990) 798–810.
- [17] J. G. Morfin and W.-K. Tung, Parton distributions from a global QCD analysis of deep inelastic scattering and lepton pair production, Z. Phys. C52 (1991) 13–30.
- [18] L. A. Harland-Lang, A. D. Martin, P. Motylinski and R. S. Thorne, Parton distributions in the LHC era: MMHT 2014 PDFs, Eur. Phys. J. C75 (2015) 204, [1412.3989].
- [19] S. Dulat, T.-J. Hou, J. Gao, M. Guzzi, J. Huston, P. Nadolsky et al., New parton distribution functions from a global analysis of quantum chromodynamics, Phys. Rev. D93 (2016) 033006, [1506.07443].
- [20] S. Alekhin, J. Blümlein, S. Moch and R. Placakyte, Parton Distribution Functions, and Heavy-Quark Masses for LHC Run II, Phys. Rev. D96 (2017) 014011, [1701.05838].
- [21] J. M. Campbell, R. K. Ellis and C. Williams, Direct Photon Production at Next to Next to Leading Order, Phys. Rev. Lett. 118 (2017) 222001, [1612.04333].
- [22] T. Becher and X. Garcia i Tormo, Electroweak Sudakov effects in and production at large transverse momentum, Phys. Rev. D88 (2013) 013009, [1305.4202].
- [23] ATLAS collaboration, G. Aad et al., Measurement of the inclusive isolated prompt photon cross section in pp collisions at TeV with the ATLAS detector, JHEP 08 (2016) 005, [1605.03495].
- [24] S. Frixione, Isolated photons in perturbative QCD, Phys.Lett. B429 (1998) 369, [hep-ph/9801442].
- [25] ATLAS collaboration, M. Aaboud et al., Search for resonances in diphoton events at =13 TeV with the ATLAS detector, JHEP 09 (2016) 001, [1606.03833].
- [26] ATLAS collaboration, M. Aaboud et al., Search for new phenomena in high-mass diphoton final states using 37 fb-1 of proton–proton collisions collected at TeV with the ATLAS detector, Submitted to: Phys. Lett. (2017) , [1707.04147].
- [27] Search for high-mass z resonances in proton–proton collisions at s=8 and 13 tev using jet substructure techniques, Physics Letters B (2017) .
- [28] ATLAS collaboration, M. Aaboud et al., Study of and production in collisions at TeV and search for anomalous quartic gauge couplings with the ATLAS experiment, Eur. Phys. J. C77 (2017) 646, [1707.05597].
- [29] CMS collaboration, V. Khachatryan et al., Measurement of electroweak-induced production of W with two jets in pp collisions at TeV and constraints on anomalous quartic gauge couplings, JHEP 06 (2017) 106, [1612.09256].
- [30] CMS collaboration, V. Khachatryan et al., Measurement of the production cross section in pp collisions at 8 TeV and limits on anomalous and trilinear gauge boson couplings, Phys. Lett. B760 (2016) 448–468, [1602.07152].
- [31] ATLAS collaboration, G. Aad et al., Evidence of Production in pp Collisions at TeV and Limits on Anomalous Quartic Gauge Couplings with the ATLAS Detector, Phys. Rev. Lett. 115 (2015) 031802, [1503.03243].
- [32] CMS collaboration, A. M. Sirunyan et al., Search for new physics in the monophoton final state in proton-proton collisions at sqrt(s) = 13 TeV, 1706.03794.
- [33] CMS collaboration, A. M. Sirunyan et al., Search for supersymmetry in events with at least one photon, missing transverse momentum, and large transverse event activity in proton-proton collisions at TeV, JHEP 12 (2017) 142, [1707.06193].
- [34] ATLAS collaboration, M. Aaboud et al., Search for dark matter in association with a Higgs boson decaying to two photons at = 13 TeV with the ATLAS detector, 1706.03948.
- [35] CMS collaboration, A. M. Sirunyan et al., Search for associated production of dark matter with a Higgs boson decaying to or at TeV, JHEP 10 (2017) 180, [1703.05236].
- [36] The NNPDF collaboration, R. D. Ball et al., Reweighting NNPDFs: the W lepton asymmetry, Nucl. Phys. B849 (2011) 112–143, [1012.0836].
- [37] R. D. Ball, V. Bertone, F. Cerutti, L. Del Debbio, S. Forte et al., Reweighting and Unweighting of Parton Distributions and the LHC W lepton asymmetry data, Nucl.Phys. B855 (2012) 608–638, [1108.1758].
- [38] ATLAS collaboration, M. Aaboud et al., Measurement of the cross section for inclusive isolated-photon production in collisions at TeV using the ATLAS detector, 1701.06882.
- [39] CDF collaboration, D. Acosta et al., Comparison of the isolated direct photon cross sections in collisions at 1.8 TeV and 0.63 TeV, Phys. Rev. D65 (2002) 112003, [hep-ex/0201004].
- [40] D0 collaboration, V. M. Abazov et al., The ratio of the isolated photon cross sections at GeV and 1800 GeV, Phys. Rev. Lett. 87 (2001) 251805, [hep-ex/0106026].
- [41] CDF collaboration, F. Abe et al., A Precision measurement of the prompt photon cross-section in collisions at TeV, Phys. Rev. Lett. 73 (1994) 2662–2666.
- [42] CDF collaboration, F. Abe et al., A Prompt photon cross-section measurement in collisions at TeV, Phys. Rev. D48 (1993) 2998–3025.
- [43] CDF collaboration, F. Abe et al., Measurement of the isolated prompt photon cross-sections in collisions at TeV, Phys. Rev. Lett. 68 (1992) 2734–2738.
- [44] D0 collaboration, B. Abbott et al., The isolated photon cross-section in collisions at TeV, Phys. Rev. Lett. 84 (2000) 2786–2791, [hep-ex/9912017].
- [45] D0 collaboration, S. Abachi et al., Isolated photon cross-section in the central and forward rapidity regions in collisions at TeV, Phys. Rev. Lett. 77 (1996) 5011–5015, [hep-ex/9603006].
- [46] CDF collaboration, T. Aaltonen et al., Measurement of the cross section for direct-photon production in association with a heavy quark in collisions at = 1.96 TeV, Phys. Rev. Lett. 111 (2013) 042003, [1303.6136].
- [47] CDF collaboration, T. Aaltonen et al., Measurement of the Inclusive Isolated Prompt Photon Cross Section in Collisions at TeV using the CDF Detector, Phys. Rev. D80 (2009) 111106, [0910.3623].
- [48] D0 collaboration, V. M. Abazov et al., Measurement of the isolated photon cross section in collisions at = 1.96 TeV, Phys. Lett. B639 (2006) 151–158, [hep-ex/0511054].
- [49] ATLAS collaboration, G. Aad et al., Measurement of the inclusive isolated prompt photon cross section in collisions at TeV with the ATLAS detector, Phys. Rev. D83 (2011) 052005, [1012.4389].
- [50] ATLAS collaboration, G. Aad et al., Measurement of the inclusive isolated prompt photon cross-section in collisions at 7 TeV using 35 pb-1 of ATLAS data, Phys. Lett. B706 (2011) 150–167, [1108.0253].
- [51] ATLAS collaboration, G. Aad et al., Measurement of the inclusive isolated prompt photons cross section in pp collisions at TeV with the ATLAS detector using 4.6fb-1, Phys. Rev. D89 (2014) 052004, [1311.1440].
- [52] CMS collaboration, S. Chatrchyan et al., Measurement of the Differential Cross Section for Isolated Prompt Photon Production in pp Collisions at 7 TeV, Phys.Rev. D84 (2011) 052011, [1108.2044].
- [53] CMS collaboration, V. Khachatryan et al., Measurement of the Isolated Prompt Photon Production Cross Section in Collisions at TeV, Phys. Rev. Lett. 106 (2011) 082001, [1012.0799].
- [54] T. Carli et al., A posteriori inclusion of parton density functions in NLO QCD final-state calculations at hadron colliders: The APPLGRID Project, Eur.Phys.J. C66 (2010) 503, [0911.2985].
- [55] Z. Bern, G. Diana, L. J. Dixon, F. Febres Cordero, S. Hoche, H. Ita et al., Driving Missing Data at Next-to-Leading Order, Phys. Rev. D84 (2011) 114002, [1106.1423].
- [56] J. M. Campbell, R. K. Ellis, Y. Li and C. Williams, Predictions for diphoton production at the LHC through NNLO in QCD, JHEP 07 (2016) 148, [1603.02663].
- [57] J. M. Campbell, R. K. Ellis and C. Williams, Driving missing data at the LHC: NNLO predictions for the ratio of and , Phys. Rev. D96 (2017) 014037, [1703.10109].
- [58] T. Becher and X. Garcia i Tormo, Addendum: Electroweak Sudakov effects in W, Z and gamma production at large transverse momentum, Phys. Rev. D92 (2015) 073011, [1509.01961].
- [59] R. Boughezal, J. M. Campbell, R. K. Ellis, C. Focke, W. Giele, X. Liu et al., Color singlet production at NNLO in MCFM, Eur. Phys. J. C77 (2017) 7, [1605.08011].
- [60] A. Buckley, J. Ferrando, S. Lloyd, K. Nordström, B. Page et al., LHAPDF6: parton density access in the LHC precision era, Eur.Phys.J. C75 (2015) 132, [1412.7420].
- [61] G. P. Salam and J. Rojo, A Higher Order Perturbative Parton Evolution Toolkit (HOPPET), Comput. Phys. Commun. 180 (2009) 120–156, [0804.3755].
- [62] NNPDF collaboration, R. D. Ball, V. Bertone, M. Bonvini, S. Carrazza, S. Forte, A. Guffanti et al., A Determination of the Charm Content of the Proton, Eur. Phys. J. C76 (2016) 647, [1605.06515].
- [63] R. D. Ball et al., Parton Distribution Benchmarking with LHC Data, JHEP 04 (2013) 125, [1211.5142].
- [64] The NNPDF collaboration, R. D. Ball et al., Fitting Parton Distribution Data with Multiplicative Normalization Uncertainties, JHEP 05 (2010) 075, [0912.2276].
- [65] R. D. Ball, V. Bertone, M. Bonvini, S. Marzani, J. Rojo and L. Rottoli, Parton distributions with small-x resummation: evidence for BFKL dynamics in HERA data, Eur. Phys. J. C78 (2018) 321, [1710.05935].
- [66] xFitter Developers’ Team collaboration, H. Abdolmaleki et al., Impact of low- resummation on QCD analysis of HERA data, 1802.00064.
- [67] M. L. Mangano and J. Rojo, Cross Section Ratios between different CM energies at the LHC: opportunities for precision measurements and BSM sensitivity, JHEP 1208 (2012) 010, [1206.3557].
- [68] L. A. Harland-Lang, A. D. Martin and R. S. Thorne, The Impact of LHC Jet Data on the MMHT PDF Fit at NNLO, Eur. Phys. J. C78 (2018) 248, [1711.05757].