The ALMA-PILS survey: The sulphur connection between protostars and comets: IRAS 16293–2422 B and 67P/Churyumov–Gerasimenko
Abstract
The evolutionary past of our Solar System can be pieced together by comparing analogous low-mass protostars with remnants of our Protosolar Nebula – comets. Sulphur-bearing molecules may be unique tracers of the joint evolution of the volatile and refractory components. ALMA Band data from the large unbiased Protostellar Interferometric Line Survey (PILS) are used to search for S-bearing molecules in the outer disc-like structure, au from IRAS 16293–2422 B, and are compared with data on 67P/C–G stemming from the ROSINA instrument aboard Rosetta. Species such as SO2, SO, OCS, CS, H2CS, H2S and CH3SH are detected via at least one of their isotopologues towards IRAS 16293–2422 B. The search reveals a first-time detection of OC33S towards this source and a tentative first-time detection of C36S towards a low-mass protostar. The data show that IRAS 16293–2422 B contains much more OCS than H2S in comparison to 67P/C–G; meanwhile, the SO/SO2 ratio is in close agreement between the two targets. IRAS 16293–2422 B has a CH3SH/H2CS ratio in range of that of our Solar System (differences by a factor of ). It is suggested that the levels of UV radiation during the initial collapse of the systems may have varied and have potentially been higher for IRAS 16293-2422 B due to its binary nature; thereby, converting more H2S into OCS. It remains to be conclusively tested if this also promotes the formation of S-bearing complex organics. Elevated UV levels of IRAS 16293-2422 B and a warmer birth cloud of our Solar System may jointly explain the variations between the two low-mass systems.
keywords:
astrochemistry – stars: protostars – comets: general – ISM: molecules.1 Introduction
Sulphur-bearing molecules have been detected in many interstellar environments from diffuse clouds to star-forming regions and rocky bodies in our Solar System. It is likely that the sulphur detected in cometary studies has its roots in the earliest diffuse phases of the interstellar medium (e.g., Lucas & Liszt 2002). However, in comparison to diffuse clouds, observations show the total sulphur budget of dense cores to be depleted by several orders of magnitude (Ruffle et al., 1999). This puzzle remains unresolved; and the missing sulphur is yet to be conclusively identified (e.g., Anderson et al. 2013). Such depletion is unique to sulphur, making it a key element in understanding the evolution of volatile and refractory components between the diffuse and dense phases.
Some of the first detections of interstellar sulphur came in the 1970s and 1980s when molecules such as CS, OCS, H2S, SO, H2CS and SO2 were observed in the gas phase towards Sgr B2 and Orion A (Penzias et al., 1971; Jefferts et al., 1971; Drdla, Knapp & van Dishoeck, 1989; Minh et al., 1990; Pastor et al., 1991). These detections kicked off the study of its chemistry, which suggested that in thin clouds, sulphur is predominantly in the form of S+ ions (Oppenheimer & Dalgarno, 1974) and likely undergoes partial incorporation into refractories. Meanwhile, in dense clouds it is mostly neutral and gets incorporated into the observed volatiles via reactions with H (Oppenheimer & Dalgarno, 1974) and grain-surface reactions (Duley, Millar & Williams, 1980). Subsequent chemical models quickly showed that the net sulphur budget as seen in volatiles is severely depleted in dense clouds (Prasad & Huntress, 1982). Some of the sulphur is incorporated into carbon chains such as CnS (with ; Wlodek, Bohme & Herbst 1988; Smith et al. 1988; Millar & Herbst 1990; Hirahara et al. 1992). However, since the ionization potential of sulphur is lower than that of carbon, S+ may exist in regions where most of carbon is neutral, which may lead to the formation of S2 (suggested early on by Duley, Millar & Williams 1980). In photodissociation regions (PDRs), it appears that sulphur is found in the form of CS and HCS+ (Jansen, van Dishoeck & Black, 1994; Goicoechea et al., 2006).
Sulphur-bearing species are also seen in solid form: OCS ice was the first to be detected (Palumbo, Tielens & Tokunaga, 1995; Palumbo, Geballe & Tielens, 1997; Aikawa et al., 2012) and the detection of solid SO2 followed (Boogert et al., 1997). These ices have been seen in absorption against the bright high-mass W33A protostar and account for per cent of the elemental sulphur abundance. Other sulphur-bearing ices are yet to be detected (Boogert, Gerakines & Whittet, 2015). Such simple sulphur-bearing volatiles are likely formed via a combination of gas-phase reactions and grain-surface chemistry. It remains unclear where the remaining sulphur is at cold, dark prestellar conditions. More recently, sulphur-bearing complex organics have been detected. The S-containing methanol-analog, CH3SH, has been detected in the gas phase towards the cold core B1 (Cernicharo et al., 2012); the hot core G327.3–0.6 (Gibb et al., 2000); Orion KL (Kolesniková et al., 2014); the O-type protostar IRAS 16547–4247 (Zapata et al., 2015); Sgr B2(N2) (by Linke, Frerking & Thaddeus 1979 and in the EMoCA survey by Müller et al. 2016); and IRAS 16293–2422 (Majumdar et al., 2016). The detection of the S-containing ethanol-analog, C2H5SH, has been reported towards Orion KL (Kolesniková et al., 2014); while searches towards Sgr B2(N2) remain uncertain (Müller et al., 2016). Such S-bearing complex organics can only form on the surfaces of grains.
Sulphur-bearing species have also been detected in numerous places in the Solar System and several comets. A large reservoir of sulphur is found on Jupiter’s moon Io, which has an atmosphere dominated by SO2, as a result of active volcanic eruptions (e.g., Jessup, Spencer & Yelle 2007; Moullet et al. 2008, 2013). Contrary to the interstellar medium (ISM), the majority of cometary detections of sulphur-bearing molecules belong to H2S and S2 (A’Hearn, Schleicher & Feldman, 1983; Mumma & Charnley, 2011). Towards the brightest comet – Hale–Bopp, a greater diversity has been observed, including OCS, SO2 and H2CS. The brighter comets C/2012 F6 (Lemmon) and C/2014 Q2 (Lovejoy) have also been shown to contain CS (Biver et al., 2016). Currently, some of the most unique in-situ data are available from the Rosetta mission on comet 67P/Churyumov–Gerasimenko (67P/C–G hereafter; Glassmeier et al. 2007). With the Rosetta Orbiter Spectrometer for Ion and Neutral Analysis (ROSINA; Balsiger et al. 2007) aboard the orbiter, the coma has been shown to contain H2S, atomic S, SO2, SO, OCS, H2CS, CS2 and S2 (and tentatively CS, as the mass spectrometer cannot distinguish it from CO2) gases (Le Roy et al., 2015). Furthermore, S3, S4, CH3SH, and C2H6S have now been detected (Calmonte et al., 2016) and information on isotopologues is available (Calmonte et al., 2017). It seems that per cent of sulphur is in refractories (dust) with only per cent hidden in volatiles (ice; see Appendix A for the details). It is likely that surface sniffing of 67P/C–G by COSAC did not reveal any sulphur-bearing species (Goesmann et al., 2015) due to a lack of mass resolution (Altwegg et al., 2017). By piecing together the sulphur puzzle from the earliest diffuse phases to the oldest cometary probes, it may be possible to disentangle the history of volatiles and refractories simultaneously, as they are formed and assembled into larger bodies.
An important parameter for the gas-phase chemistry of sulphur-bearing molecules is the initial elemental C/O ratio at the time molecules start to form, which sets the ratio between oxygen- and carbon-containing S-bearing species (e.g., as seen in the ratio between SO and CS; Watt & Charnley 1985). Additional volatiles can be formed and/or enhanced via the passage of shocks, including HS, H2S, S2, SO+ (Mitchell, 1984; Pineau des Forets, Roueff & Flower, 1986; Leen & Graff, 1988; Turner, 1992). Species such as SO and SO2 that are produced in the gas phase via reactions with OH upon the liberation of S via sputtering, have become traditional shock tracers. Sulphur-bearing molecules have also been used to study discs via CS (e.g., Hasegawa et al. 1984; Blake, van Dishoeck & Sargent 1992) and as tracers of the centrifugal barrier (disc-envelope interface) via SO (e.g., Sakai et al. 2014).
The possible formation routes in ices of species such as S2 have been investigated by Grim & Greenberg (1987). In their experiments, ice mixtures containing H2S are irradiated via ultraviolet (UV) photons and the production of sulphur chains is indirectly inferred. More recently, Chen et al. (2015) have shown that energetic processing with UV of H2S-CO ice mixtures leads to the formation of OCS and CS2, and of H2S-CO2 mixtures to OCS and SO2. It is thought that H2S forms via the hydrogenation of atomic S and serves as a parent species for further synthesis of sulphur-bearing ices. It is suggested that SO forms on grain surfaces via oxygen addition to HS, and SO2 forms via oxygen addition to SO and/or via the association of two SO molecules. OCS can potentially form via the addition of oxygen to CS, the addition of sulphur to CO and/or the association of HS and CO. Experiments also predict that H2S2 should be made on the grains via the association of two HS molecules; however, recent observational upper limits place it at least an order of magnitude lower in abundance than the laboratory works suggest (towards IRAS 16293–2422; Martín-Doménech et al. 2016). Neither H2S2 nor HS2 have been detected with ROSINA on 67P/C–G (Calmonte et al., 2016).
This work is an attempt at piecing together the sulphur trail by comparing its budget in the warm gas on Solar System-scales around a low-mass protostar to that in our own Protosolar Nebula. For this purpose, the paper will focus on the solar-analogue IRAS 16293–2422 B, as investigated by ALMA, and the best available sample of the innate Solar Nebula – 67P/C–G, as unraveled by ROSINA measurements. IRAS 16293–2422 is an embedded low-mass Class protostellar binary with a separation of (or au assuming a distance of pc; Loinard et al. 2008; Ortiz-León et al. 2017), a combined luminosity of L☉ and disc-like structures around both sources, A and B. A full overview of the physical and chemical properties of the source are presented in Jørgensen et al. (2016). The single dish survey with the Caltech Submillimeter Observatory (CSO) and the James Clerk Maxwell Telescope (JCMT) detected sulphur-bearing warm ( K) dense ( cm-3) gas tracers such as SO, 34SO, S18O, SO2, OCS, OC34S, O13CS, 18OCS, o- and p-H2CS, H2C34S, HCS, SiS, 29SiS; and colder ( K) envelope species ( cm-3) such as CS, C34S, HCS+, HDS (Blake et al. 1994; van Dishoeck et al. 1995 and reanalysed by Schöier et al. 2002). The single dish TIMASSS survey with IRAM- m and JCMT- m facilities expanded the list with 34SO2, 13CS, C33S, HDCS and C2S (Caux et al., 2011); and CH3SH (Majumdar et al., 2016). Interferometric observations with the Submillimeter Array (SMA) revealed the spatial distribution of CS, C34S, 13CS, H2S, H2CS, H2C34S, HCS+, OCS, O13CS, SO, 33SO, 34SO, SO2, 33SO2, 34SO2, SO18O and SO17O around the binary system on scales of au, shedding light on the fact that source A is significantly richer in sulphur-bearing species than B (Jørgensen et al., 2011). IRAS 16293–2422 B has been targeted with ALMA in Band : lines of 34SO2, 33SO2 and SO were detected in emission from a warm region near source B; and a line of H2S was found in absorption originating from the cold foreground gas (Baryshev et al., 2015). Based on ALMA Band data at spatial resolution, Oya et al. (2016) revealed that it is possible to derive the kinematic envelope structure around source A via OCS emission, meanwhile H2CS traces both the envelope and the disc-like structure.
This paper presents the full inventory of sulphur-bearing molecules towards IRAS 16293–2422 B, based on ALMA Band data (Jørgensen et al., 2016). Such interferometric observations make it possible to get away from the large scale outflow- and circumbinary envelope-dominated emission and to spatially resolve the thermally desorbed molecules close to the central source. The choice to focus on source B has been made, because its lines are much narrower than those observed towards source A, hence there is less line blending. This makes it ideal for studies of isotopologues and minor species. Subsequently, ratios between various molecules are compared to those deduced for the coma gases of 67P/C–G, as measured with the ROSINA instrument (Calmonte et al., 2016). Both sets of data are some of the best available for an extrasolar analogue of our Solar System and an innate Solar Nebula tracer – a comet. The differences and similarities between the two have implications for the formation history of our Solar System. Observational details are presented in Section 2 and the results are found in Section 3. Molecular ratios are computed and compared to cometary values in Section 4 and the conclusions are given in Section 5.
2 IRAS 16293–2422 observations
This work is based on the large unbiased Protostellar Interferometric Line Survey (PILS222http://youngstars.nbi.dk/PILS/; project-id: 2013.1.00278.S, PI: Jes K. Jørgensen) of IRAS 16293–2422 carried out with ALMA in the GHz frequency range (Band ) with a spectral resolution of km s-1 and a beam size of (or au in diameter, assuming a distance of pc; Loinard et al. 2008; Ortiz-León et al. 2017). The data used here are continuum subtracted based on the statistical method described in Jørgensen et al. (2016). The observations are a combination of the - and the -m dish arrays, thereby ensuring that the emission on scales up to is recovered, while also spatially resolving the target. The root-mean-square (RMS) noise of the combined dataset is mJy beam-1 channel-1 (or mJy beam-1 km s-1 with beam sizes in the range; see table of Jørgensen et al. 2016). Hereafter, mJy beam-1 channel-1 or mJy beam-1 km s-1 is adopted. Here, the dataset convolved with a uniform circular restoring beam of is used. All further details on the PILS survey, including calibration, are available in Jørgensen et al. (2016).
The spectral analysis presented in the subsequent section is carried out towards a single position of the dataset – one beam ( au) offset from source B in the SW direction, which has also been the focal point of Coutens et al. (2016), Lykke et al. (2017) and Ligterink et al. (2017); and lies twice as far as the position studied in Jørgensen et al. (2016) in the same direction. The position lies within the high density inner regions of the disc-like structure of source B (called “disc” for simplicity, hereafter), hence maximizing emission; while being sufficiently far from the source to avoid absorption against the strong dust continuum (Fig. 1). IRAS 16293–2422 is associated with one collimated pair of outflow lobes in the NW-SE direction and one less collimated in the E-W direction. The studied offset point lies in the most outflow-free direction of the region to avoid any additional sources of heating. The spectrum at this position is rich in numerous narrow ( km s-1) lines from various species (and at abundances a factor of lower than at those seen in fig. of Jørgensen et al. (2016) for the half-beam offset position in the same direction at au from the source, corresponding to the comet-forming zone). The recent analysis of complex organic emission in this direction from species such as glycolaldehyde, ethylene glycol, ethylene oxide, acetone and propanal indicates that the temperatures at this point are K, thus it is likely that the chosen position is probing hot inner envelope or face-on disc material heated by the protostellar B source.
3 Results and analysis
[
caption = Best-fitting parameters for detected species at the one beam offset position from source B of IRAS 16293–2422\tmark,
label = tbl:bestfit,
star = 1
]@llrrrl
\tnoteassuming a source size of , FWHM of km s-1 and K
\tnote[b]blended
\tnote[c]optically thick
\tnote[d]assuming 12C/13C (Wilson, 1999)
\tnote[e]assuming 32S/34S (Wilson, 1999)
\tnote[f]no estimate for the local ISM is available, so a solar ratio of 32S/33S is used (Asplund et al., 2009)
\tnote[g]assuming 16O/18O (Wilson, 1999)
\tnote[h]no estimate for the local ISM is available, so a solar ratio of 32S/36S is used (Asplund et al., 2009)
\tnote[i]assuming D/H , as measured with single dish observations of HDS/H2S (table of van Dishoeck et al. 1995)44footnotemark: 4
\tnote[j]assuming D/H , as recent studies suggest that single dish observations may be overestimating deuteration as a result of underestimating optical depth
Species # of clean lines CDMS entry (K) (cm-2) Derived (cm-2)
(# of lines in range) of isotopologues
SO2, 13 (101) 64502
34SO2 12 (107) 66501
SO, 0 (8) 48501
OCS, 0 (2) 60503
OCS, 4 (4) 60504
O13CS 2 (2) 61502
OC34S 3 (3) 62505
OC33S 2 (3) 61503
18OCS 3 (3) 62506
C34S, 1 (2) 46501
C33S, 0 (2) 45502
C36S 1 (1) 48503
H2CS 9 (22) 46509
HDCS 6 (23) 47504
HDS 1 (10) 35502
HD34S 1 (7) 37503
CH3SH, 12+ (496) 48510
[
caption = Upper limits () on the column densities of selected species at the one beam offset position from source B of IRAS 16293–2422,
label = tbl:upperlim,
star = 1
]@lrrr
\tnote[k]not possible to derive an accurate upper limit based on one blended line, so the value from Martín-Doménech
et al. (2016) is adopted, ignoring the difference in beam sizes
\tnote[l]b-type (CDMS entry 59504) has two lines in range, which cannot be detected due to very high K
Species Catalogue and entry # # of lines in range (cm-2)
gauche-C2H5SH CDMS 62523 1329
anti-C2H5SH CDMS 62524 470
gauche-C2HSH CDMS 64517 1106
S2 JPL 64001 1
S3 JPL 96002 303
S4 JPL 128001 952
HS2 CDMS 65509 227
H2S2 CDMS 66507 33
S2O, CDMS 80503 378
cis-S2O2 CDMS 96501 567
HCS CDMS 45507 6
HSC CDMS 45508 29
HCS+ CDMS 45506 1
DCS+ CDMS 46505 1
HC34S+ CDMS 47502 1
H2C34S CDMS 48508 20
D2CS CDMS 48507 32
CCS CDMS 56502 14
H2C2S CDMS 58501 63
c-C2H4S CDMS 60509 191
NS, CDMS 46515 20
NCS CDMS 58504 12
HNCS, a-type CDMS 59503 10
HSCN CDMS 59505 75
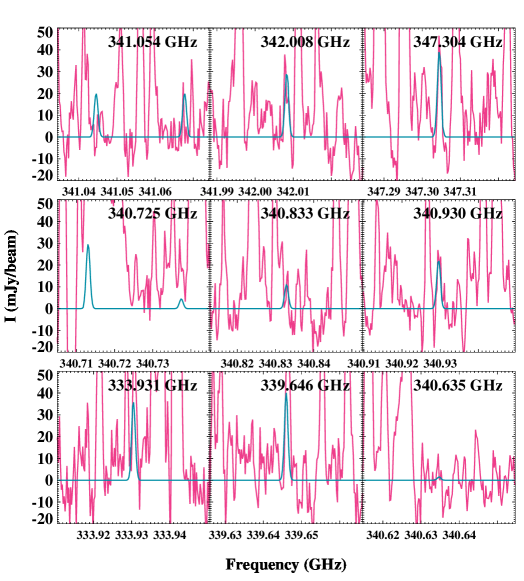
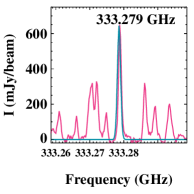
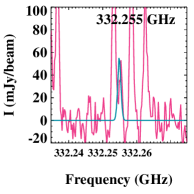
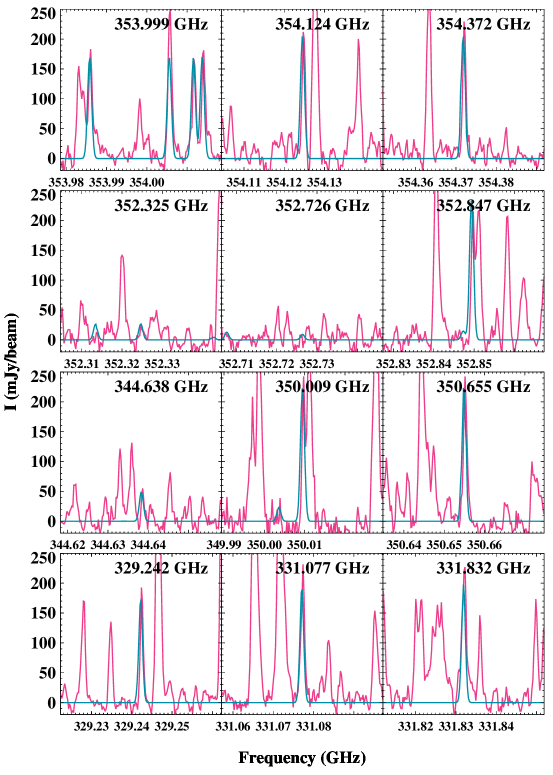
The one beam offset position from source B of IRAS 16293–2422 in the PILS Band dataset was searched for lines of all known sulphur-bearing species, including those detected in 67P/C–G, and several that have been hypothesized to be present. The initial line searching and local thermal equilibrium (LTE) modelling have been carried out with CASSIS333CASSIS has been developed by IRAP-UPS/CNRS, http://cassis.irap.omp.eu. Thereafter, synthetic spectra have been generated with custom IDL routines. LTE is a good assumption in this case, because the densities are high at the chosen position and thus the molecules are expected to be thermalised. This assumption has also been quantified for the case of methanol (CH3OH) in section of Jørgensen et al. (2016). It was shown that for the high densities probed by this dataset ( cm-3), the deviation of excitation temperatures under the assumption of LTE from kinetic temperatures of non-LTE calculations is expected to be lower than per cent. The explored grid of column densities corresponds to an uncertainty of per cent. Moreover, for the molecules studied in this work, all levels are well-described by a single excitation temperature.
The detected species and the best-fitting parameters, assuming a constant K for all species, are tabulated in Table LABEL:tbl:bestfit. This value for has been determined as best-fitting by eye based on a grid of synthetic spectra with K steps for all these species. Hence, the uncertainty on is per cent. There is no indication among this set of molecules for a different . A value of K has also been derived for some complex organics (e.g., acetaldehyde, ethylene oxide, dimethyl ether and ketene; Lykke et al. 2017; Jørgensen et al. 2017); while other species show significantly higher excitation temperatures of K (e.g., glycolaldehyde, methyl formate, formamide; Coutens et al. 2016; Jørgensen et al. 2016, 2017). These variations in excitation temperatures are likely due to different molecules tracing regions of different temperatures, which is related to the different binding energies of the species and short infall time-scales of these inner regions (Jørgensen et al., 2017). Observations at an even higher spatial resolution are necessary in order to explore this in detail. It is assumed that the source is extended and in size. If, both, the beam and the source distributions are Gaussian, then the observed emission is diluted by:
| (1) |
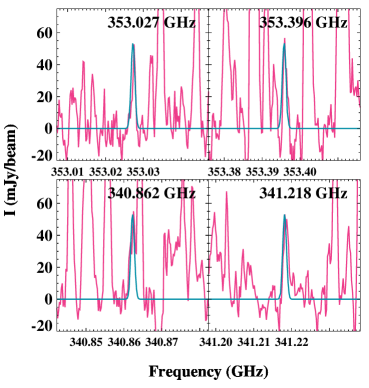
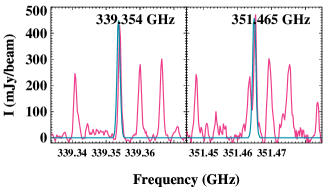
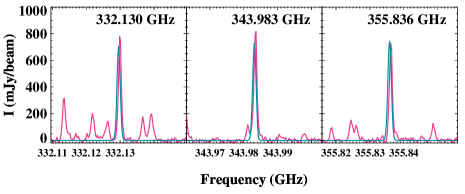
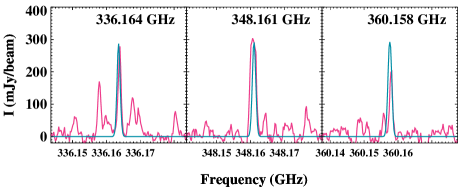
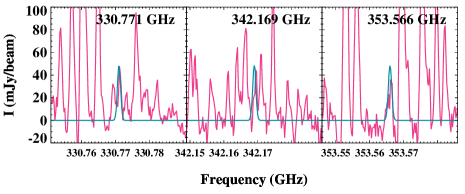
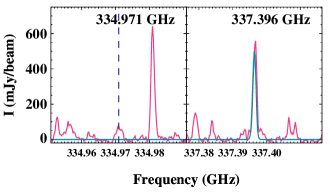
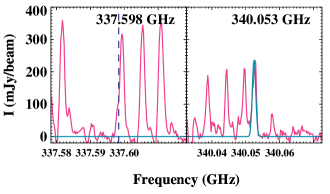
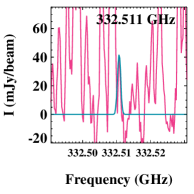
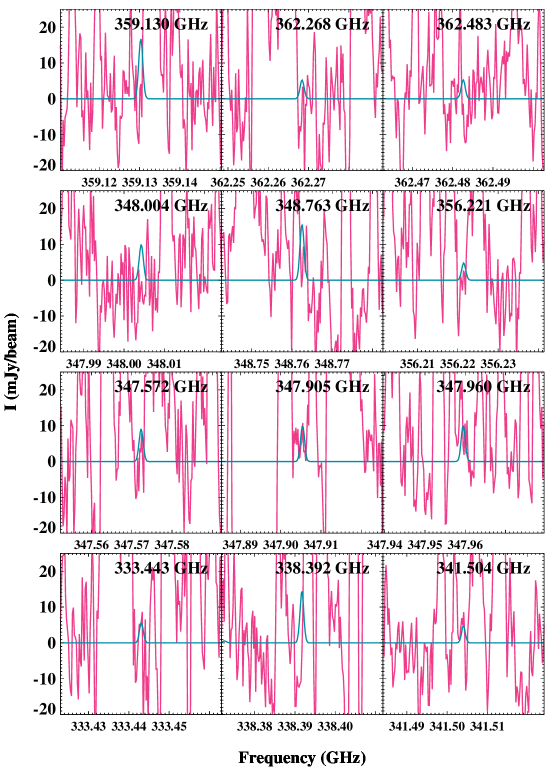
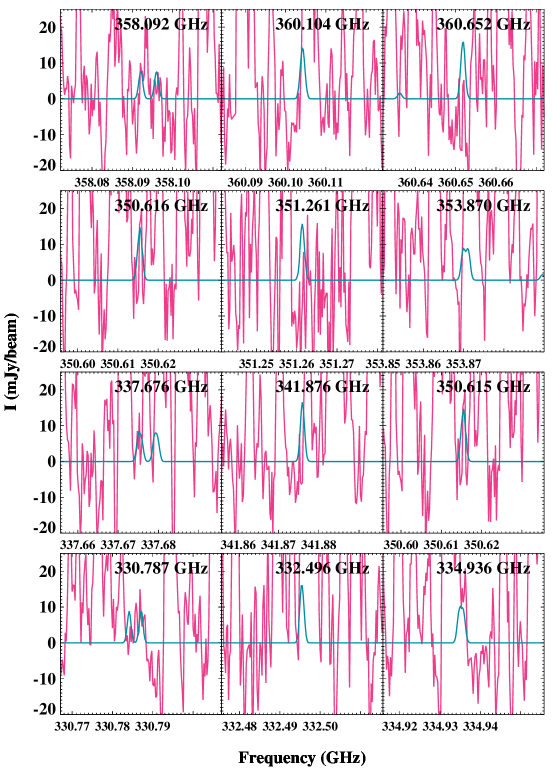
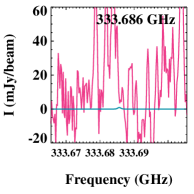
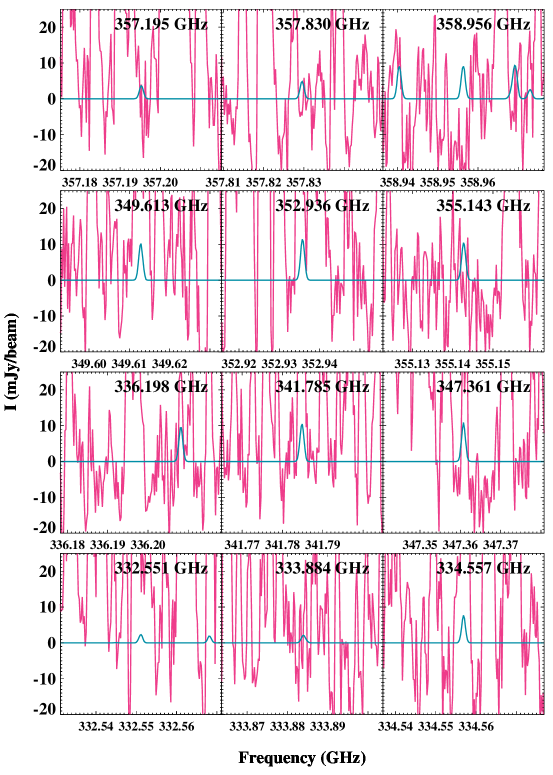
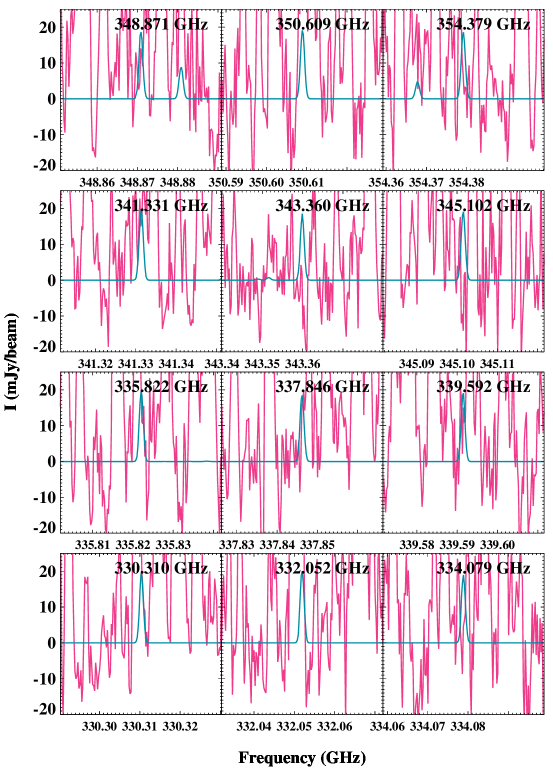
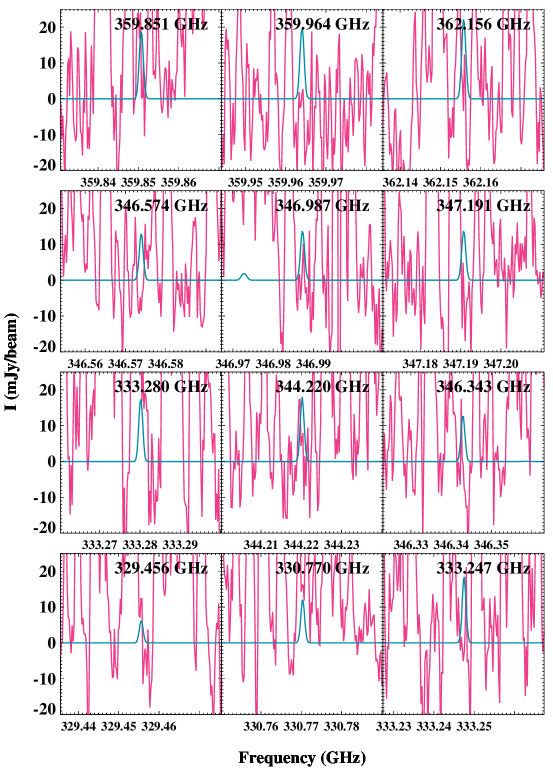
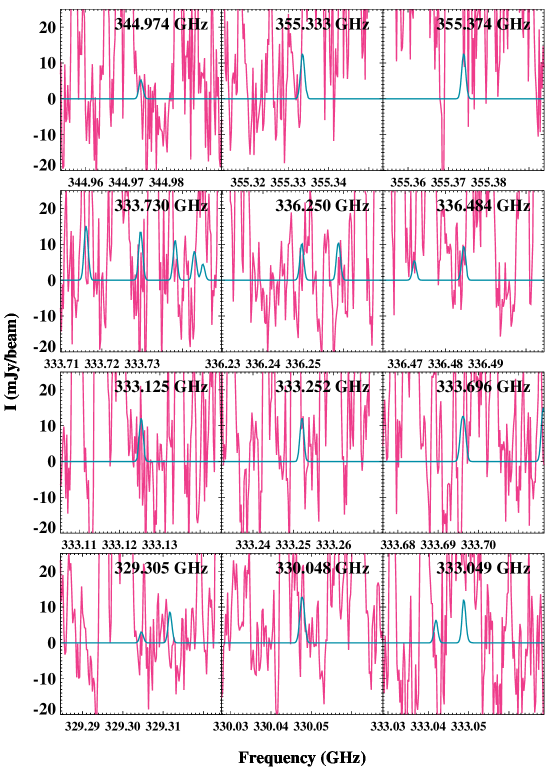
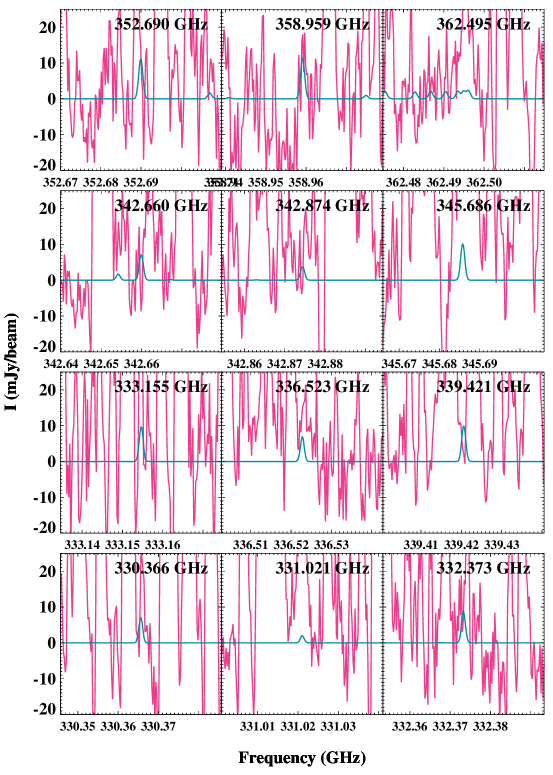
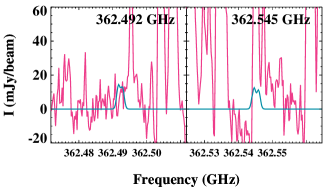
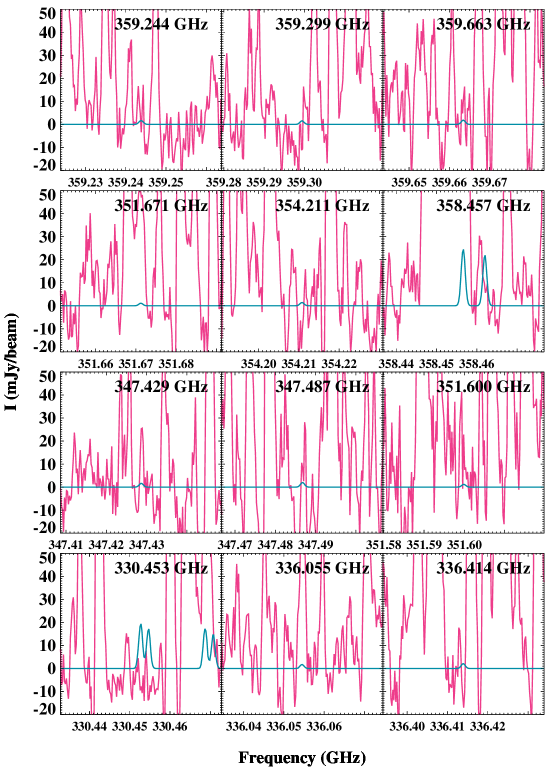
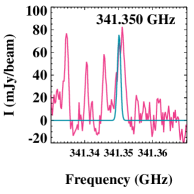
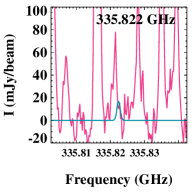
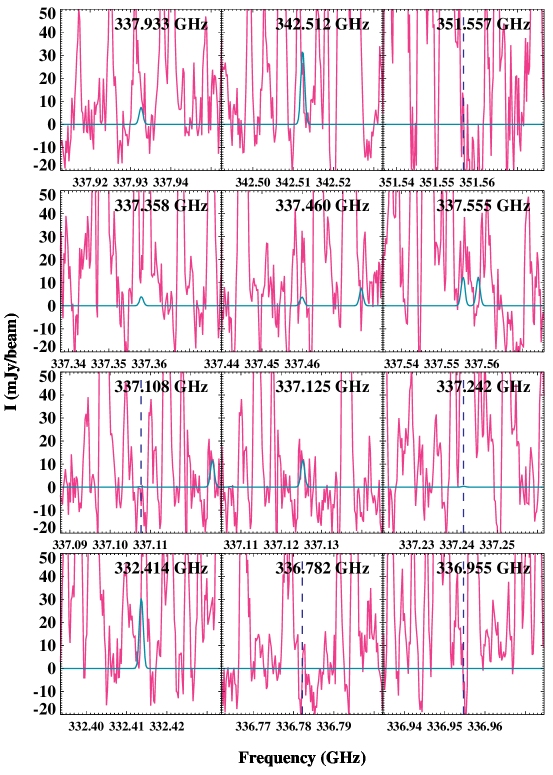
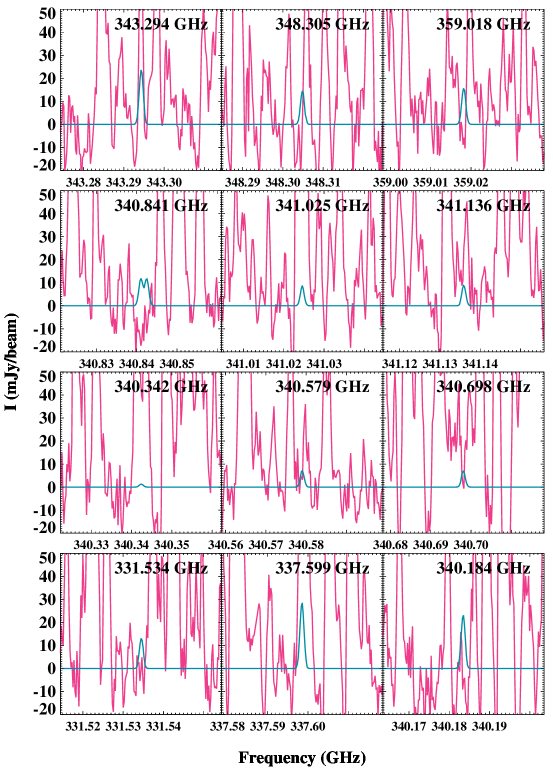
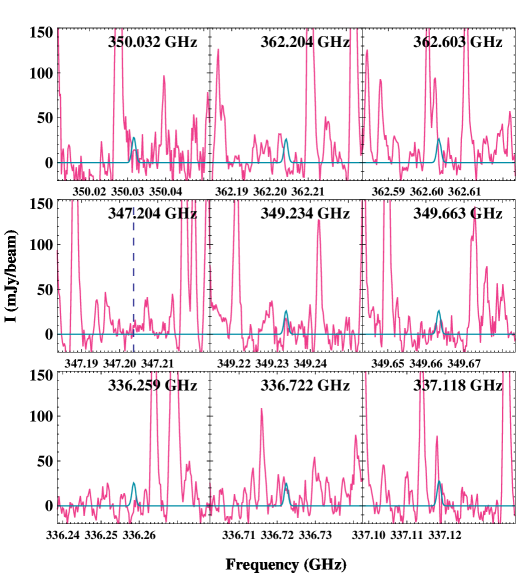
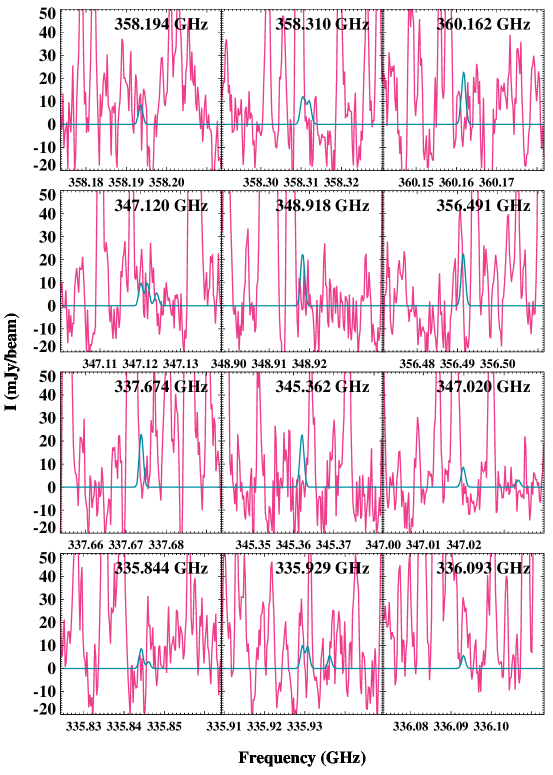
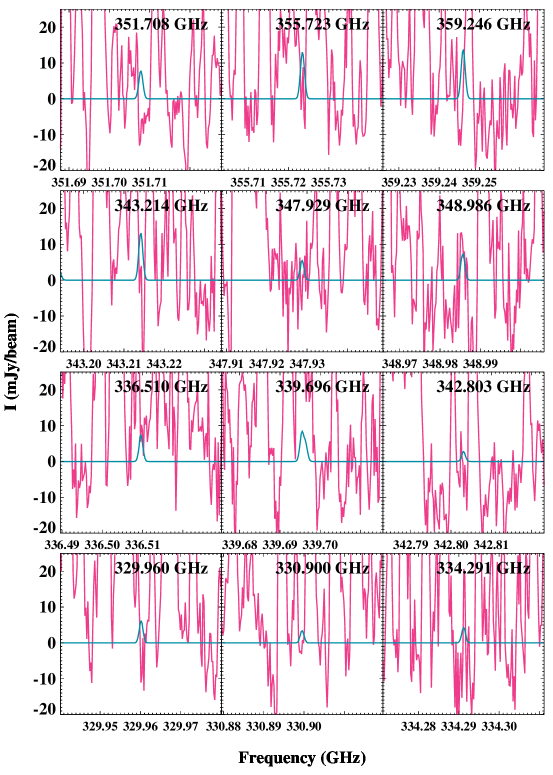
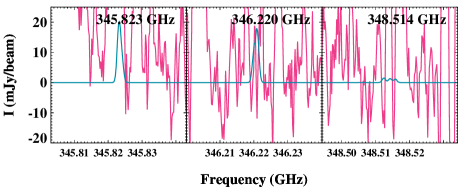
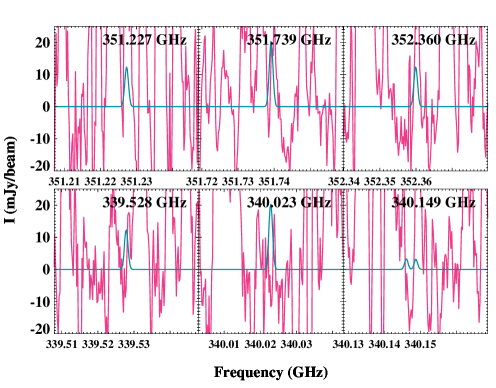
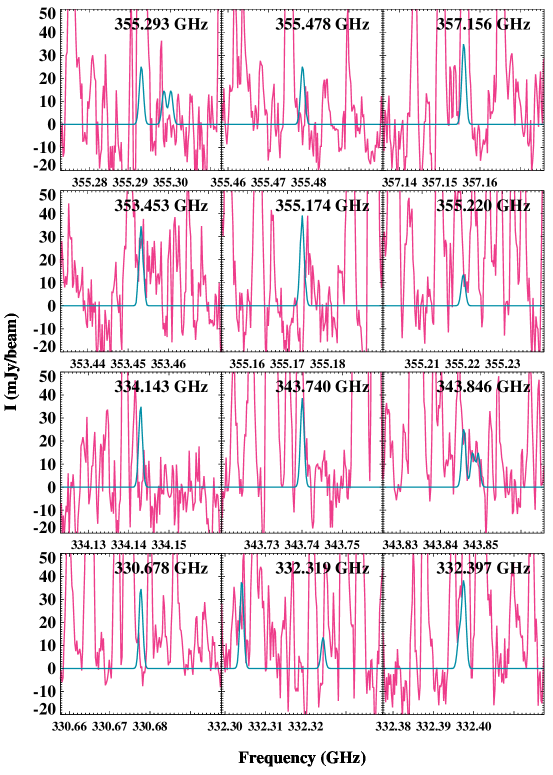
A full width half-maximum (FWHM) of km s-1 is taken for all species. No evidence for any deviation from this value is seen at this offset position for the sulphur-bearing molecules in this dataset. The lines are spectrally resolved into about five bins. There is no indication of any additional kinematic signature such as outflows in the lines at the spectral resolution of these data at this position. The disc-like structure around source B is face-on, so Keplerian rotation is not seen. For source A, a rotating-infalling structure is seen (Pineda et al., 2012). For sources A and B, the assumed local standard of rest (LSR) velocities are and km s-1, respectively (Jørgensen et al., 2011). There may be a small ( km s-1) shift in the best-fitting LSR velocities between molecules tracing somewhat warmer/cooler regions (Jørgensen et al., 2017). Subsequent subsections describe the detections on a molecule by molecule basis. Isotopic ratios for the local ISM have been taken from Wilson (1999), which are an update of Wilson & Rood (1994), where available (32S/34S ). Otherwise, solar ratios from Asplund et al. (2009) have been employed (32S/33S , 32S/36S ). A selection of the detected lines and fitted synthetic spectra are shown in Appendix B.
3.1 SO2
Sulphur dioxide (SO2) in the state is detected based on 13 clean, non-blended lines at a column density of cm-2(Fig. 3). The state is not detected due to the covered lines having very high upper energy levels ( K). 34SO2 is detected with 12 clean lines at a column density of cm-2 (Fig. 4). For a ratio of 32S/34S , the column density of SO2 should be cm-2. This value is a factor of higher than the column density derived from the lines of SO2 itself. This may indicate that SO2 is marginally optically thick at this position; however, the synthetic fits to the data do not indicate this (a higher column density leads to an overproduction of the synthetic flux in comparison to the data). Alternatively, the sulphur isotopic ratio may differ at this position and/or for this molecule from that of the local ISM, specifically 32S/34S instead of . Finally, it may also be that the emission of SO2 stems from a non-uniform emitting area, such as optically thick clumps. Such distributed clumps would still yield a smooth (beam-diluted) emission map on large scales (such as that shown in Fig. 1). ALMA Band emission maps of 34SO2 at resolution do indeed suggest that the emission is not homogeneously distributed within the PILS Band beam (fig. of Baryshev et al. 2015). None of these possibilities can be firmly ruled out. The one beam offset position has also been searched for 33SO2, S18OO and S17OO; however, all these lines are very weak, with predicted emission at the noise level of the dataset.
3.2 SO
Sulphur monoxide (SO) in the state has 8 lines in range. Only 3 are strong enough to be detected (the other 5 are weaker than ) and are blended with emission from cyclopropenylidene (c-C3H2), methanol, ethanol (C2H5OH), vinyl cyanide (C2H3CN), glycolaldehyde (HOCH2CHO), methyl formate (HCOOCH3) and acetaldehyde (CH3CHO). Therefore, the LTE fit for this molecule is less certain and only an upper limit can be derived on its column density at a value of cm-2 (Fig. 5). This value reflects the maximal contribution SO can have in the observed blended lines. In the state, 7 lines are in range. However, all are predicted to be weaker than mJy beam-1 and, thus, weaker than the noise in the dataset. The position has also been searched for 34SO, 33SO, 36SO, S18O, S17O and SO+; however, all these lines are very weak, with predicted emission below the noise level of the dataset.
3.3 OCS
Carbonyl sulfide (OCS) in the state has 2 lines in range that are slightly blended with lines of glycolaldehyde and ethanol, respectively (Fig. 6). The state is detected with 4 clean lines (Fig. 7). Multiple isotopologues are also detected: O13CS, OC34S, OC33S and 18OCS (Fig. 3- 11). This is the first time OC33S has been detected towards this source. The presence of 33S has been inferred previously via 33SO2 (Jørgensen et al., 2012) and C33S (Caux et al., 2011). All the other isotopologues of OCS have been detected before (Blake et al., 1994; Schöier et al., 2002; Caux et al., 2011). The dataset was also searched for 17OCS, OC36S, 18OC34S, 18O13CS, O13C34S, O13C33S; however, the predicted emission from these species is at the noise level of the dataset.
The best-fitting column density of OCS is cm-2, if inferred from the 4 lines of the state; and is at most cm-2, if approximated from the 2 blended lines of the state. This immediately indicates that the state is optically thick and this derived column density is a lower limit. The column density of OCS can also be inferred indirectly via its optically thin isotopologues (O13CS, OC34S and 18OCS) and the respective local ISM isotopic ratios. The derived numbers are in Table LABEL:tbl:bestfit and are within a factor of two from the column density calculated from the state. They are an order of magnitude higher than that based on the state confirming its optical thickness. The average of these four optically thin estimates is cm-2. The average of the values based on just the three isotopologues is cm-2 and is the best estimate of the column density of OCS at this position. As an additional check, the solar ratio of 32S/33S can be used to derive the column density of OCS from its OC33S isotopologue, since no estimate for the local ISM is available. This yields a value of cm-2, which is consistent within a factor of with the average value derived from three other isotopologues. Alternatively, the observed column density of OC33S and the estimated average column density of OCS can be used to calculate 32S/33S for IRAS 16293–2422 B to be (with significance), which is marginally sub-solar compared with the solar value of at the highest end of the error bars.
3.4 CS
Carbon monosulfide (CS) in all the vibrational states has 5 rotational lines in range. Only one of them (, ) is expected to be strong enough to be detected ( K and s-1), but is blended with ethyl cyanide (C2H5CN) and ethylene glycol ((CH2OH)2). The C34S isotopologue in the state has 2 lines in range. One is cleanly detected, while the second is predicted to be too weak for a detection due to a high value of K. The best-fitting column density is cm-2 (Fig. 12). The C33S isotopologue in the also has 2 lines in range. One is cleanly detected, while the second is again too weak to detect as K. The best-fitting column density is cm-2 (Fig. 13). The fourth S-isotopologue C36S has 1 line in range; and it is cleanly detected ( K and s-1), giving a best-fitting column density of cm-2 (Fig. 14). This is a tentative first-time detection of 36S towards a low-mass protostar. C36S has been previously detected towards high-mass hot cores (Mauersberger et al., 1996) as a first-time detection of interstellar 36S. More lines are required to confirm this detection; however, the isotopic ratios are in agreement with solar ratios. Other excitation states and isotopologues lack lines in the observed frequency range, specifically: CS in the and states; C34S in the state; 13CS in the and states; 13C34S and 13C33S. Meanwhile, 13C36S has 1 line in range, but it is a clear non-detection. CS+ has 2 lines in range; however, one is too weak ( s-1), while the other suffers from blending and absorption.
Assuming the local ISM ratio of 32S/34S , the column density of CS can be estimated at cm-2 from its C34S isotopologue. If this column density is used to fit the detected line of CS suffering from absorption, then the synthetic line width matches the observed. Thus this is the best available estimate of the column density of CS. Based on C33S and C36S, the column density of CS can be derived to be cm-2 and cm-2, respectively, which is factors of and larger than the value derived based on C34S. This may imply that either the C36S column density is poorly constrained by the single line; or that the solar isotopic ratio is not applicable for IRAS 16293–2422 B. Alternatively, the observed column densities of C33S and C36S in conjunction with the estimated CS column density can be used to calculate 32S/33S and 32S/36S for IRAS 16293–2422 B to be and (both with significance), i.e., a factor of and an order of magnitude lower than the solar values of and , respectively.
3.5 H2CS
Thioformaldehyde (H2CS) is detected with 9 clean lines at a column density of cm-2 (Fig. 15). H2C34S cannot be cleanly detected due to a lack of non-blended lines, thus only an upper limit of cm-2 can be derived (Table LABEL:tbl:upperlim, Fig. 35). The tentative assignments of the strongest lines of H2C34S at this maximal column density would imply a column density of cm-2 for H2CS (assuming 32S/34S ), thus testifying to H2CS emission being (very close to) optically thin.
HDCS is detected with 6 clean lines at a column density of cm-2 (Fig. 16). Since H2CS appears to be optically thin, the best-fitting column densities can be used to calculate the HDCS/H2CS ratio to be and a D/H 444A correction for the statistical factor of 2 is applied, which assumes that deuteration events are mutually exclusive. A lower level of deuteration is ruled out based on the low quantity of H2C34S. This implies that thiofomaldehyde is highly singly-deuterated (5 per cent), but comparable to many oxygen-bearing complex organic species (Jørgensen et al., 2017).
D2CS is not detected with an upper limit of cm-2 (Table LABEL:tbl:upperlim, Fig. 36). This yields a D2CS/HDCS ratio of , and a D2CS/H2CS ratio of . Persson et al. (2017) derived the ratios between the deutrated isotopologues of formaldehyde (H2CO) to be: HDCO/H2CO , D2CO/HDCO , and D2CO/H2CO . This means that in comparison to formaldehyde, the sulphur-bearing analog (thioformaldehyde) is a factor of more singly deuterated relative to its main isotopologue, at most a factor of more doubly-deuterated relative to its singly-deuterated isotopologue and at most a factor of more doubly-deuterated relative to its main isotopologue. This may suggest that thiofomaldehyde forms under even more deuterium-rich conditions than formaldehyde, or that it undergoes fewer chemical reactions that would lower its level deuteration from the time of initial synthesis. Other isotopologues have not been detected: H2C33S and HCS. Higher sensitivity data would be useful for ascertaining the column density of D2CS and firmly verifying the degree of deuteration of thioformaldehyde.
3.6 H2S
Hydrogen sulfide (H2S) has 1 line in the observed frequency range; however, it is not detected due to a high upper energy level ( K) and line weakness ( s-1). On the other hand, its isotopologue HDS has 10 lines in range. One of those is a clear detection at the level, while the others have upper energy levels that are too high ( K) and thus, are not expected to be strong. The best-fitting column density is cm-2 (Fig. 17). HD34S has 7 lines in range. One is strong-enough and blend-free to be detected, while all others have upper energy levels that are too high ( K) to be stronger than the noise level. The best-fitting column density is cm-2 (Fig. 18). Assuming that 32S/34S , gives a column density of cm-2 for HDS, which closely (a factor of ) agrees with the value derived based on its single observed line. Other isotopologues are not detected. HS and HS do not have any lines in the observed frequency range. D2S has 4 lines in range; however, only 2 are above the noise level and both suffer from blending, thus no clear detection is possible. DS has 2 lines in range, but one is blended with a strong absorption feature; and the other with emission lines of acetaldehyde and the 13C-isotopologue of ethyl cyanide (C2HCN); thus, no confident detection can be claimed.
Assuming D/H , as measured with single dish observations of HDS/H2S (table of van Dishoeck et al. 199544footnotemark: 4), the column density of H2S can be estimated from HDS and HD34S (Table LABEL:tbl:bestfit). The average of these two values of cm-2 is the best estimate of the column density of H2S at this position. It is possible that single dish observations may be overestimating deuteration, either because of sampling colder material or as a result of underestimating optical thickness of the main species. The lowest D/H ratio seen towards IRAS 16293-2422 is ( per cent) for HNCO (Coutens et al., 2016). To account for this other extreme for the case of H2S, a D/H may be assumed, increasing the best estimate to cm-2.
The previously obtained SMA observations of IRAS 16293–2422 have detected a line of H2S around GHz (see fig. of Jørgensen et al. 2011). LTE modelling assuming a beam size of , a spectral resolution of km s-1 (as given in table of Jørgensen et al. 2011), FWHM of km s-1 and a source size of (as assumed for the ALMA observations) shows that the line is optically thick. In order to match the observed line intensity of Jy beam-1, a larger source size is necessary. Upon the assumption of a source in size, the lower limit on the column density of H2S is cm-2. This illustrates the uncertainty in the emitting area of this molecule. Alternatively, a non-detection of the sole line in range of the SMA observations of HS at GHz does not yield a strongly constraining column density estimate. Assuming the same parameters, in order to be weaker than the SMA noise level (where Jy beam-1 channel-1; table of Jørgensen et al. 2011), the column density of HS must not exceed cm-2. Assuming 32S/34S , the upper limit on the column density of H2S is cm-2. This is consistent with the limits obtained with the uncertain limit obtained from HDS. Dedicated high resolution ALMA observations are needed in order to constrain the spatial distribution and column density of H2S.
3.7 CH3SH and other species
Methyl mercaptan (CH3SH, also known as methanethiol) in the state is detected with more than clean lines at a column density of cm-2 (Fig. 19), which is comparable to the column density of H2CS. Thioformaldehyde is a likely precursor for methyl mercaptan’s grain-surface formation pathways, analogously to formaldehyde being a precursor for methanol.
No other sulphur-bearing species were detected towards the one beam offset position; however, selected upper limits have been derived and are given in Table LABEL:tbl:upperlim (Fig. 20- 43). The values correspond to the maximal column densities at the fixed K that the species can have in order to not exceed the observed flux at the frequencies of their emission lines. The obtained upper limits for all three versions of ethyl mercaptan (C2H5SH) are lower than the observed column density of methyl mercaptan by at most an order of magnitude, which is consistent with it being a step-up in chemical complexity.
The derived upper limits for the column densities of HS2 and H2S2 are more constraining than those obtained by Martín-Doménech et al. (2016) owing to the much smaller beam size of the PILS Band data. It is not possible to obtain an accurate upper limit for S2 as only one line is covered in this dataset; however, the upper limit derived by Martín-Doménech et al. (2016) in a much larger beam size based on two lines is consistent with the observed non-detection. Carbon-sulphur chains larger than CS, e.g., C2S, are not detected.
Upper limits on other likely carriers of sulphur in conjunction with H, C, O and N atoms are low (almost all cm-2, compared with cm-2 for OCS and H2S), which indicates that the dominating volatile sulphur reservoirs have been accounted for. The only remaining untapped sulphur reservoir would be the refractory/dust component. All other species that were not detected at this position are listed in Appendix D.
3.8 Integrated intensity maps
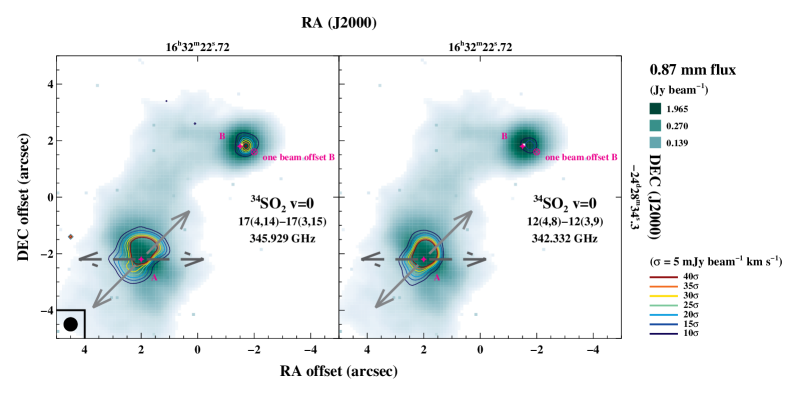
In order to gain insight into the spatial distribution of the emission of sulphur-bearing species, integrated intensity maps of two 34SO2, transitions (at and GHz) are displayed in Fig. 1. This molecule has been chosen as it is firmly detected with many lines; and its emission is optically thin, without a doubt, at the one beam offset position from IRAS 16293–2422 B. The pixels in the maps are in order to comfortably oversample the spatial resolution of of the synthesized beam. The integration is performed over spectral bins (one containing the line frequency and to each side of that bin). Hence, the integrated maps cover km s-1 around the source velocity of B of km s-1 (i.e., from to km s-1 at the spectral resolution of the data of MHz or km s-1). This implies that the maps are appropriate for the emission stemming from quiescent gas near source B; however, near source A they are less representative even though the systemic velocity of km s-1 of source A is covered. All emission lines near source A are likely wider than km s-1; thus, some of the flux from the line wings is missed when integrating over just bins. Moreover, there is a steep velocity gradient around source A. Integration over a wider velocity range will pollute the maps with emission from other species. In fact, even with integration over this velocity range already leads to contamination by emission from broadened neighbouring lines. Bearing in mind these limitations, Fig. 1 clearly shows that source A has stronger emission in 34SO2 and also on larger scales. The GHz line shows a higher flux than the GHz line around source B, while little difference is seen around source A. Since emission in two lines from the same molecule differs spatially, the physical conditions exciting the 34SO2 molecule must also differ around the two sources.
These maps show convincingly that the 34SO2 emission near source B is dominated by material on small scales either from the disc or the inner envelope (barely no difference is seen when analyzing the -m data instead of the combination with ACA). For the GHz line of 34SO2, the line peaks at mJy beam-1 (Fig. 4). Integrating over spectral bins yields the total flux of this line at the one beam offset position of mJy beam-1 km s-1. The total flux of this line integrated over the entirety of source B (Fig. 1) is mJy km s-1 (for RA and Dec). Taking the ratio of these two numbers implies that per cent of the total GHz line emission of 34SO2 towards source B is picked up in a beam solid angle at the one beam offset position. For the purposes of this paper, which are to compare and contrast the chemical composition of the smallest disc-scales around source B to those of comet 67P/C-G, it has been chosen to focus on this single position rather than the entire emitting area (which also differs per molecule). Emission from other species, such as CS and its isotopologues, is likely a superposition of extended (envelope) and the more compact (disc) components. However, these ALMA observations are marginally sensitive to envelope emission, since any structure that is smooth on scales of more than is filtered, even by the ACA.
4 Discussion
4.1 Comparison with single dish observations
[
caption = Molecular ratios relative to H2S and OCS as measured with PILS interferometric ALMA observations at the one beam offset position from source B of IRAS 16293–2422 and with previous single dish (SD) work,
label = tbl:SDcomp,
star = 1
]@llllllll
\tnote[m]tables and of Schöier et al. (2002)
Species N (cm-2) Molecular ratios relative to H2S (%) Molecular ratios relative to OCS (%)
ALMA B SD constant ALMA B SD constant SD inner SD outer
H2S - -
OCS
SO
SO2
CS - -
H2CS
[
caption = Molecular ratios relative to H2S and OCS as measured with these interferometric ALMA observations at the one beam offset position from source B of IRAS 16293–2422 in comparison to those of 67P/C–G and ISM ices towards W33A,
label = tbl:67Pcomp,
star = 1
]@llllclll
\tnote[n]see Section 4.3 for the details on the ROSINA data
\tnote[o]ice ratios in the cold outer protostellar envelope of the high-mass protostar W33A, which are assumed to be representative of ISM ices (Boogert et al., 1997; van der Tak et al., 2003)
\tnote[p]using the average of the upper limits on the column densities of gauche-C2H5SH and anti-C2H5SH
Species N (cm-2) Molecular ratios relative to H2S (%) Molecular ratios relative to OCS (%)
ALMA B 67P/C–G ALMA B 67P/C–G ISM ices W33A
H2S
OCS
SO -
SO2
S2 -
S3 -
HS2 -
H2S2 -
H2CS -
CH3SH -
C2H5SH -
\ctable[
caption = Molecular ratios as measured with these interferometric ALMA observations at the one beam offset position from source B of IRAS 16293–2422 and with the ROSINA instrument for 67P/C–G,
label = tbl:comprat,
star = 1
]@lrl
Ratio ALMA B 67P/C–G
SO/SO2 (section of Calmonte et al. 2016)
CH3SH/H2CS (based on values in Table LABEL:tbl:67Pcomp)
C2H5SH/CH3SH (based on values in Table LABEL:tbl:67Pcomp)
The presented interferometric observations spatially resolve the hot inner regions near the source B continuum peak, meaning that column densities can be derived and compared on the same scales unambiguously. Moreover, it is possible to detect weaker lines from multiple isotopologues, thereby allowing a better determination of the optical depth. By comparing molecular ratios of interferometric and single dish observations, it is possible to disentangle whether molecules primarily emit on large scales or small inner scales near the source, or whether they are associated with outflows. For this purpose, Table LABEL:tbl:SDcomp has been compiled with molecular ratios of the detected species relative to H2S and OCS (where available), as obtained with the PILS survey with ALMA at the one beam offset position and as compiled from previous single dish observations of Schöier et al. (2002). Since single dish observations cannot spatially resolve the emission, three different sets of abundances are typically provided: one assuming a constant abundance profile and one assuming a jump abundance profile, giving an inner (hot) abundance and an outer (cold) one.
Under the assumption of a constant abundance profile, relative to H2S, the interferometric ratios are lower than those from single dish observations: by a factor of for OCS, by orders of magnitude for SO, and by orders of magnitude for SO2, CS, and H2CS (Table LABEL:tbl:SDcomp). Relative to OCS, the interferometric ratio is a factor of higher than the single dish value for H2S. All other interferometric ratios remain lower than the single dish: by orders of magnitude for SO, by a factor of for SO2, by a factor of for CS and by a factor of for H2CS. Under the assumption of a jump abundance profile, relative to OCS, the differences are either comparable or exacerbated further. The inner ratio is expected to yield the most meaningful comparison with interferometric data, as it is the closest estimate for the hot inner regions studied in this work.
The derived lower interferometric ratios mean that sulphur-bearing species emit on small and large scales. Single dish observations are, therefore, a combination of beam-diluted disc-scale emission (isotopologues detected) and large-scales emission from the envelope and outflows. The largest differences are seen for SO, which is a well-known shock tracer that shows larger line widths in the single dish data (Blake et al., 1994). Some SO2 emission likely originates from outflows as well. Meanwhile, OCS, H2S and H2CS emit also from the envelope. In fact, H2CS is one of the few species detected at large distances from source A (appendices C1 and C2 of Murillo et al. 2017), definitively pointing to its origins in the extended envelope. However, the detection of all these molecules with interferometric data testifies to their presence on small scales of the disc and/or inner envelope as well. Unfortunately, it is not meaningful to quantify these differences, since single dish observations also encompass source A. The emission from sulphur-bearing species is seen to be brighter towards source A, which may correlate with A powering stronger outflows. It is beyond the scope of this work to quantify the individual contributions of the two sources in single dish observations.
4.2 Comparison with interstellar ices
The interstellar ices in clouds and cores prior to the onset of star formation (i.e., prestellar ices) can only be observed in absorption against a bright background source. Observations towards the high-mass protostar W33A also show deep absorption features corresponding to ices in a protostellar envelope, which are water-dominated, but also contain trace species, including CH3OH (Boogert et al., 1997; van der Tak et al., 2003). The ices in the outer cold protostellar envelope have been suggested to be chemically representative of prestellar ices (just prior to star formation) based on observations of non-sulphur bearing molecules (Boogert, Gerakines & Whittet, 2015). Table LABEL:tbl:67Pcomp contains the ice molecular ratios relative to OCS as observed towards W33A in its outer cold protostellar envelope and are assumed to be representative of ISM ices, thus called as such. It is interesting to compare ISM ices to the warm ( K) gas near the forming B protostar of IRAS 16293–2422 to assess the degree of processing between the cold outer protostellar envelope ices and this earliest warm embedded protostellar phase; assuming that the ices have just thermally desorbed, and no gas-phase chemistry has occurred. The ISM SO2/OCS ratio is roughly an order of magnitude higher, which means that in the cold outer protostellar envelope there is more SO2 or less OCS in comparison to the warm protostellar phase of IRAS 16293–2422 B. The H2S/OCS ratio is poorly constrained due to a lack of data on H2S ice and gas. Based on the current limits, the ISM ratio can be lower (by an order of magnitude) or higher (by a factor of ) than that of source B. If the ISM H2S/OCS is indeed higher than that towards source B, then there may indeed be less OCS in the cold outer protostellar envelope than in the warm protostellar phase.
4.3 Comparison with 67P/C-G and ISM ices
IRAS 16293–2422 is thought to be analogous to our innate Solar Nebula, as it is one of the most chemically rich low-mass protostellar systems. Thanks to its proximity and the face-on orientation of the disc around source B, ALMA has been able to start precisely quantifying the chemistry of the disc-neighbourhood of B. Meanwhile, it has also been postulated that comets are the most pristine tracers of the innate cloud and protoplanetary disc that evolved into the Solar System that we have today. Therefore, it is interesting to compare the chemical inventories of comets to those of IRAS 16293–2422 B in order to quantify the chemical budgets of solar and extrasolar building blocks of planetary systems (Schöier et al., 2002; Bockelée-Morvan et al., 2015). The emission seen in the hot inner regions of the B protostellar core could potentially be tracing solid species that are just undergoing thermal desorption and thus, is in fact probing the hidden solid reservoir of planet-building material. The chemical composition of such building blocks will be shaped by many processes at different radii; however, this location likely uniquely probes the solid volatiles prior to modification in the gas-phase.
Table LABEL:tbl:67Pcomp contains the molecular ratios relative to H2S and OCS for IRAS 16293–2422 B in comparison to those of 67P/C–G. The cometary values correspond to bulk coma quantities measured with DFMS/ROSINA and corrected for photodissociation and ionization by the radiation from the Sun (more important when in high proximity to the Sun and when the comet-spacecraft distance is large, e.g., km; table of Calmonte et al. 2016), as obtained between equinox in May 2015 and perihelion in August 2015 (heliocentric distances between and au). The upper limits for HS2 and H2S2 are based on October 2014 data, when H2S abundance was maximized (sections and of Calmonte et al. 2016). The value given for S3 is an estimate based on the sole measurement obtained in March 2015 via a direct comparison of the measured ion current (largely uncertain, section of Calmonte et al. 2016). The value tabulated for H2CS is based upon the sole clear signal at during a flyby in February 2015, when the CO2 abundance was very low and the overlap with C16O18O could be avoided (priv. comm. and section of Calmonte et al. 2016). The value quoted for CH3SH is the mean of the four periods between the start of the mission and perihelion with a signal at corrected for photodissociation and ionization (section of Calmonte et al. 2016). The value quoted for C2H5SH is the mean of four different periods between the start of the mission and perihelion with a signal at not corrected for photodissociation and ionization (sections and of Calmonte et al. 2016), which is highly uncertain due to the assumption of the entire C2H6S peak being associated with ethyl mercaptan and the close overlap with the C5H2 fragment. The errors in Table LABEL:tbl:67Pcomp for the DFMS/ROSINA measurements stem from instrumental uncertainties (section of Calmonte et al. 2016).
From the table, it can be seen that for OCS the ratio relative to H2S for IRAS 16293–2422 B is a factor of higher than that for 67P/C–G, for SO a factor of lower, for SO2 a factor of lower and for CH3SH a factor of lower555This contradicts section of Calmonte et al. (2016) due to different assumptions on the quantity of H2S and the use of abundances versus column densities.. Relative to OCS, the IRAS 16293–2422 B ratios for SO and SO2 are orders of magnitude lower, and for CH3SH is order of magnitude lower. Such large differences are consistent with the fact that H2S has not yet been detected in interstellar ices, but OCS has (Section 4.2).
These results indicate that in the case of IRAS 16293–2422 B there is significantly more OCS available, while for 67P/C–G more H2S is present. Potentially, this has to do with the amount of solid carbon monoxide (CO) available in these systems. OCS may be more easily produced via grain-surface chemistry when CO ice is abundant, as seen in laboratory experiments of Ferrante et al. (2008). If so, then once CO undergoes thermal desorption into the gas-phase around K, the production of OCS would be inhibited (excluding any CO that maybe trapped in other ices). This could be an initial indication of our Solar System being born in a somewhat warmer, K, environment rather than in the K regime, which would lead to a deficiency of CO ice on the grains for the synthesis of OCS. This scenario is also favoured from the point of view of oxygen chemistry and the detection of O2 on 67P/C–G (Bieler et al., 2015; Taquet et al., 2016). In the case of IRAS 16293–2422 B, observations have shown its surrounding core to be very cold ( K; Menten et al. 1987), thus making CO ice plentiful in its birth cloud. It has been suggested that regions with elevated temperatures lead to CO ice-poor conditions, for example, the R CrA region with several low-mass protostars under the irradiation of an intermediate-mass protostar (Lindberg et al., 2014), and Orion hosting intermediate-mass protostars (Jørgensen et al., 2006).
A warmer environment would imply less efficient hydrogenation reactions, as the residence time of hydrogen atoms on the grains is reduced. This would make it difficult to produce H2S through grain-surface atom-addition reactions. This molecule is predominantly formed via the associations of H and S, followed by the reaction of HS with H (e.g, Furuya et al. 2015; Vidal et al. 2017). Some H2S gas can also be produced via gas-phase channels at warmer temperatures. Temperature differences between birth clouds should also be noticeable in terms of complex organics. An initially warmer cloud would enhance mobility of heavy radicals on grain surfaces, such as CH3 and SH, thereby boosting the abundance of complex species, such as CH3SH (although it is not exclusively formed via grain-surface chemistry). The CH3SH/H2CS ratio for IRAS 16293-2422 B is in range of the ratio for 67P/C–G given the errors in ROSINA data (differences by a factor of ; Table LABEL:tbl:comprat). Hence, based the complex S-bearing species CH3SH relative to H2CS, it is not possible to conclusively say which target is richer in complex organic molecules. Given the large differences in the quantities of H2S and OCS between the two data sets, ratios relative to them are less meaningful. As it has only been possible to derive an upper limit for C2H5SH, the C2H5SH/CH3SH ratio cannot yet be used to compare the budgets of S-bearing complex species between IRAS 16293–2422 B and 67P/C–G. A rigorous comparison between IRAS 16293–2422 B and 67P/C–G in terms of a larger set of other O- and N-bearing complex organics is the subject of a dedicated paper.
Additional physics could be at play here - the degree of irradiation that the two targets are subjected to. Our Sun is an isolated star that is thought to have formed in a medium-sized stellar cluster of members (Adams, 2010). Laboratory experiments of Chen et al. (2015) have shown rapid conversion of H2S into OCS upon VUV and EUV irradiation. If IRAS 16293–2422 B experienced higher UV fluxes, perhaps due to its binary A companion, then that may have stimulated the conversion of its H2S reservoir into OCS. In addition, higher levels of UV would explain the higher fraction of complex S-bearing species relative to H2CS of IRAS 16293–2422 B, since UV enhances the availability of radicals in the ice and boosts grain-surface chemistry. This scenario would also correlate with OCS forming during the collapse phases and there, thus, being less OCS in ISM ices (Section 4.2; although, the presence of H2S ice is yet to be demonstrated and quantified in prestellar sources).
Another diagnostic independent of the H2S and OCS quantities, is the SO/SO2 ratio. Based on the presented PILS Band data, it is for IRAS 16293–2422 B; and based on the ROSINA data, it is in the range for 67P/C–G (Table LABEL:tbl:comprat). Such excellent (a factor of ) agreement could point to both datasets sampling comparable materials. If the quantities of SO and SO2 are set before and/or during the prestellar stage, as supported by the detection of SO2 as an ISM ice (Section 4.2), then this again points to IRAS 16293–2422 B and 67P/C–G having formed from similar birth clouds. Unfortunately, even with JWST it may be impossible to quantify the ISM SO/SO2 ice ratio due to the overlap of their symmetric stretching modes. Gas-phase routes to SO and SO2 via reactions of OH and O2 with S at warm temperatures may also skew the ratio.
The ROSINA instrument determined that per cent of the sulphur is in the atomic form and constitutes the second largest sulphur reservoir after H2S (fig. of Calmonte et al. 2016). It was also argued that five times more H2S than detected would be necessary to account for the measured quantity of atomic sulphur, hence it is indeed stored in its atomic form in 67P/C-G (Calmonte et al., 2016). Unfortunately, atomic sulphur does not have any lines in the frequency range covered by the PILS Band data. 67P/C–G has been observed to contain sulphur-chain molecules like S2, S3 and S4, which could, in part, be fragments of even heavier Sn species (up to ). The upper limits derived in this work are less constraining than the quantities measured for 67P/C–G (Table LABEL:tbl:67Pcomp). ROSINA did not (conclusively) detect HS2 and H2S2 (section of Calmonte et al. 2016). These species were not detected towards IRAS 16293–2422 B with the PILS Band data either. It was not possible to derive the abundance of CS with ROSINA, due to interference with CO2; and due to it being a common fragment of other sulphur-bearing species. Hence, it cannot be compared in a meaningful fashion with the data in this work. Finally, as CS2 is a linear symmetric molecule without strong rotational lines, it is not possible to search for it in the PILS Band data; even though it has been clearly detected with mass spectrometry on 67P/C–G.
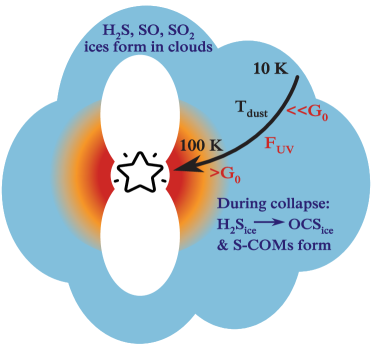
The findings of this work can be summarized in Fig. 2. It seems that the abundances of SO, SO2 and H2S are set in the translucent cloud and prestellar core phases, prior to the onset of collapse. This is supported by the similar relative ratios between the PILS data on IRAS 16293–2422 B, the ISM ices towards W33A (Section 4.2) and the ROSINA data on 67P/C–G. The differences between the datasets can be explained in terms of the amount of UV radiation that the materials are exposed to, which occurs during the collapse of the system, already in the earliest embedded stages, as well as the temperature of the birth cloud. Irradiation brings about the conversion of H2S into OCS and the formation of S-bearing complex organic molecules. This explains the richer chemistry towards IRAS 16293–2422 B and our Solar System, in comparison to cold outer protostellar envelopes. Whether IRAS 16293–2422 B is relatively chemically richer than our Solar System as a result of higher UV fluxes based on its binary nature still remains to be conclusively tested via a larger set of complex organic species. If this is shown to be the case, then this would correlate with IRAS 16293–2422 being one of the most chemically rich low-mass protostars; and imply that our Solar System is not special chemically speaking.
5 Conclusions
In this paper, the sulphur inventory at the one beam offset position from source B in the SW direction in the binary protostellar system IRAS 16293–2422 has been presented. The ALMA Band data analysed are part of the PILS survey towards this target. Sulphur is thought to be a unique simultaneous tracer of both the volatile and refractory components. By comparing molecular ratios observed towards IRAS 16293–2422 B – a Solar System proxy, and those obtained for 67P/C–G – a pristine tracer of the innate Solar Nebula, the chemical links between the early embedded protostellar phases and the protoplanetary building blocks can be explored. The main conclusions of this paper are as follows.
-
1.
The sulphur-bearing species previously detected towards IRAS 16293–2422 B have now been firmly detected towards the one beam offset position and spatially resolved with ALMA: SO2 in the , 34SO2, OCS in the state, O13CS, OC34S, OC33S (first-time detection towards this source), 18OCS, H2CS, HDCS and CH3SH in the state. Furthermore, several are detected tentatively due to a lack of lines and/or blending: SO in the state, OCS in the state, C34S in the state, C33S in the state, C36S (tentative first time detection towards a low-mass protostar), HDS and HD34S. All the lines from these sulphur-bearing molecules are narrow ( km s-1) and are probing the small disc-scales of source B. Unfortunately, the unknown HDS/H2S ratio leaves the column density of H2S uncertain by at least an order of magnitude.
-
2.
In comparison to earlier single dish observations, the molecular ratios determined from interferometric data can be up to four orders of magnitude lower. On large scales, SO and SO2 likely emit from outflows; and OCS, H2S and H2CS originate from the envelope. All these S-bearing species are also present on the small disc- and inner envelope-scales. Single dish data may be dominated by source A, which is bright in emission from S-bearing molecules.
-
3.
In comparison to ROSINA measurements of the bulk volatile composition of 67P/C–G, the molecular ratios of IRAS 16293–2422 B can differ significantly, potentially by several orders of magnitude. In particular, IRAS 16293–2422 B contains much more OCS than H2S. However, the SO/SO2 is in close agreement between the two targets.
-
4.
The agreement in terms of SO, SO2, the disagreement in terms of H2S and OCS, and comparable (differences by a factor of ) CH3SH/H2CS ratios towards IRAS 16293–2422 B in comparison to that of our Solar System (as probed by 67P/C–G) may stem from different levels of UV irradiation during the initial collapse of the systems. Potentially higher UV levels near source B, as a result of its binary structure, may lead to the conversion of H2S into OCS and enhance the formation of S-bearing complex organic molecules. An initially warmer birth cloud may also contribute to the lower quantities of OCS in the Solar System by reducing the amount of available CO ice.
The results also highlight the importance of the level of UV exposure and temperature of the parental clouds, in determining the physical and chemical structures of low-mass protostars. Given that these may vary significantly from region to region (see, e.g., review by Adams 2010), it is also likely that significant source-to-source variations in chemistry may be found. Future studies will also explore the protostellar-cometary connection via isotopic ratios and a full set of complex organic species, thereby isolating chemical links formed during cold phases of evolution that are dominated by grain-surface chemistry from those occurring during warmer, irradiated phases of collapse.
6 Acknowledgements
The authors would like to thank Dr. Catherine Walsh, Dr. Vianney Taquet, Mr. Ko-Ju Chuang and Dr. Martin Rubin for useful discussions on sulphur chemistry and ROSINA measurements. This work is supported by a Huygens fellowship from Leiden University, the European Union A-ERC grant 291141 CHEMPLAN, the Netherlands Research School for Astronomy (NOVA), a Royal Netherlands Academy of Arts and Sciences (KNAW) professor prize, the Center for Space and Habitability (CSH) Fellowship and the IAU Gruber Foundation Fellowship.
The research of JKJ and his group is supported by the European Research Council (ERC) under the European Union’s Horizon 2020 research and innovation programme (grant agreement No 646908) through ERC Consolidator Grant “S4F”. Research at the Centre for Star and Planet Formation is funded by the Danish National Research Foundation. A.C. postdoctoral grant is funded by the ERC Starting Grant 3DICE (grant agreement 336474).
This paper makes use of the following ALMA data: ADS/JAO.ALMA#2013.1.00278.S. ALMA is a partnership of ESO (representing its member states), NSF (USA) and NINS (Japan), together with NRC (Canada), MOST and ASIAA (Taiwan), and KASI (Republic of Korea), in cooperation with the Republic of Chile. The Joint ALMA Observatory is operated by ESO, AUI/NRAO and NAOJ.
References
- Adams (2010) Adams F. C., 2010, ARA&A, 48, 47
- A’Hearn, Schleicher & Feldman (1983) A’Hearn M. F., Schleicher D. G., Feldman P. D., 1983, ApJ, 274, L99
- Ahrens & Winnewisser (1999) Ahrens V., Winnewisser G., 1999, Zeitschrift Naturforschung Teil A, 54, 131
- Aikawa et al. (2012) Aikawa Y. et al., 2012, A&A, 538, A57
- Altwegg et al. (2017) Altwegg K. et al., 2017, MNRAS, 469, S130
- Anderson et al. (2013) Anderson D. E., Bergin E. A., Maret S., Wakelam V., 2013, ApJ, 779, 141
- Asplund et al. (2009) Asplund M., Grevesse N., Sauval A. J., Scott P., 2009, ARA&A, 47, 481
- Balsiger et al. (2007) Balsiger H. et al., 2007, Space Sci. Rev., 128, 745
- Baryshev et al. (2015) Baryshev A. M. et al., 2015, A&A, 577, A129
- Belloche et al. (2013) Belloche A., Müller H. S. P., Menten K. M., Schilke P., Comito C., 2013, A&A, 559, A47
- Belov et al. (1998) Belov S. P., Tretyakov M. Y., Kozin I. N., Klisch E., Winnewisser G., Lafferty W. J., Flaud J.-M., 1998, Journal of Molecular Spectroscopy, 191, 17
- Belov et al. (1995) Belov S. P., Yamada K. M. T., Winnewisser G., Poteau L., Bocquet R., Demaison J., Polyansky O., Tretyakov M. Y., 1995, Journal of Molecular Spectroscopy, 173, 380
- Bettens et al. (1999) Bettens F. L., Sastry K. V. L. N., Herbst E., Albert S., Oesterling L. C., De Lucia F. C., 1999, ApJ, 510, 789
- Bieler et al. (2015) Bieler A. et al., 2015, Nature, 526, 678
- Biver et al. (2016) Biver N. et al., 2016, A&A, 589, A78
- Blake et al. (1994) Blake G. A., van Dishoeck E. F., Jansen D. J., Groesbeck T. D., Mundy L. G., 1994, ApJ, 428, 680
- Blake, van Dishoeck & Sargent (1992) Blake G. A., van Dishoeck E. F., Sargent A. I., 1992, ApJ, 391, L99
- Bockelée-Morvan et al. (2015) Bockelée-Morvan D. et al., 2015, A&A, 583, A6
- Bogey et al. (1997) Bogey M., Civiš S., Delcroix B., Demuynck C., Krupnov A. F., Quiguer J., Tretyakov M. Y., Walters A., 1997, Journal of Molecular Spectroscopy, 182, 85
- Bogey, Demuynck & Destombes (1982) Bogey M., Demuynck C., Destombes J. L., 1982, Journal of Molecular Spectroscopy, 95, 35
- Boogert, Gerakines & Whittet (2015) Boogert A. C. A., Gerakines P. A., Whittet D. C. B., 2015, ARA&A, 53, 541
- Boogert et al. (1997) Boogert A. C. A., Schutte W. A., Helmich F. P., Tielens A. G. G. M., Wooden D. H., 1997, A&A, 317, 929
- Calmonte et al. (2016) Calmonte U. et al., 2016, MNRAS, 462, S253
- Calmonte et al. (2017) Calmonte U. et al., 2017, Monthly Notices of the Royal Astronomical Society, stx2534
- Camy-Peyret et al. (1985) Camy-Peyret C., Flaud J.-M., Lechuga-Fossat L., Johns J. W. C., 1985, Journal of Molecular Spectroscopy, 109, 300
- Caux et al. (2011) Caux E. et al., 2011, A&A, 532, A23
- Cernicharo et al. (2012) Cernicharo J., Marcelino N., Roueff E., Gerin M., Jiménez-Escobar A., Muñoz Caro G. M., 2012, ApJ, 759, L43
- Chen et al. (2015) Chen Y.-J. et al., 2015, ApJ, 798, 80
- Coutens et al. (2016) Coutens A. et al., 2016, A&A, 590, L6
- Drdla, Knapp & van Dishoeck (1989) Drdla K., Knapp G. R., van Dishoeck E. F., 1989, ApJ, 345, 815
- Dubrulle et al. (1980) Dubrulle A., Demaison J., Burie J., Boucher D., 1980, Zeitschrift Naturforschung Teil A, 35, 471
- Duley, Millar & Williams (1980) Duley W. W., Millar T. J., Williams D. A., 1980, MNRAS, 192, 945
- Esplugues et al. (2014) Esplugues G. B., Viti S., Goicoechea J. R., Cernicharo J., 2014, A&A, 567, A95
- Fabricant, Krieger & Muenter (1977) Fabricant B., Krieger D., Muenter J. S., 1977, J. Chem. Phys., 67, 1576
- Ferrante et al. (2008) Ferrante R. F., Moore M. H., Spiliotis M. M., Hudson R. L., 2008, ApJ, 684, 1210
- Furuya et al. (2015) Furuya K., Aikawa Y., Hincelin U., Hassel G. E., Bergin E. A., Vasyunin A. I., Herbst E., 2015, A&A, 584, A124
- Geiss (1988) Geiss J., 1988, in Reviews in Modern Astronomy, Vol. 1, Reviews in Modern Astronomy, Klare G., ed., pp. 1–27
- Gibb et al. (2000) Gibb E. L. et al., 2000, ApJ, 536, 347
- Glassmeier et al. (2007) Glassmeier K.-H., Boehnhardt H., Koschny D., Kührt E., Richter I., 2007, Space Sci. Rev., 128, 1
- Goesmann et al. (2015) Goesmann F. et al., 2015, Science, 349, 020689
- Goicoechea et al. (2006) Goicoechea J. R., Pety J., Gerin M., Teyssier D., Roueff E., Hily-Blant P., Baek S., 2006, A&A, 456, 565
- Golubiatnikov et al. (2005) Golubiatnikov G. Y., Lapinov A. V., Guarnieri A., Knöchel R., 2005, Journal of Molecular Spectroscopy, 234, 190
- Grim & Greenberg (1987) Grim R. J. A., Greenberg J. M., 1987, A&A, 181, 155
- Habing (1968) Habing H. J., 1968, Bull. Astr. Inst. Neth., 19, 421
- Hasegawa et al. (1984) Hasegawa T. et al., 1984, ApJ, 283, 117
- Helminger, Cook & De Lucia (1971) Helminger P., Cook R. L., De Lucia F. C., 1971, Journal of Molecular Spectroscopy, 40, 125
- Hillger & Strandberg (1951) Hillger R. E., Strandberg M. W., 1951, Physical Review, 83, 575
- Hirahara et al. (1992) Hirahara Y. et al., 1992, ApJ, 394, 539
- Jansen, van Dishoeck & Black (1994) Jansen D. J., van Dishoeck E. F., Black J. H., 1994, A&A, 282, 605
- Jefferts et al. (1971) Jefferts K. B., Penzias A. A., Wilson R. W., Solomon P. M., 1971, ApJ, 168, L111
- Jessberger, Christoforidis & Kissel (1988) Jessberger E. K., Christoforidis A., Kissel J., 1988, Nature, 332, 691
- Jessup, Spencer & Yelle (2007) Jessup K. L., Spencer J., Yelle R., 2007, Icarus, 192, 24
- Jørgensen et al. (2011) Jørgensen J. K., Bourke T. L., Nguyen Luong Q., Takakuwa S., 2011, A&A, 534, A100
- Jørgensen et al. (2012) Jørgensen J. K., Favre C., Bisschop S. E., Bourke T. L., van Dishoeck E. F., Schmalzl M., 2012, ApJ, 757, L4
- Jørgensen et al. (2006) Jørgensen J. K., Johnstone D., van Dishoeck E. F., Doty S. D., 2006, A&A, 449, 609
- Jørgensen et al. (2017) Jørgensen J. K. et al., 2017, A&A, subm.
- Jørgensen et al. (2016) Jørgensen J. K. et al., 2016, A&A, 595, A117
- Kolesniková et al. (2014) Kolesniková L., Tercero B., Cernicharo J., Alonso J. L., Daly A. M., Gordon B. P., Shipman S. T., 2014, ApJ, 784, L7
- Le Roy et al. (2015) Le Roy L. et al., 2015, A&A, 583, A1
- Leen & Graff (1988) Leen T. M., Graff M. M., 1988, ApJ, 325, 411
- Ligterink et al. (2017) Ligterink N. F. W. et al., 2017, MNRAS, 469, 2219
- Lindberg et al. (2014) Lindberg J. E., Jørgensen J. K., Green J. D., Herczeg G. J., Dionatos O., Evans N. J., Karska A., Wampfler S. F., 2014, A&A, 565, A29
- Linke, Frerking & Thaddeus (1979) Linke R. A., Frerking M. A., Thaddeus P., 1979, ApJ, 234, L139
- Loinard et al. (2008) Loinard L., Torres R. M., Mioduszewski A. J., Rodríguez L. F., 2008, ApJ, 675, L29
- Lucas & Liszt (2002) Lucas R., Liszt H. S., 2002, A&A, 384, 1054
- Lykke et al. (2017) Lykke J. M. et al., 2017, A&A, 597, A53
- Maeda et al. (2008) Maeda A. et al., 2008, ApJS, 176, 543
- Majumdar et al. (2016) Majumdar L., Gratier P., Vidal T., Wakelam V., Loison J.-C., Hickson K. M., Caux E., 2016, MNRAS, 458, 1859
- Martín-Doménech et al. (2016) Martín-Doménech R., Jiménez-Serra I., Muñoz Caro G. M., Müller H. S. P., Occhiogrosso A., Testi L., Woods P. M., Viti S., 2016, A&A, 585, A112
- Mauersberger et al. (1996) Mauersberger R., Henkel C., Langer N., Chin Y.-N., 1996, A&A, 313, L1
- Menten et al. (1987) Menten K. M., Serabyn E., Guesten R., Wilson T. L., 1987, A&A, 177, L57
- Millar & Herbst (1990) Millar T. J., Herbst E., 1990, A&A, 231, 466
- Minh et al. (1990) Minh Y. C., Irvine W. M., McGonagle D., Ziurys L. M., 1990, ApJ, 360, 136
- Minowa et al. (1997) Minowa H., Satake M., Hirota T., Yamamoto S., Ohishi M., Kaifu N., 1997, ApJ, 491, L63
- Mitchell (1984) Mitchell G. F., 1984, ApJ, 287, 665
- Morino, Yamada & Maki (2000) Morino I., Yamada K. M. T., Maki A. G., 2000, Journal of Molecular Spectroscopy, 200, 145
- Moullet et al. (2013) Moullet A., Lellouch E., Moreno R., Gurwell M., Black J. H., Butler B., 2013, ApJ, 776, 32
- Moullet et al. (2008) Moullet A., Lellouch E., Moreno R., Gurwell M. A., Moore C., 2008, A&A, 482, 279
- Müller et al. (2016) Müller H. S. P. et al., 2016, A&A, 587, A92
- Müller & Brünken (2005) Müller H. S. P., Brünken S., 2005, Journal of Molecular Spectroscopy, 232, 213
- Müller et al. (2005) Müller H. S. P., Schlöder F., Stutzki J., Winnewisser G., 2005, Journal of Molecular Structure, 742, 215
- Mumma & Charnley (2011) Mumma M. J., Charnley S. B., 2011, ARA&A, 49, 471
- Murillo et al. (2017) Murillo N. M., van Dishoeck E. F., van der Wiel M. H. D., Jørgensen J. K., Drozdovskaya M. N., Calcutt H., Harsono D., 2017, A&A, under rev.
- Oppenheimer & Dalgarno (1974) Oppenheimer M., Dalgarno A., 1974, ApJ, 187, 231
- Ortiz-León et al. (2017) Ortiz-León G. N. et al., 2017, ApJ, 834, 141
- Oya et al. (2016) Oya Y., Sakai N., López-Sepulcre A., Watanabe Y., Ceccarelli C., Lefloch B., Favre C., Yamamoto S., 2016, ApJ, 824, 88
- Palumbo, Geballe & Tielens (1997) Palumbo M. E., Geballe T. R., Tielens A. G. G. M., 1997, ApJ, 479, 839
- Palumbo, Tielens & Tokunaga (1995) Palumbo M. E., Tielens A. G. G. M., Tokunaga A. T., 1995, ApJ, 449, 674
- Pastor et al. (1991) Pastor J., Buj J., Estalella R., Lopez R., Anglada G., Planesas P., 1991, A&A, 252, 320
- Patel, Margolese & Dyke (1979) Patel D., Margolese D., Dyke T. R., 1979, J. Chem. Phys., 70, 2740
- Penzias et al. (1971) Penzias A. A., Solomon P. M., Wilson R. W., Jefferts K. B., 1971, ApJ, 168, L53
- Persson et al. (2017) Persson M. V. et al., 2017, A&A, accep.
- Pineau des Forets, Roueff & Flower (1986) Pineau des Forets G., Roueff E., Flower D. R., 1986, MNRAS, 223, 743
- Pineda et al. (2012) Pineda J. E. et al., 2012, A&A, 544, L7
- Powell & Lide (1964) Powell F. X., Lide, Jr. D. R., 1964, J. Chem. Phys., 41, 1413
- Prasad & Huntress (1982) Prasad S. S., Huntress, Jr. W. T., 1982, ApJ, 260, 590
- Rotundi et al. (2015) Rotundi A. et al., 2015, Science, 347, aaa3905
- Ruffle et al. (1999) Ruffle D. P., Hartquist T. W., Caselli P., Williams D. A., 1999, MNRAS, 306, 691
- Sakai et al. (2014) Sakai N. et al., 2014, Nature, 507, 78
- Schöier et al. (2002) Schöier F. L., Jørgensen J. K., van Dishoeck E. F., Blake G. A., 2002, A&A, 390, 1001
- Smith et al. (1988) Smith D., Adams N. G., Giles K., Herbst E., 1988, A&A, 200, 191
- Tanaka, Tanaka & Suzuki (1985) Tanaka K., Tanaka T., Suzuki I., 1985, J. Chem. Phys., 82, 2835
- Taquet et al. (2016) Taquet V., Furuya K., Walsh C., van Dishoeck E. F., 2016, MNRAS, 462, S99
- Tsunekawa et al. (1989) Tsunekawa S., Taniguchi I., Tambo A., Nagai T., Kojima T., Nakagawa K., 1989, Journal of Molecular Spectroscopy, 134, 63
- Turner (1992) Turner B. E., 1992, ApJ, 396, L107
- van der Tak et al. (2003) van der Tak F. F. S., Boonman A. M. S., Braakman R., van Dishoeck E. F., 2003, A&A, 412, 133
- van Dishoeck et al. (1995) van Dishoeck E. F., Blake G. A., Jansen D. J., Groesbeck T. D., 1995, ApJ, 447, 760
- Vidal et al. (2017) Vidal T. H. G., Loison J.-C., Jaziri A. Y., Ruaud M., Gratier P., Wakelam V., 2017, MNRAS, 469, 435
- Viswanathan & Dyke (1984) Viswanathan R., Dyke T. R., 1984, Journal of Molecular Spectroscopy, 103, 231
- Watt & Charnley (1985) Watt G. D., Charnley S. B., 1985, MNRAS, 213, 157
- Wilson (1999) Wilson T. L., 1999, Reports on Progress in Physics, 62, 143
- Wilson & Rood (1994) Wilson T. L., Rood R., 1994, ARA&A, 32, 191
- Winnewisser & Cook (1968) Winnewisser G., Cook R. L., 1968, Journal of Molecular Spectroscopy, 28, 266
- Wlodek, Bohme & Herbst (1988) Wlodek S., Bohme D. K., Herbst E., 1988, MNRAS, 235, 493
- Woods et al. (2015) Woods P. M., Occhiogrosso A., Viti S., Kaňuchová Z., Palumbo M. E., Price S. D., 2015, MNRAS, 450, 1256
- Xu et al. (2012) Xu L.-H. et al., 2012, J. Chem. Phys., 137, 104313
- Zapata et al. (2015) Zapata L. A., Palau A., Galván-Madrid R., Rodríguez L. F., Garay G., Moran J. M., Franco-Hernández R., 2015, MNRAS, 447, 1826
Appendix A Partition of sulphur on 67P/C–G
For the moment, the data on elemental abundances in the dust of 67P/C–G has not been released by the Cometary Secondary Ion Mass Spectrometer (COSIMA) team. Therefore, the partition of sulphur between the refractory (dust) and volatile (ice) components has been derived based upon the information on the S/O ratio in volatiles as derived by the ROSINA team and the results obtained for comet 1P/Halley (Jessberger, Christoforidis & Kissel, 1988).
For comet 1P/Halley, it has been shown that the dust to ice mass ratio is:
| (2) |
so then:
| (3) |
In other terms:
| (4) |
and
| (5) |
According to Geiss (1988), per cent of all the oxygen atoms on 1P/Halley is in the refractory (dust) component by number, i.e.:
| (6) |
where are total numbers of atoms and is dimensionless. So:
| (7) |
Then the number densities (in cm-3) of oxygen in the refractory (dust) and volatile (ice) components of 1P/Halley are given by:
| (8) | ||||
| (9) |
where are the mass densities (in g cm-3). The ratio of the two is:
| (10) |
Now let us assume that 1P/Halley and 67P/C–G have been made from the same dust and ice. This means that , , and that , . Then it also follows that:
| (11) |
For comet 67P/C–G, Rotundi et al. (2015) derived that the dust to ice mass ratio is:
| (12) |
so then:
| (13) |
In other terms:
| (14) |
and
| (15) |
Subsequently, the numbers of oxygen atoms in the refractory (dust) and volatile (ice) components of 67P/C–G become:
| (16) | ||||
| (17) | ||||
| (18) | ||||
| (19) |
and the ratio of the two is:
| (20) | ||||
| (21) |
Hence:
| (22) |
This implies that per cent of all the oxygen atoms on 67P/C–G is in the refractory (dust) component by number; and that per cent of all the oxygen atoms on 67P/C–G is in the volatile (ice) component by number.
It has also been shown by Jessberger, Christoforidis & Kissel (1988) that S/O in the dust of 1P/Halley is per cent (based on values in table ). Assuming again that 1P/Halley and 67P/C–G have been made from the same dust, i.e.:
| (23) |
then the overall S/O ratio in the dust and ice of 67P/C–G is:
| (24) |
where the S/O in the ice of 67P/C–G of per cent has been used (as given in section of Calmonte et al. 2016) as derived from ROSINA data.
If and , then:
| (25) | ||||
| (26) | ||||
| (27) | ||||
| (28) |
This means that per cent of all the sulphur atoms on 67P/C–G are in the volatile (ice) component by number; and that per cent of all the sulphur atoms on 67P/C–G are in the refractory (dust) component by number.
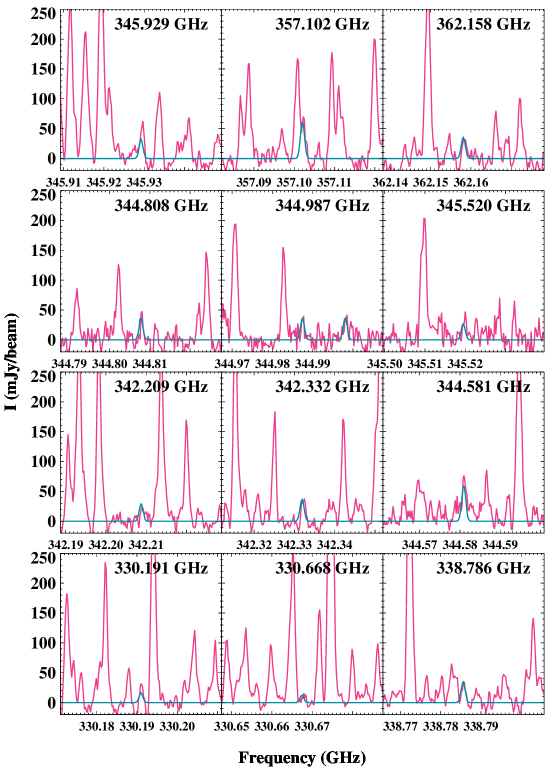
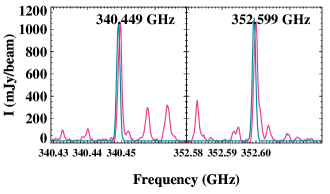
Appendix B A selection of lines and synthetic spectra of S-bearing species in the PILS Band dataset


Appendix C Spectroscopic laboratory information
The database sources, CDMS or JPL catalogues with their entry numbers, have been provided in the main text for all the species that have been searched for. In addition, the primary references on which these entries are based along with references for the dipole moments for all detected or possibly detected species are given below. Furthermore, the references with laboratory measurements in the range of the PILS survey in cases, in which the primary reference does not cover such data or if these data are an important contribution to the line list, are also included.
C.1 SO2
C.2 SO
C.3 OCS
The main sources for the OCS entries are: Golubiatnikov et al. (2005) for OCS, ; Morino, Yamada & Maki (2000) for OCS, ; Dubrulle et al. (1980) for O13CS, OC34S and OC33S. Dipole moment values were determined for OCS in various vibrational states and for several isotopic species by Tanaka, Tanaka & Suzuki (1985).
C.4 CS
C.5 H2CS
C.6 H2S
The H2S entry is based to a considerable extent on Belov et al. (1995). The entries of HDS and HD34S are based on Camy-Peyret et al. (1985). The HDS transition frequencies with microwave accuracy were summarized by Helminger, Cook & De Lucia (1971). Hillger & Strandberg (1951) reported a small number of HD34S and HDS transition frequencies. Viswanathan & Dyke (1984) determined dipole moments of H2S, HDS and D2S.
C.7 CH3SH
Appendix D All the non-detected species
The one beam offset position of the PILS Band dataset was searched for all the sulphur-bearing molecules available in the CDMS catalogue. All those detected are given in Table LABEL:tbl:bestfit. All those not detected, but with a derived upper limit are given in Table LABEL:tbl:upperlim. The following is a list of all other non-detected species at the level ( mJy beam-1 channel-1 or mJy beam-1 km s-1) and their corresponding CDMS entries in brackets: SO2 (64503), 33SO2 (65501), S18OO (66502), S17OO (65502), SO (48502), 34SO (50501), 33SO (49501), 36SO (52502), S18O (50502), S17O (49502), SO+ (48010), 17OCS (61504), OC36S (64510), 18OC34S (64511), 18O13CS (63503), O13C34S (63502), O13C33S (62507), CS (44501), CS+ (44512), 13C36S (49508), H2C34S (48508), H2C33S (47506), HCS (47505), H2S (34502), D2S (36503), DS (38507), cis-HOSO+ (65510), Si34S (62508), Si33S (61508), Si36S (64514), 29SiS (61506), 30SiS (62510), 29Si34S (63504), 29Si33S (62512), 29Si36S (65507), 30Si34S (64513), 30Si33S (63505), 30Si36S (66505), SiS (60506), HSiS (61512), H2SiS (62513), OSiS (76517), HOCS+ (61510), HSCO+ (61509), t-HC(O)SH (62515), c-HC(O)SH (62516), SH+ (33505), HSO (49512), NS (46516), N34S (48509), N33S (47509), N36S (50516), 15NS (47510), DNCS a-type (60510), DNCS b-type (60511), HN13CS a-type (60512),H15NCS a-type (60513), HNC34S a-type (61519), C3S (68503), C3S (68505), C13CCS (69502), 13CCCS (69503), CC13CS (69507), CS (70502), CC13C34S (71503), C13CC34S (71504), 13CCC34S (71505), C13C13CS (70506), 13CC13CS (70507), OC3S (84502), H2C3S (70503), C4S (80501), C5S (92501), 13CC4S (93501), C13CC3S (93502), CCC2S (93503), CCCS (93504), CCS (93505), CS (94502), CaS (72501), ScS (77509), 46TiS (78503), TiS (80505), 50TiS (82503), YS (121502).
The following species have not been detected, because they do not have lines in the frequency range surveyed with PILS Band data: CS (44510), CS (44511), C34S (46510); 13CS (45501); 13CS (45509); 13C34S (47501), 13C33S (47501), HS (36504), HS (35503), Si34S (62509), 29SiS (61507), 30SiS (62511), SiS (60507), SiS (60508), S (32511), SH- (33504), NS (46517), 15N34S (49511), HS (33508), HS (33509), H13CS+ (46504), HSCH2CN (73503), HCNS (59510), HSNC (59511), HS13CN (60514), DSCN (60515), HSC15N (60516), H34SCN (61520), C7S (116501).
Finally, the following is a list of all other non-detected species at the level ( mJy beam-1 channel-1 or mJy beam-1 km s-1) that are available only in the JPL catalogue and their corresponding JPL entries in brackets: MgS (56009), 13CCS (57001), C13CS (57002), CC34S (58001), PS (63007), SO2 (64005), H2SO4 (98001). SD (34005) does not have lines in the frequency range surveyed with PILS Band data.
Appendix E Comparison with a model of hot cores
Efforts on chemical modelling of sulphur networks have recently been revived by Woods et al. (2015). The authors computed the abundances of sulphur-bearing species for hot core conditions upon the inclusion of recent experimental and theoretical data into their chemical network, including a refractory sulphur residue. The modelled molecular ratios (relative to either H2S or OCS; as tabulated in table of Woods et al. (2015) for the standard model with the interstellar cosmic ray ionization rate of s-1) can be compared to those derived in this work for IRAS 16293–2422 B. The exact values are given in Table LABEL:tbl:compmodels. An agreement within one order of magnitude is found for OCS and CS relative to H2S, and for H2S relative to OCS. The modelled ratios for H2CS are three orders of magnitude higher, which may be explained by the fact that the grain-surface network used in the models is fairly small and the grain-surface chemistry is not accounted for in full. H2CS is expected to be involved in many grain-surface reactions and will likely be used up for synthesis of larger sulphur-bearing species, such as CH3SH (analogous to the sequential hydrogenation of CO leading to CH3OH with H2CO as an intermediate).
For SO and SO2, the differences are many orders of magnitude between the observed and modelled values of Woods et al. (2015). This likely has to do with the fact that the models have been run for a very long time of yr, which implies that many gaseous species are driven into SO and SO2, leading to their overproduction. At earlier times (as seen in fig. of Woods et al. 2015), the model results have a closer agreement for SO with observations. SO2 remains too high nevertheless, which may have to do with thermal desorption being calculated via an efficiency factor. It seems that the modelling approach of Woods et al. (2015) is insufficient at reproducing the sulphur chemistry towards IRAS 16293–2422 B. The differences with cometary ROSINA measurements are just as large. The development of a full gas-grain chemical network for sulphur, including grain-surface chemistry, is the topic of future research. For the case of dark prestellar core, Vidal et al. (2017) have been able to successfully reproduce observed abundances of sulphur-bearing species without the need for artificial sulphur depletion.
A comparison with observations of hot cores, such as Sgr B2(N), Sgr B2(M) (e.g., Belloche et al. 2013) and Orion KL (e.g., Esplugues et al. 2014) is beyond the scope of this paper due to the mandatory discussion on emitting regions and structures sampled with observations. Future high spatial resolution ALMA observations will mediate this problem.
[
caption = Molecular ratios relative to H2S and OCS as measured with these interferometric ALMA observations at the one beam offset position from source B of IRAS 16293–2422 in comparison to hot core models,
label = tbl:compmodels,
star = 1,
]@lrrrr
\tnote[q]values taken from Table LABEL:tbl:SDcomp
\tnote[r]table of Woods et al. (2015) for the standard model with the interstellar cosmic ray ionization rate of s-1
Species Molecular ratios relative to H2S (%) Molecular ratios relative to OCS (%)
ALMA B model ALMA B model
H2S
OCS
SO
SO2
CS
H2CS