A Virgo Environmental Survey Tracing Ionised Gas Emission (VESTIGE).I. Introduction to the Survey††thanks: Based on observations obtained with MegaPrime/MegaCam, a joint project of CFHT and CEA/DAPNIA, at the Canadian-French-Hawaii Telescope (CFHT) which is operated by the National Research Council (NRC) of Canada, the Institut National des Sciences de l’Univers of the Centre National de la Recherche Scientifique (CNRS) of France and the University of Hawaii.
Abstract
Context. The Virgo Environmental Survey Tracing Ionised Gas Emission (VESTIGE) is a blind narrow-band H+[NII] imaging survey carried out with MegaCam at the Canada-France-Hawaii Telescope. The survey covers the whole Virgo cluster region from its core to one virial radius (104 deg2). The sensitivity of the survey is of 4 10-17 erg sec-1 cm-2 (5 detection limit) for point sources and 2 10-18 erg sec-1 cm-2 arcsec-2 (1 detection limit at 3 arcsec resolution) for extended sources, making VESTIGE the deepest and largest blind narrow-band survey of a nearby cluster. This paper presents the survey in all its technical aspects, including the survey design, the observing strategy, the achieved sensitivity in both the narrow-band H+[NII] and in the broad-band filter used for the stellar continuum subtraction, the data reduction, calibration, and products, as well as its status after the first observing semester. We briefly describe the H properties of galaxies located in a 41 deg2 strip in the core of the cluster north of M87, where several extended tails of ionised gas are detected. This paper also lists the main scientific motivations of VESTIGE, which include the study of the effects of the environment on galaxy evolution, the fate of the stripped gas in cluster objects, the star formation process in nearby galaxies of different type and stellar mass, the determination of the H luminosity function and of the H scaling relations down to 106 M⊙ stellar mass objects, and the reconstruction of the dynamical structure of the Virgo cluster. This unique set of data will also be used to study the HII luminosity function in hundreds of galaxies, the diffuse H+[NII] emission of the Milky Way at high Galactic latitude, and the properties of emission line galaxies at high redshift.
Aims.
Methods.
Results.
Key Words.:
Galaxies: clusters: general; Galaxies: clusters: individual: Virgo; Galaxies: evolution; Galaxies: interactions; Galaxies: ISM1 Introduction
Understanding the formation and evolution of galaxies remains a primary goal of modern astrophysics. The study of large samples of galaxies detected in wide field, multifrequency, ground- and space-based surveys, both in the local Universe (SDSS - York et al. 2000, GALEX - Martin et al. 2005, 2MASS - Skrutskie et al. 2006, ALFALFA - Giovanelli et al. 2005, HIPASS - Meyer et al. 2004, NVSS - Condon et al. 1998, WISE - Wright et al. 2010, all sky surveys) and at high redshift, has led to significant progress towards an understanding of the process of galaxy evolution. The sensitivity, angular and spectral resolutions of the multifrequency data obtained in the most recent surveys have been fundamental in tracing the physical properties of different galaxy components, e.g., stellar populations, gas in its different phases (cold atomic and molecular, ionised, hot), heavy elements (metals and dust), and dark matter, whose content and distribution are tightly connected to the evolutionary state of galaxies (e.g., Boselli 2011). These achievements have been mirrored by advances in the speed and precision of numerical methods used to simulate the formation of structures over wide ranges in mass and radius (e.g. Vogelsberger et al. 2014; Genel et al. 2014; Schaye et al. 2015; Crain et al. 2015).
Both observations and simulations consistently point to two main factors as key drivers of galaxy evolution: the secular evolution mainly driven by the dynamical mass of the system (e.g. Cowie et al. 1996; Gavazzi et al. 1996; Boselli et al. 2001) and the environment in which galaxies reside (Dressler 1980; Dressler et al. 1997; Balogh et al. 2000; Kauffmann et al. 2004; Boselli & Gavazzi 2006, 2014; Peng et al. 2010). The relative importance of these two factors over cosmic timescales for systems of different mass and type, however, remains elusive. Further progress hinges on the characterisation of astrophysical processes that are not fully understood at the present time: e.g., cold gas accretion from filaments, gas dynamics, radiative cooling, star formation, stellar/AGN feedback, as well as all the possible effects induced by the interaction of galaxies with their surrounding environments.
The distribution of galaxies in the Universe is highly inhomogeneous, with densities spanning several orders of magnitude. If is the average field density, the density varies from 0.2 in voids to 5 in superclusters and filaments, 100 in the core of rich clusters, up to 1000 in compact groups (Geller & Huchra 1989). Although containing only 5% of the local galaxies, clusters are ideal laboratories to study the physical mechanisms perturbing galaxy evolution in dense environments. Because of their high density, gravitational interactions between cluster members are expected to be frequent. At the same time, clusters are characterised by a hot ( 107-108 K) and dense ( 10-3 cm-3) intracluster medium trapped within their potential well (e.g. Sarazin 1986). The interaction of galaxies with this diffuse intracluster medium can easily remove their interstellar medium, thus affecting their star formation activity.
Environmental processes can be broadly separated in two classes: those related to the gravitational interactions between galaxies or with the potential well of over-dense regions (merging - Kauffmann et al. 1993; tidal interactions - Merritt 1983; Byrd & Valtonen 1990; harassment - Moore et al. 1998), and those exerted by the hot and dense intracluster medium (ICM) on galaxies moving at high velocity within clusters (ram pressure stripping - Gunn & Gott 1972; viscous stripping - Nulsen 1982; thermal evaporation - Cowie & Songaila 1977; starvation - Larson et al. 1980). Since the large, dynamically-bounded structures observed in the local Universe form through the accretion of smaller groups of galaxies (Gnedin 2003; McGee et al. 2009; De Lucia et al. 2012), environmental processes are now believed to influence galaxies even before they enter rich clusters in the high-redshift Universe (pre-processing - Dressler 2004). This unexpected discovery has spawned a renewed interest in the detailed properties of galaxies in the local Universe, since such systems are the obvious test-beds for theories that attempt to explain this cosmic evolution. Indeed, studies of the high-redshift Universe can give us an integrated, statistical picture of galaxy evolution over cosmic time, but it is only through detailed studies of the local volume that we can hope to understand the detailed role of gas dynamics, cooling, star formation, feedback and environment in the hierarchical assembly of baryonic substructures.
Because of its proximity (16.5 Mpc), the Virgo cluster has been an ideal target for the study of the transformation of galaxies in rich environments. The first blind photographic survey of the cluster, led by A. Sandage, G. Tammann and B. Binggeli, was possible only after the construction of the 2.5m (100-inch) Irénée du Pont telescope at Las Campanas (Chile) in 1977. The telescope was expressly designed to have an exceptionally wide field for direct photography (1.5o 1.5o) and was thus perfectly tuned to cover the whole Virgo cluster region. Only recently, the advent of the new generation of large panoramic detectors made it possible to cover the whole cluster, which exceeds 100 deg2, from the UV to the radio wavelengths.
The studies of emission lines, however, which for wide field cameras require specific and expensive narrow-band filters of large physical size, have thus far been limited to pointed observations. Very deep H observations of a few galaxies in nearby clusters, including our recent observations with MegaCam, have led to several intriguing discoveries. They have shown that the ionised phase appears to be an ideal tracer of stripped gas in dense regions: 50% of late-type galaxies show extended ( 50 kpc) tails of ionised gas with surface brightness a few 10-18 erg sec-1 cm-2 arcsec-2 (Boselli & Gavazzi 2014), while only a handful of galaxies have extended cold or hot gaseous tails (Chung et al. 2007; Sun et al. 2006, 2007, 2010; Scott et al. 2012; Sivanandam et al. 2014; Jachym et al. 2014). In some objects, the cometary shape of the tails indicates that the gas has been stripped by the interaction with the hot ICM (Gavazzi et al. 2001; Yoshida et al. 2002; Yagi et al. 2010; Fossati et al. 2012, 2016, 2018 - paper III; Zhang et al. 2013; Boselli et al. 2016a); in other systems, bridges of ionised gas linking different nearby galaxies are associated with tidal tails in the stellar component, suggesting gravitational perturbations with nearby companions or within infalling groups (i.e., pre-processing; Kenney et al. 2008; Sakai et al. 2012; Gavazzi et al. 2003a; Cortese et al. 2006). They have also shown that within the tails of stripped gas, star formation in compact HII regions occurs in some but not in all objects (Gavazzi et al. 2001; Yoshida et al. 2008; Hester et al. 2010; Fumagalli et al. 2011b; Fossati et al. 2012; Boissier et al. 2012; Yagi et al. 2013; Kenney et al. 2014; Boselli et al. 2016a, 2018 - paper IV). The removal of the gas affects the activity of star formation of galaxies on different timescales that depend on the perturbing mechanism (Larson et al. 1980; Boselli et al. 2006, 2016b; Bekki 2009, 2014; McGee et al. 2009; Cen 2014; Fillingham et al. 2015; Rafieferantsoa et al. 2015). The distribution and the morphology of the star-forming regions within galaxies is also tightly connected to the perturbing mechanisms (increases in the nuclear star formation activity and asymmetric distributions of star-forming regions are typical in gravitational interactions, radially truncated star-forming discs in interactions with the ICM, fainter star forming discs in starvation, Kennicutt & Keel 1984; Barton et al. 2000; Boselli et al. 2006; Ellison et al. 2008; Scudder et al. 2012; Patton et al. 2011, 2013). All these pieces of evidence underline the power of NB H imaging data in identifying the dominant perturbing mechanism in dense environments.
|
References: 1) Gavazzi et al. (1999); 2) Mei et al. (2007); 3) Boselli et al. (2014); 4) Nulsen & Böhringer (1995); 5) Girardi et al. (1998); 6) Schindler et al. (1999); 7) McLaughlin (1999); 8) Urban et al. (2011); 9) Ferrarese et al. (2012); 10) Böhringer (2005), private communication; 11) Böhringer et al. (1994); 12) derived using the vs. relation given in Biviano et al. (2006); 13) derived using the vs. relation given in Evrard et al. (2008).
Many questions, however, remain unanswered due to the lack of systematic studies of the ionised diffuse gas through optical
emission lines. This leaves many diagnostics that are key to the study of environmental processes
nearly unexplored. Combined with multifrequency data, optical NB observations are crucial for identifying environment-induced
effects on the different gaseous components and, ultimately, understanding the impact on star formation activity, stellar
populations, and the fate of the stripped material. The main questions that a deep, complete, homogeneous H survey of a
nearby cluster will answer are:
-
1.
What fraction of galaxies shows signs of perturbation as a function of galaxy mass and local density? What fraction of galaxies are perturbed by gravitational interactions or interactions with the ICM?
-
2.
How efficiently is the gas stripped in the different phases during the interaction with the surrounding environment? How quickly does the gas change phase once it has been removed from the galaxy disc?
-
3.
What are the ionising sources for the H emitting gas (i.e., galactic or extraplanar HII regions, thermal conduction, turbulence, MHD waves, etc)?
-
4.
How is the nuclear and disc star formation activity of galaxies perturbed during the interaction? At which point in the interaction is the star formation activity stopped: i.e., was the quenching rapid?
Within this framework, our team has been recently awarded 50 nights of telescope time at the Canadian French Hawaii Telescope (CFHT) to map the whole Virgo cluster region within one virial radius ( 104 deg2) with MegaCam using a newly commissioned narrow-band H+[NII] filter111Hereafter we will refer to the H+[NII] band simply as H, unless otherwise stated.. This project, called VESTIGE (A Virgo Environmental Survey Tracing Ionised Gas Emission222http://mission.lam.fr/vestige/), is one of the three large projects selected for the 2017-2019 observing campaigns at the CFHT. At the time of writing, after the decommissioning of SUPRIME Cam from Subaru, there is no large telescope with wide-field capability other than the CFHT equipped with H narrow-band imaging filters (at redshift 0 or above) anywhere in the world. The principal aim of this survey is that of studying the effects of the environment on galaxy evolution through the observation, the analysis, and the modelling of the ionised gas phase of the interstellar medium (ISM) of galaxies stripped during their interaction with the hostile Virgo cluster.
In this first paper we describe the survey design and the observing strategy, and we present the scientific motivations for this project. We also report on the status of the survey after the first semester of observations. The paper is structured as follows: in Sect. 2 we describe the Virgo cluster. In Sect. 3 we give the motivations, the instrumental set-up, the design of the survey and the observing strategy, in Sect. 4 the data processing and in Sect. 5 we explain how the full set of data will be made available to the community. In Sect. 6 we describe the observations obtained in the 2017A semester for a 41 deg2 strip across the core of the cluster. The scientific objectives of the survey are described in Sect. 7, while in Sect. 8 we present the synergy with other projects and we list the planned follow-up observations necessary for a full exploitation of the data. Throughout VESTIGE (unless otherwise stated in individual publications) we use a flat CDM cosmology with = 70 km s-1 Mpc-1, = 0.3, and = 0.7.
2 The Virgo Cluster: A Unique Laboratory for Environmental Studies
The Virgo cluster is the richest cluster of galaxies within 35 Mpc. It is located at a distance of 16.5 Mpc (Gavazzi et al. 1999; Mei et al. 2007; Blakeslee et al. 2009) and has a total mass of = (1.4-4.2) 1014 M⊙ (Nulsen & Böhringer 1995, Girardi et al. 1998, Schindler et al. 1999, McLaughlin 1999, Urban et al. 2011; see Table 1), where is the total mass within the radius in which the mean mass density is 200 times the critical cosmic mass density. With thousands of member galaxies lying at a nearly common distance and spanning all known morphological types, Virgo has historically played a key role in studies of how galaxies form and evolve in dense environments (e.g. Boselli & Gavazzi 2006). Virgo is composed of a primary virialised system (subcluster A) dominated by quiescent early-type galaxies, and by several smaller substructures falling onto the main cluster and dominated by late-type systems (Binggeli et al. 1987; Gavazzi et al. 1999; Solanes et al. 2002; Boselli et al. 2014a). The physical properties of late-type galaxies vary dramatically from the periphery (where galaxies are virtually identical to unperturbed field objects in terms of gas content and star formation activity) to the cluster core (dominated by highly perturbed systems deprived of their gas and dust reservoir and with a significantly reduced star formation activity; Kennicutt 1983; Cayatte et al. 1990; Solanes et al. 2001; Vollmer et al. 2001; Gavazzi et al. 1998, 2002a, 2002b, 2005, 2006, 2013; Cortese et al. 2010a, 2012; Boselli et al. 2014a,2014c, 2016b). A wealth of observational evidence consistently indicates that Virgo is a young cluster still in formation (Tully & Shaya 1984; Gavazzi et al. 1999; Karachentsev & Nasonova 2010; Karachentsev et al. 2014; Sorce et al. 2016), and many individual member galaxies have been identified that highlight the various mechanisms by which environment can influence galaxy evolution (e.g. Vollmer 2003; Kenney et al. 2004; Vollmer et al. 2004; Boselli et al. 2005, 2006, 2016a; Haynes et al. 2007; Crowl & Kenney 2008; Abramson et al. 2011). Virgo is thus an ideal laboratory for studying (at high resolution) the perturbing mechanisms that shaped galaxy evolution.
The development of wide-field, ground- and space-based facilities has made Virgo accessible for blind surveys at different wavelengths, from the X-ray to the UV, visible, near- and far-IR, and radio, allowing astronomers to map at exquisite sensitivity and angular resolution the different constituents of galaxies (e.g., stars, cold gas in the atomic and molecular phase, ionised and hot gas, dust, magnetic fields) and the intracluster medium (see Sect. 8). At the distance of Virgo, the typical 1-10” resolution achieved by these surveys corresponds to 0.1-1 kpc and thus perfectly matches that of the most recent cosmological hydrodynamic simulations. Moreover, the dwarf galaxy population is accessible down to 105 M⊙ (NGVS, Ferrarese et al. 2016; Roediger et al. 2017). Virgo is thus the ideal target to extend the stellar mass dynamic range sampled by SDSS and other local surveys by nearly two orders of magnitude. Since it is spiral-rich, it is also better suited than more distant relaxed clusters, such as Coma, for identifying galaxies being transformed by their environments. Furthermore, Virgo has physical properties (dynamical mass, gas temperature and density) significantly different than those encountered in other nearby clusters such as Coma, A1367, and Norma, and thus can be used to extend previous studies to less extreme but more frequent and representative over-dense regions in the local Universe. For these reasons Virgo is, without question, the most thoroughly studied cluster of galaxies in the Universe, and remains the best target at low-redshift for a systematic study of the different perturbing mechanisms acting on galaxies in dense environments.
3 VESTIGE: A Deep H Survey of the Virgo Cluster
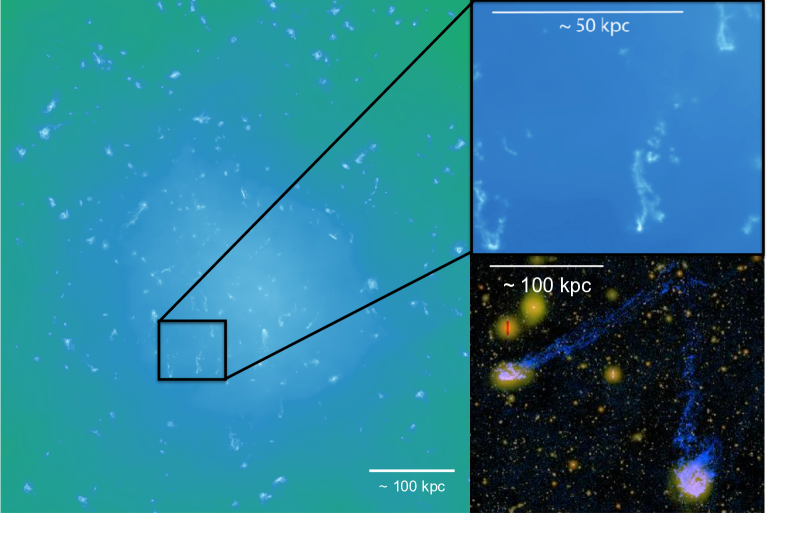
A systematic H survey of Virgo is imperative if we are to understand the effects of the environment on galaxy evolution. VESTIGE has been designed to detect the low surface brightness tails of ionised gas observed in a handful of nearby cluster galaxies or predicted by hydrodynamic simulations to be the smoking gun of ongoing gas stripping (Tonnesen & Bryan 2010). VESTIGE will thus produce the definitive dataset against which to compare and test cosmological models of galaxy formation (Fig. 1). Compared to previous observations, which have so far targeted only a few, subjectively-selected galaxies, VESTIGE will provide dramatic improvements in depth (100 in luminosity for point sources), surface brightness sensitivity (30), angular resolution (3 in seeing), and sky coverage (100). Equally important, the survey will open many synergistic opportunities with planned and ongoing Virgo surveys at other wavelengths.
3.1 CFHT and MegaCam
The observations are carried out using MegaCam, a wide-field optical imager mounted on the prime focus of the 3.6 m CFHT (Boulade et al. 2003). The focal ratio of the camera is F/3.77. MegaCam is composed of 40 back-illuminated 20484096 pixels CCDs, with a pixel size of 0.187 arcsec on the sky and a typical read noise of 5 pixel-1. Their typical efficiency at 6563 Å is 77%. The inner 36 CCDs cover a rectangular field of view of size 0.96 0.94 deg2, while the remaining (unvignetted) CCDs are located at the R.A. edges of the camera (see Fig. 3 in Ferrarese et al. 2012). The gaps between the different CCDs are either 13” or 80” wide due to the camera design.
3.2 The narrow-band H filter
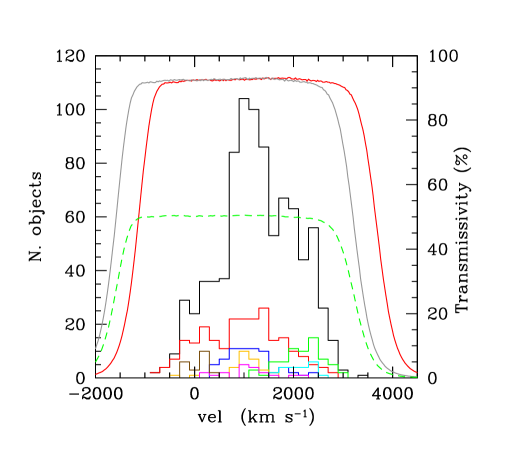
The observations employ the newly commissioned H NB filter (MP9603). The filter bandpass measured for a F/8 focal ratio at a temperature of 20oC covers the range 6538 6644 Å (central wavelength = 6591Å, 106 Å, with a typical transmissivity of 93%). The transmissivity curves of NB interferential filters slightly changes with focal ratio and temperature. A blueshift of the central wavelength is expected when going from a parallel to a converging beam (the shift is non linear), with a typical blueshift of 0.25 Å/degree is expected for decreasing temperature. A decrease of the focal ratio and of the temperature also induce a very small decrease of the peak transmissivity and a slight broadening of the filter. Given that the observations are carried out in spring time, the typical temperature at the telescope is 0oC, corresponding to 5 Å blueshift. Adding an extra 5 Å blueshift for changing the focal F/8 to F/3.77, the expected blueshift of the central wavelength during observing conditions is of 10 Å. If we do not consider any extra marginal variation of the transmissivity curve, the NB filter covers the velocity range -1140 +3250 km s-1 for the H line, and is thus perfectly suited for the velocity range of galaxies within the cluster (Binggeli et al. 1987; Boselli et al. 2014a), as depicted in Fig. 2. The filter width also brackets the two [NII] lines at 6548 Å and 6583 Å.
3.3 Survey geometry, exposure times and achieved depth
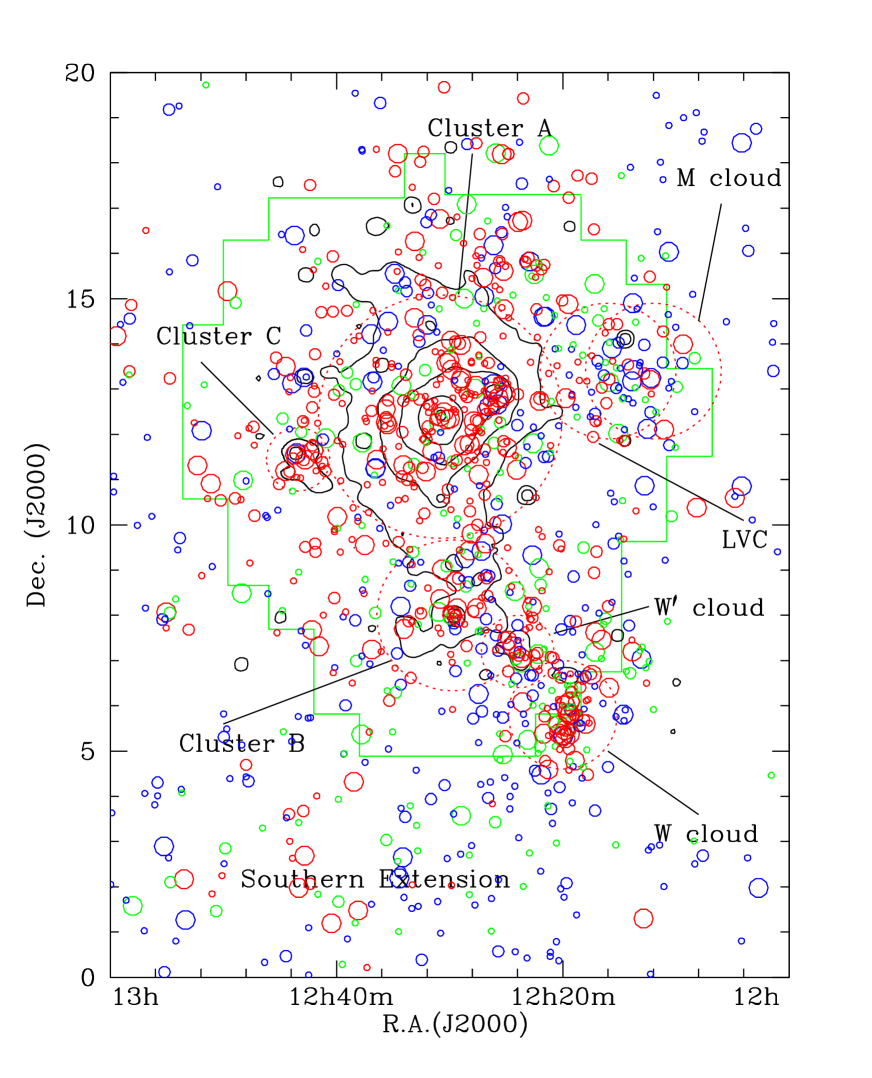
Virgo is located between 12h R.A. 13h and 0o dec 18o. NGVS catalogued 3700 Virgo cluster member galaxies within the VESTIGE footprint, out of which 550 are blue, presumably star-forming systems (Ferrarese et al., in prep.) as depicted in Fig. 3.
The primary goal of VESTIGE is the detection of low surface brightness features such as those observed in a few cluster galaxies (Gavazzi et al. 2001; Sun et al. 2007; Kenney et al. 2008; Yagi et al. 2010; Fossati et al. 2012; Boselli et al. 2016a) or predicted by hydrodynamic simulations (Roediger & Hensler 2005; Tonnesen & Bryan 2009, 2010). Such features have a typical angular size of 20 arcmin and a surface brightness of 1-2 10-18 erg s-1 cm-2 arcsec-2 and thus require a sensitivity 60 fainter than those reached in previous observations of Virgo galaxies using 2m class telescopes.
The total integration time of VESTIGE was determined after the pilot obeservations of NGC 4569 done in 2015 (Boselli et al. 2016a). The total integration time was set to 7200 sec and of 720 sec in the NB and broad-band filters, respectively. Observations in the broad-band filter are necessary for the subtraction of the stellar continuum. The integration time in the broad-band, which is 14 wider than the NB, has been chosen to reach approximately the same sensitivity. The observations carried out at the CFHT during the 2017A semester in dark/grey time have shown that the typical sensitivity of VESTIGE is 1.5 10-17 erg s-1 cm-2 arcsec-2 (1) at full resolution (0.187 arcsec pixel), and 2 10-18 erg s-1 cm-2 arcsec-2 (1) once the data are smoothed to an angular resolution of 3 arcsec suitable for the detection of extended sources. The images gathered in semester 2017A have been also used to estimate empirically the 90% completeness limit (5 level) for point sources. Our limiting magnitudes were computed via simulations of point-like populations, modeled with a Gaussian profile with FWHM=0.7″, in the magnitude range , and randomly distributed on the images. We then carried out the photometry as for the real sources with SExtractor and analysed, as function of the magnitude, the recovery fraction of the synthetic population for the subsample of objects characterised by S/N. The limit of completeness was then defined as the magnitude for which 90% of the input objects were retrieved. We found AB mag, corresponding to = erg s-1 cm-2, and AB mag, for the narrow- and broad-band images, respectively (see Table 2). The sensitivity for point sources is close to the detection limit for PNe, that in Virgo is at 3 10-17 erg s-1 cm-2 as derived from their H luminosity function (Ciardullo 2010), and is sufficient to sample the bright end of the =4.4 Ly luminosity function which has a characteristic flux of = 2-4 10-17 erg s-1 cm-2 (Ouchi et al. 2008; Cassata et al. 2011).
To conclude, each sky position is observed with a 7200s integration in H and 720s integration in the -band. Each exposure, in both H and , is divided in 12 exposures optimally dithered to cover the CCD gaps and minimise the possible contamination from the reflections of bright stars (see below).
|
Note: after smoothing the data to 3 arcsec resolution.
3.4 Data acquisition and observing strategy
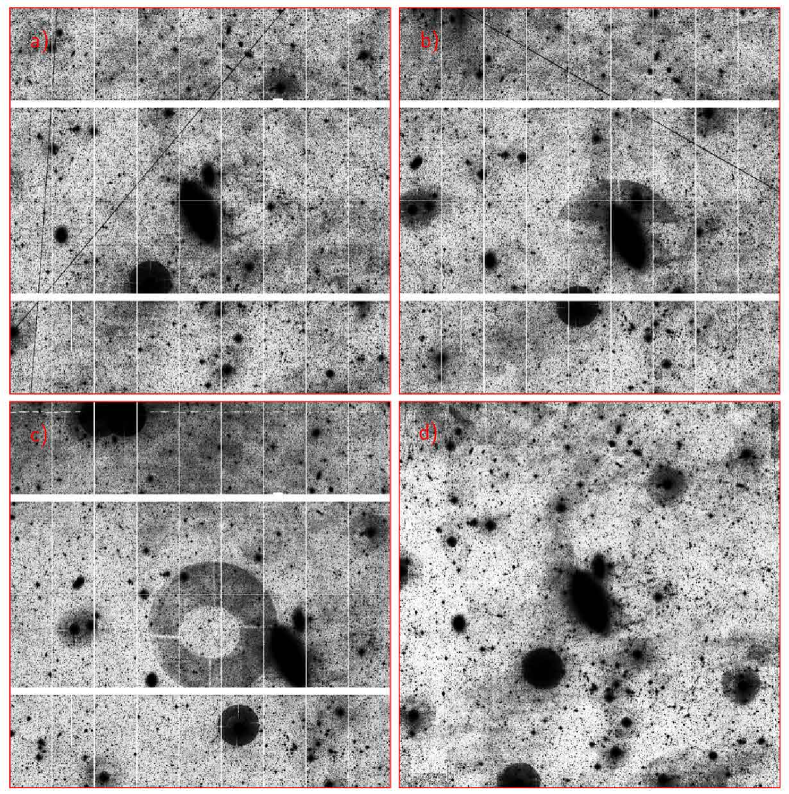
The data are acquired following the Elixir-LSB pointing strategy successfully developed for the NGVS and optimised for the best characterisation of the sky background and the detection of extended low surface brightness features. The strategy requires an uninterrupted sequence of seven single exposures of contiguous fields to minimise any variation in the background illumination. The observations taken during a pilot project have shown that in the NB flat fielding can be severely affected by the reflection of bright stars ( 7 mag) both within and outside the MegaCam field of view (see Fig. 4). These reflections are more important in the NB than in the broad-band filters. The bright stars located within the MegaCam field produce circular annuli around the star with properties depending on the brightness and on the position of the star within the field. Since these reflections depend on the optical configuration of the camera, the MegaCam community is trying to model these reflections with the purpose of defining and producing dedicated pipelines able to remove them from the images (Regnault et al. in prep.). The reflections due to stars outside the MegaCam field of view produce ghosts that change significantly according to the relative position of the camera and of the star. These ghosts can be easily removed using a median stacking of dithered images provided that each single frame is taken at significantly different positions (see Fig. 4). We thus adopt an observing pattern defined to cover the same sky region in 12 different frames taken after a large dithering of 15 arcmin in R.A. and 20 arcmin in Dec. Each single exposure is of 600s in the NB and 60s in the -band. To map the full NGVS footprint VESTIGE requires 1419 single pointings in each filter, or equivalently 203 observing blocks of 7 frames each. This particular observing pattern covers the gaps between the different CCDs composing MegaCam. With this pattern, most of the Virgo cluster will be covered by 12 independent frames, while only a small fraction coinciding with the gaps of the CCDs by 6, 8, 9 or 10 frames, as depicted in Fig. 5.

Pilot observations undertaken in 2015 and 2016 indicate that with single exposures of 600s in the NB and 60s in the -band the frames are background limited in both bands ( 195 ADUs in and 141 ADUs in NB taken in dark time). Short exposures (60s in H and 6s in ) might be necessary whenever the analysis of the deep images reveals saturation in the nucleus of bright galaxies. Based on the NGVS data, we expect 80 galaxies to saturate in the long exposures.
During the spring 2017 observing campaign (semester 2017A) 244 pointings in the -band (17% of the full survey) and 268 (19%) in the NB filter have been acquired.
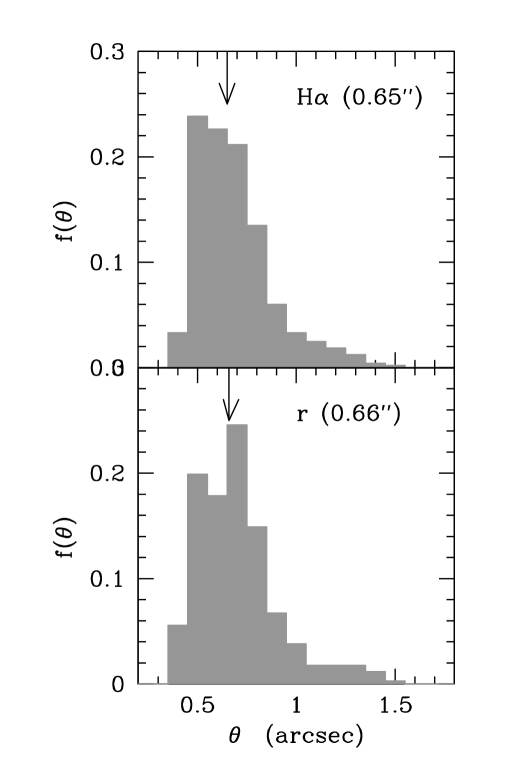
3.5 Image quality
Given the extended, low surface brightness nature of the ionised gas tails, no strong constraints on the seeing conditions are needed for the survey. However, given the exceptional imaging quality of the CFHT, the observations will be gathered in subarcsecond conditions. Figure 6 shows the seeing distribution for the single exposures in the H and -band filters obtained during the 2017A semester and 2015 and 2016 pilot observations. The median seeing in the two filters is 0.64 and 0.65 arcsec, respectively.
4 Data processing
VESTIGE benefits from the extensive machinery developed to support the NGVS survey completed with the same instrument. Accurate flat-fielding is done using Elixir-LSB, while global astrometric solutions, image stacking and source catalogues are generated by a modified version of MegaPipe (Gwyn 2008).
4.1 Elixir-LSB
The MegaCam images are reduced with Elixir-LSB (Ferrarese et al. 2012), an upgrade of the Elixir (Magnier & Cuillandre 2004) pipeline specifically developed within the NGVS collaboration to detect extended low surface brightness features associated to cluster galaxies, whose scales of 20 arcmin do not exceed the MegaCam field of view. This specific pipeline has been designed to remove any possible residual large scale structure in the sky background, including the low-level diffuse Galactic emission extending all over the VESTIGE footprint (see sect. 7.2.1). Elixir-LSB can be applied whenever the different frames are acquired under a similar background illumination, i.e. within a concatenated cycle of seven independent exposures (see Sect. 3.4). The images must be background dominated, as is the case for the VESTIGE data in both the broad- and NB filters. The Elixir-LSB pipeline performs bad pixel masking, bias and overscan corrections, and flat-fielding.
4.2 Astrometric calibration
While the MegaPipe pipeline now uses GAIA (Perryman et al. 2001) as an astrometric reference frame, for consistency with NGVS the VESTIGE data were astrometrically calibrated using the NGVS data (Ferrarese et al. 2012) as a reference, the latter being calibrated on the SDSS. There are small but significant astrometric shifts relative to GAIA, on the order of 100 mas or less. The internal astrometric residuals, on the other hand, are typically 20-40 mas.
4.3 Photometric calibration
The VESTIGE data is bootstrapped from Pan-STARRS PS1 photometry (Magnier et al. 2013) which is accurate to within 0.005 mag (Finkbeiner et al. 2016) and is sufficiently deep to provide a large number of common stars per field to minimise random errors per source. We first apply a 0.2 mag flat field radial correction from the centre to the edges to take into account the different transmissivity of the camera. This correction has been determined after the repeated observation of a nearby cluster of stars observed in different positions across the field. The magnitudes of stars in each VESTIGE image are transformed from the PS1 filter system into the MegaCam filter system and then used as in-field standards. The transformations are derived by first computing the transmission functions of the PS1 and MegaCam passbands (including the reflectance of the primary mirrors, the camera optics, the quantum efficiency of the CCDs and the transmittance of the filters themselves). These total transmission functions are multiplied by stellar spectra from both the HST CALSPEC spectra collection333http://www.stsci.edu/hst/observatory/crds/calspec.html and Pickles (1998).
The transformations are as follows:
| (1) | |||
| (2) | |||
where .
The MegaCam instrumental magnitudes are measured through circular apertures that increase in size with seeing. The aperture is such that, for point sources, the measured flux is equivalent to that measured by a Kron magnitude such as SExtractor’s .
For each exposure, a single zero-point is determined for the entire mosaic. In practice there are small variations in the zero-point across the focal plane ( 0.03 mag), however because of the nature of the low surface brightness background subtraction, these are not corrected. The zero-points are determined for each exposure independently. Comparing photometry from overlapping images indicates that the zero-points are self-consistent to about 0.01 magnitudes. We also derived a set of relations similar to eq. (1-2) using a procedure to transform SDSS magnitudes into MegaCam magnitudes to check the consistency on the photometry between the two surveys. The SDSS zero-points were consistent with the PS1-derived zero-points of VESTIGE to within 0.01 magnitudes.
4.4 Stacking
The calibrated images are resampled on to pixel grid matching the NGVS image footprints using SWarp444http://www.astromatic.net/software/swarp and the astrometric solution. The images are scaled according to the photometric solution. The resampled, scaled images are combined using an artificial skepticism algorithm (Stetson 1987)555http://ned.ipac.caltech.edu/level5/Stetson/Stetson contents.html. As with the NGVS data products, the resulting stacks have a zero point of 30.0 mag, such that AB magnitudes are given by:
| (3) |
4.5 H fluxes and equivalent widths
H fluxes and equivalent widths are determined following standard procedures such as those described in Kennicutt et al. (2008). Given the depth of the present survey, the accuracy on the H flux determination depends on an accurate subtraction of the stellar continuum. Given the width of the filter ( = 6404 Å; = 1480 Å) and the slight difference in the peak wavelength of the two bands, the derivation of the stellar continuum in the narrow-band from the -band depends on the spectral properties of the emitting source (Spector et al. 2012). Using several hundred thousands of unsaturated stars detected in the science frames observed during the pilot observations and in the 2017A observing run we were able to calibrate an empirical relation between the colour of the stars and the normalisation factor:
| (4) |
We then apply this normalisation pixel by pixel on the stacked frame before the subtractioon of the stellar continuum. The colour map of any target can be derived using the -band frame taken with MegaCam during the NGVS survey (Ferrarese et al. 2012). To avoid the introduction of any extra noise in the sky regions, where there is no stellar continuum, this colour-dependent normalisation is applied only whenever the signal in the - and -bands has a signal-to-noise above a given threshold. The methodology used to derive fluxes and equivalent widths from the VESTIGE NB images will be extensively described in a dedicated publication (Fossati et al., in prep., paper II).
5 Data access
All data and data products will be stored at, and distributed by, the Centre of Astrophysical Data in Marseille (CeSAM) through a dedicated web-page (http://mission.lam.fr/vestige/), as successfully done for several projects to which some team members are leaders (The Herschel Reference Survey http://hedam.lam.fr/HRS/; GUViCS http://galex.lam.fr/guvics/index.html; NGVS http://www.cadc.hia.nrc.gc.ca/en/community/ngvs and GOLDMine http://goldmine.mib.infn.it/). The stored data will include the fully reduced, stacked images in both the NB and -band, as well as the continuum-subtracted frames. It will also include the full catalogues of point sources in both bands.
6 First results
6.1 Comparison with previous observations
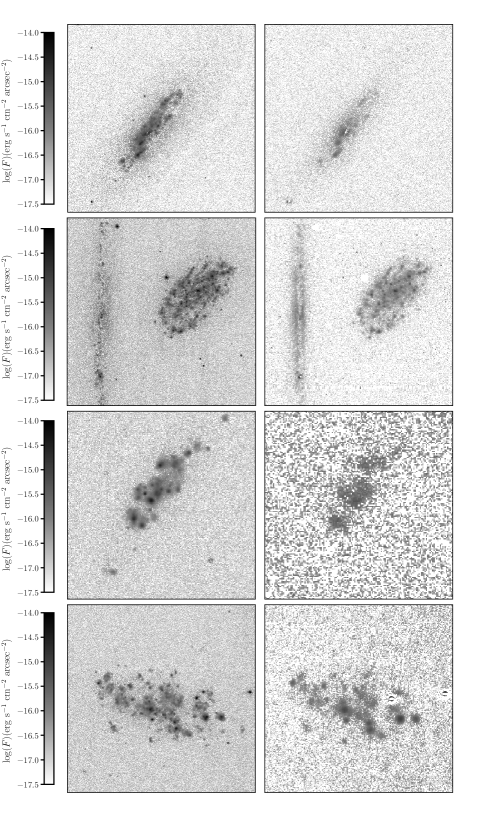
A huge amount of pointed shallow NB H imaging data (Young et al. 1996; Macchetto et al. 1996; Koopmann et al. 2001; Boselli et al. 2002b, 2015; Boselli & Gavazzi 2002; Gavazzi et al. 2002a, 2006; James et al. 2004; Sanchez-Gallego et al. 2012) to which the VESTIGE results can be compared already exists in the literature, most of which is available on the GoldMine database (Gavazzi et al. 2003b). The sky regions observed during the 2017A campain and the pilot projects include 31 galaxies with published NB H imaging data. Fluxes and equivalent widths are compared in Fig. 7. The different sets of data are consistent within 5% for the equivalent widths and 30% for the fluxes. The increase in the quality of the NB H images obtained with MegaCam at the CFHT with respect to previous targeted H images is spectacular, as depicted in Fig. 8.

6.2 A 41 deg2 strip across the core of the cluster

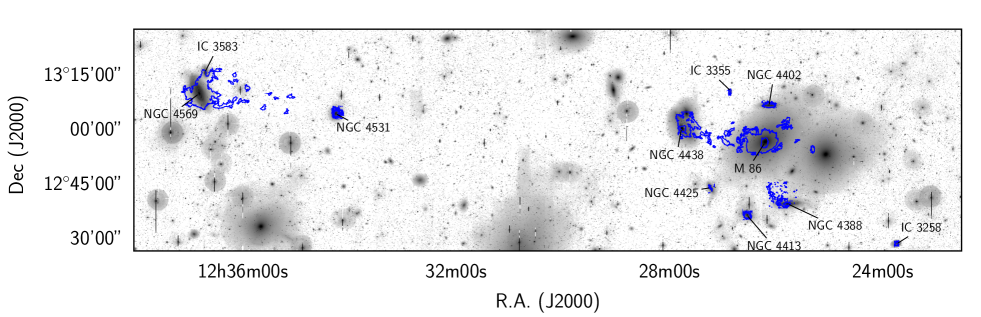
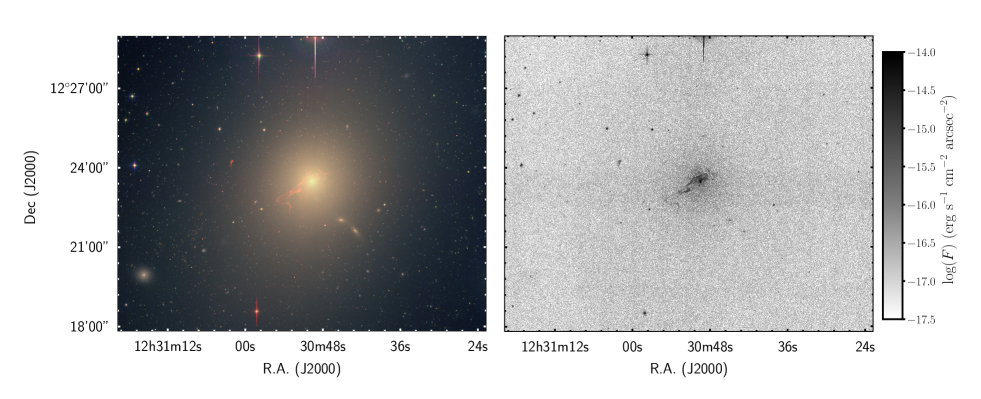
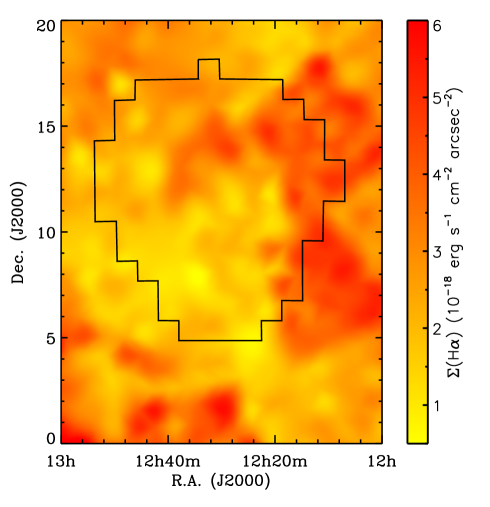
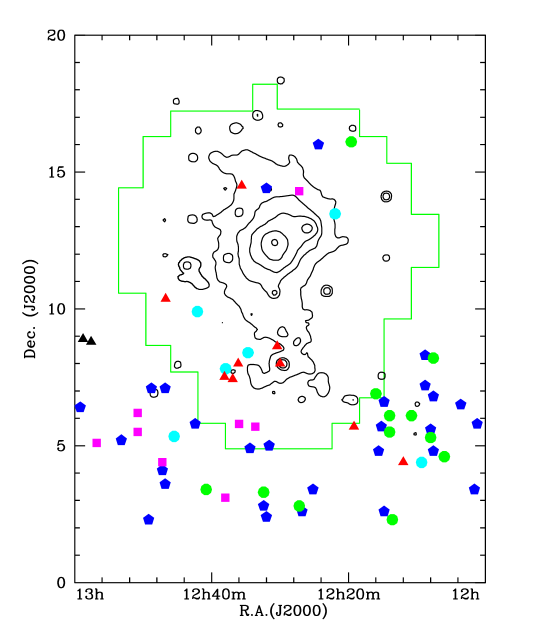
The observations carried out during the first 2017A semester allowed us to map a large portion of the centre of the cluster. Although the current coverage does not yet reach the final sensitivity expected for VESTIGE all over the mapped region, these observations already provide the largest NB H image of the Virgo cluster. Figure 9 shows a 41 deg2 strip crossing the northern part of the core of the cluster from the giant elliptical galaxy M84 to NGC 4569, the most massive late-type galaxy of the cluster. Within this strip the survey reaches full sensitivity in the centre and in the eastern region, while only 20% in the western part. Figure 10 shows the NGVS -band image of the same regions with overplotted H contours showing emission at low surface brightness levels. Several spectacular features are evident in the images: extended filaments of ionised gas are visible to the west of NGC 4569 (Boselli et al. 2016a) and to the north-west of NGC 4388 (Yoshida et al. 2002). The image also shows the spectacular bridge of ionised gas 215 kpc long (in projected distance) linking M86 to NGC 4438 (Kenney et al. 2008). Tails of ionised gas are for the first time detected in NGC 4402 (undetected in the shallower data of Crowl et al. 2005 and Abramson et al. 2016), NGC 4425, and NGC 4531. The typical surface brightness of these extended features ranges from 10-18 erg s-1 cm-2 arcsec-2 in NGC 4569 (measured on the deeper pilot observations of Boselli et al. 2016a), to 610-18 erg s-1 cm-2 arcsec-2 in the extended filaments of NGC4438 and M86, where the sensitivity of the survey is lower. This image witnesses a large variety of extended ionised gas morphologies, possibly caused by different hydrodynamical processes (tidal interactions in NGC 4438 and M86, ram pressure in NGC 4388, NGC 4402, NGC 4425, NGC 4531, and NGC 4569) proving that VESTIGE is a revolutionary survey in probing environmental effects in the Virgo cluster.
7 Scientific objectives
7.1 Virgo cluster science
7.1.1 The effects of the environment on galaxy evolution
We expect to detect low surface brightness ionised gas features extending across several tens of kpc in several late-type galaxies in the cluster and its surrounding regions. These features result from ongoing stripping processes, removing the gaseous content of star-forming galaxies as they enter the cluster. They can also occur in massive elliptical galaxies formed by major merging events (M87, Gavazzi et al. 2000; M86, Kenney et al. 2008), and in early-type dwarfs formed by quenching of low-mass star-forming systems (Boselli et al. 2008a). These processes are thought to play a key role in the transformation of star-forming galaxies into quiescent systems, and in the build-up of the red sequence (Balogh et al. 2000; Boselli & Gavazzi 2014). Identifying the exact nature (i.e., ram pressure stripping, harassment, starvation, tidal stripping) of the perturbing mechanisms, as a function of environment (from the cluster core to its periphery), is crucial for constraining cosmological models of galaxy evolution. Meanwhile, gravitational perturbations such as tidal stirring and harassment are expected to perturb simultaneously the gaseous and stellar components, producing low surface brightness tails in both the H and in the optical broad-band images. Gravitational perturbations can be identified by comparing visual signs of interactions with quantitative measurements (e.g., asymmetires - Conselice 2003; Gini coefficient - Abraham et al. 2003; - Lotz et al. 2004) and with the distance from the closest companion (Patton et al. 2016). The dynamical interaction of the galaxy ISM with the hot ICM, on the contrary, should affect only the gaseous component (e.g. Fumagalli et al. 2014). The VESTIGE data will be used to: (1) determine the fraction of galaxies with signs of perturbation due to gravitational interactions or interactions with the ICM (Yagi et al. 2010); (2) identify and map in the cluster the transition dwarf galaxies, which are believed to be in the midst of a transformation from dwarf irregular to early-type dwarfs (Boselli et al. 2008a, 2008b, 2014a; Coté et al. 2009; De Looze et al. 2013); (3) determine the physical extent, the density, and total mass of the gas in the ionised phase (making simple assumptions on the filling factor) and compare it to that of the other gas phases (Fossati et al. 2016; Boselli et al. 2016a); (4) identify extraplanar HII regions, possible progenitors of intracluster star clusters, that can contribute to the ionisation of the gas (Fumagalli et al. 2011b; Arrigoni Battaia et al. 2012; Fossati et al. 2016; Boselli et al. 2017); and (5) compare the observations to the predictions of published (Tonnesen & Bryan 2010, 2012; Tonnesen et al. 2011; Tonnesen & Stone 2014) or upcoming hydrodynamic simulations of gas stripping developed by our team and/or presented in state-of-the-art cosmological simulations (Genel et al. 2014; Schaye et al. 2015; Barnes et al. 2017), as illustrated in Fig. 1.
7.1.2 The fate of the stripped gas in cluster galaxies
The different phases of the ISM (dust, neutral atomic and molecular gas, ionised gas, hot gas) within galaxies can be removed during interactions with the harsh cluster environment. The unprecedented multifrequency data available for Virgo, combined with tuned models of gas stripping and follow-up spectroscopic observations that we plan to obtain with SITELLE (Drissen et al. 2010) and MUSE (as in, e.g., Fumagalli et al. 2014, Fossati et al. 2016, Consolandi et al. 2017b), will be used to study the fate of this stripped material in the cluster environment. The main H streams will be searched for in atomic, molecular and X-ray gas, to test the survival of cold gas in the cluster hot gas environment (Serra et al. 2013; Jachym et al. 2013, 2014; Verdugo et al. 2015). The data will be used to characterise the physical conditions (metallicity, density, temperature, turbulence) under which the stripped gas in its different phases (neutral, ionised, hot) can collapse to form new stars. These data are essential for constraining hydrodynamic simulations of gas stripping (Tonnesen & Bryan 2010, 2012). Simulations tailored to VESTIGE will be carried out with the 3D hydrodynamic Adaptive Mesh Refinement code FLASH (Fryxell et al. 2000) and Enzo (Bryan et al. 2014). FLASH will be updated to include a multi-phase ISM and the stellar component (Mitchell et al. 2013), as well as the thermal conduction by the hot ICM. The treatment of the different gas phases and their energetic interactions is crucial for a complete and coherent understanding of the physical process and, in turn, for constraining simulations with observational data. Systematic and complete surveys in H, HI, CO and X-rays are essential if we are to sample with high statistical significance the largest possible range in the ICM, ISM and galaxy parameter space.
7.1.3 The star forming process in nearby galaxies
Within galaxies, the H emission line originates primarily from gas ionised by young and massive OB stars; it is thus an excellent tracer of ongoing star formation (Kennicutt 1998; Boselli et al. 2001, 2009; Kennicutt & Evans 2012), sensitive to stellar populations much younger than those detected in the GALEX UV bands (H 10 Myr vs. UV 100 Myr). VESTIGE will provide the largest and most homogeneous database ever assembled with which to study star formation down to sub-kpc scales, both in normal and perturbed galaxies and along the luminosity function, all the way down to the faintest blue compact dwarfs/HII galaxies ( 1036 erg s-1, equivalently to 10-5 M⊙ yr-1 when the is derived using the standard calibration of Kennicutt 1998) and in virtually all star-forming systems with 105 M⊙. At these SFRs, we will be able to study the stochastic sampling of the IMF (Fumagalli et al. 2011a) and assess its impact on the calibration of the H luminosity as a star formation tracer (Boselli et al. 2009; da Silva et al. 2014). Dust attenuation will be estimated by comparing the H emission to the emission of dust in the mid- and far-infrared following standard recipes (Calzetti et al. 2010; Kennicutt et al. 2009; Zhu et al. 2008; Boselli et al. 2015) or using spatially resolved spectral energy distribution fitting analysis based on specific codes developed within our team (CIGALE, Boquien et al. 2012, 2014, 2016; Boselli et al. 2016b). The contribution of the [NII] lines can be determined using the long-slit data collected so far for the bright galaxies (Gavazzi et al. 2004; Boselli et al. 2013) or from known scaling relations (Decarli et al. 2007; Boselli et al. 2009), while possible AGN contamination can be quantified by nuclear spectroscopy available for 86% of the galaxies of the sample with 17.5 mag ( 1000 objects; Decarli et al. 2007; Gavazzi et al. 2013; SDSS). Additionally, we will be able to address the interplay between starbursts and AGN activity on a representative sample of 1000 galaxies. The observed 2D properties of the star-forming activity within galaxies will also be compared to the molecular and atomic gas column densities (Boissier et al. 2001, 2003a, 2003b, 2007, 2008) and to the predictions of multi-zone chemo-spectrophotometric models of galaxy evolution specifically tailored to take into account the effects of the environment (Boselli et al. 2006, 2008a, 2008b, 2014a).
The imprint of secular evolution on the star formation history of galaxies will be searched for by analysing the relationship between the presence of bars in the broad-band stellar images and in the NB H images, extending the work of Gavazzi et al. (2015), Consolandi (2016), and Consolandi et al. (2016, 2017a) to low surface brightness dwarfs unreachable by the SDSS because of its limited sensitivity and angular resolution. The data will also be compared to the predictions of chemodynamical simulations of galaxy evolution (Michel-Dansac & Wozniak 2004). The comparison between this unique set of multifrequency imaging and spectroscopic data for hundreds of resolved galaxies will be a powerful tool for reconstructing the 2D star formation history of galaxies and studying the quenching process as a function of mass, morphological type and environment.
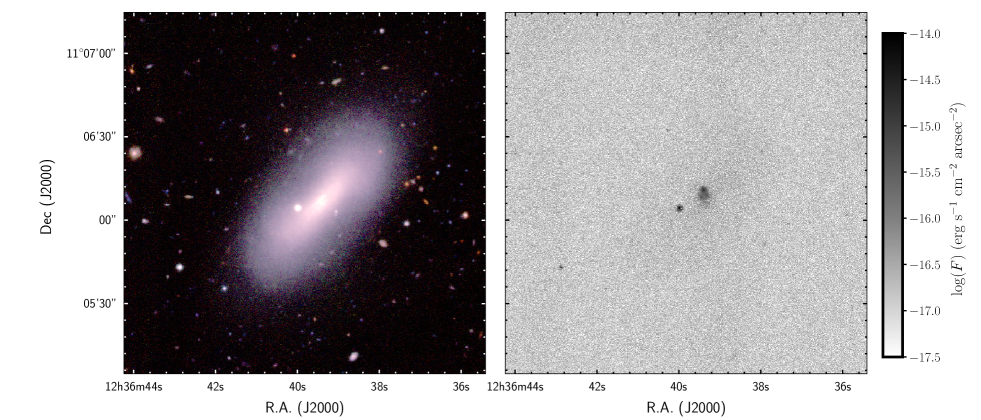
7.1.4 The ionised gas emission in early-type galaxies
Low levels of H emission will also be detected in massive early-type galaxies (Gomes et al. 2016; Belfiore et al. 2016; Gavazzi et al. 2017), while residual star formation is expected in the core of the recently formed dE galaxies (Boselli et al. 2008a; see Fig. 11), which are often characterised by young nuclear star clusters or cores (Côté et al. 2006, Lisker et al. 2006). Given the sensitivity of the survey in terms of surface brightness, we also expect to detect a weak diffuse emission originating from evolved stellar populations in dwarf ellipticals (Michielsen et al. 2004), or filaments of ionised gas in massive galaxies such as those observed in M87 (Sparks et al. 1993; Gavazzi et al. 2000; Fig. 12) and M86 (Trinchieri & di Serego Alighieri 1991; Kenney et al. 2008). Within the VESTIGE footprint there are 46 elliptical galaxies, 68 lenticulars, 13 S0a, and 1112 dE/dS0 galaxies catalogued in the Virgo Cluster Catalogue (Binggeli et al. 1985) with a recessional velocity 3500 km s-1, while another few thousands dwarfs, classified as Virgo members, have been detected by the NGVS survey (Ferrarese et al. 2012, 2016). VESTIGE will thus provide a unique view of the ionised gas emission properties of early-type galaxies in a complete and statistically significant sample.
7.1.5 The H luminosity function
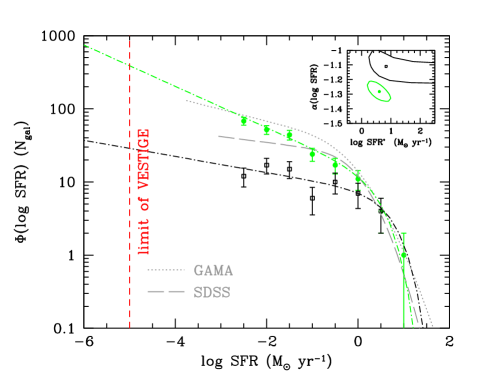
The limit in H luminosity or in star formation rate that VESTIGE will reach is 100 times fainter than the limits reached by the most recent local H luminosity functions (Gunawardhana et al. 2013; Fig. 13). By counting directly the number of star-forming objects in the NGVS footprints down to 105 M⊙ we expect to detect 500 objects. This roughly corresponds to the number derived by extrapolating the SFR luminosity function derived from the UV data (Boselli et al. 2016c) to = 10-5 M⊙ yr-1, and to the number of blue galaxies detected by NGVS. This number is perfectly suited for an accurate determination of the best fitting parameters in a parametric luminosity function both within the cluster core or in the cluster periphery.
7.1.6 The H scaling relations
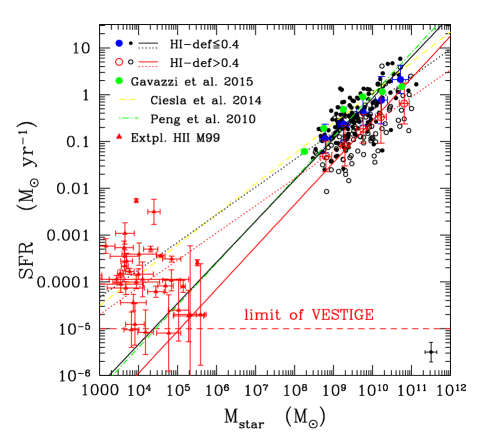
As for the determination of the H luminosity function, VESTIGE will provide us with the best sample of galaxies with H data suitable for the determination of the H and scaling relations down to the dwarf galaxy regime, significantly increasing in terms of sensitivity and statistics the most recent studies (Gavazzi et al. 2013; Boselli et al. 2015). The data will be used, for instance, to extend by three orders of magnitude the most recent local determinations of the star formation main sequence (Fig. 14). These scaling relations will be determined at different clustercentric distances, from the densest regions in the core of cluster A, to the cluster periphery. Any possible observed clustercentric variation in the typical H scaling relations, for the first time determined on a strong statistical basis, will be compared to the predictions of cosmological simulations and hydrodynamical models of galaxy evolution for the identification of the dominant perturbing process in rich environments.
7.1.7 The nature of almost dark galaxies
Extended HI sources without any stellar counterpart have been detected in the Virgo cluster by AGES (Taylor et al. 2012) and ALFALFA (Janowiecki et al. 2015; Cannon et al. 2015). These ”dark galaxies” are particularly important since they have been proposed as a possible solution to the missing satellite problem (Bullock 2010). Their nature, however, is still poorly known. In the most massive clouds ( 109 M⊙), the atomic gas should form molecular hydrogen, become unstable, collapse and form new stars (Taylor & Webster 2005; Burkhart & Loeb 2016). In lower mass objects, on the contrary, the contact with the hot intracluster medium would make the gas cloud change phase to reach the typical temperature ( 107-108 K) of the surrounding gas (thermal evaporation, Cowie & Songaila 1977). VESTIGE might thus detect low levels of star formation within massive HI-selected dark galaxies (see Fig. 17) as well as the extended emission associated to any possible phase transition within the clouds. It can also discover new dark galaxy candidates as extended H blobs without any visible stellar counterpart, for which follow-up spectroscopic observations will be required to confirm their extragalactic nature and characterise the physical properties of the ionised gas.
7.1.8 The dynamical structure of the Virgo cluster
The spectacular tails of ionised gas detected in H (that can extend up to 100 kpc) trace the trajectory on the plane of the sky of galaxies that have recently entered the cluster environment (Fig. 1). Combined with radial velocities, which are available for more than 1000 objects within the selected region and velocity range (-1000 3500 km s-1), and specific numerical dynamical codes (e.g. Bovy 2015) the orientation of the extended tails of ionised gas will be used to reconstruct the orbits of individual galaxies (Vollmer 2009). These data will allow the first-ever study of the dynamical evolution of the cluster in three dimensions. Characterising the dynamical properties of the cluster is essential for a fair comparison with cosmological simulations (Vollmer et al. 2001) and, along with the physical properties of galaxies, will be of prime importance for understanding the role of pre-processing in galaxy evolution.
7.1.9 The HII region luminosity function of cluster galaxies
The sensitivity of the survey for point sources and the excellent image quality will allow us to measure the first HII region luminosity function of cluster galaxies (Kennicutt 1981). VESTIGE will be able to detect classical HII regions of luminosity 1036 erg s-1. Considering a typical seeing of 0.7 arcsec, corresponding to 60 pc at the distance of Virgo, VESTIGE will be able to resolve only giant ( = 1037-1039 erg s-1) and super giant ( 1039 erg s-1) HII regions. Although still limited in terms of sensitivity and angular resolution with respect to dedicated HST studies of nearby galaxies (Scoville et al. 2001; Lee et al. 2011), or galaxies in the Local Group (Kennicutt & Hodge 1986; Hodge et al. 1990, 1999), the improvement with respect to other studies based on ground-based images (Kennicutt et al. 1989; Rand 1992; Youngblood & Hunter 1999; Thilker et al. 2002; Bradley et al. 2006) will be significant in terms of sampled range of H luminosity, angular resolution, and statistics.
7.1.10 Planetary nebulae and the origin of the intracluster light
Even though planetary pebula (PN) surveys in distant galaxies focus on the [OIII] 5007 Å emission line due to its strength, a PN spectrum is composed by several other emission lines of which H is one of the strongest (Ciardullo 2010). H studies of PN systems have been limited to the local Universe and very little is known about the PN properties at this wavelength for more distant objects like Virgo cluster galaxies. Ciardullo et al. (2010) presented the H luminosity function (LF) for three Local Group galaxies showing that like the [OIII] PNLF, the H LF displays a cutoff that is insensitive to stellar population. The same cutoff is also visible in the recent SITELLE data of M31 (Martin et al. 2018). At the distance of the Virgo cluster, this cutoff should be at 3 10-17 erg s-1 cm-2. This number is very close to the detection limit of the survey ( 4 10-17 erg s-1 cm-2 90% complete at 5 , 2.5 10-17 erg s-1 cm-2 50% complete at 5 ). However, given the sharp increase of the PNLF at its bright end, and the large scatter in the [OIII]/H ratio observed in nearby galaxies, VESTIGE can potentially detect the brightest PNe in several tens of galaxies over the 104 deg2 covered by the survey.
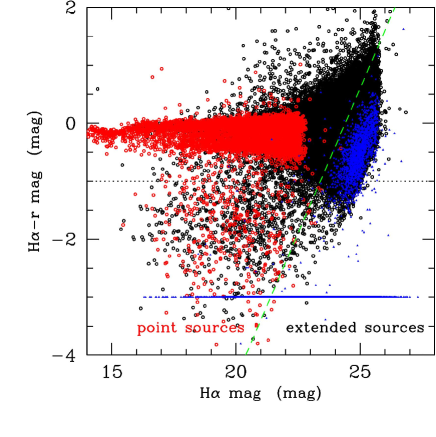
PNe will be identified using standard (H-) vs. H colour diagrams such as the one plotted in Fig. 15 and distinguished from high- line emitters or local HII regions from the lack of any stellar emission in the deep and NGVS images (Jacoby et al. 1990; Theuns & Warren 1997; Ciardullo et al. 1998; Mendez et al. 2001; see however Bacon et al. 2017).
7.2 Foreground science
7.2.1 The diffuse ionised medium of the Milky Way
The H filter is sensitive to the diffuse emission from ionised gas in the Milky Way (e.g. Reynolds et al. 1998). At the high Galactic latitude of Virgo ( 74o), the diffuse Galactic H emission is 0.1-1.0 Rayleigh (corresponding to 0.5-5 10-18 erg sec-1 cm-2 arcsec-2) as derived by the Wisconsin H Mapper (WHAM) all-sky survey (Reynolds et al. 1998, Fig. 16) and can thus be detected once the signal is appropriately smoothed. The Milky Way emission can be distinguished from large-scale fake structures in the continuum-subtracted images such as those produced by poor quality flat-fielding or bright star halos, or from the tails of ionised gas associated with Virgo cluster galaxies, once the full mosaic of images is in hand. The H emission of the Galactic halo, indeed, is expected to extend over several square degrees, leading to the formation of long and continuous tails covering several frames. For this purpose we are developing within the team a modified version of the Elixir-LSB data reduction pipeline which uses the 1o resolution WHAM map (Fig. 16) as a prior to fix a zero point for the diffuse Galactic emission over each MegaCam frame.HI and CO line widths will be used to discriminate Galactic from extragalactic emission (Cortese et al. 2010b; For et al. 2012), a technique we already have used successfully to identify and map the distribution of the scattered light produced by the Galaxy cirrus emission in GALEX far- and near-UV images of the same Virgo cluster region (Boissier et al. 2015) or that emitted by the Galactic cirrus in the far-infrared (Bianchi et al. 2017). VESTIGE will provide a substantial improvement in angular resolution with respect to WHAM, producing the first H map of the Milky Way at high Galactic latitude over a 100 deg2 contiguous field and at a few arcsec resolution. It will also be complementary to shallower ( 2 10-17 erg sec-1 cm-2 arcsec-2) surveys limited to the Galactic plane (IPHAS, Drew et al. 2005; VPHAS, Drew et al. 2014; SHASSA, Gaustad et al. 2001; VTSS, Dennison et al. 1998; SHS, Parker et al. 2005). The H data will be compared to those available for other components of the ISM (i.e., dust from IRAS, Planck and Herschel; HI gas from GALFA, Peek et al. 2011 and ALFALFA, Bianchi et al. 2017;scattered light from GALEX, Boissier et al. 2015) to firmly characterise the physical properties of the Milky Way’s ISM at high Galactic latitudes (Boulanger et al. 1996; Lagache et al. 2000).
7.2.2 High velocity clouds, compact sources and Galactic fountains
The HI Galactic survey done with Arecibo (GALFA-HI, Saul et al. 2012) detected 13 compact sources within the VESTIGE footprint (see Fig. 17), and others will be detected by Wallaby (Koribalski 2012). These sources have been identified as high velocity clouds (HVC), galaxy candidates, cold and warm low velocity clouds (LVC). A different population of ultra-compact high velocity clouds (UCHVC) has been also detected by ALFALFA, probably associated to very low mass galaxies in the Local Volume (Adams et al. 2013; Bellazzini et al. 2015). Four of these are within the VESTIGE footprint. Given their low recessional velocity ( 400 km s-1), all these sources are potentially detectable by VESTIGE in H if they contain ionised gas. All these sources will be searched for in the deep NB H images. Thanks to the sensitivity of VESTIGE we expect to detect in H a large fraction of HVC and LVC discovered by the HI GALFA and ALFALFA surveys, and thus significantly increase the number of objects with both atomic and ionised gas data, now limited to a handful of sources (Reynolds 1987; Haffner et al. 2001; Tufte et al. 2002). The typical peak emissivity of these features is 0.1-0.5 Rayleigh (1 R = 5.66 10-18 erg s-1 cm-2 arcsec-2; Reynolds 1987; Haffner et al. 2001; Tufte et al. 1998, 2002; Putman et al. 2003), and their extension is of several arcminutes (Saul et al. 2012), thus easily detectable after spatial smoothing of the VESTIGE data. The H data, combined with HI and X-rays, will be used to constrain the physical properties of the clouds, study their Galactic or extragalactic origin, and quantify the escape radiation from the Galactic plane (Bland-Hawthorn & Maloney 1999; Putman et al. 2003, 2012) by comparing models to observations (Heitsch & Putman 2009; Binney et al. 2009; Wood et al. 2010; Kwak & Shelton 2010; Shelton et al. 2012).
7.3 Background science
7.3.1 High redshift emission line galaxies
The H filter combined with broad-band or deeper NGVS images will allow us to identify strong Ly, [OII] and [OIII] emission-line galaxies at different redshifts (=4.4,0.8,0.3), providing a unique sample of star-forming objects over 104 deg2. Indeed, the point-source sensitivity of VESTIGE () = 4 10-17 erg sec-1 cm -2, 5 detection limit) is comparable to the typical Ly luminosity of 4.4 galaxies as derived from their Ly luminosity function ( 2-4 10-17 erg sec-1 cm -2; Ouchi et al. 2008; Cassata et al. 2011). It is also 2 and 10 deeper than the [OII] and [OIII] luminosities at = 0.8 and =0.3 (Ly et al. 2007; Ciardullo et al. 2013). Using model predictions for the Ly line (Garel et al. 2015, 2016), or the luminosity functions and the number counts of [OII] and [OIII] sources derived with similar surveys of small fields (Ly et al. 2007; Hippelein et al. 2003), we estimate that 5 104 Ly, 105 [OII], and 3 104 [OIII] emitters will be detected over 104 deg2. VESTIGE will provide an unprecedented database for characterising the bright end of the high-redshift emission line galaxies luminosity function, insensitive to cosmic variance. The data will thus be highly complementary to those obtained in deep targeted imaging and spectroscopic surveys, which are generally limited to 1 deg2 (and optimised for studying the luminosity function at its faint end). At the depth of VESTIGE, the majority of the detected sources will be background objects. The continuum-subtracted image, however, will contain only local H or background line emitters. High-redshift [OII] and [OIII] sources will be identified using photometric redshifts available from the NGVS (Raichoor et al. 2014), while Ly candidates using standard (H-) vs. H colour magnitude relations (Ouchi et al. 2008) as shown in Fig. 15, combined with other relations based on deeper (25.9 mag) and (25.1 mag; 10) NGVS images. Multi-slit wide-field spectroscopic follow-up will be carried out on a subset of the candidates to quantify the statistically accuracy in the photometric identification of the different line emitting sources.
7.3.2 QSOs
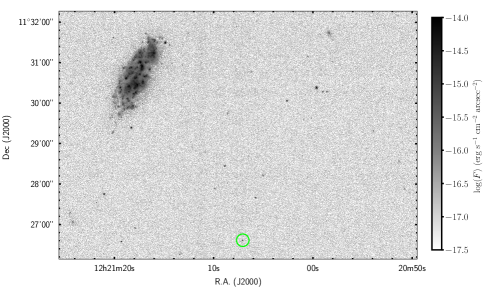
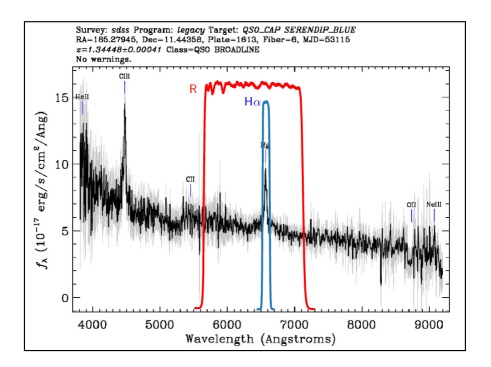
VESTIGE will be able to detect background quasars whenever one of their prominent emission lines falls within the narrow band filter. The most important emission lines in the spectrum of a quasar are [OIII] ( 5007 Å; =0.3), H ( 4861 Å; =0.35), MgII ( 2799 Å; =1.3), CIII ( 1908 Å; =2.4), CIV ( 1549 Å; =3.2, and Ly ( 1216 Å; =4.4) (Vanden Berk et al. 2001). A typical example is the object SDSS J122107.07+112636.8, identified by SDSS as a background QSO at =1.344, detected as a strong point source in the proximity of the galaxies NGC 4294 in the continuum-subtracted H image obtained during pilot observations of the VESTIGE survey (Fig. 18). The QSO has been detected thanks to a prominent MgII line emission.
7.3.3 Photometric redshifts
The -band frames that will be gathered to subtract the contribution of the stellar continuum from the NB emission will be combined to those already available from the NGVS () to increase the accuracy of the photometric redshift of background sources. At a limiting magnitude of 25.3 ABmag (5 detection limit for point sources), the addition of the -band will increase the accuracy of photometric redshifts by 30% in the faintest objects and reduce the number of catastrophic outliers by more than a factor of two (Raichoor et al. 2014). The accuracy of the photometric redshift can be improved by the inclusion of a NB filter (COMBO-17, Wolf et al. 2003), or of other UV and near-IR photometric bands (COSMOS, Ilbert et al. 2009; NMBS, Whitaker et al. 2011). The NB filter will be crucial for the identification of overdense regions at those redshifts where it will detect the brightest emission lines of the spectrum ([OIII], H, [OII], Ly). Photometric redshifts are fundamental for the identification of cluster galaxies using a red sequence technique, particularly in the range 0.3 0.8 where the -band includes the 4000 Å break (Raichoor et al. 2014). We expect to detect 4000 clusters in the 0.1 1.0 redshift range over the 104 deg2 covered by the NGVS survey (Olsen et al. 2007; Licitra et al. 2016), a number comparable to that discovered by the CFHTLS-Wide survey (Durret et al. 2011).
8 Synergy with other surveys and follow-up observations
VESTIGE is largely a self-contained project, but will capitalise on the extensive set of
multifrequency data available for the cluster (much of it obtained by members of the VESTIGE team).
X-ray: X-ray data are necessary to trace the distribution of the hot ICM (ROSAT - Böhringer et al. 1994; ASCA - Kikuchi et al. 2000) or to quantify the physical properties of the hot gas phase in the stripped material of perturbed galaxies. There are 131 XMM observations and 365 Chandra observations between 0.5 deg and 8 deg from M87 in the archives. These XMM and Chandra observations also include many programs dedicated to Virgo spirals, such as the 2016 Chandra large project “Spiral Galaxies for the Virgo Cluster” led by Dr. Roberto Soria (559 ks on 52 galaxies).
UV, visible, and near-infrared: UV, visible, and near-infrared data are necessary to characterise the stripping process, identify possible ionising sources in the stripped material, and detect the optical and near-infrared counterparts of H point sources. The whole Virgo cluster region has been mapped in the UV by GALEX (GUViCS - Boselli et al. 2011, Voyer et al. 2014) and in the visible by the SDSS (York et al. 2000), NGVS (Ferrarese et al. 2012), and Pan-STARRS (Magnier et al. 2013). The cluster has been also a favorite target of HST (e.g., ACSVCS, Coté et al. 2004). Near-infrared imaging data in the -band over the 4 deg2 centred on M87, and in the - and -band over 16 deg2 in the region between M87 and M49 have been taken during the NGVS-IR project (Munoz et al. 2014).
Mid- and far-infrared: Infrared data are essential for correcting H data for dust attenuation, for identifying the emission of the Galactic cirrus, and for a complete characterisation of the spectral energy distribution of local and background sources. Mid- (4-22 m) and far-IR (70-500 m) data are available from WISE (Wright et al. 2010) and from the Herschel blind survey HeViCS (Davies et al. 2010; Auld et al. 2013), while pointed observations of the brightest galaxies from the Herschel Reference Survey (HRS; Boselli et al. 2010, Ciesla et al. 2012, Cortese et al. 2014). ISO and Spitzer observations are available for a large fraction of the brightest galaxies (Boselli et al. 2003, 2014a, Bendo et al. 2012, Ciesla et al. 2014), while in the sub-millimetre from the Planck space mission (Planck collaboration 2014; Baes et al. 2014).
Radio millimetre and centimetre: HI and CO data are crucial for quantifying the physical properties of the cold gas phase over the disc of galaxies and within the stripped material. Radio continuum observations, sensitive to the energy loss of relativistic electrons spinning in weak magnetic fields, will provide a further tracer of ongoing perturbations as often done through the identification of head-tail radio sources (e.g. Ulrich 1978; Sarazin 1986). The Virgo cluster region has been fully mapped in the HI line by ALFALFA (Giovanelli et al. 2005; Haynes et al. 2011) with Arecibo, while pointed high-resolution observations are available from the VLA VIVA survey (Chung et al. 2009a). The cluster will also be fully mapped by the Wallaby survey ( 1.6 mJy at 30 arcsec and 4 km s-1 resolution; Koribalski 2012). CO data are available for the brightest targets (Kenney & Young 1988; Young et al. 1995; Boselli et al. 1995, 2002, 2014b; Helfer et al. 2003; Chung et al. 2009b). Radio continuum observations are available from the NVSS (Condon et al. 1998) and FIRST surveys (Becker et al. 1995; see Gavazzi & Boselli 1999) and will be soon available from the ASKAP EMU survey for the whole Virgo cluster region at a sensitivity of rms 10 Jy/beam at 1.3 GHz with an angular resolution of 10 arcsec (Norris et al. 2011).
Spectroscopy: Multi-slit wide-field spectroscopy is necessary for the identification and the characterisation of point sources, while IFU spectroscopy is required for the study of the physical of the perturbed galaxies and of the stripped gas. IFU data are available for a small fraction of the early-type galaxies from Guerou et al. (2015) or from the ATLAS-3D survey (Cappellari et al. 2011), and for several late-type systems from Chemin et al. (2006). High resolution long-slit spectra are also available for a dozen of dwarves (Toloba et al. 2011, 2014).
9 Summary
The Virgo Environmental Survey Tracing Ionised Gas Emission (VESTIGE) is a blind NB H imaging survey of the Virgo cluster region up to its virial radius. The survey, started in 2017 and planned to run for three years, is carried out with MegaCam at the Canada-France-Hawaii Telescope. VESTIGE reaches a sensitivity of 4 10-17 erg sec-1 cm-2 (5 detection limit) for point sources and 2 10-18 erg sec-1 cm-2 arcsec-2 (1 detection limit at 3 arcsec resolution) for extended sources, and will be the deepest and largest blind NB survey of a nearby cluster. The observations carried out so far of the centre of the cluster show that, at this sensitivity, VESTIGE is able to detect extended filaments of ionised gas produced by the interaction of galaxies with the surrounding environment. This survey has been designed to study the effects of the environment on galaxy evolution and will provide, for years to come, an ideal reference for comparison with cosmological models. As designed, VESTIGE will also be used to study the fate of the stripped gas in cluster objects, the star formation process in nearby galaxies of different type and stellar mass, the determination of the H luminosity function and of the H scaling relations down to 106 M⊙ stellar mass objects, and the reconstruction of the dynamical structure of the Virgo cluster. Thanks to its sensitivity and large sky coverage, VESTIGE will also be used to study the HII luminosity function on hundreds of galaxies, the diffuse H emission of the Milky Way at high Galactic latitude, and the properties of emission line galaxies at high redshift. The legacy value of VESTIGE is thus very high and the survey is virtually guaranteed to provide a reference for years to come.
Acknowledgements.
We thank the anonymous referee for useful comments on the manuscript. We thank Jeffrey Chan for useful advices on the determination of the survey depth. We acknowledge financial support from ”Programme National de Cosmologie and Galaxies” (PNCG) funded by CNRS/INSU-IN2P3-INP, CEA and CNES, France, and from ”Projet International de Coopération Scientifique” (PICS) with Canada funded by the CNRS, France. This research has made use of the NASA/IPAC Extragalactic Database (NED) which is operated by the Jet Propulsion Laboratory, California Institute of Technology, under contract with the National Aeronautics and Space Administration and of the GOLDMine database (http://goldmine.mib.infn.it/) (Gavazzi et al. 2003b). MB was supported by MINEDUC-UA projects, code ANT 1655 and ANT 1656. AL work was supported by the Sino-French LIA-Origin joint program. MS acknowledges support from the NSF grant 1714764 and the Chandra Award GO6-17111X. MF acknowledges support by the science and technology facilities council [grant number ST/P000541/1]. EWP acknowledges support from the National Natural Science Foundation of China through Grant No. 11573002. KS acknowledges support from the Natural Sciences and Engineering Research Council of Canada (NSERC).References
- Abraham et al. (2003) Abraham, R. G., van den Bergh, S., & Nair, P. 2003, ApJ, 588, 218
- Abramson et al. (2011) Abramson, A., Kenney, J. D. P., Crowl, H. H., et al. 2011, AJ, 141, 164
- Abramson et al. (2016) Abramson, A., Kenney, J., Crowl, H., & Tal, T. 2016, AJ, 152, 32
- Adams et al. (2013) Adams, E. A. K., Giovanelli, R., & Haynes, M. P. 2013, ApJ, 768, 77
- Albareti et al. (2017) Albareti, F., Allende Prieto, C., Almeida A., et al. 2017, arXiv:1608.02013
- Arrigoni Battaia et al. (2012) Arrigoni Battaia, F., Gavazzi, G., Fumagalli, M., et al. 2012, A&A, 543, A112
- Auld et al. (2013) Auld, R., Bianchi, S., Smith, M. W. L., et al. 2013, MNRAS, 428, 1880
- Bacon et al. (2017) Bacon, R., Conseil, S., Mary, D., et al. 2017, arXiv:1710.03002
- Baes et al. (2014) Baes, M., Herranz, D., Bianchi, S., et al. 2014, A&A, 562, A106
- Balogh et al. (2000) Balogh, M. L., Navarro, J. F., & Morris, S. L. 2000, ApJ, 540, 113
- Barnes et al. (2017) Barnes, D. J., Kay, S. T., Bahé, Y. M., et al. 2017, MNRAS, 471, 1088
- Barton et al. (2000) Barton, E. J., Geller, M. J., & Kenyon, S. J. 2000, ApJ, 530, 660
- Becker et al. (1995) Becker, R. H., White, R. L., & Helfand, D. J. 1995, ApJ, 450, 559
- Bekki (2009) Bekki, K. 2009, MNRAS, 399, 2221
- Bekki (2014) Bekki, K. 2014, MNRAS, 438, 444
- Belfiore et al. (2016) Belfiore, F., Maiolino, R., Maraston, C., et al. 2016, MNRAS, 461, 3111
- Bellazzini et al. (2015) Bellazzini, M., Magrini, L., Mucciarelli, A., et al. 2015, ApJ, 800, L15
- Bendo et al. (2012) Bendo, G. J., Galliano, F., & Madden, S. C. 2012, MNRAS, 423, 197
- Bertin & Arnouts (1996) Bertin, E., & Arnouts, S. 1996, A&AS, 117, 393
- Bianchi et al. (2017) Bianchi, S., Giovanardi, C., Smith, M. W. L., et al. 2017, A&A, 597, A130
- Binggeli et al. (1985) Binggeli, B., Sandage, A., & Tammann, G. A. 1985, AJ, 90, 1681
- Binggeli et al. (1987) Binggeli, B., Tammann, G. A., & Sandage, A. 1987, AJ, 94, 251
- Binney et al. (2009) Binney, J., Nipoti, C., & Fraternali, F. 2009, MNRAS, 397, 1804
- Biviano et al. (2006) Biviano, A., Murante, G., Borgani, S., et al. 2006, A&A, 456, 23
- Blakeslee et al. (2009) Blakeslee, J. P., Jordán, A., Mei, S., et al. 2009, ApJ, 694, 556
- Bland-Hawthorn & Maloney (1999) Bland-Hawthorn, J., & Maloney, P. R. 1999, ApJ, 510, L33
- Böhringer et al. (1994) Böhringer, H., Briel, U. G., Schwarz, R. A., et al. 1994, Nature, 368, 828
- Boissier et al. (2001) Boissier, S., Boselli, A., Prantzos, N., & Gavazzi, G. 2001, MNRAS, 321, 733
- Boissier et al. (2003) Boissier, S., Prantzos, N., Boselli, A., & Gavazzi, G. 2003a, MNRAS, 346, 1215
- Boissier et al. (2003) Boissier, S., Monnier Ragaigne, D., Prantzos, N., et al. 2003b, MNRAS, 343, 653
- Boissier et al. (2007) Boissier, S., Gil de Paz, A., Boselli, A., et al. 2007, ApJS, 173, 524
- Boissier et al. (2008) Boissier, S., Gil de Paz, A., Boselli, A., et al. 2008, ApJ, 681, 244-257
- Boissier et al. (2012) Boissier, S., Boselli, A., Duc, P.-A., et al. 2012, A&A, 545, A142
- Boissier et al. (2015) Boissier, S., Boselli, A., Voyer, E., et al. 2015, A&A, 579, A29
- Boquien et al. (2012) Boquien, M., Buat, V., Boselli, A., et al. 2012, A&A, 539, A145
- Boquien et al. (2014) Boquien, M., Buat, V., & Perret, V. 2014, A&A, 571, A72
- Boquien et al. (2016) Boquien, M., Kennicutt, R., Calzetti, D., et al. 2016, A&A, 591, A6
- Boselli (2011) Boselli, A. 2011, A Panchromatic View of Galaxies, by Alessandro Boselli. - Practical Approach Book - ISBN-10: 3-527-40991-2. ISBN-13: 978-3-527-40991-4 - Wiley-VCH, Berlin 2011. XVI, 324pp, Hardcover,
- Boselli & Gavazzi (2002) Boselli, A., & Gavazzi, G. 2002, A&A, 386, 124
- (40) Boselli, A., & Gavazzi, G. 2006, PASP, 118, 517
- Boselli & Gavazzi (2014) Boselli, A., & Gavazzi, G. 2014, A&A Rev., 22, 74
- Boselli et al. (1995) Boselli, A., Casoli, F., & Lequeux, J. 1995, A&AS, 110, 521
- Boselli et al. (2001) Boselli, A., Gavazzi, G., Donas, J., & Scodeggio, M. 2001, AJ, 121, 753
- Boselli et al. (2002) Boselli, A., Iglesias-Páramo, J., Vílchez, J. M., & Gavazzi, G. 2002b, A&A, 386, 134
- Boselli et al. (2002) Boselli, A., Lequeux, J., & Gavazzi, G. 2002a, A&A, 384, 33
- Boselli et al. (2003) Boselli, A., Sauvage, M., Lequeux, J., Donati, A., & Gavazzi, G. 2003, A&A, 406, 867
- Boselli et al. (2005) Boselli, A., Boissier, S., Cortese, L., et al. 2005, ApJ, 623, L13
- (48) Boselli, A., Boissier, S., Cortese, L., et al. 2006, ApJ, 651, 811
- (49) Boselli, A., Boissier, S., Cortese, L., & Gavazzi, G. 2008a, ApJ, 674, 742
- (50) Boselli, A., Boissier, S., Cortese, L., & Gavazzi, G. 2008b, A&A, 489, 1015
- Boselli et al. (2009) Boselli, A., Boissier, S., Cortese, L., et al. 2009, ApJ, 706, 1527
- Boselli et al. (2010) Boselli, A., Eales, S., Cortese, L., et al. 2010, PASP, 122, 261
- (53) Boselli, A., Boissier, S., Heinis, S., et al. 2011, A&A, 528, A107
- Boselli et al. (2013) Boselli, A., Hughes, T. M., Cortese, L., Gavazzi, G., & Buat, V. 2013, A&A, 550, A114
- Boselli et al. (2014) Boselli, A., Voyer, E., Boissier, S., et al. 2014a, A&A, 570, AA69
- Boselli et al. (2014) Boselli, A., Cortese, L., & Boquien, M. 2014b, A&A, 564, A65
- Boselli et al. (2014) Boselli, A., Cortese, L., Boquien, M., et al. 2014c, A&A, 564, A67
- Boselli et al. (2015) Boselli, A., Fossati, M., Gavazzi, G., et al. 2015, A&A, 579, A102
- Boselli et al. (2016) Boselli, A., Cuillandre, J. C., Fossati, M., et al. 2016a, A&A, 587, A68
- Boselli et al. (2016) Boselli, A., Roehlly, Y., Fossati, M., et al. 2016b, A&A, 596, A11
- Boselli et al. (2016) Boselli, A., Boissier, S., Voyer, E., et al. 2016c, A&A, 585, A2
- Boselli et al. (2017) Boselli A., Fossati M., Cuillandre J.C., et al., submitted to A&A (paper IV)
- Boulade et al. (2003) Boulade, O., Charlot, X., Abbon, P., et al. 2003, Proc. SPIE, 4841, 72
- Boulanger et al. (1996) Boulanger, F., Abergel, A., Bernard, J.-P., et al. 1996, A&A, 312, 256
- Bovy (2015) Bovy, J. 2015, ApJS, 216, 29
- Bradley et al. (2006) Bradley, T. R., Knapen, J. H., Beckman, J. E., & Folkes, S. L. 2006, A&A, 459, L13
- Bryan et al. (2014) Bryan, G. L., Norman, M. L., O’Shea, B. W., et al. 2014, ApJS, 211, 19
- Bullock (2010) Bullock, J. S. 2010, arXiv:1009.4505
- Burkhart & Loeb (2016) Burkhart, B., & Loeb, A. 2016, ApJ, 824, L7
- Buzzoni et al. (2006) Buzzoni, A., Arnaboldi, M., & Corradi, R. L. M. 2006, MNRAS, 368, 877
- Byrd & Valtonen (1990) Byrd, G., & Valtonen, M. 1990, ApJ, 350, 89
- Calzetti et al. (2010) Calzetti, D., Wu, S.-Y., Hong, S., et al. 2010, ApJ, 714, 1256
- Cannon et al. (2015) Cannon, J. M., Martinkus, C. P., Leisman, L., et al. 2015, AJ, 149, 72
- Cappellari et al. (2011) Cappellari, M., Emsellem, E., Krajnović, D., et al. 2011, MNRAS, 413, 813
- Cayatte et al. (1990) Cayatte, V., van Gorkom, J. H., Balkowski, C., & Kotanyi, C. 1990, AJ, 100, 604
- Cen (2014) Cen, R. 2014, ApJ, 781, 38
- Chemin et al. (2006) Chemin, L., Balkowski, C., Cayatte, V., et al. 2006, MNRAS, 366, 812
- Chung et al. (2007) Chung, A., van Gorkom, J. H., Kenney, J. D. P., & Vollmer, B. 2007, ApJ, 659, L115
- Chung et al. (2009) Chung, A., van Gorkom, J. H., Kenney, J. D. P., Crowl, H., & Vollmer, B. 2009a, AJ, 138, 1741
- Chung et al. (2009) Chung, E. J., Rhee, M.-H., Kim, H., et al. 2009b, ApJS, 184, 199
- Ciardullo (2010) Ciardullo, R. 2010, PASA, 27, 149
- Ciardullo et al. (1998) Ciardullo, R., Jacoby, G. H., Feldmeier, J. J., & Bartlett, R. E. 1998, ApJ, 492, 62
- Ciardullo et al. (2013) Ciardullo, R., Gronwall, C., Adams, J. J., et al. 2013, ApJ, 769, 83
- Ciesla et al. (2012) Ciesla, L., Boselli, A., Smith, M. W. L., et al. 2012, A&A, 543, A161
- Ciesla et al. (2014) Ciesla, L., Boquien, M., Boselli, A., et al. 2014, A&A, 565, A128
- Condon et al. (1998) Condon, J. J., Cotton, W. D., Greisen, E. W., et al. 1998, AJ, 115, 1693
- Conselice (2003) Conselice, C. J. 2003, ApJS, 147, 1
- Consolandi (2016) Consolandi, G. 2016, A&A, 595, A67
- Consolandi et al. (2016) Consolandi, G., Gavazzi, G., Fumagalli, M., Dotti, M., & Fossati, M. 2016, A&A, 591, A38
- Consolandi et al. (2017) Consolandi, G., Dotti, M., Boselli, A., Gavazzi, G., & Gargiulo, F. 2017a, A&A, 598, A114
- Consolandi et al. (2017) Consolandi, G., Gavazzi, G., Fossati, M., et al. 2017b, A&A, 606, A83
- Cortés et al. (2015) Cortés, J. R., Kenney, J. D. P., & Hardy, E. 2015, ApJS, 216, 9
- Cortese et al. (2006) Cortese, L., Gavazzi, G., Boselli, A., et al. 2006, A&A, 453, 847
- Cortese et al. (2010) Cortese, L., Davies, J. I., Pohlen, M., et al. 2010a, A&A, 518, L49
- Cortese et al. (2010) Cortese, L., Bendo, G. J., Boselli, A., et al. 2010b, A&A, 518, L63
- Cortese et al. (2010) Cortese, L., Bendo, G. J., Isaak, K. G., Davies, J. I., & Kent, B. R. 2010b, MNRAS, 403, L26
- Cortese et al. (2012) Cortese, L., Ciesla, L., Boselli, A., et al. 2012, A&A, 540, A52
- Cortese et al. (2014) Cortese, L., Fritz, J., Bianchi, S., et al. 2014, MNRAS, 440, 942
- Côté et al. (2004) Côté, P., Blakeslee, J. P., Ferrarese, L., et al. 2004, ApJS, 153, 223
- Côté et al. (2006) Côté, P., Piatek, S., Ferrarese, L., et al. 2006, ApJS, 165, 57
- Côté et al. (2009) Côté, S., Draginda, A., Skillman, E. D., & Miller, B. W. 2009, AJ, 138, 1037
- Cowie & Songaila (1977) Cowie, L. L., & Songaila, A. 1977, Nature, 266, 501
- Cowie et al. (1996) Cowie, L. L., Songaila, A., Hu, E. M., & Cohen, J. G. 1996, AJ, 112, 839
- Crain et al. (2015) Crain, R. A., Schaye, J., Bower, R. G., et al. 2015, MNRAS, 450, 1937
- Crowl & Kenney (2008) Crowl, H. H., & Kenney, J. D. P. 2008, AJ, 136, 1623
- Crowl et al. (2005) Crowl, H. H., Kenney, J. D. P., van Gorkom, J. H., & Vollmer, B. 2005, AJ, 130, 65
- da Silva et al. (2014) da Silva, R. L., Fumagalli, M., & Krumholz, M. R. 2014, MNRAS, 444, 3275
- Davies et al. (2010) Davies, J. I., Baes, M., Bendo, G. J., et al. 2010, A&A, 518, L48
- Decarli et al. (2007) Decarli, R., Gavazzi, G., Arosio, I., et al. 2007, MNRAS, 381, 136
- De Looze et al. (2013) De Looze, I., Baes, M., Boselli, A., et al. 2013, MNRAS, 436, 1057
- De Lucia et al. (2012) De Lucia, G., Weinmann, S., Poggianti, B. M., Aragón-Salamanca, A., & Zaritsky, D. 2012, MNRAS, 423, 1277
- Dennison et al. (1998) Dennison, B., Simonetti, J. H., & Topasna, G. A. 1998, PASA, 15, 147
- Dressler (1980) Dressler, A. 1980, ApJ, 236, 351
- Dressler (2004) Dressler, A. 2004, Clusters of Galaxies: Probes of Cosmological Structure and Galaxy Evolution, 206
- Dressler et al. (1997) Dressler, A., Oemler, A., Jr., Couch, W. J., et al. 1997, ApJ, 490, 577
- Drew et al. (2005) Drew, J. E., Greimel, R., Irwin, M. J., et al. 2005, MNRAS, 362, 753
- Drew et al. (2014) Drew, J. E., Gonzalez-Solares, E., Greimel, R., et al. 2014, MNRAS, 440, 2036
- Drissen et al. (2010) Drissen, L., Bernier, A.-P., Rousseau-Nepton, L., et al. 2010, Proc. SPIE, 7735, 77350B
- Durret et al. (2011) Durret, F., Adami, C., Cappi, A., et al. 2011, A&A, 535, A65
- Ellison et al. (2008) Ellison, S. L., Patton, D. R., Simard, L., & McConnachie, A. W. 2008, AJ, 135, 1877
- Evrard et al. (2008) Evrard, A. E., Bialek, J., Busha, M., et al. 2008, ApJ, 672, 122-137
- Feldmeier et al. (2003) Feldmeier, J. J., Ciardullo, R., Jacoby, G. H., & Durrell, P. R. 2003, ApJS, 145, 65
- Ferrarese et al. (2012) Ferrarese, L., Côté, P., Cuillandre, J.-C., et al. 2012, ApJS, 200, 4
- Ferrarese et al. (2016) Ferrarese, L., Côté, P., Sánchez-Janssen, R., et al. 2016, ApJ, 824, 10
- Fillingham et al. (2015) Fillingham, S. P., Cooper, M. C., Wheeler, C., et al. 2015, MNRAS, 454, 2039
- Finkbeiner et al. (2016) Finkbeiner, D. P., Schlafly, E. F., Schlegel, D. J., et al. 2016, ApJ, 822, 66
- For et al. (2012) For, B.-Q., Koribalski, B. S., & Jarrett, T. H. 2012, MNRAS, 425, 1934
- Fossati et al. (2012) Fossati, M., Gavazzi, G., Boselli, A., & Fumagalli, M. 2012, A&A, 544, A128
- Fossati et al. (2016) Fossati, M., Fumagalli, M., Boselli, A., et al. 2016, MNRAS, 455, 2028
- Fossati et al. (2018) Fossati, M., Mendes, t., Boselli, A., et al., A&A (paper III), in press: arXiv:1801.09685
- Fryxell et al. (2000) Fryxell, B., Olson, K., Ricker, P., et al. 2000, ApJS, 131, 273
- Fumagalli et al. (2011) Fumagalli, M., Gavazzi, G., Scaramella, R., & Franzetti, P. 2011b, A&A, 528, A46
- Fumagalli et al. (2011) Fumagalli, M., da Silva, R. L., & Krumholz, M. R. 2011a, ApJ, 741, L26
- Fumagalli et al. (2014) Fumagalli, M., Fossati, M., Hau, G. K. T., et al. 2014, MNRAS, 445, 4335
- Garel et al. (2015) Garel, T., Blaizot, J., Guiderdoni, B., et al. 2015, MNRAS, 450, 1279
- Garel et al. (2016) Garel, T., Guiderdoni, B., & Blaizot, J. 2016, MNRAS, 455, 3436
- Gaustad et al. (2001) Gaustad, J. E., McCullough, P. R., Rosing, W., & Van Buren, D. 2001, PASP, 113, 1326
- Gavazzi & Boselli (1999) Gavazzi, G., & Boselli, A. 1999, A&A, 343, 86
- Gavazzi et al. (1996) Gavazzi, G., Pierini, D., & Boselli, A. 1996, A&A, 312, 397
- Gavazzi et al. (1998) Gavazzi, G., Catinella, B., Carrasco, L., Boselli, A., & Contursi, A. 1998, AJ, 115, 1745
- Gavazzi et al. (1999) Gavazzi, G., Boselli, A., Scodeggio, M., Pierini, D., & Belsole, E. 1999, MNRAS, 304, 595
- Gavazzi et al. (2000) Gavazzi, G., Boselli, A., Vílchez, J. M., Iglesias-Paramo, J., & Bonfanti, C. 2000, A&A, 361, 1
- Gavazzi et al. (2001) Gavazzi, G., Boselli, A., Mayer, L., et al. 2001, ApJ, 563, L23
- Gavazzi et al. (2002) Gavazzi, G., Boselli, A., Pedotti, P., Gallazzi, A., & Carrasco, L. 2002a, A&A, 396, 449
- Gavazzi et al. (2002) Gavazzi, G., Bonfanti, C., Sanvito, G., Boselli, A., & Scodeggio, M. 2002b, ApJ, 576, 135
- Gavazzi et al. (2003) Gavazzi, G., Cortese, L., Boselli, A., et al. 2003a, ApJ, 597, 210
- Gavazzi et al. (2003) Gavazzi, G., Boselli, A., Donati, A., Franzetti, P., & Scodeggio, M. 2003b, A&A, 400, 451
- Gavazzi et al. (2004) Gavazzi, G., Zaccardo, A., Sanvito, G., Boselli, A., & Bonfanti, C. 2004, A&A, 417, 499
- Gavazzi et al. (2005) Gavazzi, G., Boselli, A., van Driel, W., & O’Neil, K. 2005, A&A, 429, 439
- Gavazzi et al. (2006) Gavazzi, G., Boselli, A., Cortese, L., et al. 2006, A&A, 446, 839
- Gavazzi et al. (2013) Gavazzi, G., Fumagalli, M., Fossati, M., et al. 2013, A&A, 553, A89
- Gavazzi et al. (2015) Gavazzi, G., Consolandi, G., Dotti, M., et al. 2015, A&A, 580, A116
- Gavazzi et al. (2017) Gavazzi, G., Consolandi, G., Pedraglio, S., et al. 2017, arXiv:1709.06511
- Geller & Huchra (1989) Geller, M. J., & Huchra, J. P. 1989, Science, 246, 897
- Genel et al. (2014) Genel, S., Vogelsberger, M., Springel, V., et al. 2014, MNRAS, 445, 175
- Giovanelli et al. (2005) Giovanelli, R., Haynes, M. P., Kent, B. R., et al. 2005, AJ, 130, 2598
- Girardi et al. (1998) Girardi, M., Giuricin, G., Mardirossian, F., Mezzetti, M., & Boschin, W. 1998, ApJ, 505, 74
- Gnedin (2003) Gnedin, O. Y. 2003, ApJ, 589, 752
- Gomes et al. (2016) Gomes, J. M., Papaderos, P., Kehrig, C., et al. 2016, A&A, 588, A68
- Guérou et al. (2015) Guérou, A., Emsellem, E., McDermid, R. M., et al. 2015, ApJ, 804, 70
- Gunawardhana et al. (2013) Gunawardhana, M. L. P., Hopkins, A. M., Bland-Hawthorn, J., et al. 2013, MNRAS, 433, 2764
- Gunn & Gott (1972) Gunn, J. E., & Gott, J. R., III 1972, ApJ, 176, 1
- Gwyn (2008) Gwyn, S. D. J. 2008, PASP, 120, 212
- Haffner et al. (2001) Haffner, L. M., Reynolds, R. J., & Tufte, S. L. 2001, ApJ, 556, L33
- Haynes et al. (2007) Haynes, M. P., Giovanelli, R., & Kent, B. R. 2007, ApJ, 665, L19
- Haynes et al. (2011) Haynes, M. P., Giovanelli, R., Martin, A. M., et al. 2011, AJ, 142, 170
- Helfer et al. (2003) Helfer, T. T., Thornley, M. D., Regan, M. W., et al. 2003, ApJS, 145, 259
- Heitsch & Putman (2009) Heitsch, F., & Putman, M. E. 2009, ApJ, 698, 1485
- Hester et al. (2010) Hester, J. A., Seibert, M., Neill, J. D., et al. 2010, ApJ, 716, L14
- Hippelein et al. (2003) Hippelein, H., Maier, C., Meisenheimer, K., et al. 2003, A&A, 402, 65
- Hodge et al. (1989) Hodge, P., Lee, M. G., & Kennicutt, R. C., Jr. 1989, PASP, 101, 32
- Hodge et al. (1999) Hodge, P. W., Balsley, J., Wyder, T. K., & Skelton, B. P. 1999, PASP, 111, 685
- Ilbert et al. (2009) Ilbert, O., Capak, P., Salvato, M., et al. 2009, ApJ, 690, 1236
- Ivezić et al. (2004) Ivezić, Ž., Lupton, R. H., Schlegel, D., et al. 2004, Astronomische Nachrichten, 325, 583
- Jáchym et al. (2013) Jáchym, P., Kenney, J. D. P., Ržuička, A., et al. 2013, A&A, 556, A99
- Jáchym et al. (2014) Jáchym, P., Combes, F., Cortese, L., Sun, M., & Kenney, J. D. P. 2014, ApJ, 792, 11
- Jacoby et al. (1990) Jacoby, G. H., Ciardullo, R., & Ford, H. C. 1990, ApJ, 356, 332
- Janowiecki et al. (2015) Janowiecki, S., Leisman, L., Józsa, G., et al. 2015, ApJ, 801, 96
- James et al. (2004) James, P. A., Shane, N. S., Beckman, J. E., et al. 2004, A&A, 414, 23
- Karachentsev & Nasonova (2010) Karachentsev, I. D., & Nasonova, O. G. 2010, MNRAS, 405, 1075
- Karachentsev et al. (2014) Karachentsev, I. D., Tully, R. B., Wu, P.-F., Shaya, E. J., & Dolphin, A. E. 2014, ApJ, 782, 4
- Kauffmann et al. (1993) Kauffmann, G., White, S. D. M., & Guiderdoni, B. 1993, MNRAS, 264, 201
- Kauffmann et al. (2004) Kauffmann, G., White, S. D. M., Heckman, T. M., et al. 2004, MNRAS, 353, 713
- Kenney & Young (1988) Kenney, J. D., & Young, J. S. 1988, ApJS, 66, 261
- Kenney et al. (2004) Kenney, J. D. P., van Gorkom, J. H., & Vollmer, B. 2004, AJ, 127, 3361
- Kenney et al. (2008) Kenney, J. D. P., Tal, T., Crowl, H. H., Feldmeier, J., & Jacoby, G. H. 2008, ApJ, 687, L69
- Kenney et al. (2014) Kenney, J. D. P., Geha, M., Jáchym, P., et al. 2014, ApJ, 780, 119
- Kennicutt (1981) Kennicutt, R. C., Jr. 1981, ApJ, 247, 9
- Kennicutt (1983) Kennicutt, R. C., Jr. 1983, AJ, 88, 483
- Kennicutt (1998) Kennicutt, R. C., Jr. 1998, ARA&A, 36, 189
- Kennicutt & Keel (1984) Kennicutt, R. C., Jr., & Keel, W. C. 1984, ApJ, 279, L5
- Kennicutt & Hodge (1986) Kennicutt, R. C., Jr., & Hodge, P. W. 1986, ApJ, 306, 130
- Kennicutt & Evans (2012) Kennicutt, R. C., & Evans, N. J. 2012, ARA&A, 50, 531
- Kennicutt et al. (1989) Kennicutt, R. C., Jr., Edgar, B. K., & Hodge, P. W. 1989, ApJ, 337, 761
- Kennicutt et al. (2008) Kennicutt, R. C., Jr., Lee, J. C., Funes, J. G., et al. 2008, ApJS, 178, 247-279
- Kennicutt et al. (2009) Kennicutt, R. C., Jr., Hao, C.-N., Calzetti, D., et al. 2009, ApJ, 703, 1672-1695
- Kikuchi et al. (2000) Kikuchi, K., Itoh, C., Kushino, A., et al. 2000, ApJ, 531, L95
- Koopmann et al. (2001) Koopmann, R. A., Kenney, J. D. P., & Young, J. 2001, ApJS, 135, 125
- Koribalski (2012) Koribalski, B. S. 2012, PASA, 29, 359
- Kwak & Shelton (2010) Kwak, K., & Shelton, R. L. 2010, ApJ, 719, 523
- Lagache et al. (2000) Lagache, G., Haffner, L. M., Reynolds, R. J., & Tufte, S. L. 2000, A&A, 354, 247
- Larson et al. (1980) Larson, R. B., Tinsley, B. M., & Caldwell, C. N. 1980, ApJ, 237, 692
- Lee et al. (2011) Lee, J. H., Hwang, N., & Lee, M. G. 2011, ApJ, 735, 75
- Licitra et al. (2016) Licitra, R., Mei, S., Raichoor, A., et al. 2016, ApJ, 829, 44
- Lisker et al. (2006) Lisker, T., Glatt, K., Westera, P., & Grebel, E. K. 2006, AJ, 132, 2432
- Lotz et al. (2004) Lotz, J. M., Primack, J., & Madau, P. 2004, AJ, 128, 163
- Ly et al. (2007) Ly, C., Malkan, M. A., Kashikawa, N., et al. 2007, ApJ, 657, 738
- Macchetto et al. (1996) Macchetto, F., Pastoriza, M., Caon, N., et al. 1996, A&AS, 120, 463
- Magnier & Cuillandre (2004) Magnier, E. A., & Cuillandre, J.-C. 2004, PASP, 116, 449
- Magnier et al. (2013) Magnier, E. A., Schlafly, E., Finkbeiner, D., et al. 2013, ApJS, 205, 20
- Martin et al. (2005) Martin, D. C., Fanson, J., Schiminovich, D., et al. 2005, ApJ, 619, L1
- Martin et al. (2018) Martin, T. B., Drissen, L., & Melchior, A.-L. 2018, MNRAS, 473, 4130
- McGee et al. (2009) McGee, S. L., Balogh, M. L., Bower, R. G., Font, A. S., & McCarthy, I. G. 2009, MNRAS, 400, 937
- McLaughlin (1999) McLaughlin, D. E. 1999, ApJ, 512, L9
- Méndez et al. (2001) Méndez, R. H., Riffeser, A., Kudritzki, R.-P., et al. 2001, ApJ, 563, 135
- Mei et al. (2007) Mei, S., Blakeslee, J. P., Côté, P., et al. 2007, ApJ, 655, 144
- Merritt (1983) Merritt, D. 1983, ApJ, 264, 24
- Meyer et al. (2004) Meyer, M. J., Zwaan, M. A., Webster, R. L., et al. 2004, MNRAS, 350, 1195
- Michel-Dansac & Wozniak (2004) Michel-Dansac, L., & Wozniak, H. 2004, A&A, 421, 863
- Michielsen et al. (2004) Michielsen, D., de Rijcke, S., Zeilinger, W. W., et al. 2004, MNRAS, 353, 1293
- Mihos et al. (2009) Mihos, J. C., Janowiecki, S., Feldmeier, J. J., Harding, P., & Morrison, H. 2009, ApJ, 698, 1879
- Mitchell et al. (2013) Mitchell, N. L., Vorobyov, E. I., & Hensler, G. 2013, MNRAS, 428, 2674
- Moore et al. (1998) Moore, B., Lake, G., & Katz, N. 1998, ApJ, 495, 139
- Muñoz et al. (2014) Muñoz, R. P., Puzia, T. H., Lançon, A., et al. 2014, ApJS, 210, 4
- Nelson et al. (2015) Nelson, D., Pillepich, A., Genel, S., et al. 2015, Astronomy and Computing, 13, 12
- Norris et al. (2011) Norris, R. P., Hopkins, A. M., Afonso, J., et al. 2011, PASA, 28, 215
- Nulsen (1982) Nulsen, P. E. J. 1982, MNRAS, 198, 1007
- Nulsen & Bohringer (1995) Nulsen, P. E. J., & Bohringer, H. 1995, MNRAS, 274, 1093
- Olsen et al. (2007) Olsen, L. F., Benoist, C., Cappi, A., et al. 2007, A&A, 461, 81
- Ouchi et al. (2008) Ouchi, M., Shimasaku, K., Akiyama, M., et al. 2008, ApJS, 176, 301-330
- Parker et al. (2005) Parker, Q. A., Phillipps, S., Pierce, M. J., et al. 2005, MNRAS, 362, 689
- Patton et al. (2011) Patton, D. R., Ellison, S. L., Simard, L., McConnachie, A. W., & Mendel, J. T. 2011, MNRAS, 412, 591
- Patton et al. (2013) Patton, D. R., Torrey, P., Ellison, S. L., Mendel, J. T., & Scudder, J. M. 2013, MNRAS, 433, L59
- Patton et al. (2016) Patton, D. R., Qamar, F. D., Ellison, S. L., et al. 2016, MNRAS, 461, 2589
- Peek et al. (2011) Peek, J. E. G., Heiles, C., Douglas, K. A., et al. 2011, ApJS, 194, 20
- Peng et al. (2010) Peng, Y.-j., Lilly, S. J., Kovač, K., et al. 2010, ApJ, 721, 193
- Perryman et al. (2001) Perryman, M. A. C., de Boer, K. S., Gilmore, G., et al. 2001, A&A, 369, 339
- Pickles (1998) Pickles, A. J. 1998, PASP, 110, 863
- Planck Collaboration et al. (2014) Planck Collaboration, Ade, P. A. R., Aghanim, N., et al. 2014, A&A, 571, A1
- Putman et al. (2003) Putman, M. E., Bland-Hawthorn, J., Veilleux, S., et al. 2003, ApJ, 597, 948
- Putman et al. (2012) Putman, M. E., Peek, J. E. G., & Joung, M. R. 2012, ARA&A, 50, 491
- Rafieferantsoa et al. (2015) Rafieferantsoa, M., Davé, R., Anglés-Alcázar, D., et al. 2015, MNRAS, 453, 3980
- Raichoor et al. (2014) Raichoor, A., Mei, S., Erben, T., et al. 2014, ApJ, 797, 102
- Rand (1992) Rand, R. J. 1992, AJ, 103, 815
- Reynolds (1987) Reynolds, R. J. 1987, ApJ, 323, 553
- Reynolds et al. (1998) Reynolds, R. J., Tufte, S. L., Haffner, L. M., Jaehnig, K., & Percival, J. W. 1998, PASA, 15, 14
- Roediger & Hensler (2005) Roediger, E., & Hensler, G. 2005, A&A, 433, 875
- Roediger et al. (2017) Roediger, J. C., Ferrarese, L., Côté, P., et al. 2017, ApJ, 836, 120
- Sakai et al. (2002) Sakai, S., Kennicutt, R. C., Jr., van der Hulst, J. M., & Moss, C. 2002, ApJ, 578, 842
- Sánchez-Gallego et al. (2012) Sánchez-Gallego, J. R., Knapen, J. H., Wilson, C. D., et al. 2012, MNRAS, 422, 3208
- Sarazin (1986) Sarazin, C. L. 1986, Reviews of Modern Physics, 58, 1
- Saul et al. (2012) Saul, D. R., Peek, J. E. G., Grcevich, J., et al. 2012, ApJ, 758, 44
- Schaye et al. (2015) Schaye, J., Crain, R. A., Bower, R. G., et al. 2015, MNRAS, 446, 521
- Schindler et al. (1999) Schindler, S., Binggeli, B., & Böhringer, H. 1999, A&A, 343, 420
- Scott et al. (2012) Scott, T. C., Cortese, L., Brinks, E., et al. 2012, MNRAS, 419, L19
- Scoville et al. (2001) Scoville, N. Z., Polletta, M., Ewald, S., et al. 2001, AJ, 122, 3017
- Scudder et al. (2012) Scudder, J. M., Ellison, S. L., Torrey, P., Patton, D. R., & Mendel, J. T. 2012, MNRAS, 426, 549
- Serra et al. (2013) Serra, P., Koribalski, B., Duc, P.-A., et al. 2013, MNRAS, 428, 370
- Shelton et al. (2012) Shelton, R. L., Kwak, K., & Henley, D. B. 2012, ApJ, 751, 120
- Skrutskie et al. (2006) Skrutskie, M. F., Cutri, R. M., Stiening, R., et al. 2006, AJ, 131, 1163
- Sivanandam et al. (2014) Sivanandam, S., Rieke, M. J., & Rieke, G. H. 2014, ApJ, 796, 89
- Solanes et al. (2001) Solanes, J. M., Manrique, A., García-Gómez, C., et al. 2001, ApJ, 548, 97
- Solanes et al. (2002) Solanes, J. M., Sanchis, T., Salvador-Solé, E., Giovanelli, R., & Haynes, M. P. 2002, AJ, 124, 2440
- Sorce et al. (2016) Sorce, J. G., Gottlöber, S., Hoffman, Y., & Yepes, G. 2016, MNRAS, 460, 2015
- Sparks et al. (1993) Sparks, W. B., Ford, H. C., & Kinney, A. L. 1993, ApJ, 413, 531
- Spector et al. (2012) Spector, O., Finkelman, I., & Brosch, N. 2012, MNRAS, 419, 2156
- Stetson (1987) Stetson, P. B. 1987, PASP, 99, 191
- Sun et al. (2006) Sun, M., Jones, C., Forman, W., et al. 2006, ApJ, 637, L81
- Sun et al. (2007) Sun, M., Donahue, M., & Voit, G. M. 2007, ApJ, 671, 190
- Sun et al. (2010) Sun, M., Donahue, M., Roediger, E., et al. 2010, ApJ, 708, 946
- Taylor & Webster (2005) Taylor, E. N., & Webster, R. L. 2005, ApJ, 634, 1067
- Taylor et al. (2012) Taylor, R., Davies, J. I., Auld, R., & Minchin, R. F. 2012, MNRAS, 423, 787
- Theuns & Warren (1997) Theuns, T., & Warren, S. J. 1997, MNRAS, 284, L11
- Thilker et al. (2002) Thilker, D. A., Walterbos, R. A. M., Braun, R., & Hoopes, C. G. 2002, AJ, 124, 3118
- Toloba et al. (2011) Toloba, E., Boselli, A., Cenarro, A. J., et al. 2011, A&A, 526, A114
- Toloba et al. (2014) Toloba, E., Guhathakurta, P., Peletier, R. F., et al. 2014, ApJS, 215, 17
- Tonnesen & Bryan (2009) Tonnesen, S., & Bryan, G. L. 2009, ApJ, 694, 789
- Tonnesen & Bryan (2010) Tonnesen, S., & Bryan, G. L. 2010, ApJ, 709, 1203
- Tonnesen & Bryan (2012) Tonnesen, S., & Bryan, G. L. 2012, MNRAS, 422, 1609
- Tonnesen & Stone (2014) Tonnesen, S., & Stone, J. 2014, ApJ, 795, 148
- Tonnesen et al. (2011) Tonnesen, S., Bryan, G. L., & Chen, R. 2011, ApJ, 731, 98
- Trinchieri & di Serego Alighieri (1991) Trinchieri, G., & di Serego Alighieri, S. 1991, AJ, 101, 1647
- Tufte et al. (1998) Tufte, S. L., Reynolds, R. J., & Haffner, L. M. 1998, ApJ, 504, 773
- Tufte et al. (2002) Tufte, S. L., Wilson, J. D., Madsen, G. J., Haffner, L. M., & Reynolds, R. J. 2002, ApJ, 572, L153
- Tully & Shaya (1984) Tully, R. B., & Shaya, E. J. 1984, ApJ, 281, 31
- Ulrich (1978) Ulrich, M.-H. 1978, ApJ, 221, 422
- Urban et al. (2011) Urban, O., Werner, N., Simionescu, A., Allen, S. W., & Böhringer, H. 2011, MNRAS, 414, 2101
- Vanden Berk et al. (2001) Vanden Berk, D. E., Richards, G. T., Bauer, A., et al. 2001, AJ, 122, 549
- Verdugo et al. (2015) Verdugo, C., Combes, F., Dasyra, K., Salomé, P., & Braine, J. 2015, A&A, 582, A6
- Vogelsberger et al. (2014) Vogelsberger, M., Genel, S., Springel, V., et al. 2014, MNRAS, 444, 1518
- Vollmer (2003) Vollmer, B. 2003, A&A, 398, 525
- Vollmer (2009) Vollmer, B. 2009, A&A, 502, 427
- Vollmer et al. (2001) Vollmer, B., Cayatte, V., Balkowski, C., & Duschl, W. J. 2001, ApJ, 561, 708
- Vollmer et al. (2004) Vollmer, B., Balkowski, C., Cayatte, V., van Driel, W., & Huchtmeier, W. 2004, A&A, 419, 35
- Voyer et al. (2014) Voyer, E. N., Boselli, A., Boissier, S., et al. 2014, A&A, 569, A124
- Yagi et al. (2007) Yagi, M., Komiyama, Y., Yoshida, M., et al. 2007, ApJ, 660, 1209
- Yagi et al. (2010) Yagi, M., Yoshida, M., Komiyama, Y., et al. 2010, AJ, 140, 1814
- Yagi et al. (2013) Yagi, M., Gu, L., Fujita, Y., et al. 2013, ApJ, 778, 91
- Yagi et al. (2017) Yagi, M., Yoshida, M., Gavazzi, G., et al. 2017, ApJ, 839, 65
- Yasuda et al. (1997) Yasuda, N., Fukugita, M., & Okamura, S. 1997, ApJS, 108, 417
- York et al. (2000) York, D. G., Adelman, J., Anderson, J. E., Jr., et al. 2000, AJ, 120, 1579
- Yoshida et al. (2002) Yoshida, M., Yagi, M., Okamura, S., et al. 2002, ApJ, 567, 118
- Yoshida et al. (2008) Yoshida, M., Yagi, M., Komiyama, Y., et al. 2008, ApJ, 688, 918
- Youngblood & Hunter (1999) Youngblood, A. J., & Hunter, D. A. 1999, ApJ, 519, 55
- Young et al. (1995) Young, J. S., Xie, S., Tacconi, L., et al. 1995, ApJS, 98, 219
- Young et al. (1996) Young, J. S., Allen, L., Kenney, J. D. P., Lesser, A., & Rownd, B. 1996, AJ, 112, 1903
- Whitaker et al. (2011) Whitaker, K. E., Labbé, I., van Dokkum, P. G., et al. 2011, ApJ, 735, 86
- Wolf et al. (2003) Wolf, C., Meisenheimer, K., Rix, H.-W., et al. 2003, A&A, 401, 73
- Wood et al. (2010) Wood, K., Hill, A. S., Joung, M. R., et al. 2010, ApJ, 721, 1397
- Woods et al. (2010) Woods, D. F., Geller, M. J., Kurtz, M. J., et al. 2010, AJ, 139, 1857
- Wright et al. (2010) Wright, E. L., Eisenhardt, P. R. M., Mainzer, A. K., et al. 2010, AJ, 140, 1868-1881
- Zhang et al. (2013) Zhang, B., Sun, M., Ji, L., et al. 2013, ApJ, 777, 122
- Zhu et al. (2008) Zhu, Y.-N., Wu, H., Cao, C., & Li, H.-N. 2008, ApJ, 686, 155-171