DeepHeart: Semi-Supervised Sequence Learning for Cardiovascular Risk Prediction
Abstract
We train and validate a semi-supervised, multi-task LSTM on 57,675 person-weeks of data from off-the-shelf wearable heart rate sensors, showing high accuracy at detecting multiple medical conditions, including diabetes (0.8451), high cholesterol (0.7441), high blood pressure (0.8086), and sleep apnea (0.8298). We compare two semi-supervised training methods, semi-supervised sequence learning and heuristic pretraining, and show they outperform hand-engineered biomarkers from the medical literature. We believe our work suggests a new approach to patient risk stratification based on cardiovascular risk scores derived from popular wearables such as Fitbit, Apple Watch, or Android Wear.
Introduction
In medicine, each label represents a human life at risk —for example, a person who recently suffered a heart attack or experienced an abnormal heart rhythm. As a result, even widely-used predictive models like CHA2DS2-VASc may be derived from as few as 25 positive labels (?). However, popular wearables, such as Fitbit and Apple Watch, generate trillions of unlabeled sensor data points per year, including rich signals like resting heart rate and heart rate variability, which have been shown to correlate with health conditions as diverse as diabetes, sleep apnea, atrial fibrillation, heart failure, sudden cardiac death, and irritable bowel syndrome (?).
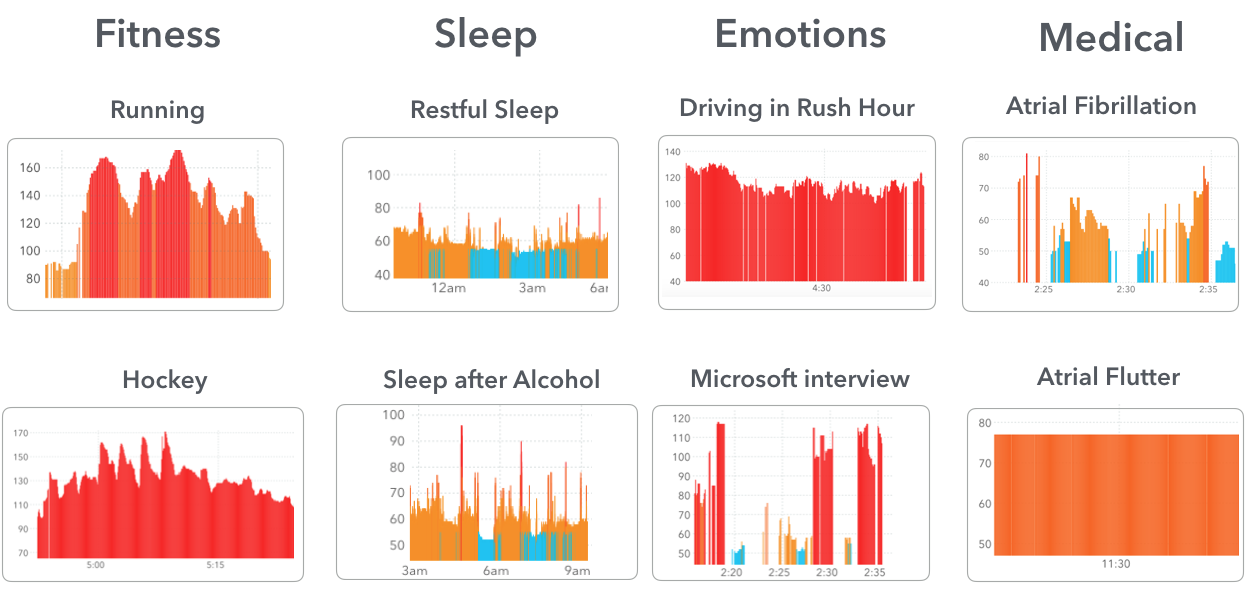
Using consumer-grade heart rate sensors in a medical context presents several challenges. First, the sensors themselves have significant error (?). Second, they vary the rate of measurement to preserve battery life. Third, since wearables are used in an ambulatory setting, daily activities like walking, exercise, stress, consuming alcohol, or drinking coffee (Figure 1) may confuse simple heuristics.
Deep neural networks (?) have shown high accuracy at pattern recognition from noisy, complex inputs, including automated detection of diabetic retinopathy from images (?), skin cancer from mobile phone cameras (?), and the onset of health conditions from electronic medical records (?; ?; ?; ?). However, purely supervised deep learning requires many labeled examples. No such database exists for wearable data, and in most hospital systems, recruiting even a hundred patients into a new medical study is labor-intensive and expensive.
To solve this, we take a two-pronged approach. First, we employ a mobile phone application to recruit 14,011 participants from across the world, collecting 200 million unlabeled sensor measurements. Data from these participants is then used in one of two semi-supervised training procedures. In semi-supervised sequence learning (?), an LSTM (?) is pretrained as a sequence autoencoder; weights from pretraining are used as initialization for a second supervised phase, making use of a limited pool of labeled data from participants with known diagnoses. In heuristic pretraining, the neural network is instead pretrained to compute heart-rate-derived biomarkers from the medical literature, partially bridging the gap between feature engineering and deep learning.
The rest of this paper is organized as follows. We first describe a novel data set derived from 14,011 participants with wearable heart rate monitors, recruited in partnership with the Health eHeart Study of the University of California, San Francisco. We then describe DeepHeart, our model architecture, and the semi-supervised training methods used, semi-supervised sequence learning and heuristic pretraining. Then we present experimental results showing that semi-supervised deep neural networks achieve higher accuracy in detecting diabetes, sleep apnea, high blood pressure, and high cholesterol than several strong baselines derived from biomarkers in the medical literature. We conclude by describing some of the historical barriers to wide-scale deployment of artificial intelligence in medicine and how we plan to address them in future work.
Data and Study Cohort
Electronic medical records contain important discrete events, such as lab tests and diagnoses, while continuous wearable data from mobile health platforms, such as Apple HealthKit or Google Fit, cover the majority of the patient’s time outside of a medical setting. In order to train a deep neural network to predict diagnoses given wearable data, we sought to combine the two data sources.
Study Cohort
We recruited 14,011 users of a popular Apple Watch app into an online, IRB-approved study run in partnership with the cardiology department of the University of California, San Francisco (?). Participants completed a medical history, including previous diagnoses, blood test results, and medications. A mobile app—Cardiogram—integrated with HealthKit continuously stored, processed, and displayed participant heart rate, step count, and other activity data.
We chose to focus on four highly prevalent but often undiagnosed conditions associated with cardiovascular risk: high cholesterol, hypertension (high blood pressure), sleep apnea, and diabetes. 45.8% of diabetes cases are undiagnosed (?). Sleep apnea is estimated to affect 22 million people in the US alone, over 80% of whom are undiagnosed (?). Together, high blood pressure and high cholesterol account for 17.3% of global deaths (?), as they are both major risk factors for heart attacks.
| Condition | Number of | Person- | Person- |
| People | Weeks of | Weeks of | |
| Training | Testing | ||
| Data | Data | ||
| Unlabeled | 1,462 | 10,616 | N/A |
| High Cholesterol | 2,331 | 9,220 | 3,243 |
| Hypertension | 2,230 | 7,651 | 2,762 |
| Sleep Apnea | 1,016 | 3,662 | 1,141 |
| Diabetes | 462 | 1,678 | 644 |
Multi-Channel, Multi-Timescale Sensor Data
Consumer wearables produce multiple channels of data—most commonly, step count measured using a wrist-worn accelerometer and optical heart rate measured using photoplethysmography. For example, the Apple Watch measures heart rate every five seconds when in workout mode and roughly every five minutes during other times of the day. Likewise, step counts are recorded every few minutes while the user is walking.
We encoded sensor measurements into a tensor with indices for the user-week , timestep , and input channel . Heart rate and step count were encoded as separate input channels. To accommodate variable timescales, we encoded intra-channel time-deltas as a special dt channel:
| (1) |
Without transforming dt, the model does not train due to the wide spread of values (ranging from 5000 to 28,800,000).
Sequences contained up to 4096 timesteps of sensor data, and shorter sequences were zero-padded.
Pre-Processing
Each participant was randomly assigned to either the training, tuning, or testing set. Each participant’s data was then split into week-long chunks, and any weeks with heart rate measurements ( hours per day of background measurements) or minutes of continuous heart rate recordings were omitted. After filtering, there were 57,675 person-weeks of data in total, divided into 33,628 for training, 18,555 for tuning, and 12,790 for validation. The training, tuning, and testing sets contained completely disjoint sets of participants.
Multi-Task Labeled Output
Similar to X, our output is a tensor with indices for the user-week , timestep , and output channel . There are separate output channels for prevalent cases of each condition: high cholesterol, hypertension, sleep apnea, and diabetes. Diagnoses are derived from validated health surveys collected in partnership with the Health eHeart Study of the University of California, San Francisco. In addition, we included an output channel of ECG readings111Our research builds on previous work to detect atrial fibrillation using ECGs. We chose to keep this output task so our model could benefit from ECG readings.. ECG readings were aligned to the closest sensor measurement in X, and diagnoses were aligned to the last timestep in X. Each is a discrete label: either positive (user has condition, or abnormal ECG reading) or negative (user is not diagnosed with condition, or ECG reading is normal). We used output masking to score the models only when has a value.
Model Architecture
Figure 2 shows our model architecture. The inputs are multi-channel, multi-timescale sensor measurements, and the outputs are multi-task, multi-timescale diagnoses. Table 3 summarizes hyperparameter tuning experiments.
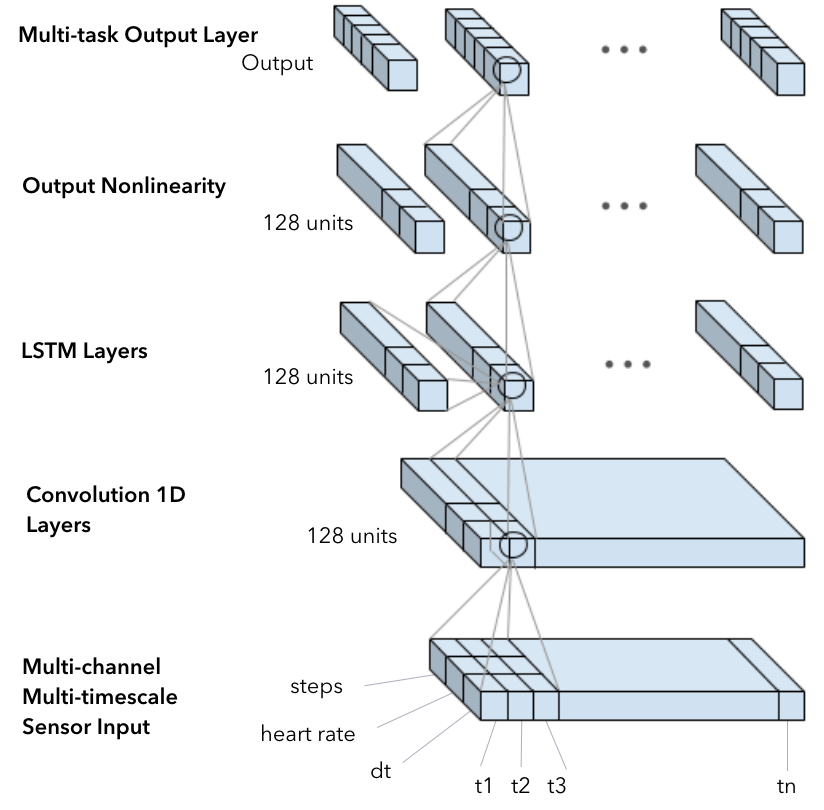
Temporal Convolutions
The first three layers are temporal convolutions, which have been shown to efficiently extract features and model temporal translation invariance (?). The first layer has a wide filter length of 12, similar to AlexNet (?), and the next two layers use the residual units (?) with a filter length of 5. Each convolutional layer contains 128 convolutional channels. After each convolutional layer, we apply dropout with probability 0.2 to prevent overfitting, and apply max pooling with pool length 2 to reduce dimensionality.
Bidirectional LSTM
The convolutional layers are followed by four bidirectional LSTM layers that model longer temporal patterns in wearable sensor data and their corresponding multi-timescale diagnoses. Each bidirectional LSTM layer contains 128 units (64 in each direction).
A dropout of 0.2 is applied to this final LSTM layer, and the result is run through a simple output unit: a convolution of filter length 1. The purpose of this convolution is to map the outputs of the LSTM into a single prediction per task, per timestep. For this final layer, we use a tanh activation so outputs range from -1 to 1.
Training Methods
In addition to ordinary supervised training, we experimented with two pretraining architectures. Semi-supervised training is advantageous here because unlabeled data from wearables is abundant, but medical condition labels are more scarce.
Unsupervised Sequence Pretraining
Semi-supervised sequence learning has been shown to improve performance when presented with large amounts of unlabeled training data (?). We experimented with this approach by first training a sequence-to-sequence autoencoder, consisting of the 3 convolutional and 4 recurrent layers. We then use the weights from the autoencoder as initializing parameters for the corresponding layers in the supervised architecture. In order to force the autoencoder to not merely memorize the input, we added Gaussian noise to the input sequence.
Weakly-Supervised Heuristic Pretraining
Previous work has applied statistical methods on beat-to-beat variability to detect heart arrhythmias (?). Inspired by this, we synthesized a dataset for pretraining using a time-windowed heart rate variability metric. We defined four output tasks, with window sizes of 5 seconds, 30 seconds, 5 minutes, and 30 minutes, computed the average absolute difference between successive heart rate measurements, and used these as output channels in a weakly-supervised pretraining phase. The resulting weights were used for initialization in supervised training. In this way, we use pretraining as a technique to bridge feature engineering and deep learning.
Experiments
To evaluate our architecture, we ran a series of experiments summarized in Table 2. For each condition on our data set, we report the c-statistic—the area under the ROC curve—on the test set. Each experiment used the Adam optimizer (?) and a squared error loss, since we found squared error to be more numerically stable than cross-entropy.
| Name | Diabetes | High Cholesterol | Sleep Apnea | High Blood Pressure |
| Logistic Regression | 0.7906 | 0.5941 | 0.6583 | 0.6389 |
| Support Vector Machine | 0.5722 | 0.5996 | 0.5490 | 0.6106 |
| Decision Tree | 0.4142 | 0.5152 | 0.6415 | 0.6625 |
| Random Forest | 0.5515 | 0.5647 | 0.5907 | 0.6310 |
| Multi-layer Perceptron | 0.7846 | 0.4327 | 0.6172 | 0.7195 |
| LSTM, No Pretraining | 0.8451 | 0.6736 | 0.8041 | 0.7991 |
| LSTM, Heuristic Pretraining | 0.8366 | 0.7148 | 0.7951 | 0.7427 |
| LSTM, Unsupervised Pretraining | 0.7998 | 0.7441 | 0.8298 | 0.8086 |
Baselines
We compared our architecture with multiple machine learning algorithms using hand-engineered biomarkers derived from the medical literature, including resting heart rate (?), time-windowed average heart rate (?), time-windowed standard deviation of heart rates (?), time-windowed spectrum entropy (?), time-windowed root mean squared of successive beats per minute differences (?), and time-windowed entropy of BPM differences (?). We used 5-minute and 30-minute time windows, and included global versions of standard deviation and RMS of successive BPM differences, for 13 features in total. We trained several standard machine learning algorithms on all of these features, including scikit-learn’s (?) implementation of logistic regression, support vector machines, decision trees, random forests, and multi-layer perceptrons.
LSTM without Pretraining
We first trained a purely-supervised LSTM without pretraining, which performed significantly better than the baselines on sleep apnea (0.80 vs 0.55-0.66), hypertension (0.80 vs 0.61-0.72), high cholesterol (0.67 vs 0.43-0.60), and diabetes (0.85 vs 0.41-0.79). The gap is smallest for diabetes, with the least amount of labeled data, suggesting potential benefit from combining hand-engineered features with deep learning. Previous work from the medical community has suggested that diabetes may impact heart rate variability through effects on the autonomic nervous system (?). Our work builds on top of these previous findings, and suggests that heart rate variability changes driven by diabetes can be detected via consumer, off-the-self wearable heart rate sensors.
Heuristic Pretrained LSTM
When the supervised LSTM is initialized with weights from heuristic pretraining, we saw noticeable improvements for high cholesterol (0.71 vs 0.67), neutral results for sleep apnea and diabetes, and a significant loss for high blood pressure (0.74 vs 0.80). The gain on high cholesterol is particularly surprising, given that the baseline results, which are based on similar hand-engineered heuristic features, did not perform well. One explanation is that the neural network is able to find non-linear relationships for the underlying patterns that generate these heuristic features, and the insights discovered by the heuristic pretraining were useful for predicting high cholesterol.
On high blood pressure, the heuristic-pretrained LSTM performs significantly worse than the LSTM without pretraining. One explanation is that the heuristic of average BPM differences is a poor predictor of high blood pressure, and gradient descent cannot escape from this space of poorly-performing predictors.
Semi-supervised Sequence Learning
The last experiment applied semi-supervised sequence learning: we first pretrained DeepHeart as a sequence autoencoder, using the encoder weights as initialization for a second, supervised phase, as described in (?). This approach resulted in a significant improvement on high cholesterol, high blood pressure, and sleep apnea.
The 0.83 c-statistic at detecting sleep apnea is surprising given that few participants sleep with their watch. This suggests that wearable-derived biomarkers measured during the day capture a distinct signature of sleep apnea.
Among all four health conditions, high cholesterol has the least direct physiological relationship with heart rate variability in the medical literature. While we are able to detect high cholesterol with c-statistic of 0.74, it is the lowest performing prediction out of the four disease states, suggesting that much of the correlation may be a reflection of confounding variables such as age, sex, or usage of medications like beta blockers. Nevertheless, a c-statistic of 0.74 from consumer-grade wearables alone is a surprising and novel finding.
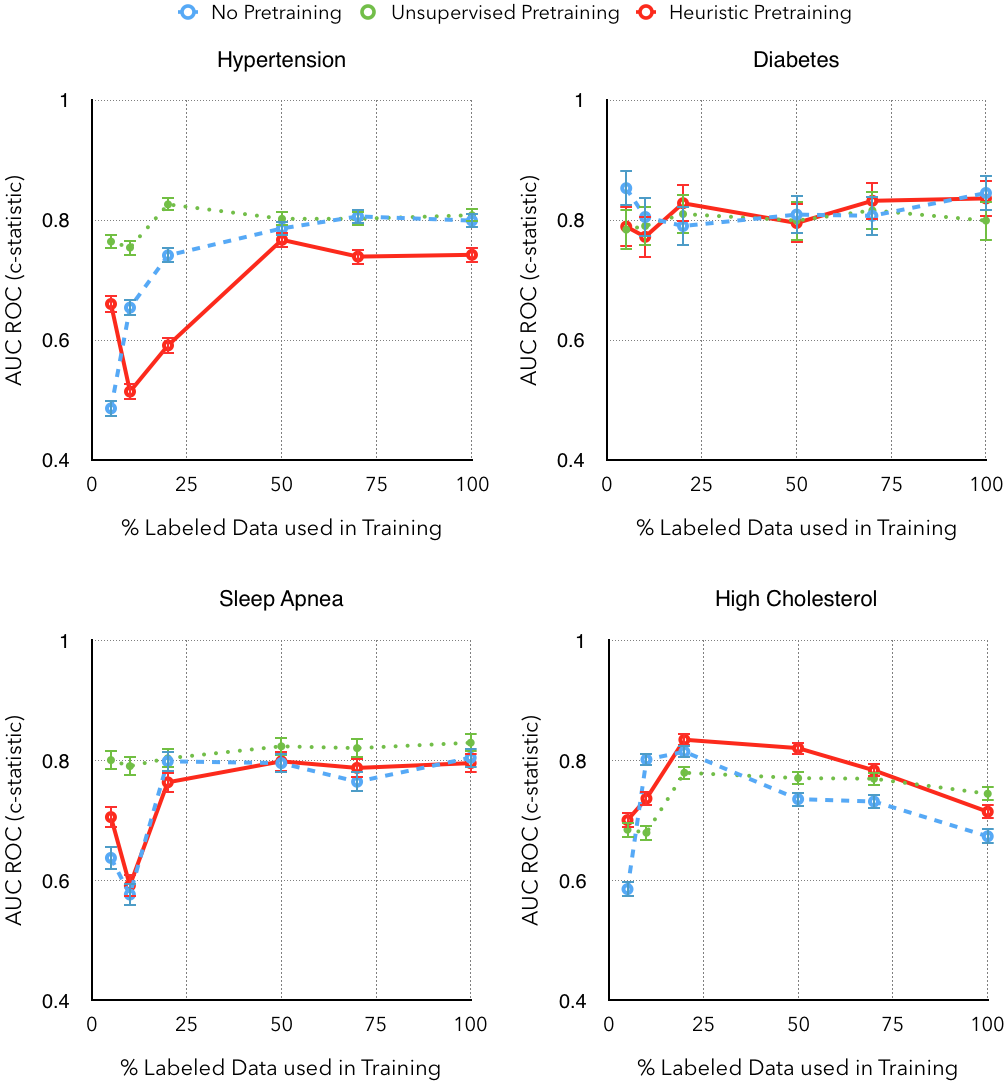
Effect of Varying Amounts of Labeled Data
To quantify the impact of each pretraining technique, we evaluated DeepHeart’s performance when trained on varying fractions of the labeled data (5%, 10%, 20%, 50%, 70%, and 100%), using no pretraining, heuristic pretraining, and semi-supervised sequence learning (Figure 4).
For hypertension and sleep apnea, unsupervised pretraining yields a 10x improvement in data-efficiency: the DNN achieves nearly the same accuracy with 10% of labeled data using unsupervised pretraining as it does with 100% of labeled data using no pretraining. For diabetes and cholesterol, the effect is muted. For diabetes, this is due to a scarcity of labels (1,678, vs 3,662-9,220 for the other conditions). For high cholesterol, the lack of correlation between the number of labels and accuracy of the algorithm likely confirms that high cholesterol is primarily detected through the effect of confounding variables such as age, sex, and medications.
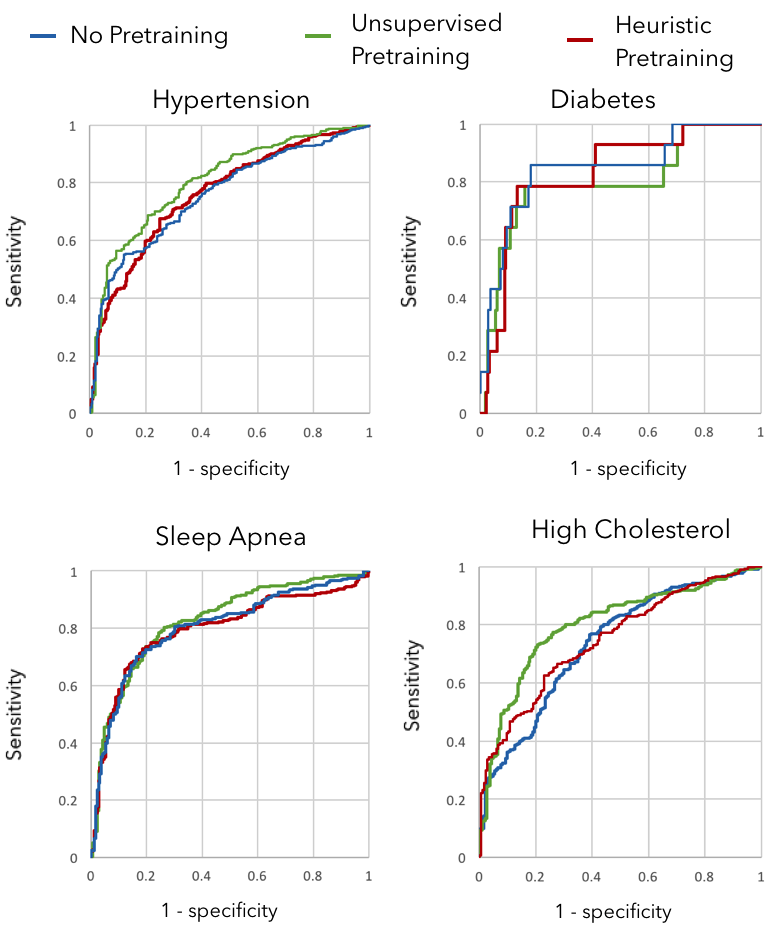
The shape of the ROC curves (Figure 3) are also interesting to note. It is clear that the semi-supervised sequence LSTM performs very well for detecting diabetes, sleep apnea, and hypertension, three of the most highly prevalent conditions with undiagnosis rates of 45.8%, 80%, and 20% respectively. For high cholesterol, although the c-statistic is lower, there are high-precision operating points which rule out more than half of the study population. This suggests wearables could be used to focus diagnostic testing on a high-risk subset of the population, leading to cost-effective screening for metabolic syndrome and getting at-risk patients care sooner.
Ablative Analysis of Input Channels
To determine the impact of each input channel, we tested models using heart rate and step count in isolation.
A model trained only on heart rate timeseries performed significantly worse on diabetes and high blood pressure (decrease of 0.0653 and 0.0721 in AUC, respectively), and the same on sleep apnea and high blood pressure (within the 95% confidence interval), suggesting that heart rate is being interpreted as a response to activity. Within the medical literature, heart rate recovery after exercise is associated with lower risks of cardiovascular disease (?). A model using only aggregate step counts achieved an AUC of 0.7011 (diabetes), 0.5811 (sleep apnea), 0.5714 (hbp), and 0.5601 (high cholesterol), suggesting that although overall physical activity plays an important role in predicting the onset of disease, the heart’s response to physical activity is a more salient biomarker that can be captured using deep learning.
| Width | Conv Depth | LSTM Depth | Initial Filter | AF | Diabetes | High BP | Apnea | Chol | Avg |
|---|---|---|---|---|---|---|---|---|---|
| 32 | 2 | 2 | 12 | 0.7548 | 0.8709 | 0.8494 | 0.8610 | 0.8549 | 0.8382 |
| 32 | 2 | 2 | 5 | 0.7340 | 0.8724 | 0.8375 | 0.8594 | 0.8541 | 0.8315 |
| 32 | 2 | 4 | 12 | 0.7621 | 0.8748 | 0.8455 | 0.8664 | 0.8511 | 0.8400 |
| 32 | 2 | 4 | 5 | 0.7633 | 0.8659 | 0.7995 | 0.8567 | 0.8257 | 0.8222 |
| 32 | 4 | 2 | 12 | 0.7480 | 0.8540 | 0.8502 | 0.8583 | 0.8352 | 0.8291 |
| 32 | 4 | 2 | 5 | 0.7652 | 0.8622 | 0.8258 | 0.8592 | 0.8211 | 0.8267 |
| 32 | 4 | 4 | 12 | 0.7440 | 0.8711 | 0.8233 | 0.8605 | 0.8442 | 0.8286 |
| 32 | 4 | 4 | 5 | 0.7336 | 0.8628 | 0.8403 | 0.8626 | 0.8444 | 0.8287 |
| 64 | 2 | 2 | 12 | 0.7317 | 0.8696 | 0.8494 | 0.8599 | 0.8594 | 0.8340 |
| 64 | 2 | 2 | 5 | 0.7514 | 0.8719 | 0.8544 | 0.8585 | 0.8525 | 0.8377 |
| 64 | 2 | 4 | 12 | 0.7891 | 0.8647 | 0.8444 | 0.8597 | 0.8467 | 0.8409 |
| 64 | 4 | 2 | 12 | 0.7903 | 0.8517 | 0.8550 | 0.8622 | 0.8513 | 0.8421 |
| 64 | 4 | 2 | 5 | 0.7855 | 0.8655 | 0.8483 | 0.8559 | 0.8442 | 0.8399 |
| 64 | 4 | 4 | 12 | 0.8079 | 0.8805 | 0.8453 | 0.8584 | 0.8647 | 0.8514 |
| 64 | 4 | 4 | 5 | 0.7958 | 0.8756 | 0.8434 | 0.8632 | 0.8618 | 0.8480 |
| 128 | 2 | 2 | 5 | 0.7770 | 0.8653 | 0.8529 | 0.8607 | 0.8549 | 0.8422 |
| 128 | 2 | 4 | 12 | 0.8212 | 0.8718 | 0.8262 | 0.8604 | 0.8361 | 0.8431 |
| 128 | 2 | 4 | 5 | 0.7695 | 0.8727 | 0.8427 | 0.8630 | 0.8273 | 0.8350 |
| 128 | 4 | 2 | 12 | 0.8076 | 0.8668 | 0.8616 | 0.8613 | 0.8409 | 0.8476 |
| 128 | 4 | 2 | 5 | 0.7646 | 0.8658 | 0.8030 | 0.8516 | 0.8286 | 0.8227 |
| 128 | 4 | 4 | 12 | 0.8143 | 0.8723 | 0.8414 | 0.8600 | 0.8639 | 0.8504 |
| 128 | 4 | 4 | 5 | 0.7702 | 0.8640 | 0.8555 | 0.8575 | 0.8407 | 0.8376 |
Discussion
We’ve shown that two methods, semi-supervised sequence learning and heuristic pretraining, address a key technical challenge in applying deep learning to medicine: achieving high accuracy with limited labeled data. Furthermore, we’ve shown high accuracy at detecting four common health conditions—diabetes, sleep apnea, hypertension, and high cholesterol–using readily available, off-the-shelf heart rate monitors. Since these four conditions are highly prevalent, commonly undiagnosed, and reduced HRV is associated with the earliest stages of disease progression (?; ?), this suggests a new approach to public health screening using deep learning.
While these results are promising, artificial intelligence-based systems have shown high accuracy at medical tasks—even outperforming human physicians—since the days of MYCIN (?), CADUCEUS (?), and INTERNIST-I (?). For AI-based systems to broadly improve human health, several key challenges beyond prediction accuracy must be addressed.
A first challenge is confounding factors. Statistical models in medicine are typically used for etiology, not just prediction, and cause (disease) and effect (treatment) may be intertwined in subtle ways within medical data sets (?). For example, a person with previously-diagnosed hypertension may be prescribed beta blockers, which affect heart rate variability, and therefore an algorithm with high prediction accuracy at identifying hypertension may be picking up signals of both the underlying disease and the treatment. While there are well-known algorithms to adjust for confounders in linear models, confounder-aware neural network architectures are a critical future area of research.
A second challenge is deployment. While hospital departments such as the intensive care unit or radiology department often have ample training data available, deploying a new algorithm in a hospital is typically slow or impossible because errors are costly (a severe error may cost a human life), the technical implementation is cumbersome (an integration with an electronic medical record system), the organizational complexity is high (high regulatory burden, necessity to train physicians on new systems), and the financial incentives are often misaligned (for example, preventing readmissions may reduce the hospital’s revenue). An alternative is to take an outside-in approach: design care pathways for ambulatory, mobile-based screening that operate outside of the hospital but guide participants in to the appropriate point of care when a neural network detects high risk. Here, false negatives represent the status quo (no diagnosis), and with sufficiently high precision the cost of false positives (e.g., blood tests, mobile ECGs) is exceeded by the cost savings to the healthcare system of each true positive. Since an algorithm can be packaged in a mobile app, it can be updated and quickly deployed to participants. We are currently deploying our algorithm in ambulatory, mobile trials in partnership with major medical centers to show real-world efficacy and build a rigorous clinical evidence base (?).
A third challenge is interpretability. Deep learning systems perform well but are “black boxes,” whereas medical systems prefer to provide an explanation of the chain of reasoning. We intend to incorporate mechanisms such as differentiable attention (?; ?) to help both physicians and regulators understand the internal workings of the neural network and its potential failure modes.
A last challenge is the time-scale and volume of data. Many participants in our study have more than a year of heart rate and step count data, corresponding to nearly one million time steps. We intend to test neural architectures that can better model long-range dependencies, such as Clockwork RNNs (?), Phased LSTMs (?), and Gaussian Process RNNs (?) in order to better model changes to a participant’s physiological state over a long period of time.
While these challenges may seem daunting, the constraints of medicine—scarce labeled data, confounding factors, difficulty of deployment, and the necessity of interpretability—also represent opportunities to develop new techniques. This work is a first step in showing how health conditions can be detected using techniques first developed in natural language processing and computer vision. Over time, we plan to extend this work to address the challenges above and deploy neural networks that can improve health in the real world.
References
- [Alwan and others 2011] Alwan, A., et al. 2011. Global status report on noncommunicable diseases 2010. World Health Organization.
- [Amodei et al. 2016] Amodei, D.; Anubhai, R.; Battenberg, E.; Case, C.; Casper, J.; Catanzaro, B.; Chen, J.; Chrzanowski, M.; Coates, A.; Diamos, G.; et al. 2016. End to end speech recognition in english and mandarin.
- [Banks 1985] Banks, G. 1985. Artificial intelligence in medical diagnosis: the internist/caduceus approach. Critical reviews in medical informatics 1(1):23–54.
- [Beagley et al. 2014] Beagley, J.; Guariguata, L.; Weil, C.; and Motala, A. A. 2014. Global estimates of undiagnosed diabetes in adults. Diabetes research and clinical practice 103(2):150–160.
- [Chan et al. 2016] Chan, W.; Jaitly, N.; Le, Q.; and Vinyals, O. 2016. Listen, attend and spell: A neural network for large vocabulary conversational speech recognition. In Acoustics, Speech and Signal Processing (ICASSP), 2016 IEEE International Conference on, 4960–4964. IEEE.
- [Che et al. 2015] Che, Z.; Kale, D.; Li, W.; Bahadori, M. T.; and Liu, Y. 2015. Deep computational phenotyping. In Proceedings of the 21th ACM SIGKDD International Conference on Knowledge Discovery and Data Mining, 507–516. ACM.
- [Choi et al. 2016] Choi, E.; Bahadori, M. T.; Schuetz, A.; Stewart, W. F.; and Sun, J. 2016. Doctor ai: Predicting clinical events via recurrent neural networks. In Machine Learning for Healthcare Conference, 301–318.
- [Dai and Le 2015] Dai, A. M., and Le, Q. V. 2015. Semi-supervised sequence learning. In Advances in Neural Information Processing Systems, 3079–3087.
- [Esteva et al. 2017] Esteva, A.; Kuprel, B.; Novoa, R. A.; Ko, J.; Swetter, S. M.; Blau, H. M.; and Thrun, S. 2017. Dermatologist-level classification of skin cancer with deep neural networks. Nature 542(7639):115–118.
- [Fox et al. 2007] Fox, K.; Borer, J. S.; Camm, A. J.; Danchin, N.; Ferrari, R.; Sendon, J. L. L.; Steg, P. G.; Tardif, J.-C.; Tavazzi, L.; Tendera, M.; et al. 2007. Resting heart rate in cardiovascular disease. Journal of the American College of Cardiology 50(9):823–830.
- [Gillinov 2016] Gillinov, M. 2016. Accuracy of commercially available heart rate monitors. https://clinicaltrials.gov/ct2/show/NCT02818244.
- [Gulshan et al. 2016] Gulshan, V.; Peng, L.; Coram, M.; Stumpe, M. C.; Wu, D.; Narayanaswamy, A.; Venugopalan, S.; Widner, K.; Madams, T.; Cuadros, J.; et al. 2016. Development and validation of a deep learning algorithm for detection of diabetic retinopathy in retinal fundus photographs. Jama 316(22):2402–2410.
- [He et al. 2016] He, K.; Zhang, X.; Ren, S.; and Sun, J. 2016. Identity mappings in deep residual networks. In European Conference on Computer Vision, 630–645. Springer.
- [Hochreiter and Schmidhuber 1997] Hochreiter, S., and Schmidhuber, J. 1997. Long short-term memory. Neural computation 9(8):1735–1780.
- [Joseph Futoma and O’Brien 2017] Joseph Futoma, Sanjay Hariharan, K. H. M. S. N. B. M. C. A. B., and O’Brien, C. 2017. An improved multi-output gaussian process rnn with real-time validation for early sepsis detection.
- [Kamath, Watanabe, and Upton 2012] Kamath, M. V.; Watanabe, M.; and Upton, A. 2012. Heart rate variability (HRV) signal analysis: clinical applications. CRC Press.
- [Kingma and Ba 2014] Kingma, D., and Ba, J. 2014. Adam: A method for stochastic optimization. arXiv preprint arXiv:1412.6980.
- [Koutnik et al. 2014] Koutnik, J.; Greff, K.; Gomez, F.; and Schmidhuber, J. 2014. A clockwork rnn. In International Conference on Machine Learning, 1863–1871.
- [Krizhevsky, Sutskever, and Hinton 2012] Krizhevsky, A.; Sutskever, I.; and Hinton, G. E. 2012. Imagenet classification with deep convolutional neural networks. In Advances in neural information processing systems, 1097–1105.
- [Kudat et al. 2006] Kudat, H.; Akkaya, V.; Sozen, A.; Salman, S.; Demirel, S.; Ozcan, M.; Atilgan, D.; Yilmaz, M.; and Guven, O. 2006. Heart rate variability in diabetes patients. Journal of international medical research 34(3):291–296.
- [LeCun, Bengio, and Hinton 2015] LeCun, Y.; Bengio, Y.; and Hinton, G. 2015. Deep learning. Nature 521(7553):436–444.
- [Lipton et al. 2015] Lipton, Z. C.; Kale, D. C.; Elkan, C.; and Wetzell, R. 2015. Learning to diagnose with lstm recurrent neural networks. arXiv preprint arXiv:1511.03677.
- [McManus et al. 2013] McManus, D. D.; Lee, J.; Maitas, O.; Esa, N.; Pidikiti, R.; Carlucci, A.; Harrington, J.; Mick, E.; and Chon, K. H. 2013. A novel application for the detection of an irregular pulse using an iphone 4s in patients with atrial fibrillation. Heart Rhythm 10(3):315–319.
- [Morshedi-Meibodi et al. 2002] Morshedi-Meibodi, A.; Larson, M. G.; Levy, D.; O’Donnell, C. J.; and Vasan, R. S. 2002. Heart rate recovery after treadmill exercise testing and risk of cardiovascular disease events (the framingham heart study). The American journal of cardiology 90(8):848–852.
- [Neil, Pfeiffer, and Liu 2016] Neil, D.; Pfeiffer, M.; and Liu, S.-C. 2016. Phased lstm: Accelerating recurrent network training for long or event-based sequences. In Advances in Neural Information Processing Systems, 3882–3890.
- [Pedregosa et al. 2011] Pedregosa, F.; Varoquaux, G.; Gramfort, A.; Michel, V.; Thirion, B.; Grisel, O.; Blondel, M.; Prettenhofer, P.; Weiss, R.; Dubourg, V.; et al. 2011. Scikit-learn: Machine learning in python. Journal of Machine Learning Research 12(Oct):2825–2830.
- [Razavian, Marcus, and Sontag 2016] Razavian, N.; Marcus, J.; and Sontag, D. 2016. Multi-task prediction of disease onsets from longitudinal laboratory tests. In Machine Learning for Healthcare Conference, 73–100.
- [Schroeder et al. 2003] Schroeder, E. B.; Liao, D.; Chambless, L. E.; Prineas, R. J.; Evans, G. W.; and Heiss, G. 2003. Hypertension, blood pressure, and heart rate variability. Hypertension 42(6):1106–1111.
- [Schroeder et al. 2005] Schroeder, E. B.; Chambless, L. E.; Liao, D.; Prineas, R. J.; Evans, G. W.; Rosamond, W. D.; and Heiss, G. 2005. Diabetes, glucose, insulin, and heart rate variability. Diabetes care 28(3):668–674.
- [Shmueli and others 2010] Shmueli, G., et al. 2010. To explain or to predict? Statistical science 25(3):289–310.
- [Tison et al. 2017a] Tison, G. H.; Hsu, K.; Hsieh, J. T.; Ballinger, B. M.; Pletcher, M. J.; Marcus, G. M.; and Olgin, J. E. 2017a. Abstract 21029: Achieving high retention in mobile health research using design principles adopted from widely popular consumer mobile apps. Circulation 136(Suppl 1):A21029–A21029.
- [Tison et al. 2017b] Tison, G. H.; Singh, A. C.; Ohashi, D. A.; Hsieh, J. T.; Ballinger, B. M.; Olgin, J. E.; Marcus, G. M.; and Pletcher, M. J. 2017b. Abstract 21042: Cardiovascular risk stratification using off-the-shelf wearables and a multi-task deep learning algorithm. Circulation 136(Suppl 1):A21042–A21042.
- [Wolfram 1995] Wolfram, D. A. 1995. An appraisal of internist-i. Artificial intelligence in medicine 7(2):93–116.
- [Xu et al. 2015] Xu, K.; Ba, J.; Kiros, R.; Cho, K.; Courville, A.; Salakhudinov, R.; Zemel, R.; and Bengio, Y. 2015. Show, attend and tell: Neural image caption generation with visual attention. In International Conference on Machine Learning, 2048–2057.
- [Y H Lip et al. 2009] Y H Lip, G.; Nieuwlaat, R.; Pisters, R.; Lane, D.; and Crijns, H. 2009. Refining clinical risk stratification for predicting stroke and thromboembolism in atrial fibrillation using a novel risk factor-based approach the euro heart survey on atrial fibrillation. 137:263–72.
- [Young et al. 1997] Young, T.; Evans, L.; Finn, L.; and Palta, M. 1997. Estimation of the clinically diagnosed proportion of sleep apnea syndrome in middle-aged men and women. Sleep 20(9):705–706.
- [Yu et al. 1979] Yu, V. L.; Fagan, L. M.; Wraith, S. M.; Clancey, W. J.; Scott, A. C.; Hannigan, J.; Blum, R. L.; Buchanan, B. G.; and Cohen, S. N. 1979. Antimicrobial selection by a computer. a blinded evaluation by infectious diseases experts. Jama 242(12):1279–1282.