Pressure dependence of coherence-incoherence crossover behavior in KFe2As2 observed by resistivity and 75As-NMR/NQR
Abstract
We present the results of 75As nuclear magnetic resonance (NMR), nuclear quadrupole resonance (NQR), and resistivity measurements in KFe2As2 under pressure (). The temperature dependence of the NMR shift, nuclear spin-lattice relaxation time () and resistivity show a crossover between a high-temperature incoherent, local-moment behavior and a low-temperature coherent behavior at a crossover temperature (). is found to increase monotonically with pressure, consistent with increasing hybridization between localized orbital-derived bands with the itinerant electron bands. No anomaly in is seen at the critical pressure GPa where a change of slope of the superconducting (SC) transition temperature has been observed. In contrast, seems to correlate with antiferromagnetic spin fluctuations in the normal state as measured by the NQR data, although such a correlation cannot be seen in the replacement effects of A in the AFe2As2 (A= K, Rb, Cs) family. In the superconducting state, two components are observed at low temperatures, suggesting the existence of two distinct local electronic environments. The temperature dependence of the short indicates nearly gapless state below . On the other hand, the temperature dependence of the long component 1/ implies a large reduction in the density of states at the Fermi level due to the SC gap formation. These results suggest a real-space modulation of the local SC gap structure in KFe2As2 under pressure.
I I. Introduction
The iron-based superconductors (SCs) continue to be the focus of intense research in condensed matter physics, due to their unique interplay of magnetic, orbital and charge degrees of freedom Canfield2010 ; Johnston2010 ; Fernandes2014 ; Si2016 ; Dai2015 . Among the iron-based SCs, the heavily hole-doped iron-pnictide superconductor KFe2As2, with a SC transition temperature of K, shows several unique properties. The Sommerfeld coefficient ( mJ/molK2) is significantly enhanced, and the magnetic susceptibility exhibits a broad peak around 100 K Hardy2013 . Nuclear magnetic resonance (NMR) spin-lattice relaxation rates () are strongly enhanced, evidencing antiferromagnetic spin fluctuations. Curie-Weiss fits to the NMR data have demonstrated the proximity of KFe2As2 to a quantum critical point (QCP) Hirano2012 ; Wiecki2015 ; Wang2016 . These results indicate a heavy quasiparticle effective mass and strong electronic correlations Hardy2013 ; Wiecki2015 . Recent NMR investigations have also pointed out the importance of ferromagnetic spin correlations in this material Wiecki2015 .
Furthermore, the SC properties of KFe2As2 are also unique. Whereas two full SC gaps are reported in the hole-doped series Ba1-xKxFe2As2 for 0.8 Ding2008 , a nodal SC gap structure in KFe2As2 () has been suggested by several experiments Fukazawa2009 ; Hashimoto2010 ; KawanoFurukawa2011 ; Reid2012 ; Okazaki2012 ; Ota2014 . A large full gap accompanied by several very small gaps has also been proposed based on specific heat measurements Hardy2014 . In addition, shows non-monotonic behavior under pressure, with a minimum at GPa, which has been suggested to be caused by a change in the SC gap structure Tafti2013 ; Terashima2014 ; Taufour2014 . Measurements of the pressure dependence of the upper critical field suggested the appearance of a modulation of the SC gap above Taufour2014 .
Analogous behavior has also been found in the related alkali metal compounds RbFe2As2 and CsFe2As2 Hong2013 ; Tafti2014 ; Zhang2015 ; Tafti2015 ; Mizukami2016 ; Eilers2016 ; Civardi2016 , which show even greater mass enhancements with mJ/molK2 and mJ/molK2, respectively Wu2016 . The unusual properties of the AFe2As2 (A = K, Rb, Cs) family have been pointed out Hardy2013 ; Wu2016 ; Zhao2017 to be quite similar to -electron heavy fermion materials Gegenwart2008 ; Curro2009 , which display a crossover between a high-temperature incoherent, local-moment behavior and a low-temperature coherent behavior, with the crossover occurring at a temperature . In this picture, the importance of dual role of Fe electrons has been pointed out theoreticallyYou2011 ; Gorkov2013 where the two aspects of the itinerant and localized electrons may originate from different 3 orbitals of the iron ions. Recently, experimental Fang2015 ; Zhao2017 and theoretical Hardy2013 studies suggest that the bands derived from the Fe 3 orbitals would play the role of the local moments. This orbital-selective localization is due to the strong Hund coupling in these materials Georges2013 .
Recent NMR measurements have pointed out a possible -electron heavy fermion behavior in the AFe2As2 (A = K, Rb, Cs) family at ambient pressure Wu2016 . is reported to increase from 85 K for Cs, to 125 K for Rb and to 165 K for KFe2As2. Thermal expansion measurements on this family also find the lowest for Cs and highest for K, although the reported crossover temperatures are lower Hardy2016 . Since the so-called chemical pressure effects would increase when one moves from Cs to Rb to K due to the decrease in size of the alkali metal ion, this suggests that increases with increasing the chemical pressure. Furthermore, two empirical relationships involving have been discussed Wu2016 . First, the superconducting transition temperature is generally proportional to , that is , reflecting the correlation of to local magnetic coupling as pointed out in Ref. Pines2013, in the context of -electron heavy fermion SCs. Second, the Sommerfeld coefficient , and thus the effective mass , is inversely proportional to , that is (see also Ref. Hardy2013, ).
The relationship for the AFe2As2 (A = K, Rb, Cs) naively suggests that the non-monotonic behavior of in these materials under pressure could be due to a non-monotonic behavior of under pressure. This motivates an experimental investigation of the relationship between and under pressure. Here, we have carried out NMR and nuclear quadrupole resonance (NQR) measurements under high pressure up to 2.1 GPa and resistivity measurements up to GPa in order to investigate the pressure dependence of and to test its relationship with . Based on the NMR and resistivity data, we find that increases monotonically with increasing pressure with no anomaly associated with crossing GPa. These results indicate that is not the primary driver of the pressure dependence of in KFe2As2. On the other hand, measurements demonstrate that spin fluctuations are suppressed with increasing pressure up to the and then start to be enhanced above , suggesting that is related to spin fluctuations in the normal state. In the superconducting state, two-component NQR relaxation is observed below K, suggesting real space variation of the superconducting gap structure. One of the two components, the short component, shows no change in the slope of across above 1.5 GPa, indicating these nuclei see a gapless local electronic environment in the SC state under these pressure conditions. Only the second component, the long component, shows a large reduction of the density of states at the Fermi energy due to the SC gap.
II II. Experimental Details
Highly pure KFe2As2 crystal sample was obtained by recrystallization of pre-reacted KFe2As2 polycrystalline powder in KAs flux as follows. KFe2As2 polycrystalline powder was prepared by annealing a stoichiometric mixture of K/Fe/As (0.27/0.77/1.03 g) contained in an alumina crucible which was subsequently sealed in a sealed silica tube under vacuum, at 700 ∘C for one day. KAs was prepared by heating a stoichiometric 1/1 ratio of K/As (0.94/1.80 g) in an alumina tube sealed in a silica tube at 250 ∘C for 12 h. The obtained KFe2As2 powder was then thoroughly mixed with KAs at a ratio of 1/4 (1.10/1.67 g) and heated to 1,050 ∘C for 12 h, followed by cooling slowly to room temperature at 5 ∘C/h. Isolation of KFe2As2 crystals from excess KAs flux was performed by dissolving KAs in ethanol for two days under nitrogen gas flow, which produces very shiny thin plate KFe2As2 crystals. The quality of KFe2As2 crystals was confirmed by a very sharp superconducting transition at 3.4 K from the magnetic susceptibility measurement.
75As-NMR/NQR (; MHz/T; barns) measurements were performed using a lab-built, phase-coherent, spin-echo pulse spectrometer. The KFe2As2 sample was a fine powder in order to maximize the surface area for NMR/NQR measurements. The total mass of powder used in the high-pressure NMR/NQR measurements was mg. The 75As-NMR spectra were obtained either by sweeping the magnetic field at a fixed frequency = 54.8756 MHz or by Fourier transform of the NMR echo signals at a constant magnetic field of = 7.41 T. 75As-NQR spectrum in zero field was measured in steps of frequency by measuring the intensity of the Hahn spin-echo. For our measurements at ultra-low temperatures below 1 K, we used a dilution refrigerator (Oxford Instruments, Kelvinox 100) where the pressure cell was mounted.
The 75As NMR/NQR was measured with a recovery method using a single /2 saturation pulse. For NMR measurements, the at each was determined by fitting the nuclear magnetization versus time using the exponential function
| (1) |
where and are the nuclear magnetization at time after the saturation and the equilibrium nuclear magnetization at , respectively. For NQR measurements, the recovery curve was fit to
| (2) |
Pressure was applied at room temperature using a hybrid CuBe/NiCrAl piston-cylinder-type high pressure clamp cell Fujiwara2007 ; Aso2007 . Daphne 7373 was chosen as the pressure transmitting medium. Pressure calibration was accomplished by 63Cu-NQR in Cu2O Fukazawa2007 ; Reyes1992 at 77 K. In our pressure cell, the sample pressure decreases by 0.2 GPa when cooled from room temperature to 100 K, but remains constant below 100 K. The NMR coils inside the pressure cell consisted of 20 turns of 40AWG copper wire. The sample and calibration coils were oriented with their axes perpendicular to each other to avoid interference between coils.
The single-crystal electrical resistivity measurements were performed using the four-probe method with current in the plane Taufour2014 . Pressure was applied at room temperature using a modified Bridgman cell Colombier2007 with a 1:1 mixture of n-pentane:isopentane as a pressure medium, with the pressure determined using the superconducting transition of Pb.
III III. Results and Discussion
III.1 A. and critical pressure
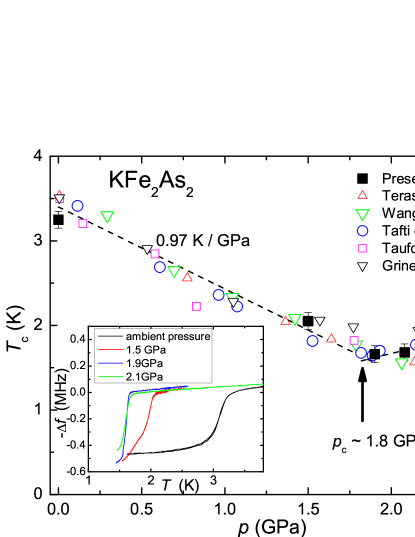
The superconducting transition temperature of the KFe2As2 powder was determined by measuring the dependence of the NMR coil tank circuit resonance frequency, , under zero magnetic field. The frequency is a measure of the ac-susceptibility since and . The onset of the Meissner effect therefore results in a sharp change of as shown in the inset of Fig. 1. At ambient pressure, we find K, as expected. The pressure dependence of is shown in Fig. 1 together with the data reported previously Tafti2013 ; Taufour2014 ; Terashima2014 ; Wang2016 ; Grinenko2014 ; Budko2012 . decreases with below the critical pressure GPa with a rate of 0.97 K/GPa, while shows weak pressure dependence above .
III.2 B. NMR spectrum
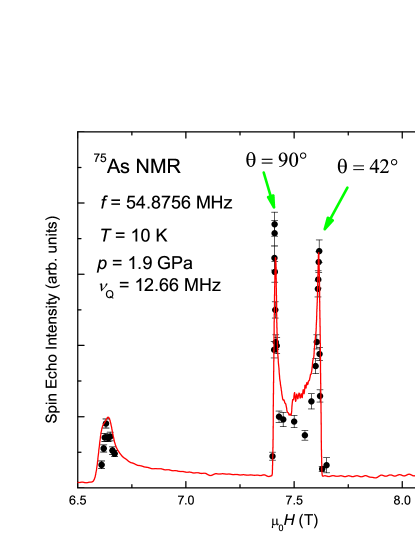
Figure 2 shows a representative field-swept NMR spectrum of the KFe2As2 powder measured at 10 K and = 1.9 GPa. The spectrum is typical for an nucleus in a powder sample with Zeeman interaction greater than quadrupole interaction. A central transition is flanked by two satellite lines split by the quadrupole interaction of the As nucleus with the local electric field gradient (EFG). In addition, the central transition line is split by the second-order quadrupole perturbation.
The situation is described by the spin Hamiltonian Slichter_book
| (3) |
appropriate for tetragonal crystals. Here is the direction of the applied field () and is the direction of the principal axis of the EFG. is the Larmor frequency and represents the NMR shift. The quadrupole frequency for an nucleus can be expressed as , is the electron charge, is the nuclear quadrupole moment, is the EFG and is Planck’s constant. According to this Hamiltonian, the NMR spectrum depends on the angle between the external field and the EFG principal axis. To first order, the quadrupole satellite resonance frequencies are given by
| (4) |
In second order perturbation theory, the central transition frequency depends on according to
| (5) |
In a powder sample, crystallites with all values of are present. Under these conditions the quadrupole satellites appear as sharp peaks at which correspond to . For a powder, sharp peaks are observed in the central transition for and , as shown by the calculated powder-pattern spectrum in Fig. 2. The calculated spectrum assumes no preferential orientation of crystal grains, which is reasonable because the solidifications of the pressure medium prevent the crystal grains from re-orienting. In a field-swept spectrum, the peak occurs at lower field, as indicated in Fig. 2. Since the EFG principal axis is along the direction in KFe2As2, the peak arises from those crystallites that experience an external field in the crystal plane. We conducted our NMR shift and measurements at this peak of the central transition.
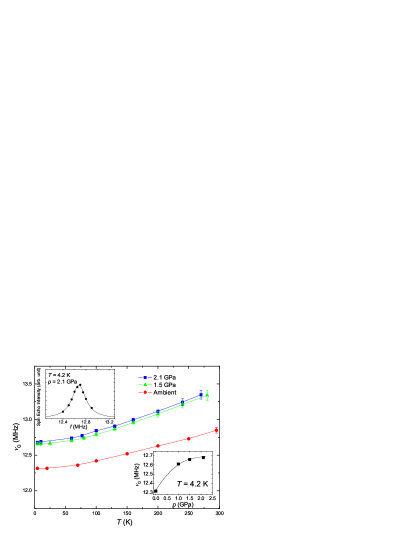
The quadrupole resonance frequency was obtained by a direct measurement of the NQR spectrum at zero magnetic field. The typical NQR spectrum is shown in the inset of Fig. 3, where the full-width-at-half-maximum (FWHM) of the NQR spectrum is kHz at K, which is consistent with the value reported previously Wang2016 and is sharper than early NQR data measured at ambient pressure Fukazawa2009 . The temperature and pressure dependence of is summarized in Fig. 3. As a function of temperature, is nearly constant below 50 K, and increases slowly above 50 K, which is not simply explained by the so-called -law originating from the thermal vibrations of the lattice Mossbaure . A similar increase of at the Fe site is observed by Mössbauer measurements Budko2017 . It is interesting to note that the value and temperature dependence of in KFe2As2 is very similar to the measured at the As(1) site near the K layer in the recently discovered superconductor CaKFe4As4, where magnetic fluctuations are involved to explain the temperature dependence Cui2017 . As a function of pressure at constant temperature, increases quickly up to 1.5 GPa, but increases slowly thereafter as in seen in the inset to Fig. 3. Similar pressure dependence of in KFe2As2 has been reported Wang2016 . No sharp anomalies are seen in , indicating no structural phase transitions in the measured pressure and temperature range.
In order to precisely determine the NMR shift with external field applied in the plane, we performed Fourier transform measurements of the peak of the NMR central transition line at a constant magnetic field. In general, the central transition frequency is given by
| (6) |
where and are Knight shifts for plane and axis, respectively. In the present case, since (Ref. Hirano2012, gives ), Eq. 6 can be simplified as
| (7) |
when . We therefore obtain by subtracting from the measured resonance frequency, .
The obtained NMR shifts are shown in Fig. 4. At ambient pressure, the NMR shift is nearly constant at low temperature and shows a broad peak near 150 K, before decreasing at high temperature. The behavior of is qualitatively similar under pressure, with the broad peak shifting to slightly higher temperature.
III.3 C. Crossover temperature
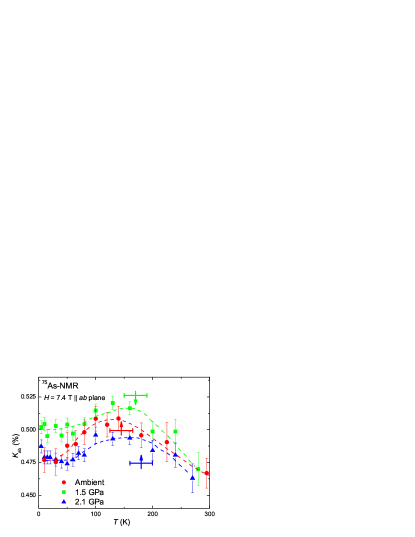
The NMR shift data in Fig. 4 are consistent with a coherence/incoherence crossover behavior in KFe2As2 at all measured pressures. The broad peak in the NMR shift has been interpreted as the crossover from the high-temperature local-moment (Curie Weiss) behavior to the low temperature coherent state Hardy2013 ; Wu2016 . We could not reliably extract the crossover temperature from the NMR shift data alone because of the weak temperature dependence of the NMR shift and also the broad quadrupole powder lineshape, although the data suggest a small increase of under pressure.
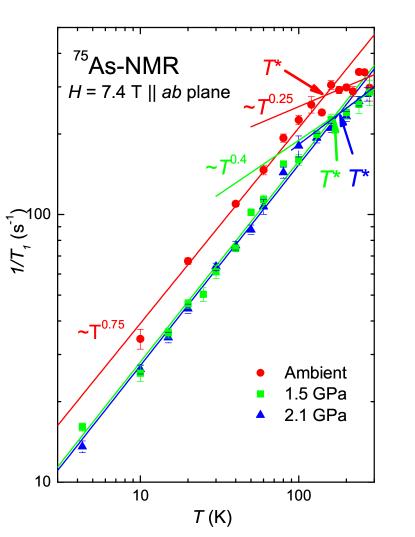
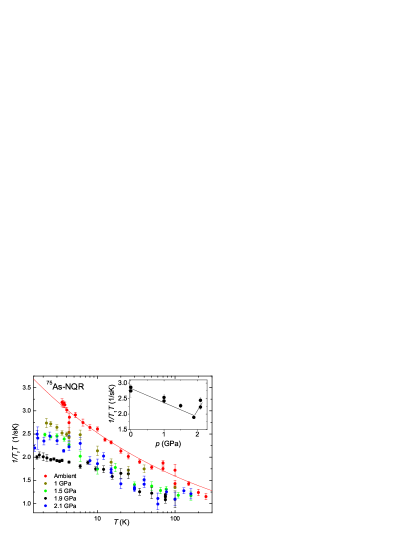
The coherence/incoherence crossover temperature in KFe2As2 can also be estimated from the nuclear spin-lattice relaxation rate data, shown in Fig. 5. Our results for at ambient pressure are quantitatively consistent with Ref. Hirano2012, . At low temperature, shows a power law behavior for all pressures, as seen in Fig. 5. An obvious reduction in the slope of is seen at high temperature, however. Similar temperature dependence of 1/ is often observed in heavy fermion systems, where 1/ shows a power law behavior of 1/ (i.e. in CeCoIn5 Kohori2001 and in URu2Si2 Kohara1986 ) at low temperatures due to coherent metallic heavy fermion states and levels off at higher temperatures due to incoherent local moment behaviors. Thus the change in slope of the temperature dependence of 1/ gives an estimate of the coherence/incoherence crossover temperature (defined as ). From the data, we find K at ambient pressure, K at 1.5 GPa and K at 2.1 GPa, indicating that increases under pressure. The uncertainty in is due primarily to uncertainty in the high- slope (see below). These values of seem to be consistent with the high-temperature end of the broad peak of (arrows in Fig. 4). The increase of under pressure is reasonable, as the application of pressure should increase the hybridization between localized and itinerant electrons, thus increasing the local magnetic coupling Pines2013 .
We also note that 1/ constant behavior above the coherent/incoherent crossover temperature is observed in CsFe2As2 Wu2016 , which has the highest effective mass of the AFe2As2 (A = K, Rb, Cs) family and therefore most localized electrons. However, as seen in Fig. 5, in KFe2As2 at ambient pressure does not level off completely above but rather increases much more slowly, following roughly . Furthermore, as increases under pressure, so does the slope of . It would be interesting if the high-temperature slope correlates with extent of the localization.
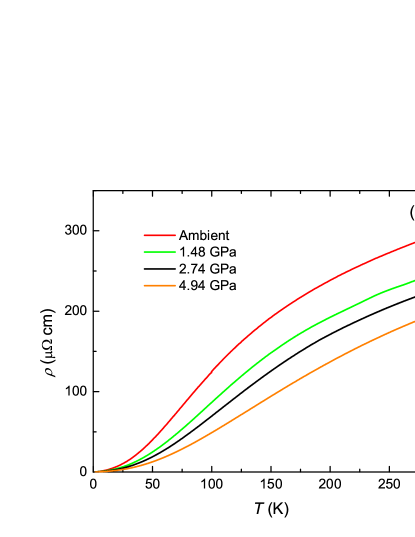
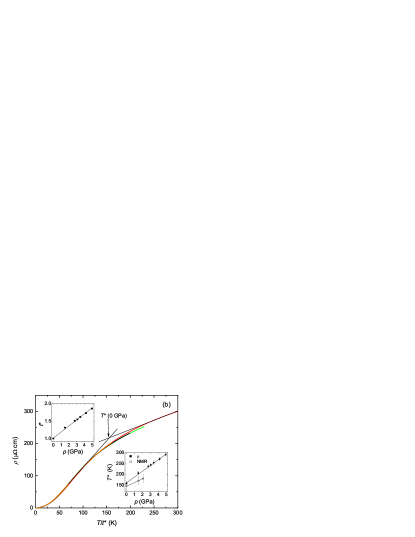
To corroborate our estimate of and expand the results to pressures higher that those attainable in our NMR pressure cell, we also present and re-analyze single-crystal resistivity data up to GPa Taufour2014 , as shown in Fig. 6(a). In heavy fermion systems, one expects a decrease of the resistivity below the coherence temperature, often showing a broad maximum at Yang2008 ; Hardy2013 . While the NMR data provide incontrovertible evidence for coherence-incoherence crossover, the resistivity contains contributions from phonon scattering which complicate the interpretation of the data. The decrease in resistivity observed in Fig. 6(a) could, in principle, be due to the small Debye temperature and not electronic coherence effects. However, in the AFe2As2 (A = K, Rb, Cs) family, a strong correlation has been observed between (as observed by NMR) and the cross point of two approximately linear trends in the resistivity Wu2016 . This method, then, appears to give a reasonable estimate of in these materials. Here we also apply this method to estimate (defined as ) in KFe2As2 using the resistivity data. We note that our resistivity curves for different pressures can be scaled by a pressure dependent scaling factor (defined dimensionless), as shown in Fig. 6(b). The pressure dependence of is shown in the upper inset. To estimate from the resistivity data, we use the cross point of two approximately linear trends as shown in Fig. 6(b) where is estimated to be K for the ambient pressure data. Then, the pressure dependence of can be obtained by using the pressure dependence of . As shown in the lower inset of Fig. 6(b), increases with increasing pressure. While the values of extracted from the resistivity data up to 2.1 GPa are slightly higher than the values identified by NMR data, both techniques show the increase of the coherent/incoherent crossover temperature with applied pressure. It is clear that evolves continuously, showing no anomaly at GPa. It is interesting to note that the resistivity data for the Rb- and Cs-samples Wu2016 can also be scaled to our ambient pressure data with ( K) and ( K) respectively.
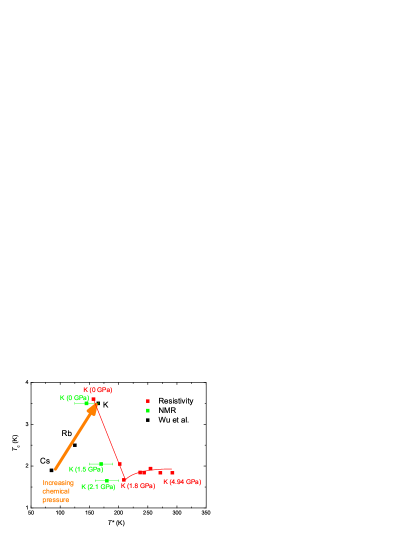
We now consider the empirical relation that is proportional to observed in the AFe2As2 (A = K, Rb, Cs) family at ambient pressure Wu2016 . Figure 7 plots our results for as a function of along with the results of Ref. Wu2016, . In the AFe2As2 (A= Cs, Rb, K) family at ambient pressure, moves in proportion to , suggesting that the change of is the primary factor in determining . In contrast, for pressurized KFe2As2 we find that decreases sharply as a function of below GPa and then becomes roughly independent of above . These results indicate that is not the primary driver of the pressure dependence of in KFe2As2. Instead, as will be described in the next section, we show the antiferromagnetic spin fluctuations play an important role for the pressure dependence of .
Finally, it is interesting to discuss the second empirical relation that under pressure. Quantum oscillation experiments under high pressure found that the effective mass decreases under pressure Terashima2014 . In addition, the coefficient in the low-temperature resistivity decreases smoothly, which is also consistent with a decreasing under pressure Taufour2014 . The decreasing accompanied by the increase of suggest that the relationship seems to hold under pressure, similar to the case of AFe2As2 (A = K, Rb, Cs). As one moves from CsFe2As2 to RbFe2As2 to KFe2As2, the chemical pressure increases due to the decreasing size of the alkali metal ion Wang2016 . Simultaneously, increases Wu2016 . Consequently, the increase of in KFe2As2 under physical pressure could be considered an extension of the chemical pressure trend. However, it is noted that the relationship does not appear to hold the case of carrier doping in Ba1-xKxFe2As2 as seen in Ref. Hardy2016, .
III.4 D. NQR Spin-Lattice Relaxation Rate
Since evolves smoothly across the critical pressure , the pressure dependence of the coherence/incoherence crossover behavior cannot explain the non-monotonic behavior of under pressure in KFe2As2. To address this question, we have also performed NQR measurements in both the PM and SC states. No external magnetic field is required to measure NQR , making this technique ideal for investigation of the SC state.
III.4.1 1. Paramagnetic State
First, we consider the NQR in the PM state at ambient pressure. As seen in Fig. 8, the NQR at ambient pressure follows a power law above : (shown by the red solid curve in Fig. 8). This power law is consistent with previously reported NQR results at ambient pressure Fukazawa2009 , and also NMR 1/ data () described in the previous section. In general, the nuclear spin-lattice relaxation rate measures the -summed dynamical susceptibility at the Larmor frequency perpendicular to the quantization axis of nuclear spin,
| (8) |
Therefore, since the NMR shift , which reflects the component of , shows a weak temperature dependence, the increase of at low temperatures reflects the enhancement of low-energy AFM spin fluctuations.
As shown in Fig. 8, the enhancements of at low temperatures seems to be suppressed up to and then starts to increase above with increasing pressure, although the pressure dependence of becomes less clear at high temperatures above K due to our experimental uncertainty. To see clearly the pressure dependence of low temperature data, we plot the values at 4.2 K as a function of pressure in the inset of Fig. 8. Here we took the values at 4.2 K because enhancements of due to the AF spin fluctuations are more significant at low temperatures and also the temperature is close to the lowest temperature above in the paramagnetic state for all pressures measured. The value of at 4.2 K clearly decreases with increasing pressure below and then increases again above . Since the value of reflects the strength of low-energy AFM spin fluctuations, we conclude that spin fluctuations at low temperatures are suppressed below and enhanced again above . This trend is very similar to the pressure dependence of . Therefore, we may conclude that AFM spin fluctuations are involved in the superconducting pairing both above and below , consistent with the high-field NMR results Wang2016 .
However, it should be noted that the values of decrease for the replacement of A from Cs to K in AFe2As2, despite the fact that increases due to the replacement Wu2016 . The relationship between and 1/ therefore appears to be different in the pressure and replacement cases. Although at present the origin of the different behavior of between the pressure and replacement cases is not understood well, we here discuss a few possibilities to explain the difference.
One possible difference between the pressure and replacement cases may relate to the anisotropy of magnetic fluctuations. According to Zhang Zhang2017 , based on their NMR data, the anisotropy of the low-temperature AFM fluctuations is found to significantly decrease with the replacement from Cs to K in AFe2As2. That is, the Cs sample with the lowest in the family has the greatest anisotropy, suggesting that may correlate with the anisotropy of the AFM fluctuations. Zhang . also suggested that the difference of the anisotropy may relate to quantum criticality and that the Cs sample is the closest to a QCP.
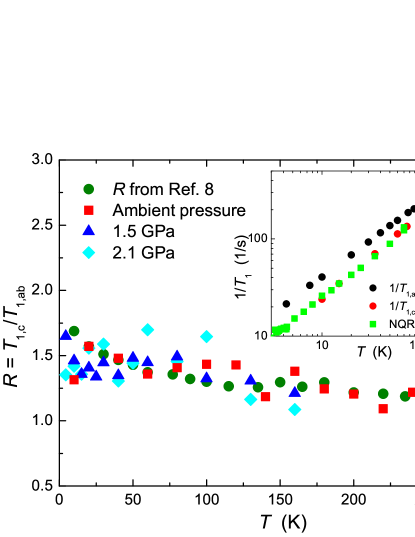
It is interesting to compare this to the behavior of the magnetic fluctuation anisotropy in KFe2As2 under pressure which can be obtained by taking a look at the ratio of 1/ for the two field directions, . According to the previous NMR studies performed on Fe pnictide SCs Kitagawa2009 ; KitagawaAFSF ; Hirano2012 , the ratio depends on the nature of magnetic fluctuations and also anisotropy of the magnetic fluctuations as
| (11) |
where is the amplitude of the spin fluctuation spectral density at NMR frequency along the direction. Unfortunately, since we used a powder sample to improve the signal intensity, only plane 1/ NMR measurements are feasible. Nevertheless, we can obtain some information about the anisotropy of the AFM spin fluctuations using our NQR 1/ data. Since the quantization axis of the electric field gradient is parallel to the axis, the NQR 1/ should reflect magnetic fluctuations perpendicular to the axis. These are the same fluctuations observed by NMR 1/ for axis, where the quantization axis is determined by the magnetic field. Indeed, we confirmed that our NQR 1/ data coincide almost perfectly with the NMR 1/ data under axis reported previously at ambient pressure Hirano2012 , as shown in the inset of Fig. 9. This also indicates no magnetic field effects on 1/. Therefore, using both the NQR 1/ and NMR 1/ data under pressure, we can estimate how the anisotropy of magnetic fluctuations changes with pressure. The estimated values using both the NQR 1/ and NMR 1/ data are shown in Fig. 9 as a function of temperature for different pressures. All values are greater than unity, consistent with the stripe-type spin fluctuations. As shown, does not show any significant change with pressure. This indicates that the anisotropy of spin fluctuations is almost independent of pressure, in contrast to the case of replacement effects on AFe2As2. We suggest that the different behaviors of the spin fluctuation anisotropy between the pressure and replacement cases may be related to the different behavior of in the two cases. It is also interesting to note that several papers have proposed that, in the proximity of a QCP, the critical fluctuations may actually be detrimental to superconductivity in these systems Eilers2016 ; Hardy2013 ; Zhang2017 . Since CsFe2As2 is considered to be the closest to the QCP, it would be expected to have a low .
It is also interesting to note in this context that in the hole-overdoped region of the Ba1-xKxFe2As2 phase diagram, the AFM spin fluctuations and Sommerfeld coefficient determined by specific heat measurements are both enhanced with increasing while decreases, similar to the case of AFe2As2 (A = K, Rb, Cs). One possible explanation for the decrease of in Ba1-xKxFe2As2 is the growth of competing ferromagnetic (FM) spin fluctuations, which coexist with the AFM spin fluctuations Wiecki2015 . As demonstrated by Wiecki ., the growth of the AFM fluctuations with increasing in Ba1-xKxFe2As2 is accompanied by the simultaneous growth of FM fluctuations. These FM fluctuations may interfere with the AFM-fluctuation-based Cooper-pairing mechanism, thus lowering despite the enhancement of AFM fluctuations. It is possible such physics could apply to the AFe2As2 (A=K, Rb, Cs) system also.
III.4.2 2. Superconducting State
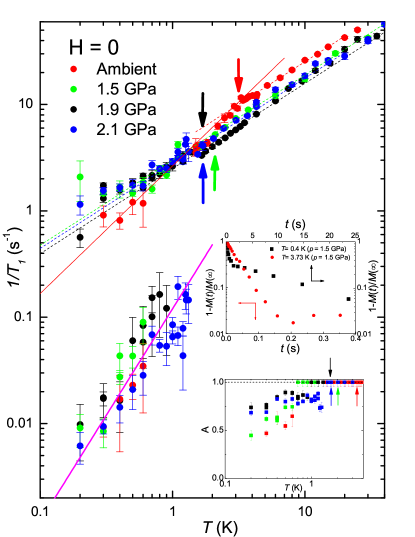
The dependence of NQR below is shown in Fig. 10. At ambient pressure, follows the power law in the PM state as discussed above (red dashed line in Fig. 10). A clear kink is seen at , and the data follow a new power law below (red solid line in Fig. 10). This behavior is consistent with previous ambient pressure NQR results Fukazawa2009 . However, in contrast to Ref. Fukazawa2009, , a long component is found to appear below K at ambient pressure and also under pressure. The upper inset of Fig. 10 shows the typical two-component exponential behavior of the nuclear magnetization recovery curve observed at low temperature ( = 0.4 K; = 1.5 GPa), together with a single exponential behavior at = 3.73 K and = 1.5 GPa. Then, we fit the recovery curves according to
| (12) |
where and are the short and long relaxation times, respectively. The parameter , representing the fraction of nuclei relaxing with the shorter relaxation time , is shown in the lower inset of Fig. 10, demonstrating that the long component fraction increases with decreasing temperature.
The existence of two components implies the existence of two distinct local electronic environments, which are physically separated in real space. Similar two-component relaxation has been observed by NQR in the closely-related sample RbFe2As2, in which the two-component behavior was argued to be associated with a charge order of nanoscale periodicity Civardi2016 . While we find no direct evidence for charge order in KFe2As2 in this study, charge ordering in KFe2As2 at 2.4 GPa (above our maximum pressure) was proposed by high pressure NMR Wang2016 . Two-component relaxation has also been reported in CsFe2As2 under magnetic field in Refs. Wu2016, (Supplemental Information), Zhao2017, and Li2016, . At present, although the origin of the two components in KFe2As2 is not clear, the similar behavior in closely related systems would suggest that the two-component behavior observed here is intrinsic. Further studies will be needed to clarify the origin.
NQR is a sensitive probe of the reduction of the density of states (DOS) at the Fermi energy due to the opening of the SC gap. In general, 1/ in the SC state is given by Walstedt
| (13) |
where is the DOS and is the Fermi distribution function. is the anomalous DOS arising from Cooper pair coherence. Due to the lack of a coherence peak just below , we neglect the coherence term, as has been done in previous NMR/NQR studies of FeAs superconductors.
The very weak decrease of the short component below (), implies a very small SC gap. Using a simple full gap model for , we estimate a gap of meV () from the short component, consistent with reported by previous NQR measurements Fukazawa2009 . For all but the lowest temperatures measured, the relaxation is dominated by the short component, as shown by the inset of Fig. 10. This implies that a large number fraction of nuclei see a nearly gapless electronic environment below . This may correspond to a large ungapped DOS below in KFe2As2 observed by scanning tunneling spectroscopy (STS) Fang2015 . The large ungapped DOS was attributed to a Van Hove singularity just below the Fermi level seen by angle resolved photoemission spectroscopy (ARPES) Fang2015 . It is also worth mentioning that a residual DOS in SC state has been reported in SrFe2As2 under high pressure KitagawaSrFe2As2 and also in Co doped BaFe2As2 by specific heat measurements Hardy2010 . It is also suggested theoretically that the residual DOS is due to a possible formation of domain walls inherent to antiferromagnetism in iron pnicitde SCs Gorkov2010 .
In contrast, the long component shows a large reduction relative to the in the PM state, implying a large reduction in due to the SC gap. Although the experimental uncertainty is large, 1/ seems to be proportional to as shown by the solid line in Fig. 10. The sizable depletion of only below K has been observed by the STS and ARPES experiments Fang2015 . The co-existence of one large gap and at least one very small gap has also been reported with specific heat Hardy2014 and small angle neutron scattering KawanoFurukawa2011 experiments. However, from the two-component relaxation behavior, our NQR data suggest a real-space modulation of the local gap structure, which has not been reported previously.
Under high pressure of 1.5 GPa and above, no obvious change of the slope of the short component occurs across within our experimental uncertainty. This indicates that the nuclei relaxing according to see a gapless local electronic environment above 1.5 GPa. Therefore the small gap seen by at ambient pressure is thought to be suppressed to zero near , and is not recovered above . Similarly, muon spin rotation (SR) measurements Shermadini2012 on the closely-related RbFe2As2 with GPa Tafti2015 reported that the smaller of two SC gaps is suppressed to zero near 1 GPa. As for the long component under high pressure, as shown in Fig. 10, no obvious change in 1/ can be found, suggesting no dramatic change in the magnitude of the larger SC gap upon pressure application. According to Ref. Taufour2014, , the SC gap structure changes above , where the SC gap is modulated along . However, we did not observe a clear change in gap symmetry across from our measurements.
IV IV. Conclusions
We have presented 75As-NMR, NQR and resistivity data which clearly show an increase of the coherence/incoherence crossover temperature in KFe2As2 under pressure. This increase of is expected due to the increase in hybridization between localized and conducting bands caused by pressure application. We find that the relation observed in ambient pressure AFe2As2 (A = K, Rb, Cs) continues to hold under pressure. However, the proportionality between and is clearly broken under pressure. The non-monotonic behavior of under pressure is therefore unrelated to the coherence-incoherence crossover behavior in the paramagnetic state. However, the strength of AFM spin fluctuations in the paramagnetic state is found to correlate with , evidencing clearly that the AFM spin fluctuations play an important role for the appearance of superconductivity in KFe2As2, although such a correlation cannot be seen in the replacement effects of A in the AFe2As2 (A= K, Rb, Cs) family. In the superconducting state, two components are observed at low temperatures, suggesting the existence of two distinct local electronic environments. The temperature dependence of the short indicates nearly gapless state below . On the other hand, the temperature dependence of the long component 1/ implies a large reduction in the density of states at the Fermi level due to the SC gap formation. These results suggest a real-space modulation of the local SC gap structure in KFe2As2 under pressure.
V V. Acknowledgments
We thank M. Tanatar for helpful discussions. The research was supported by the U.S. Department of Energy, Office of Basic Energy Sciences, Division of Materials Sciences and Engineering. Ames Laboratory is operated for the U.S. Department of Energy by Iowa State University under Contract No. DE-AC02-07CH11358. Work at Argonne National Laboratory was supported by the U.S. Department of Energy, Office of Science, Basic Energy Sciences under Contract No. DE-AC02-06CH11357.
References
- (1) P. C. Canfield and S. L. Bud’ko, Annu. Rev. Condens. Matter Phys. 1, 27 (2010).
- (2) D. C. Johnston, Adv. Phys. 59, 803 (2010).
- (3) R. M. Fernandes, A. V. Chubukov, and J. Schmalian, Nat. Phys. 10 97 (2014).
- (4) Q. Si, R. Yu, and E. Abrahams, Nat. Rev. Mats. 1, 16017 (2016). doi:10.1038/natrevmats.2016.17
- (5) P. Dai, Rev. Mod. Phys. 87 855 (2015).
- (6) F. Hardy, A. E. Böhmer, D. Aoki, P. Burger, T. Wolf, P. Schweiss, R. Heid, P. Adelmann, Y. X. Yao, G. Kotliar, J. Schmalian, and C. Meingast Phys. Rev. Lett. 111, 027002 (2013).
- (7) P. Wiecki, B. Roy, D. C. Johnston, S. L. Bud’ko, P. C. Canfield, and Y. Furukawa, Phys. Rev. Lett. 115, 137001 (2015).
- (8) M. Hirano, Y. Yamada, T. Saito, R. Nagashima, T. Konishi, T. Toriyama, Y. Ohta, H. Fukazawa, Y. Kohori, Y. Furukawa, K. Kihou, C.-H. Lee, A. Iyo, H. Eisaki, J. Phys. Soc. Jpn., 81, 054704 (2012).
- (9) P. S. Wang, P. Zhou, J. Dai, J. Zhang, X. X. Ding, H. Lin, H. H. Wen, B. Normand, R. Yu, and W. Yu, Phys. Rev. B 93, 085129 (2016).
- (10) H. Ding, P. Richard, K. Nakayama, K. Sugawara, T. Arakane, Y. Sekiba, A. Takayama, S. Souma, T. Sato, T. Takahashi, Z. Wang, X. Dai, Z. Fang, G. F. Chen, J. L. Luo, and N. L. Wang, Europhys. Lett. 83 47001 (2008).
- (11) H. Fukazawa, Y. Yamada, K. Kondo, T. Saito, Y. Kohori, K. Kuga, Y. Matsumoto, S. Nakatsuji, H. Kito, P. M. Shirage, K. Kihou, N. Takeshita, C.-H. Lee, A. Iyo, and H. Eisaki, J. Phys. Soc. Jpn. 78, 083712 (2009).
- (12) K. Hashimoto, A. Serafin, S. Tonegawa, R. Katsumata, R. Okazaki, T. Saito, H. Fukazawa, Y. Kohori, K. Kihou, C. H. Lee, A. Iyo, H. Eisaki, H. Ikeda, Y. Matsuda, A. Carrington, and T. Shibauchi, Phys. Rev. B 82, 014526 (2010).
- (13) H. Kawano-Furukawa, C. J. Bowell, J. S. White, R. W. Heslop, A. S. Cameron, E. M. Forgan, K. Kihou, C. H. Lee, A. Iyo, H. Eisaki, T. Saito, H. Fukazawa, Y. Kohori, R. Cubitt, C. D. Dewhurst, J. L. Gavilano, and M. Zolliker, Phys. Rev. B 84, 024507 (2011).
- (14) J. P. Reid, M. A. Tanatar, A. Juneau-Fecteau, R. T. Gordon, S. R. de Cotret, N. Doiron-Leyraud, T. Saito, H. Fukazawa, Y. Kohori, K. Kihou, C. H. Lee, A. Iyo, H. Eisaki, R. Prozorov, and L. Taillefer, Phys. Rev. Lett. 109, 087001 (2012).
- (15) K. Okazaki, Y. Ota, Y. Kotani, W. Malaeb, Y. Ishida, T. Shimojima, T. Kiss, S. Watanabe, C. T. Chen, K. Kihou, C. H. Lee, A. Iyo, H. Eisaki, T. Saito, H. Fukazawa, Y. Kohori, K. Hashimoto, T. Shibauchi, Y. Matsuda, H. Ikeda, H. Miyahara, R. Arita, A. Chainani, and S. Shin, Science 337, 1314 (2012).
- (16) Y. Ota, K. Okazaki, Y. Kotani, T. Shimojima, W. Malaeb, S. Watanabe, C.-T. Chen, K. Kihou, C. H. Lee, A. Iyo, H. Eisaki, T. Saito, H. Fukazawa, Y. Kohori, and S. Shin Phys. Rev. B 89, 081103(R) (2014).
- (17) F. Hardy, R. Eder, M. Jackson, D. Aoki, C. Paulsen, T. Wolf, P. Burger, A. Böhmer, P. Schweiss, P. Adelmann, R. A. Fisher, and C. Meingast, J. Phys. Soc. Jpn. 83 014711 (2014).
- (18) F. F. Tafti, A. Juneau-Fecteau, M.-E. Delage, S. R. de Cotret, J.-P. Reid, A. F. Wang, X.-G. Luo, X. H. Chen, N. Doiron-Leyraud, and L. Taillefer, Nat. Phys. 9, 349 (2013).
- (19) T. Terashima, K. Kihou, K. Sugii, N. Kikugawa, T. Matsumoto, S. Ishida, C.-H. Lee, A. Iyo, H. Eisaki, and S. Uji, Phys. Rev. B 89, 134520 (2014).
- (20) V. Taufour, N. Foroozani, M. A. Tanatar, J. Lim, U. Kaluarachchi, S. K. Kim, Y. Liu, T. A. Lograsso, V. G. Kogan, R. Prozorov, S. L. Bud’ko, J. S. Schilling, and P. C. Canfield Phys. Rev. B 89, 220509(R) (2014).
- (21) X. C. Hong, X. L. Li, B. Y. Pan, L. P. He, A. F. Wang, X. G. Luo, X. H. Chen, and S. Y. Li, Phys. Rev. B 87, 144502 (2013).
- (22) F. F. Tafti, J. P. Clancy, M. Lapointe-Major, C. Collignon, S. Faucher, J. A. Sears, A. Juneau-Fecteau, N. Doiron-Leyraud, A. F. Wang, X.-G. Luo, X. H. Chen, S. Desgreniers, Y.-J. Kim, and L. Taillefer, Phys. Rev. B 89, 134502 (2014).
- (23) Z. Zhang, A. F. Wang, X. C. Hong, J. Zhang, B. Y. Pan, J. Pan, Y. Xu, X. G. Luo, X. H. Chen, and S. Y. Li, Phys. Rev. B 91, 024502 (2015).
- (24) F. F. Tafti, A. Ouellet, A. Juneau-Fecteau, S. Faucher, M. Lapointe-Major, N. Doiron-Leyraud, A. F. Wang, X.-G. Luo, X. H. Chen, and L. Taillefer, Phys. Rev. B 91, 054511 (2015).
- (25) Y. Mizukami, Y. Kawamoto, Y. Shimoyama, S. Kurata, H. Ikeda, T. Wolf, D. A. Zocco, K. Grube, H. v. Löhneysen, Y. Matsuda, and T. Shibauchi Phys. Rev. B 94, 024508 (2016).
- (26) F. Eilers, K. Grube, D. A. Zocco, T. Wolf, M. Merz, P. Schweiss, R. Heid, R. Eder, R. Yu, J.-X. Zhu, Q. Si, T. Shibauchi, and H. v. Löhneysen, Phys. Rev. Lett. 116, 237003 (2016).
- (27) E. Civardi, M. Moroni, M. Babij, Z. Bukowski, and P. Carretta, Phys. Rev. Lett. 117, 217001 (2016).
- (28) Y. P. Wu, D. Zhao, A. F. Wang, N. Z. Wang, Z. J. Xiang, X. G. Luo, T. Wu, and X. H. Chen, Phys. Rev. Lett. 116, 147001 (2016).
- (29) D. Zhao, S. J. Li, N. Z. Wang, J. Li, D. W. Song, L. X.Zheng, L. P. Nie, X. G. Luo, T. Wu, X. H. Chen, arXiv:1705.09885 [cond-mat.supr-con].
- (30) P. Gegenwart, Q. Si, F. Steglich, Nat. Phys. 4 186 (2008).
- (31) N. J. Curro, Rep. Prog. Phys. 72 026502 (2009).
- (32) Y.-Z. You, F. Yang, S.-P. Kou, and Z.-Y. Weng, Phys. Rev. B 84, 054527 (2011).
- (33) L. P. Gor’kov and G. B. Teitel’baum, Phys. Rev. B 87, 024504 (2013).
- (34) D. Fang, X. Shi, Z. Du, P. Richard, H. Yang, X. X. Wu, P. Zhang, T. Qian, X. Ding, Z. Wang, T. K. Kim, M. Hoesch, A. Wang, X. Chen, J. Hu, H. Ding, and H.-H. Wen, Phys. Rev. B 92, 144513 (2015).
- (35) A. Georges, L. de’ Medici, and J. Mravlje, Annu. Rev. Condens. Matter Phys. 4 137 (2013).
- (36) F. Hardy, A. E. Böhmer, L. de’ Medici, M. Capone, G. Giovannetti, R. Eder, L. Wang, M. He, T. Wolf, P. Schweiss, R. Heid, A. Herbig, P. Adelmann, R. A. Fisher, and C. Meingast, Phys. Rev. B 94, 205113 (2016).
- (37) D. Pines, J. Phys. Chem. B 117, 13145 (2013).
- (38) N. Fujiwara, T. Matsumoto, K. Koyama-Nakazawa, A. Hisada and Y. Uwatoko, Rev. Sci. Instrum. 78, 073905 (2007).
- (39) N. Aso, T. Fujiwara, Y. Uwatoko, H. Miyano, H. Yoshizawa, J. Phys. Soc. Jpn. 76 Suppl. A, pp. 228-229 (2007).
- (40) H. Fukazawa, N. Yamatoji, Y. Kohori, C. Terakura, N. Takeshita, Y. Tokura and H. Takagi, Rev. Sci. Instrum. 78, 015106 (2007).
- (41) A. P. Reyes, E. T. Ahrens, R. H. Heffner, P. C. Hammel, and J. D. Thompson, Rev. Sci. Instrum. 63, 3120 (1992).
- (42) E. Colombier and D. Braithwaite, Rev. Sci. Instrum. 78, 093903 (2007).
- (43) V. Grinenko, W. Schottenhamel, A. U. B. Wolter, D. V. Efremov, S.-L. Drechsler, S. Aswartham, M. Kumar, S. Wurmehl, M. Roslova, I. V. Morozov, B. Holzapfel, B. Büchner, E. Ahrens, S. I. Troyanov, S. Köhler, E. Gati, S. Knöner, N. H. Hoang, M. Lang, F. Ricci, and G. Profeta, Phys. Rev. B 90, 094511 (2014).
- (44) S. L. Bud’ko, Y. Liu, T. A. Lograsso, and P. C. Canfield Phys. Rev. B 86, 224514 (2012).
- (45) C. P. Slichter, Principles of Magnetic Resonance, 3rd ed. (Springer, New York, 1990).
- (46) K. Nishiyama, F. Dimmling, Th. Kornrumpf, and D. Riegel, Phys. Rev. Lett. 37 357 (1976).
- (47) S. L. Bud’ko, T. Kong , W. R. Meier, X. Ma and P. C. Canfield, Philosophical Magazine, 97, 2689, (2017).
- (48) J. Cui, Q.-P. Ding, W. R. Meier, A. E. Böhmer, T. Kong, V. Borisov, Y. Lee, S. L. Bud’ko, R. Valentí, P. C. Canfield, and Y. Furukawa, Phys. Rev. B 96, 104512 (2017).
- (49) Y. Kohori, Y. Yamato, Y. Iwamoto, T. Kohara, E. D. Bauer, M. B. Maple, and J. L. Sarrao, Phys. Rev. B 64, 134526 (2001).
- (50) T. Kohara, Y. Kohori, K. Asayama, Y. Kitaoka, M.B. Maple, and M. S. Torikachvili, Solid State Commun. 59, 603 (1986).
- (51) Y.-F. Yang, Z. Fisk, H.-O. Lee, J.D. Thompson, and D. Pines, Nature (London) 454, 611 (2008).
- (52) Z. T. Zhang, D. Dmytriieva, S. Molatta, J. Wosnitza, S. Khim, S. Gass, A.U.B. Wolter, S. Wurmehl, H.-J. Grafe, H. Kühne, arXiv:1703.00780.
- (53) K. Kitagawa, N. Katayama, K. Ohgushi, and M. Takigawa, J. Phys. Soc. Jpn. 78, 063706 (2009).
- (54) S. Kitagawa, Y. Nakai, T. Iye, K. Ishida, Y. Kamihara, M. Hirano, and H. Hosono, Phys. Rev. B 81, 212502 (2010).
- (55) J. Li, D. Zhao, Y. P. Wu, S. J. Li, D. W. Song, L. X. Zheng, N. Z. Wang, X. G. Luo, Z. Sun, T. Wu, X. H. Chen, arXiv:1611.04694.
- (56) R. E. Walstedt, The NMR Probe of High- Materials, STMP 228 (Springer, Berlin Heidelberg 2008).
- (57) K. Kitagawa, N. Katayama, H. Gotou, T. Yagi, K. Ohgushi, T. Matsumoto, Y. Uwatoko, and M. Takigawa, Phys. Rev. Lett. 103, 257002 (2009).
- (58) F. Hardy, T. Wolf, R. A. Fisher, R. Eder, P. Schweiss, P. Adelmann, H. v. Löhneysen, and C. Meingast, Phys. Rev. B 81, 060501(R) (2010).
- (59) L. P. Gor’kov and G. B. Teitel’baum, Phys. Rev. B 82, 020510(R) (2010).
- (60) Z. Shermadini, H. Luetkens, A. Maisuradze, R. Khasanov, Z. Bukowski, H.-H. Klauss, and A. Amato, Phys. Rev. B 86 174516 (2012).