Single crystal study of the charge density wave metal LuNiC2
Abstract
We report on single crystal growth, single crystal x-ray diffraction, physical properties and density functional theory (DFT) electronic structure as well as Fermi surface calculations for two ternary carbides, LuCoC2 and LuNiC2. Electrical resistivity measurements reveal for LuNiC2 a charge density wave (CDW) transition at K and, for , a significant anisotropy of the electrical resistivity, which is lowest along the orthorhombic -axis. The analysis of x-ray superstructure reflections suggest a commensurate CDW state with a Peierls-type distortion of the Ni atom periodicity along the orthorhombic -axis. DFT calculations based on the CDW modulated monoclinic structure model of LuNiC2 as compared to results of the orthorhombic parent-type reveal the formation of a partial CDW gap at the Fermi level which reduces the electronic density of states from states/eV f.u. without CDW to states/eV f.u. in the CDW state. The corresponding bare DFT Sommerfeld value of the latter, mJ/mol K2, reaches reasonable agreement with the experimental value mJ/mol K2 of LuNiC2. LuCoC2 displays a simple metallic behavior with neither CDW ordering nor superconductivity above 0.4 K. Its experimental Sommerfeld coefficient, (1) mJ/mol K2, is in realistic correspondence with the calculated, bare Sommerfeld coefficient, mJ/mol K2, of orthorhombic LuCoC2.
I Introduction
Intermetallic rare earth nickel dicarbides, NiC2 ( La, … Lu), with the non-centrosymmetric orthorhombic CeNiC2 structure-type Bodak et al. (1980); Jeitschko and Gerss (1986), exhibit a variety of exciting physical phenomena. The initial interest focused i) on their rare earth magnetism (see e.g. Refs. Kotsanidis et al. (1989); Schäfer et al. (1997); Onodera et al. (1998)) and, subsequently, ii) on LaNiC2, which exhibits superconductivity below about K Lee et al. (1996); Hirose et al. (2012) with a time reversal symmetry broken order parameter Hillier et al. (2009); Yanagisawa and Hase (2012), and iii) on the multiple charge density wave (CDW) transitions of PrNiC2, NdNiC2, …, TmNiC2 Murase et al. (2004); Shimomura et al. (2016); Roman et al. (2018) and, finally, iv) on the complex interplay of magnetic and incommensurate as well as commensurate CDW order parameters Kim et al. (2012); Prathiba et al. (2016); Kolincio et al. (2016); Lei et al. (2017); Kolincio et al. (2017) (see Ref. Babizhetskyy et al. (2017) for a review). The Peierls temperature, i.e. onset of CDW order, increases inversely proportional to the unit cell volume of NiC2 compounds Roman et al. (2018) and is, thus, largest for LuNiC2, which has not yet been studied in closer detail.
In the present work we investigate two lutetium -metal dicarbides, LuCoC2 and LuNiC2 (initially reported by Jeitschko Jeitschko and Gerss (1986)), with respect to their crystal structure, their electronic ground state properties, and in particular, with respect to the occurrence of charge density wave or superconducting transitions, by means of specific heat, magnetization, and electrical resistivity measurements as well as computational electronic structure and Fermi surface studies.
II Experimental details
Polycrystalline samples, LuCoC2 and LuNiC2, have been prepared by arc melting with subsequent annealing at 1000 ∘C for 10 days using a preparation procedure described earlier Michor et al. (2015). Commercially available elements, Lu distilled bulk pieces (Metall Rare Earth, purity of 99.9 at.% and 99.99 % Lu/), powders of electrolytic nickel and cobalt (Strem Chemicals, 99.99 at.%), and graphite powder (Aldrich, 99.98 at.%) were used.
A first attempt to grow LuCoC2 and LuNiC2 single crystals has been conducted via the Czochralski method, by which we have earlier succeeded to grow HoCoC2 Michor et al. (2017). In the present work on LuNiC2, however, Czochralski pulling resulted in rather small single crystalline domains (of the order of cubic-mm size) and just slightly larger crystalline domains in the case of LuCoC2. The latter has been used for a specific heat measurement (see below).
A large single crystal of LuNiC2 ( mm3) was finally grown from a stoichiometric polycrystalline feed rod via the floating zone technique in an optical mirror furnace (Crystal Systems Corporation, Japan) and was oriented by means of the Laue method. A cross-section of the crystal (parallel and perpendicular to the growth direction) was examined with a scanning electron microscope (SEM) using a Philips XL30 ESEM with EDAX XL-30 EDX-detector. Thereby, a relatively homogeneous distribution of small inclusions (multi-phase precipitates of typically 5 – 10 m size, essentially composed from transparent Lu-C-O crystals and metallic Lu-Ta-C as well as Ni rich Lu-Ni-C phases) inside the single crystalline matrix LuNiC2 is resolved by SEM, but remains below the resolution limit of the powder X-ray diffraction (XRD) pattern (see below). From the density of precipitates in the SEM image, we roughly estimate a volume fraction of impurity phases of the order of 0.1 % of the total crystal volume.
Powder XRD data of LuCoC2 and LuNiC2 were collected on a Siemens D5000 powder diffractometer with graphite monochromated Cu-Kα radiation (20, step size 0.02∘). While powder XRD revealed the presence of some impurity phases in the polycrystalline material of LuCoC2 and LuNiC2, Bragg intensities due to impurity phases have neither been resolved in powder XRD for the Czochralski grown crystalline material of LuCoC2 and LuNiC2, nor for pieces of the zone refined LuNiC2 crystal.
Crystals for XRD were isolated via mechanical fragmentation of the annealed LuNiC2 and LuCoC2 samples. Single crystal X-ray intensity data were collected at K and 298 K on a four-circle Bruker APEX II diffractometer (CCD detector, -geometry, Mo Kα-radiation, Å). Multi-scan absorption correction was applied using the program SADABS; frame data were reduced to intensity values applying the SAINT-Plus package Bruker (2014). The structures were solved by direct methods and refined with the SHELXS-97 and SHELXL-97 programs Sheldrick (1997a, b), respectively.
Zero-field specific heat data of single-crystalline samples of about 60 mg of LuCoC2 and 100 mg of LuNiC2 were collected in the temperature range 400 mK to 15 K using a PPMS 3He heat capacity insert.
Four probe resistivity measurements were carried out on bar shaped samples with contacts made by spot welding thin gold wires ( m) on the sample surface. For better mechanical stability, the spot welded contacts were coated with silver epoxy. LuNiC2 single crystalline bar shaped samples were cut along the principle crystallographic orientations with typical dimensions mm3 and measured in a PPMS resistivity set-up (2 – 400 K) as well as in a home-made furnace set up (300 – 610 K) with the identical set of samples. High temperature resistivity measurements of polycrystalline samples LuCoC2 and LuNiC2 were performed in an ULVAC ZEM-3 measuring system (300 K – 650 K). Temperature and field dependent magnetic measurements were carried out on a CRYOGENIC SQUID magnetometer in a temperature range from 2 K to room temperature applying static magnetic fields up to 7 T.
III Computational methods
Density functional theory (DFT) calculations based on the CeNiC2-type orthorhombic structure models of LuCoC2 as well as LuNiC2 were performed within the projector augmented wave methodology Blöchl (1994) implemented in the Vienna ab initio simulation package (VASP) Kresse and Furthmüller (1996); Kresse and Joubert (1999). The generalized gradient approximation, as parametrized by Perdew, Burke, and Ernzerhof Perdew et al. (1996), was applied for the exchange potential. For the valence state configurations of the pseudo-potentials we included the dps2 states for Lu (the f-electrons were kept frozen in the core), the pds1 states for Co, the pds1 states for Ni, and the s2p2 states for the C-atoms. The remaining electrons were kept frozen.
The atom positions were relaxed with fixed experimental lattice constants (see Table 1). During the relaxation, the total energy was minimized until the energy convergence became better than eV. To obtain the equilibrium positions of the ions, residual forces were optimized until they under-matched eV/Å. The Brillouin zone integration for the relaxation, was done on a grid of -points on a Monkhorst and Pack Monkhorst and Pack (1976) mesh using the method of Methfessel-Paxton Methfessel and Paxton (1989) of the order one with a smearing parameter , which results in well-converged total energies and optimized ionic positions. We note that complementary DFT calculations with a full relaxation of the CeNiC2-type structure model (i.e. including the volume and lattice constants) closely reproduced all the below results obtained with a fixed cell shape.
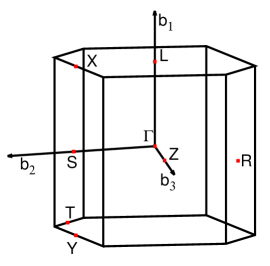
The electronic band structure (BS) was calculated using fully relaxed ionic positions with fixed cell shape and volume taking into account spin orbit coupling (SOC) for the valence electrons as described in Steiner et al. (2016). For the evaluation of the electronic density of states (EDOS) a dense -point mesh has been implemented. The -point integration was done using the tetrahedron method with Blöchl corrections Blöchl (1994). The Brillouin zone integration for the BS was done using again the method of Methfessel-Paxton Methfessel and Paxton (1989). The electronic BS is plotted along high-symmetry -points in the irreducible Brillouin zone (IRBZ) as depicted in Fig. 1. These special -points in reciprocal space are: , , , , , , and , these -points are either a center of a face in IRBZ, a corner of IRBZ or a midpoint of a line-edge. We note that switching the space group setting from to , e.g. used in Refs. Hase and Yanagisawa (2009); Hirose et al. (2012), leads to a commutation of axis to and, thus, to correspondent changes of the labeling of special -points in the IRBZ.
The Fermi surface is interpolated using maximally localized Wannier functions as implemented in the WANNIER90 code Mostofi et al. (2008). We have ascertained that the interpolated Wannier bands match well with the VASP bands in the region of interest, thus, being suited to obtain reasonable Fermi surfaces.
For LuNiC2, additional DFT calculations of the EDOS were performed for the CDW modulated structure model presented in section IV.1 (see Table 2) with a slightly adapted procedure: a variation of the volume and the cell shape was included in the relaxation procedure to overcome convergence problems, though the relative changes of the lattice constants during their relaxation did not exceed 3 % and the relative deviation from the experimental volume remained within . Relaxed atom coordinates are reasonably close to the experimental ones, e.g. yielding alternating Ni–Ni distances along the monoclinic -axis of 3.247 Å and 3.665 Å as compared to the experimentally refined values of 3.208(2) Å and 3.682(2) Å (see below). The optimization of residual forces was conducted with the same criteria, eV/Å, as given above. For the Brillouin zone integration steps during relaxation, a grid of -points on a Monkhorst and Pack Monkhorst and Pack (1976) mesh has been employed using the same method as for the CeNiC2-type structure model.
The electronic DOS of the CDW modulated structure was calculated using the fully relaxed structure including SOC on a -point mesh of with the tetrahedron method with Blöchl corrections Blöchl (1994) and . The -point mesh used for the CDW-superstructure is lower than the mesh used for CeNiC2-type structure, because of its two times larger volume in real and, hence, correspondingly smaller Brillouin zone volume in the reciprocal space. Fermi surface calculations were performed with the same methods as for the parent-type structure model.
IV Results
IV.1 Crystal Structure Determination from Single Crystal XRD Data
Single crystal XRD data for LuNiC2 and LuCoC2 indicate a high degree of order (mosaicities ). In contrast to LuCoC2, LuNiC2 features distinct superstructure reflections. Disregarding these reflections, the diffraction patterns of both, LuNiC2 and LuCoC2, evidence orthorhombic symmetry with similar cell parameters. Systematic absences were consistent with the space groups, , , , , and , out of which the non-centrosymmetric proved to be correct during structure solution and refinement, as proposed earlier in Ref. Jeitschko and Gerss (1986). Lu and transition metal atom positions were deduced from direct methods with SHELXS-97 and refined in a straightforward manner using SHELXS-97; carbon sites were easily located in the difference Fourier map. The refinements with free site occupation factors revealed some indication that the cobalt position in LuCoC2 is occupied by about 98.4(6)%, whereas no deviations from full occupancies have been detected for Lu and Ni atom positions. The final positional and atom displacement parameters obtained from single crystals are listed in Table 1. A significant anisotropy of the atom displacement parameter with a substantially increased () is observed only for Ni in LuNiC2 which manifests some trace of CDW order in the refinement based on the orthorhombic CeNiC2-type structure model.
| LuCoC2 | LuNiC2 | |
| (Å) | 3.4226(2) | 3.4506(2) |
| (Å) | 4.4895(3) | 4.4787(2) |
| (Å) | 5.9916(4) | 5.9857(3) |
| Lu in | ||
| occupation factor | 1.00 | 1.00 |
| 0.0079(1) | 0.0070(1) | |
| 0.0080(1) | 0.0108(1) | |
| 0.0085(1) | 0.0084(1) | |
| in | ||
| occupation factor | 0.984 (6) | 1.00 |
| 0.0098(4) | 0.0217(5) | |
| 0.0060(3) | 0.0060(3) | |
| 0.0070(4) | 0.0068(4) | |
| C in | ||
| occupation factor | 1.00 | 1.00 |
| 0.0088(6) | 0.0097(7) | |
| Theta range (deg) | ||
| Crystal size (m) | ||
| Reliability factorsc | ||
| GOF | 1.043 | 1.166 |
| Extinction | 0.0149(9) | 0.0144(10) |
| (Zachariasen) | ||
| Residual density: | 0.801; -0.742 | 0.847; -1.362 |
| max; min (e-/Å3) | ||
| a Co or Ni; | ||
| b ; | ||
| c | ||
| LuNiC2 | |
| (Å) | 7.4662(9) |
| (Å) | 6.8897(9) |
| (Å) | 3.7326(5) |
| (∘) | 106.324(3) |
| Lu1 in | |
| Lu2 in | |
| Ni in | |
| C1 in | |
| C2 in | |
| Theta range (deg) | |
| Crystal size (m) | |
| Reliability factors | |
| () | |
| GOF | 1.096 |
| Extinction | 0.0107(12) |
| (Zachariasen) | |
| Residual density: | 3.097; |
| max; min (e-/Å3) |
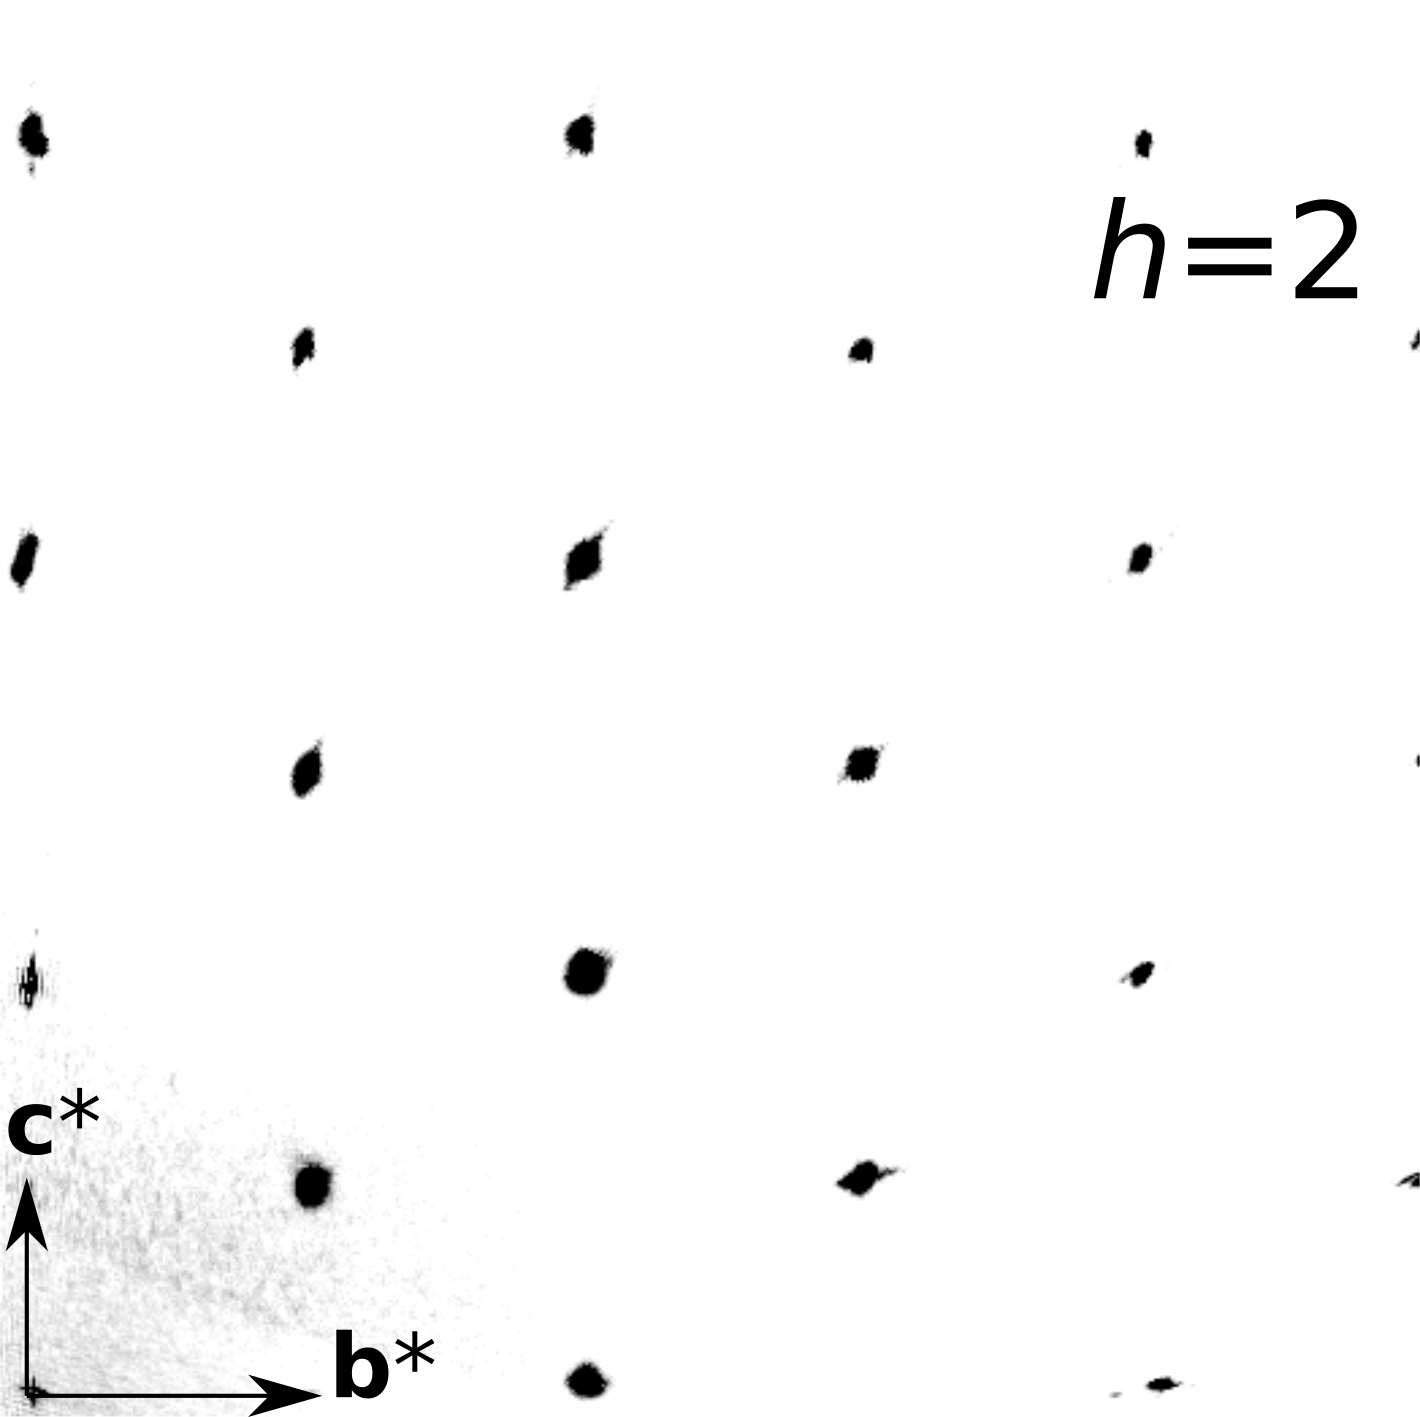
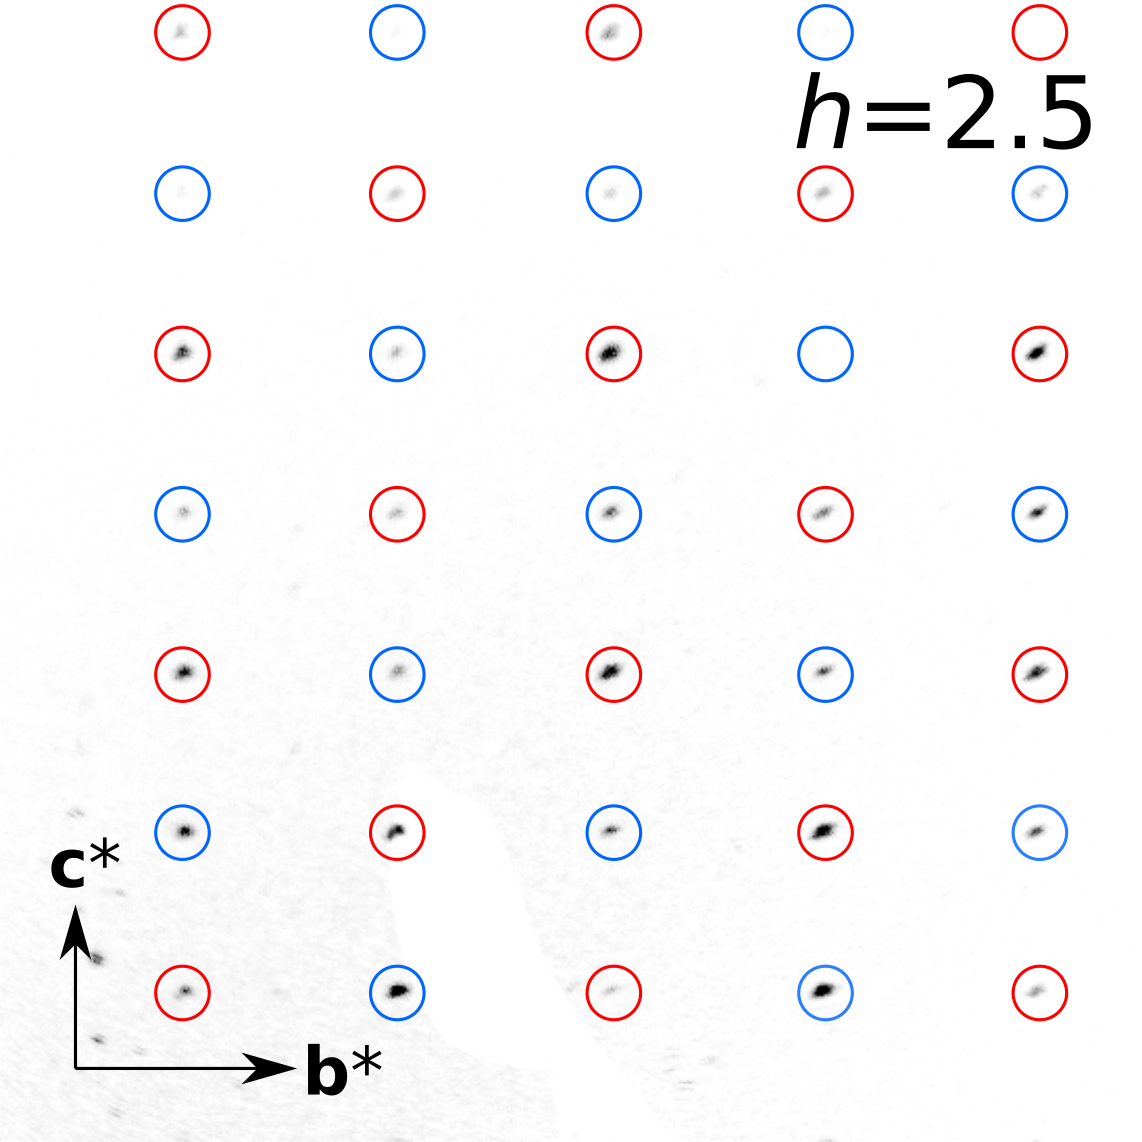
To structurally characterize the CDW order, the superstructure reflections of a LuNiC2 data set collected at 100 K and up to high diffraction angles () were analyzed. Indexed in the reciprocal basis of the parent structure, these superstructure reflections are located at , , , (Fig. 2). They can be attributed to two monoclinic C-centered () domains, with the standard centered basis with respect to the parent structure. The monoclinic direction of the domains corresponds to the -axis of the orthorhombic parent structure. Assuming a symmetry reduction of the group/subgroup kind, only the and space groups are possible. is ruled out owing to strong violations of the corresponding systematic absences. Indeed, only in the space group reasonable refinements were obtained.
The lost orthorhombic symmetry is retained as twin law (twin operations , with respect to the orthorhombic basis). Whereas the main reflections of both domains overlap, the superstructure reflections form two disjoint sets (twinning by reticular pseudo-merohedry, Fig. 2). A model of the CDW superstructure was constructed by symmetry reduction from the model and refined against “HKLF5” data with information on reflection overlap. Crystal and refinement data as well as final coordinates are listed in Table 2.
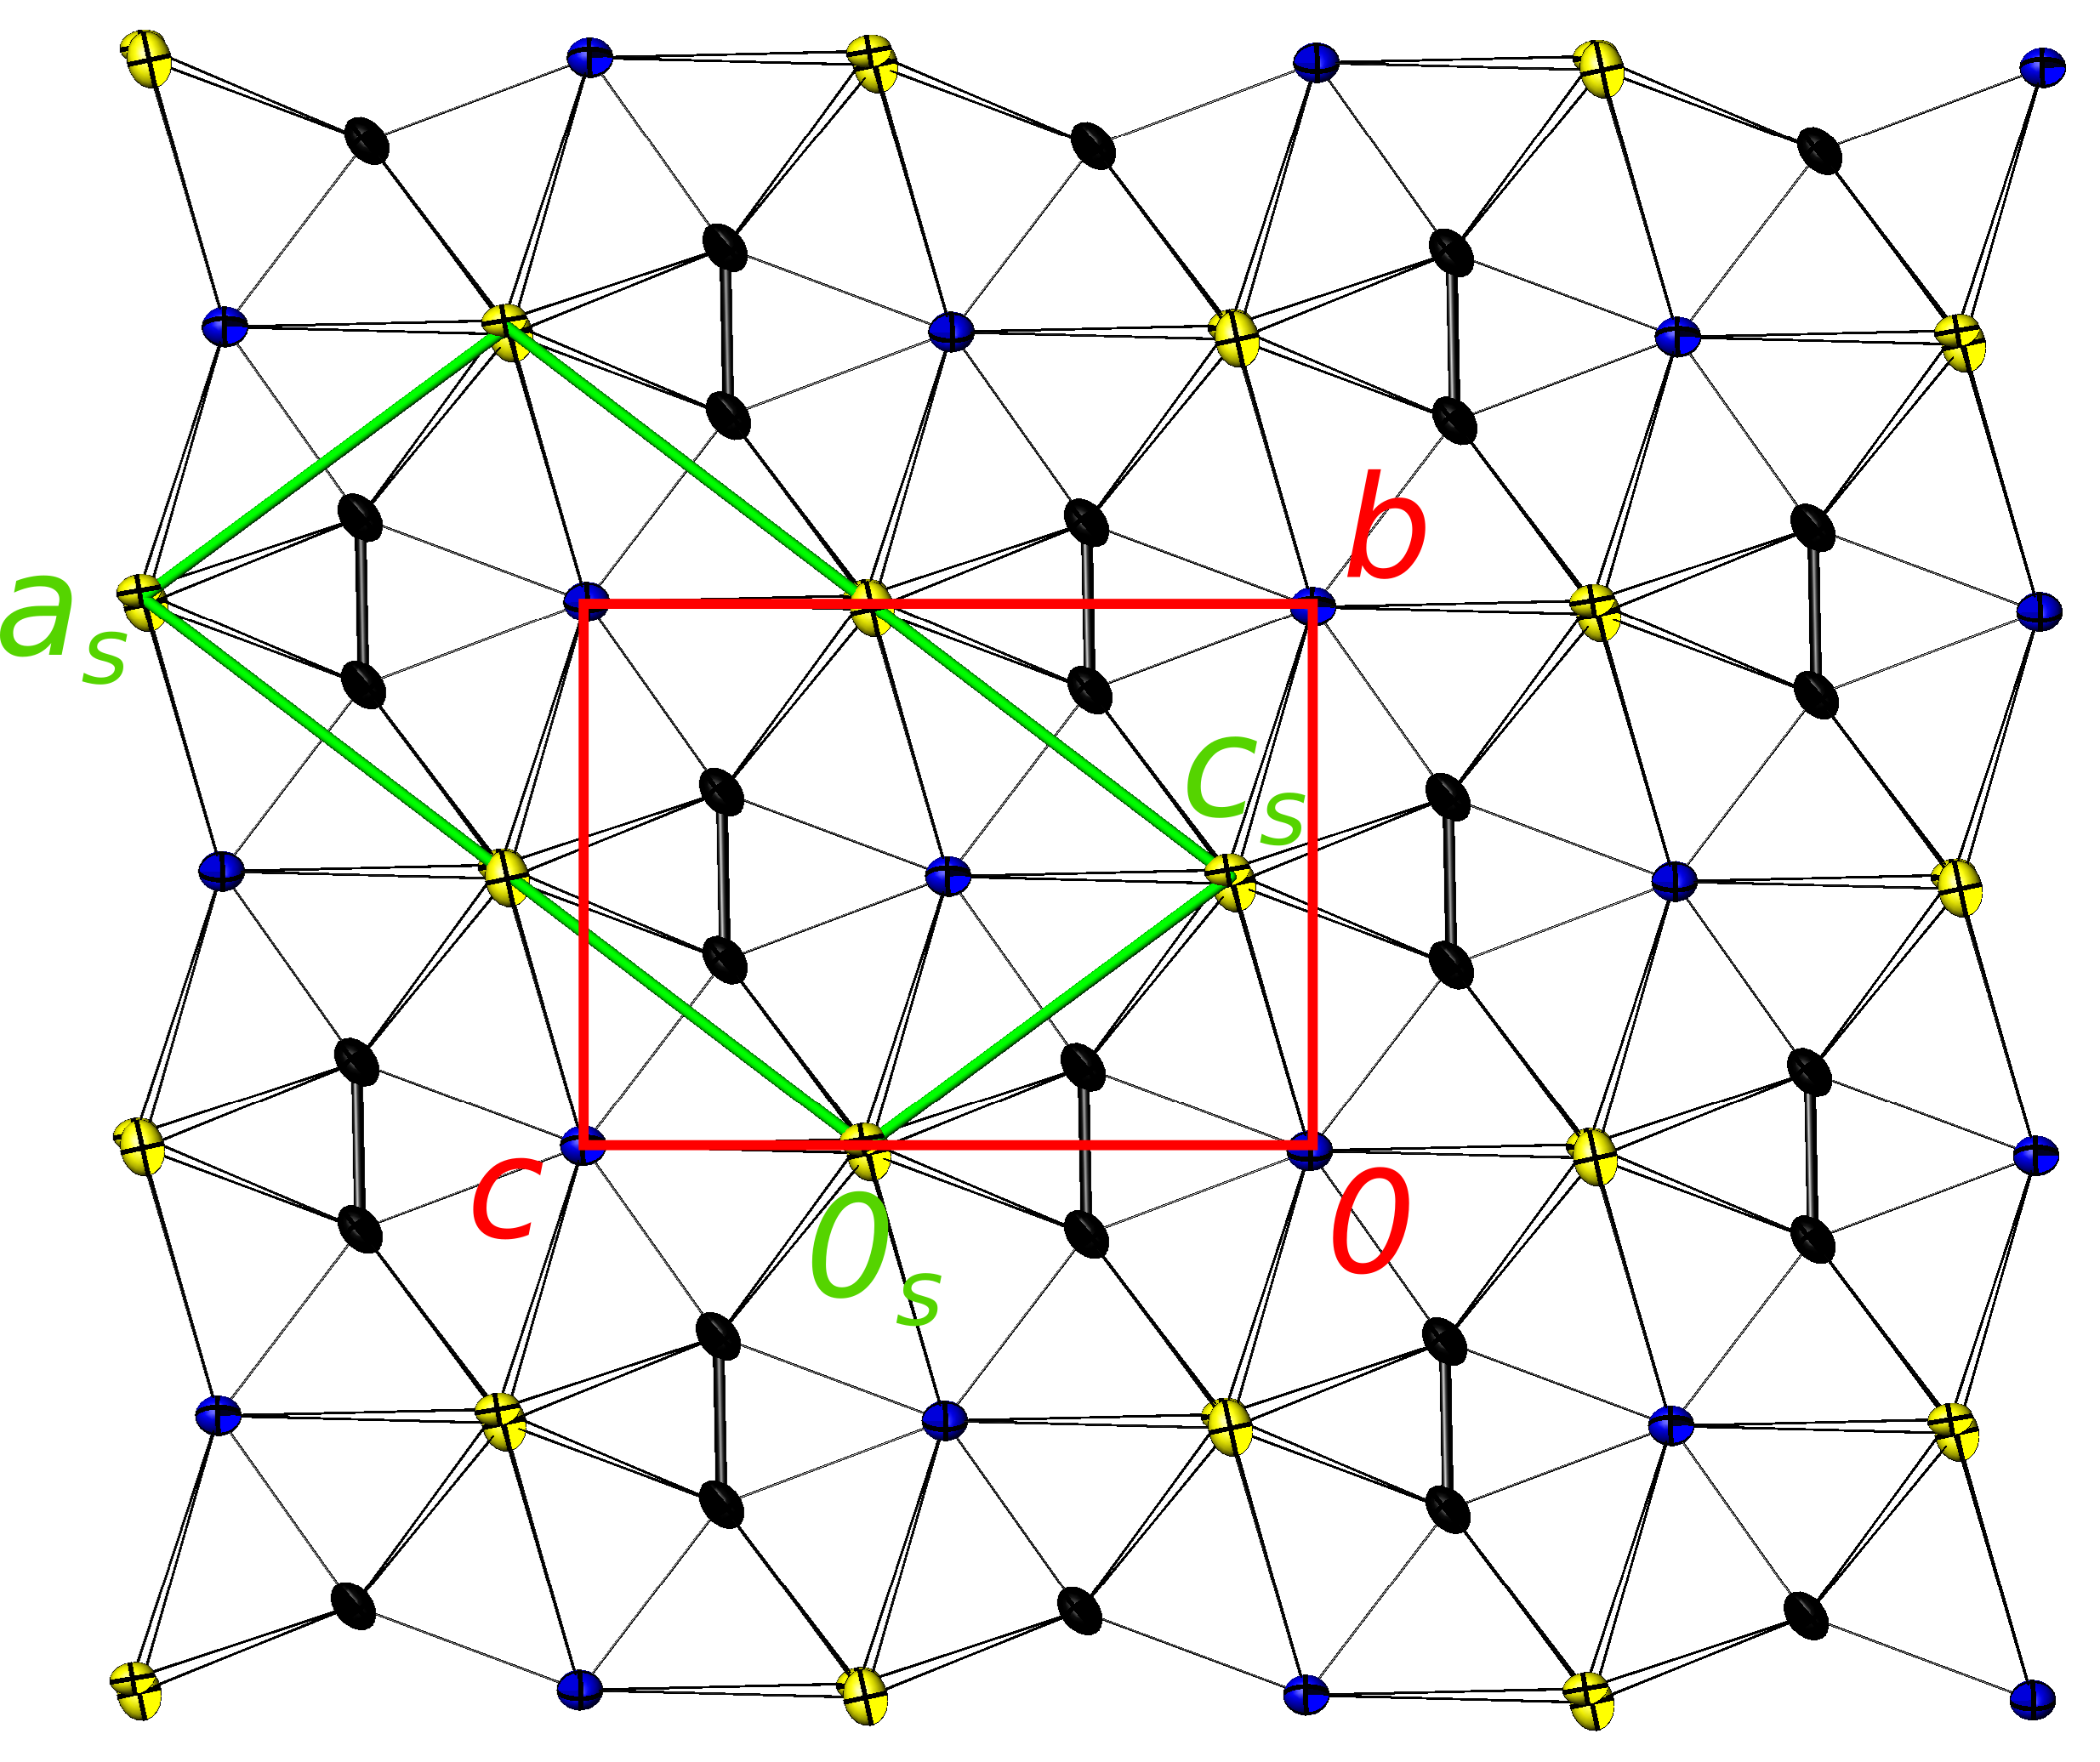
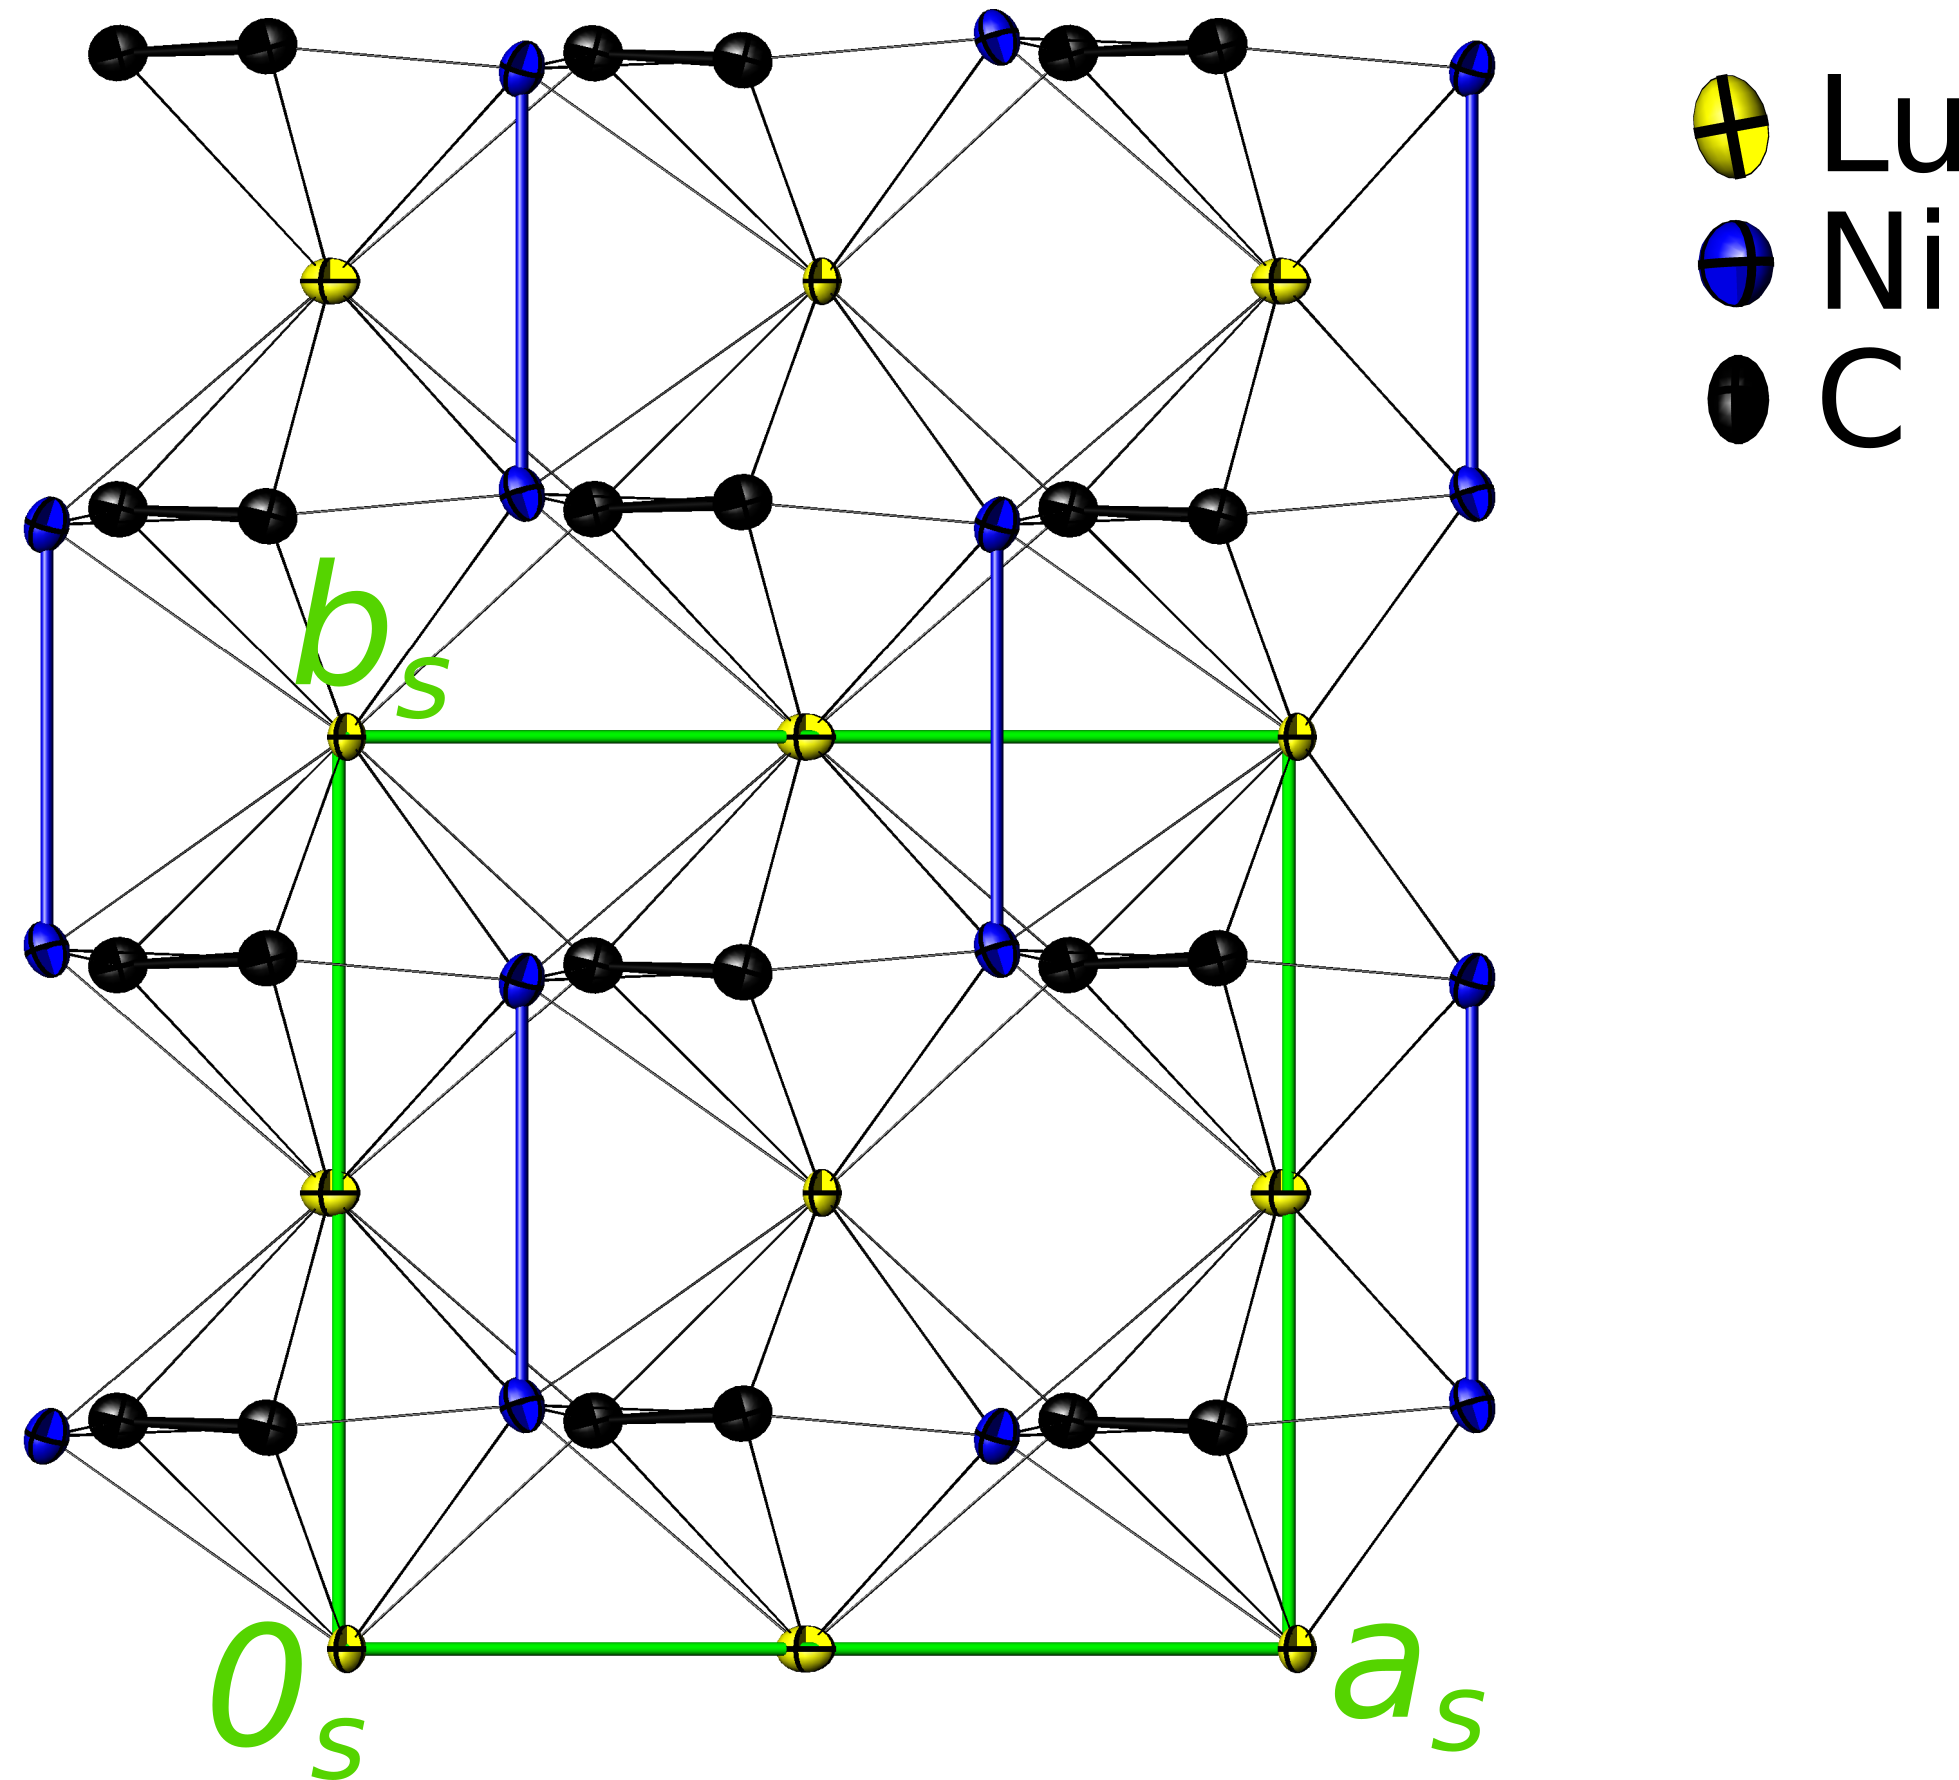
The symmetry reduction from the parent- to the superstructure is of index four and can be decomposed into two steps, of the translationengleiche (reduction of point symmetry) and the klassengleiche (reduction of translation symmetry) type, respectively. The Lu position in the CeNiC2-type parent structure with site symmetry is split in two positions with site symmetry. The C position () is split in two general positions. The site symmetry of the Ni atom is reduced from to , without being split. Consistent with the refinement of the parent structure (see above, Table 1), the largest deviation from the symmetry is observed for the Ni atoms. They are displaced distinctly along the monoclinic -axis (being parallel to the orthorhombic -axis of the parent structure), thus, forming pairs of Ni atoms related by the mirror reflection with a shortened Ni-Ni distance of 3.208(2) Å as compared to Å. The large and highly anisotropic displacement parameters of Ni in the averaged structure model become smaller and more isotropic in the superstructure, i.e. comparing the anisotropic displacement matrix after main axis transformation, /Å2 change from (0.0217,0.0068,0.0060) to (0.0077,0.0057,0.0042), respectively. The equidistant periodicity of the Ni atoms in the orthorhombic parent structure is, thus, replaced by alternating shortened and elongated Ni-Ni distances (3.208 vs. 3.682 Å) which resemble a Peierls-type distortion, also referred to as a Peierls dimerization. The corresponding model of the CDW modulation of LuNiC2 is depicted in Fig. 3 as views along the monoclinic -axis in the upper and along the monoclinic -axis in the lower panel. The latter emphasizes the Peierls-type distortion of the Ni atom periodicity along the -axis, via fat blue solid lines highlighting the pairwise shortened Ni-Ni distances of 3.208(2) Å. The CDW modulation of the orthorhombic parent structure corresponds to a modulation wave vector in the IRBZ as displayed in Fig. 1.
IV.2 Specific heat, magnetic susceptibility and electrical resistivity of LuCoC2 and LuNiC2
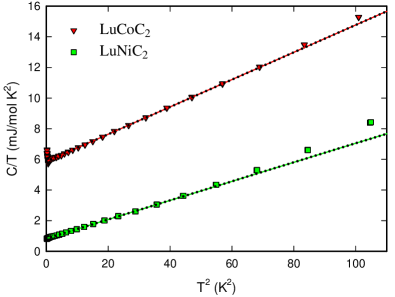
The specific heat data displayed in Fig. 4 reveal for both, LuCoC2 and LuNiC2, a metallic behavior, i.e. at low temperatures, where represents the Sommerfeld coefficients of the -linear electronic specific heat contribution, is the number of atoms in the formula unit (i.e. for LuCoC2 and LuNiC2), and is the Debye temperature, characterizing the low temperature lattice heat capacity. LuCoC2 displays a distinct up-turn in at lowest temperatures (400 – 600 mK), which is similar to the one observed for elemental lutetium Lounasmaa (1964). Such low temperature up-turn in remains, at least for K, absent for LuNiC2. The corresponding linear fits of the data (see the dotted lines in Fig. 4) are applied to temperature intervals, K2 for LuCoC2 and K2 for LuNiC2, thus, yielding the Sommerfeld coefficients, (1) mJ/mol K2 and 0.83(5) mJ/mol K2 as well as Debye temperatures, (8) K and 500 (10) K, respectively. While phonon specific heat contributions of LuCoC2 and LuNiC2 are closely matching each other in an extended temperature interval (not shown), electronic contributions of LuCoC2 and LuNiC2 and, thus, their electronic density of states at the Fermi level, , are strikingly different. For both, LuCoC2 and LuNiC2, an anomaly, which could be indicative of bulk superconductivity, remains absent.
Field dependent magnetization and temperature dependent magnetic susceptibility measurements (not shown) reveal even for single crystalline LuNiC2, prepared by the floating zone technique, traces of a ferromagnetic impurity phase with K (f.u.) and of a superconducting impurity phase with K. The isothermal magnetization, measured at 2 K, is characteristic of a hard type-II superconductor with mT and T. The diamagnetic Meissner volume fraction is only about and, thus, attributed to a superconducting impurity phase precipitated in the zone refined crystal (compare SEM results in section II). The intrinsic magnetic susceptibility of LuNiC2 is diamagnetic with cm3/mol at room temperature, which is roughly two third of the expected core-diamagnetic susceptibility cm3/mol (see Ref. Selwood (1956)). Both, the ferromagnetic and the superconducting impurity phases, are obviously well dispersed in the single crystalline matrix in form of small inclusions (see above).
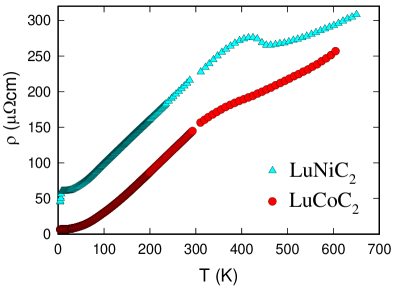
Temperature dependent electrical resistivity measurements on polycrystalline samples displayed in Fig. 5 reveal a simple metallic behavior of LuCoC2 with a reasonably low residual resistivity, cm, whereas for LuNiC2 the residual resistivity, cm, is largely enhanced and two distinct anomalies are observed at 7 K and near 450 K. The latter resembles the resistive CDW anomalies of other NiC2 compounds (with Pr – Tb), initially reported by Murase et al. Murase et al. (2004), and is well in line with the trend of CDW transition temperatures, , discussed in Ref. Roman et al. (2018) where K is suggested from preliminary results of LuNiC2 which are in close agreement with the present data. The resistive drop observed at 7 K does not relate to any traceable, correspondent anomaly in the heat capacity, but does relate to a spurious diamagnetic signal of the magnetic susceptibility (see above) and is, thus, attributed to a small superconducting impurity fraction which is well below the percolation limit.
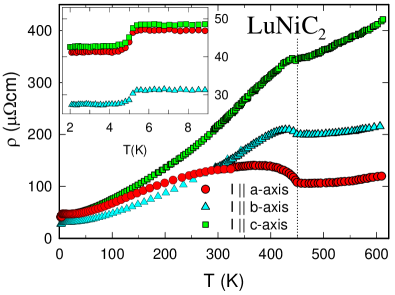
The anisotropy of the electrical resistivity of single crystalline LuNiC2, displayed in Fig. 6, is obtained from measurements with current applied along principal crystallographic orientations. The dotted vertical line in Fig. 6 marks the onset of CDW order at (5) K. At temperatures exceeding the CDW transition, i.e. , LuNiC2 exhibits a similar anisotropy of the resistivity, , as e.g. reported earlier for SmNiC2, GdNiC2, and TbNiC2 Shimomura et al. (2016). At lower temperatures (), however, LuNiC2 behaves distinctly different than magnetic NiC2 single crystals investigated by Shimomura et al. Shimomura et al. (2016): (i) the CDW anomaly below is most pronounced for , while those of hitherto investigated magnetic NiC2 is most prominent for and (ii) LuNiC2 displays an almost isotropic electrical resistivity at K (), whereas has been reported for magnetic NiC2. Finally (iii), low temperature resistive anomalies of the latter relate to the onset of rare earth magnetism and the resulting modifications (suppression) of CDW order. LuNiC2 displays a resistive anomaly near 5 K which is suppressed by an externally applied magnetic field (not shown). The critical field for suppressing the roughly isotropic resistivity drop by a few cm is (independent of orientation) about 1 T at 2 K and decreases as a function of temperature as typical for a superconducting phase (see the above discussion of magnetization data).
IV.3 Electronic structure studies of LuCoC2 and LuNiC2
IV.3.1 Results based on the CeNiC2-type orthorhombic structure model
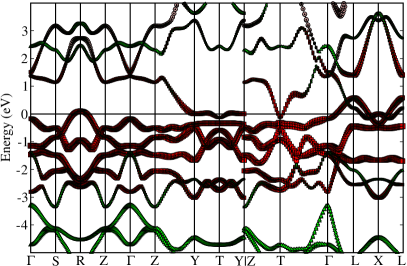
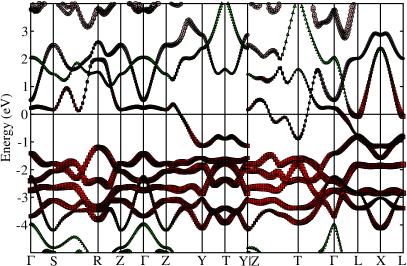
Figure 7 displays the calculated electronic band structure of LuCoC2 and LuNiC2 for high-symmetry directions in the first Brillouin zone (compare Fig. 1). The dispersions are shown as a fat-band plot, which is a band structure equivalent to a projected EDOS plot. Thereby, symbols (brown circles for Lu site projected states, green triangles for C states, and red squares for the -metal Co- and Ni-states) refer to the dominant atomic origin of the crystal orbitals and the widths of all bands are proportional to the relative contributions of a given set of atomic orbitals to the crystal orbitals. The upper panel of Fig. 7 reveals for LuCoC2 that two Co bands are crossing the Fermi energy. There is only some dispersion of these bands at and , else these bands are flat. Above the Fermi level, bands origin from mixed contributions from Co, C and Lu and exhibit, in part, strong dispersion.
For LuNiC2 (lower panel of Fig. 7) a shift of the Fermi level by about 1 eV is observed (with respect to LuCoC2), which almost resembles the expected filling of electronic states in terms of a rigid band picture. In the case of LuNiC2, essentially one band with a mixed Lu-Ni-C character crosses the Fermi energy while the almost filled dominated bands cross the Fermi level only near the point located at the IRBZ boundary (compare Fig. 1) and originate a small electron pocket of the Fermi surface around this place (see below for further discussions of the Fermi surface).
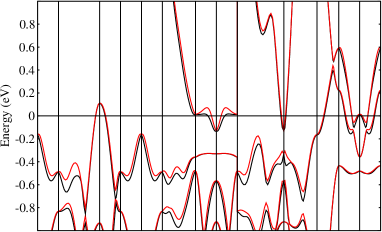
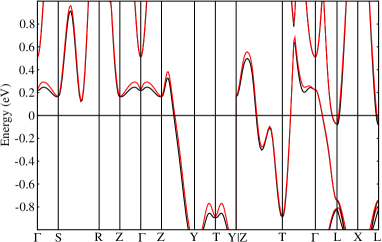
In order to uncover the band splitting due to the asymmetric SOC caused by the lack of inversion symmetry of the crystal structure, Fig. 8 displays a closer view of the band structure in the vicinity of the Fermi level, where red and black lines refer to the two spin channels of SOC in the absence of inversion symmetry of the crystal structure. The largest splittings are observed for dominated bands and, with respect to band crossing the Fermi level, spin-orbit splitting is most pronounced for LuCoC2 while for LuNiC2, smaller band splittings due to SOC are observed.
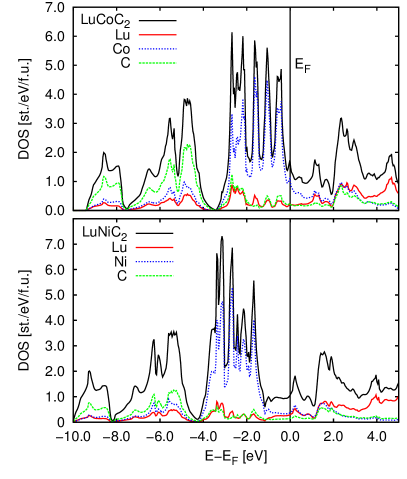
Figure 9 presents the calculated EDOS of LuCoC2 and LuNiC2 in the upper and lower panel, respectively. Both EDOS plots have very similar features, except for the position of the Fermi energy, which relates to the different electron count of Co as compared to Ni. The EDOS at the Fermi energy, , of LuCoC2 and LuNiC2 are states/eV f.u. and states/eV f.u., respectively. The corresponding site projected EDOS contributions at the Fermi level are dominated by about 80% by Co contributions of LuCoC2, whereas for LuNiC2, there are almost equal contributions to from Ni and Lu and still relevant ones from carbon projected states.
The Fermi surface of LuNiC2, depicted in Fig. 10, consists of two sheets which are each moderately split by SOC into sheets related to the two spin channel of SOC. One is a pair of large quasi-planar sheets, which are connected by two neckings at the IRBZ boundary along the direction and the second is a small electron pocket centered at the -point of the IRBZ (compare Fig. 1).
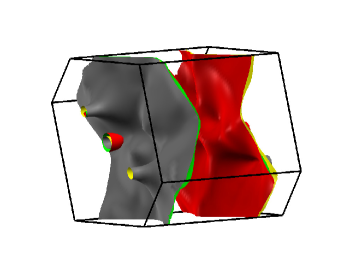
The larger Fermi surface sheet approximates to that of a quasi-one-dimensional electronic band and, with evolving modifications within the series LaNiC2 to LuNiC2, seems typical for NiC2 compounds. Calculations for early rare earth members, LaNiC2 and SmNiC2, by Laverock et al. Laverock et al. (2009) suggested a similar pair of large sheets oriented perpendicular to the direction which, however, display an additional necking at the position of the electron pocket of LuNiC2. On the contrary to LuNiC2, LaNiC2 is reported in Ref. Laverock et al. (2009) to display a significant electron pocket centered at the -point, which becomes small for SmNiC2 and is absent in the present calculation of LuNiC2 and also in the Fermi surface calculation of YNiC2 reported by Hase and Yanagisawa Hase and Yanagisawa (2009). The latter results are in rather close match with the present ones of LuNiC2 presented in Fig. 10.
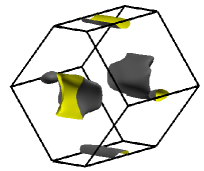
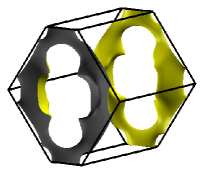
Calculations of LuCoC2 reveal the two Fermi surface sheets depicted in Fig. 11, where that of band 17 in the right panel corresponds to the large quasi-planar Fermi surface sheets of LuNiC2, however, at a much lower band-filling state resulting from the lower -electron count of Co as compared to Ni. For the sake of clarity and focus on the essential features of the Fermi surface, the spin splitting due the asymmetric SOC is neglected in Fig. 11.
IV.3.2 Comparison of LuNiC2 results based on structure models with and without CDW modulation
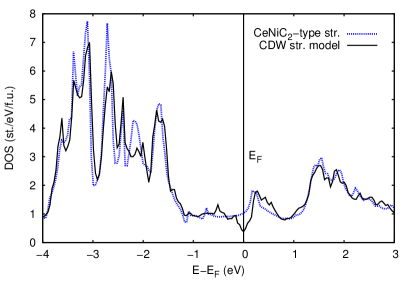
Figure 12 presents a direct comparison of the EDOS calculated for two structure models of LuNiC2, the CeNiC2-type parent structure and the CDW modulated structure, which reveals the formation of a partial CDW gap right at the Fermi energy. The value of the EDOS at the Fermi energy, states/eV f.u., of the CDW modulated structure is, thus, significantly reduced as compared to states/eV f.u. obtained for the orthorhombic parent structure of LuNiC2.
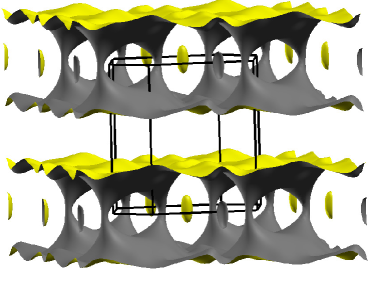
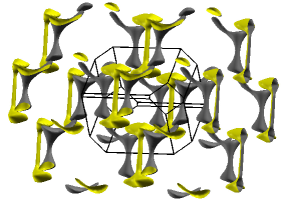
The formation of a partial CDW gap is caused by the new Brillouin zone boundaries related to the CDW structure modulation which doubles the real space periodicity along the orthorhombic -axis. The Brillouin zone boundaries of the CDW superstructure intersect with the pair of large Fermi surface sheets of parent-type structure of LuNiC2 which forms an extended two-dimensional structure oriented perpendicular to the direction in the orthorhombic periodic zone scheme displayed in the upper panel of Fig. 13. These quasi-planar (extended) Fermi surface sheets in the reciprocal space, manifest a quasi-one-dimensional electronic feature in real space. Our results of Fermi surface calculations of the CDW modulated structure displayed in a periodic zone scheme in the lower panel of Fig. 13 reveal a complete fragmentation of the extended Fermi surface of the orthorhombic parent structure into several isolated electron and hole pockets as the obvious consequence of introducing additional CDW super-zone boundaries in the context of a CDW gap formation.
V Discussion
The comparison of the electronic Sommerfeld coefficient obtained from the experimental specific heat data of LuNiC2, (5) mJ/mol K2 (see section IV.2), with the bare Sommerfeld values, mJ/molK2 for the CDW modulated structure and mJ/molK2 for the parent structure without CDW, reveals reasonably close agreement for the CDW model, but a rather large discrepancy for the DFT result of the orthorhombic parent structure of LuNiC2. The latter is expect to be adopted at temperatures above K, at which electrical resistivity data indicate the partial CDW gap to vanish. On the other hand, there is a realistic agreement between the experimental Sommerfeld value of LuCoC2, (1) mJ/mol K2, and its corresponding calculated, bare electronic Sommerfeld value, mJ/molK2 of the CeNiC2-type orthorhombic structure model of LuCoC2. The approximate enhancement of the experimental value by a factor of 1.5 as compared to the calculated one relates to a weak to moderate electron-phonon effective mass enhancement, , where is the so called electron-phonon mass enhancement factor.
The quasi-one-dimensional metallic nature of LuNiC2 at , which is indicated by the Fermi surface topology displayed in the upper panel of Fig. 13, is well corroborated by the significant anisotropy of the electrical resistivity at high temperatures, which, indeed, is lowest along the orthorhombic -axis, i.e. perpendicular to the orientation of the quasi-planar Fermi surface sheets. Within the CDW ordered state, i.e. below K, the partial CDW gap formation fragments these extended Fermi surface sheets into isolated Fermi surface pockets (compare Fig. 13) and, thus, conforms with the experimentally observed, more isotropic low temperature electrical resistivity as compared to the high-temperature state without CDW order.
Some distinct differences between the observations from single crystal resistivity studies of LuNiC2 in section IV.2 and correspondent results obtained for several magnetic NiC2 compounds investigated by Shimomura et al. Shimomura et al. (2016) may relate to changes of the CDW modulations within the series of NiC2 compounds (compare Ref. Roman et al. (2018)).
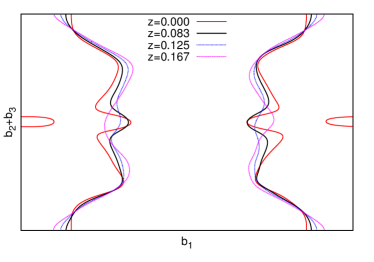
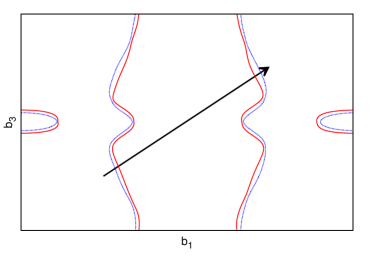
In order to discuss features of the Fermi surface of LuNiC2 depicted in Fig. 10 in closer detail, we present in Fig. 14 slices of the Fermi surface as contour plots, where in the upper panel, for the sake of clarity, SOC is neglected. The -values therein refer to a parallel shift of these slices in units of the reciprocal lattice periodicity. Slices with identical orientation and position (except for ) as those shown in the upper panel of Fig. 14, have earlier been presented by Laverock et al. Laverock et al. (2009) for LaNiC2 and SmNiC2 (the basis vector setting with in Ref. Laverock et al. (2009) corresponds to in the present work, while ). A direct comparison of the Fermi surface contours of LaNiC2 and SmNiC2 in Ref. Laverock et al. (2009) with those of LuNiC2 in Fig 14 shows that the latter is getting closer to the idealized Fermi-surface of a half-filled quasi-one-dimensional band with two (ideally planar) parallel sheets. Overall, the Fermi surface of the CDW metal SmNiC2 ( K Murase et al. (2004)) reported by Laverock et al. Laverock et al. (2009) appears significantly more corrugated and slightly more deviant from half-filling than that of LuNiC2.
An important aspect is revealed from the slice of IRBZ which exactly hosts the experimentally observed wave vector of CDW ordering, namely the slice span by reciprocal lattice vectors and displayed in the lower panel of Fig. 14. The commensurate wave vector is shown as black arrow and appears to roughly conform with a Fermi surface nesting vector which connects two quasi-parallel parts of the Fermi surface contour, however, with a significant length mismatch of about 10 %. Moreover, various other nesting features of similar or even higher significance can be found for -vectors which are clearly different from the structure modulation . From the present results of Fermi surface calculations of LuNiC2 in its orthorhombic parent-type structure we can not confirm an obvious and dominant Fermi surface nesting at wave vector . In the case of SmNiC2, Laverock et al. Laverock et al. (2009) has indicated an even better match of the experimental structure modulation wave vector with a more extended Fermi surface nesting feature although the CDW ordering temperature is only one third as compared to LuNiC2.
The absence of a clear correlation between the CDW ordering temperature and the degree of a Fermi surface nesting, which matches the structure modulation wave vector, in the series of NiC2 compounds seems in line with recent theoretical proposals by Johannes and Mazin Johannes and Mazin (2008) and by Gor’kov Gor’kov (2012) suggesting, that in real systems studied so far, CDW-formation is driven by -dependent electron-phonon coupling rather than by a simple electronic Fermi surface nesting mechanism. Deeper experimental and theoretical investigations of LuNiC2, e.g. as compared to YNiC2, may be suited to clarify the key factors which govern CDW ordering temperature in this system.
VI Summary and Conclusions
LuCoC2 and LuNiC2 have been prepared in single crystalline form. X-ray single crystal diffraction confirmed LuCoC2 to crystallize in the non-centrosymmetric orthorhombic space group and, apart from weak extra reflections related to twinned superstructure modulations, also the room temperature single crystal XRD data of LuNiC2 are rather well accounted for by this CeNiC2-type structure model, however, with a significantly enhanced anisotropic displacement parameter of the Ni-site. From the analyis of LuNiC2 crystal data taken at 100 K we derived a model of a monoclinic superstructure (space group ) which suggests a commensurate CDW modulation of the orthorhombic parent structure. The largest deviation from symmetry of the CeNiC2-type structure model is observed for the Ni atoms which are displaced along the orthorhombic -axis in form of a Peierls-type distortion the Ni atom periodicity with pairwise shortened Ni—Ni distances of 3.208(2) Å alternating with pairwise elongated distances of 3.682(2) Å.
Electrical resistivity and specific heat measurements of LuCoC2 indicate a simple metallic behavior with neither CDW ordering nor superconductivity above 0.4 K. Analogous electrical resistivity studies of poly- as well as single crystalline samples of LuNiC2, however, reveal a metallic state with a CDW transition at K and a significant anisotropy of the electrical resistivity for . The high-temperature resistivity is lowest along the orthorhombic -axis and highest along the -axis. CDW ordering causes a reduction of anisotropy of the electrical resistivity at lower temperatures.
The low temperature specific heat results reveal significantly different electronic Sommerfeld coefficients, (1) mJ/mol K2 for LuCoC2 and mJ/mol K2 for LuNiC2, while DFT calculations of the state before CDW ordering suggests much closer values of the electronic density of states at the Fermi level, states/eV f.u. for LuCoC2 and states/eV f.u. for LuNiC2. The large reduction of the experimental Sommerfeld coefficient of LuNiC2 as compared to the calculated, bare band structure value, mJ/mol K2, suggests that the Fermi surface of LuNiC2 is strongly modified by CDW gap formation. DFT calculations based on the monoclinic CDW superstructure model, indeed, indicate the formation of a pronounced minimum right at the Fermi level and the corresponding DFT result of the Sommerfeld coefficient of the CDW modulated state, mJ/mol K2, reaches close agreement with the experimental value.
The fact that LuNiC2 displays the highest CDW ordering temperature among isostructural NiC2 compounds, even though a coincidence of the wave vector of the CDW modulation, , with a predominant Fermi surface nesting vector remains weak, suggests a relevance of other mechanisms such as CDW formation due to strongly -dependent electron-phonon coupling proposed in Refs. Johannes and Mazin (2008); Gor’kov (2012).
Acknowledgements
Metallographic support by S. Stojanovic is gratefully acknowledged. We thank M. Abd-Elmeguid for fruitful discussions. The computational results have been achieved in part by using the Vienna Scientific Cluster (VSC) within the project number , support of the VSC staff is gratefully acknowledged.
References
- Bodak et al. (1980) I. O. Bodak, E. P. Marusin, and V. A. Bruskov, Sov. Phys. Crystallogr. 25, 355 (1980).
- Jeitschko and Gerss (1986) W. Jeitschko and M. Gerss, J. Less Common Metals 116, 147 (1986).
- Kotsanidis et al. (1989) P. Kotsanidis, J. Yakinthos, and E. Gamari-Seale, J. Less Common Met. 152, 287 (1989).
- Schäfer et al. (1997) W. Schäfer, W. Kockelmann, G. Will, J. K. Yakinthos, and P. A. Kotsanidis, Journal of Alloys and Compounds 250, 565 (1997).
- Onodera et al. (1998) H. Onodera, Y. Koshikawa, K. Masashi, M. Ohashi, H. Yamauchi, and Y. Yamaguchi, J. Magn. Magn. Mater. 182, 161 (1998).
- Lee et al. (1996) W. H. Lee, H. K. Zeng, Y. D. Yao, and Y. Y. Chen, Physica C: Superconductivity 266, 138 (1996).
- Hirose et al. (2012) Y. Hirose, T. Kishino, J. Sakaguchi, Y. Miura, F. Honda, T. Takeuchi, E. Yamamoto, Y. Haga, H. Harima, R. Settai, and Y. Onuki, J. Phys. Soc. Jpn. 81, 113703 (2012).
- Hillier et al. (2009) A. D. Hillier, J. Quintanilla, and R. Cywinski, Phys. Rev. Lett. 102, 117007 (2009).
- Yanagisawa and Hase (2012) T. Yanagisawa and I. Hase, Journal of the Physical Society of Japan 81, SB039 (2012).
- Murase et al. (2004) M. Murase, A. Tobo, H. Onodera, Y. Hirano, T. Hosaka, S. Shimomura, and N. Wakabayashi, J. Phys. Soc. Japan 73, 2790 (2004).
- Shimomura et al. (2016) S. Shimomura, C. Hayashi, N. Hanasaki, K. Ohnuma, Y. Kobayashi, H. Nakao, M. Mizumaki, and H. Onodera, Phys. Rev. B 93, 165108 (2016).
- Roman et al. (2018) M. Roman, J. Strychalska-Nowak, T. Klimczuk, and K. K. Kolincio, Phys. Rev. B 97, 041103 (2018).
- Kim et al. (2012) J. H. Kim, J.-S. Rhyee, and Y. S. Kwon, Phys. Rev. B 86, 235101 (2012).
- Prathiba et al. (2016) G. Prathiba, I. Kim, S. Shin, J. Strychalska, T. Klimczuk, and T. Park, Scientific Reports 6, 26530 (2016).
- Kolincio et al. (2016) K. K. Kolincio, K. Górnicka, M. J. Winiarski, J. Strychalska-Nowak, and T. Klimczuk, Phys. Rev. B 94, 195149 (2016).
- Lei et al. (2017) H. Lei, K. Wang, and C. Petrovic, J. Phys.: Condensed Matter 29, 075602 (2017).
- Kolincio et al. (2017) K. K. Kolincio, M. Roman, M. J. Winiarski, J. Strychalska-Nowak, and T. Klimczuk, Phys. Rev. B 95, 235156 (2017).
- Babizhetskyy et al. (2017) V. Babizhetskyy, B. Kotur, V. Levytskyy, and H. Michor, in Handbook on the Physics and Chemistry of Rare Rarths, Vol. 52, Eds. J.C. Bünzli and V.K. Pecharsky, (Elsevier, 2017) Chap. 298 - Alloy Systems and Compounds Containing Rare Earth Metals and Carbon, pp. 1–263.
- Michor et al. (2015) H. Michor, V. Levytskyy, F. Schwarzböck, V. Babizhetskyy, and B. Kotur, J. Magn. Magn. Mater. 374, 553 (2015).
- Michor et al. (2017) H. Michor, S. Steiner, A. Schumer, M. Hembara, V. Levytskyy, V. Babizhetskyy, and B. Kotur, J. Magn. Magn. Mater. 441, 69 (2017).
- Bruker (2014) Bruker, APEXII, RLATT, SAINT, SADABS and TWINABS, Tech. Rep. (Bruker AXS Inc., Madison, Wisconsin, USA, 2014).
- Sheldrick (1997a) G. Sheldrick, SHELXS-97, Program for the solution of crystal structures, Tech. Rep. (University of Göttingen, Germany, 1997).
- Sheldrick (1997b) G. Sheldrick, SHELXL-97, Program for the solution of crystal structures, Tech. Rep. (University of Göttingen, Germany, 1997).
- Blöchl (1994) P. E. Blöchl, Phys. Rev. B 50, 17953 (1994).
- Kresse and Furthmüller (1996) G. Kresse and J. Furthmüller, Phys. Rev. B 54, 11169 (1996).
- Kresse and Joubert (1999) G. Kresse and D. Joubert, Phys. Rev. B 59, 1758 (1999).
- Perdew et al. (1996) J. P. Perdew, K. Burke, and M. Ernzerhof, Phys. Rev. Lett. 77, 3865 (1996).
- Monkhorst and Pack (1976) H. J. Monkhorst and J. D. Pack, Phys. Rev. B 13, 5188 (1976).
- Methfessel and Paxton (1989) M. Methfessel and A. T. Paxton, Phys. Rev. B 40, 3616 (1989).
- Steiner et al. (2016) S. Steiner, S. Khmelevskyi, M. Marsmann, and G. Kresse, Phys. Rev. B 93, 224425 (2016).
- Hase and Yanagisawa (2009) I. Hase and T. Yanagisawa, Journal of the Physical Society of Japan 78, 084724 (2009).
- Mostofi et al. (2008) A. A. Mostofi, J. R. Yates, Y.-S. Lee, I. Souza, D. Vanderbilt, and N. Marzari, Computer Physics Communications 178, 685 (2008).
- Parthé et al. (1993) E. Parthé, L. Gelato, B. Chabot, M. Penzo, K. Cenzual, and R. Gladyshevskii (Springer, Berlin, Heidelberg, 1993).
- Lounasmaa (1964) O. V. Lounasmaa, Phys. Rev. 133, A219 (1964).
- Selwood (1956) P. W. Selwood, in Magnetochemistry (Interscience, New York, 1956) p. 78.
- Laverock et al. (2009) J. Laverock, T. D. Haynes, C. Utfeld, and S. B. Dugdale, Phys. Rev. B 80, 125111 (2009).
- Johannes and Mazin (2008) M. D. Johannes and I. I. Mazin, Phys. Rev. B 77, 165135 (2008).
- Gor’kov (2012) L. P. Gor’kov, Phys. Rev. B 85, 165142 (2012).