IGR J192941816: a new Be-X ray binary revealed through infrared spectroscopy
Abstract
The aim of this work is to characterize the counterpart to the INTEGRAL High Mass X-ray Binary candidate IGR J19294+1816 so as to establish its true nature. We obtained band spectra of the selected counterpart acquired with the NICS instrument mounted on the Telescopio Nazionale Galileo (TNG) 3.5-m telescope which represents the first infrared spectrum ever taken of this source. We complement the spectral analysis with infrared photometry from UKIDSS, 2MASS, WISE and NEOWISE databases. We classify the mass donor as a Be star. Subsequently, we compute its distance by properly taking into account the contamination produced by the circumstellar envelope. The findings indicate that IGR J19294+1816 is a transient source with a B1Ve donor at a distance of kpc, and luminosities of the order of erg s-1, displaying the typical behaviour of a Be X-ray binary.
keywords:
X-rays: binaries – stars: pulsars – stars: Be, IGR J19294+18161 Introduction
Current X-ray observatories such as the European Space Agency’s (ESA) INTErnational Gamma-Ray Astrophysics Laboratory (INTEGRAL; Winkler et al. 2003) or XMM-Newton (Watson et al. 2009) have discovered new kinds of high-energy emitters. To characterize the nature of these systems it is mandatory to carry out a multiwavelength study and establish a clear identification of the optical/infrared counterpart.
High-mass X-ray binaries (HMXBs) are X-ray sources fed by accretion of material from a donor OB star onto a compact object (a black hole or a neutron star). They are primary astrophysical laboratories where fundamental properties can be tested, such as the following: the masses of neutron stars and the equation state of the nuclear matter; the structure of the stellar wind in massive stars; or, the evolutionary paths of binary systems.(Martínez-Núñez et al., 2017). Until recently, three main kinds of HMXBs were known:
-
1.
The largest group has a Be star as a donor. These systems are called BeX systems (Reig, 2011). A Be star is a main sequence or giant star which harbours a circumstellar equatorial disk. These systems are transient (in X-rays) with a duration of some weeks and show luminosities of erg s-1. Approximately 70% of all known X-ray pulsars belong to this class.
-
2.
An increasing number of sources have a supergiant OB donor (SGXBs or SFXTs). SGXBs are persistent sources where the compact object accretes material from the powerful stellar wind, producing luminosities of the order of erg s-1. SFXTs are transient sources showing luminosities of erg s-1 during quiescence that can increase by up to four orders of magnitude in very short time scales.
-
3.
A very small group where the transfer of mass is directly from the surface of the donor star (Roche Lobe overflow). This evolutionary phase is very short and is consequently very scarce. For instance, in the Milky Way only the Cen X-3 is presently observable.
The population synthesis models that were previously available seemed to reproduce the distribution well. For example, the brevity of the supergiant phase was reflected in the small number of SGXBs detected. However, with the discovery of an increasing number of obscured sources by high energy satellites like ESA’s INTEGRAL gamma ray telescope, the population synthesis models started to change. Given the INTEGRAL’s sensitivity above 20 keV and its observing strategy, which produce very long exposure times specifically towards the galactic centre, new sources were discovered, that had been missed in the past due to the very high absorption or the very short transient nature. The majority of these newly discovered sources had supergiant donors. The persistent sources dramatically increased the number of SGXBs. As an example, we identified the XMM-Newton source 2XMM J191043.4+091629 with a distant SGXB (Rodes-Roca et al., 2013) which helps to independently trace the galactic structure. It also contains the slowest pulsar found to date (Sidoli et al., 2017). Furthermore, the transient systems revealed an entirely new class of objects, the Supergiant Fast X-ray Transients (SFXTs). Finally, we have discovered obscured BeX systems (main sequence donors) close to earth. All these discoveries can challenge the population synthesis models. Therefore, to characterize as many counterparts as possible is very important.
Often these new sources turn out to be highly absorbed. The spectral classification using the blue band would require very long exposure times on large telescopes or it is not feasible. However, they can be perfectly observed with the IR instrumentation on a 4-m class telescope. The spectral classification of hot stars can be achieved with -band spectra (Hanson et al., 1998). Together with available infrared photometry and the X-ray behaviour, the nature of the system can be established unambiguously.
IGR J192941816 was discovered by the IBIS/ISGRI imager on-board INTEGRAL during an observation of the field around GRS 1915+105 on March 27, 2009 (Turler et al., 2009). Using Swift/XRT archival observations, Rodriguez et al. (2009b) gave a refined X-ray position identified with the source named Swift J1929.81818 ( = 19h 29m 56s and +18∘ 18′ 38′′ with an uncertainty of 3.5 arcseconds at 90% confidence level). The single star falling in the XRT error circle was identified as the IR counterpart to the X-ray source, and associated with 2MASS J192955911818382. However, no optical or radio counterpart was found in any other catalogues they searched for. The XRT spectrum is well described by an absorbed power law or by a single absorbed blackbody. The timing analysis revealed the presence of a pulse around 12.43 s which was later confirmed with RXTE (Strohmayer et al., 2009). The X-ray source displays short outbursts (several thousand seconds) which suggested initially a SFXT nature (Rodriguez et al., 2009a). Bozzo et al. (2011), from INTEGRAL and Swift observations, concluded that the X-ray source showed a behaviour reminiscent of a Be X-ray binary system.
In this work, we present the first ever infrared spectrum of IGR J192941816111http://irfu.cea.fr/Sap/IGR-Sources supported by the analysis of archival IR photometry in order to ascertain the true nature of the source. In Section 2, we describe the IR observations. In Section 3, we present our results and, finally, we present our conclusions in Section 4.
2 Observations and data reduction
2.1 TNG observations
Near-IR spectroscopy was obtained during the night of September 1st, 2014, using the Near Infrared Camera and Spectrograph (NICS) mounted at the 3.5-m Telescopio Nazionale Galileo (TNG) telescope (La Palma island). Medium-resolution spectra were taken with the H grism under good seeing conditions and reasonable signal-to-noise (S/N) ratio of 100.
To remove the sky background, the target and the standard stars were observed according to a nodding ABBA sequence along the slit, using an automatic script available at the telescope. Consequently, each observation consisted of four images with the source spectrum displaced at different positions on the detector. The separation between the A and B positions was .
As the first step of the reduction process, possible cross-talking effects were removed using a Fortran program available from the TNG web pages. Second, background subtraction was made by taking (AB) and (BA) image differences, obtaining four positive aperture images. The AB and BA sequences were so close in time that sky background variation between them was negligible. This method, together with the use of the 1.0′′ slit, also minimizes any possible nebular contamination.
For each differential image, a spectrum was extracted using the apall task in the IRAF222Image Reduction and Analysis Facility is written and supported by the National Optical Astronomy Observatories which is operated by the Association of Universities for Research in Astronomy, Inc. under cooperative agreement with the National Science Foundation environment. During the extraction, we removed the residual background and traced the apertures along the dispersion. The four extracted spectra of each group were then combined together with a median algorithm to produce a single spectrum, thereby eliminating cosmic ray spikes.
To remove the telluric features, a number of A0V stars were observed throughout the night at similar airmasses as the targets. These spectra were fitted with a theoretical spectrum corrected for rotation and radial velocity. The standard spectra were divided by the model isolating the telluric spectrum which was used subsequently to correct the target spectra. We carefully checked that division by the telluric spectrum does not introduce any spurious features. At our resolution (3.5 Å/pix), this method works very well for the band. However, it could somewhat increase the emission lines seen in the band, although we estimate this effect to be smaller than 20% in Br. In this paper we are concerned with the characterisation of the donor. As will be shown, it turns out to be a Be star. In the IR essentially, we are seeing the circumstellar envelope emission and, consequently, the line ratios cannot be used for spectral classification. Therefore we have not corrected further for this effect333The corrected spectra will be used to diagnose specifically the physical properties of the circumstellar envelopes. However, this is beyond the scope of this paper. The final spectra are shown in Fig. 1.
3 Data analysis
3.1 Near-IR spectra and classification of the counterpart
The spectral analysis was carried out using the Starlink444http://starlink.jach.hawaii.edu/starlink software and the IRAF package555http://iraf.noao.edu. To identify the emission/absorption lines and spectral classification, we used the following atlases: Blum et al. (1997), Meyer et al. (1998) and Hanson et al. (1998) for the H band; Hanson et al. (1996) and Hanson et al. (2005) for the K band.


Figure 1 shows our band TNG spectrum. To date, this is the only infrared spectrum obtained for this source. The strong absorption (see section 3.2) implies a colour excess of and makes it difficult to obtain an optical blue spectrum with a 4-m class telescope. The NIR -band spectrum exhibits the presence of the Brackett H i series from Br(19-4) line at 1.5235 m to the Br(10-4) transition at 1.7362 m. This points clearly towards an early B type star, since these lines disappear for O type stars. All these lines are in emission. The 1.700 m He i line is seen also in emission. This is typical of Be stars in which the circumstellar disk emission dominates the spectrum at NIR wavelengths. Some Brackett series lines show a double peak structure. According to a few analyses of infrared emission line profiles in Be stars, they have the same characteristics as those in the visible region (Underhill & Doazan, 1982). Most Be stars show double-peak structure in their Balmer emission lines (Slettebak et al., 1992). In general, this double-peak structure is to be expected for a rotating emitting disk. If the star is viewed at an intermediate angle of inclination of the line of sight on the rotation axis, the emission lines exhibit a weak central reversal typical of a Be spectrum. Features at 1.5965 m [Fe ii], at 1.6027 m C i (possibly blended with 1.6002 m [Fe ii] and/or 1.6009 m C i) and at 1.6685 m Si i seem to be present in our spectrum. Another line could match the position of He ii at 1.697 m. He ii is only detected in O stars, and preferentially in the supergiants (Hanson et al., 1998). However, He ii is very weak preventing differentiation from the continuum noise level. Furthermore, -band spectra of Be stars show all Brackett series in emission Steele & Clark (2001). At any rate, the band spectrum seems to be characteristic of a Be star.
As a comparison, we also show for the first time NIR spectra of two previously classified Be X-ray binaries based on optical spectra. For IGR J015836713, Halpern & Tyagi (2005) obtained a low-resolution optical spectrum which revealed strong H and weak H emission lines, of equivalent width (EW) 70 Å and 6 Å respectively, as well as diffuse interstellar bands. These features suggested a Be companion. Subsequent optical spectroscopy (Masetti et al., 2006; Kaur et al., 2008) confirmed its Be-X nature. For IGR J225346243, Masetti et al. (2012) obtained a spectrum of a highly reddened, intrinsically blue continuum star with superimposed H, H and He i emission lines pointing strongly to a Be companion. Esposito et al. (2013) confirmed the Be-X nature using a blue band spectrum of the IR counterpart obtained with the 2.5-m Nordic Optical Telescope (NOT, La Palma). Although the is poorer for IGR J192941816 (because it is 2 magnitudes fainter in ) it is clearly consistent with a Be donor.
Table 1 summarises the line identifications and the estimated equivalent widths for all the observed targets.
| IGR J | ||||
|---|---|---|---|---|
| Emission | Wavelength | 01583+6713 | 19294+1816 | 22534+6243 |
| line | () | EW (Å) | ||
| Br 20 | 1.5196 | -5.50.8 | -5.50.8 | -5.90.8 |
| Br 19 | 1.5265 | -5.70.8 | -9.31.3 | -5.50.8 |
| Br 18 | 1.5346 | -7.01.0 | -9.51.4 | -7.01.0 |
| Br 17 | 1.5443 | -8.21.2 | -10.61.5 | -8.51.2 |
| Br 16 | 1.5561 | -9.91.4 | -10.81.5 | -10.31.5 |
| Br 15 | 1.5705 | -10.51.5 | -7.51.1 | -11.41.6 |
| Br 14 | 1.5885 | -14.82.1 | -11.61.7 | -14.72.1 |
| Fe ii | 1.5965 | — | -1.40.2 | — |
| Fe ii | 1.6019 | — | blended? | — |
| C i | 1.6027 | — | -5.10.7 | — |
| Br 13 | 1.6114 | -14.92.1 | -203 | -16.72.4 |
| Br 12 | 1.6412 | -193 | -213 | -193 |
| Si i | 1.6685 | — | -4.70.7 | — |
| Br 11 | 1.6811 | -223 | -17.42.4 | -213 |
| He i | 1.7007 | — | -1.40.2 | -2.30.3 |
| Br 10 | 1.7362 | -193 | -14.92.1 | -16.22.3 |
| He i | 2.0580 | -1.30.2 | — | -9.91.4 |
| He i | 2.1126 | < -0.2 | — | < -0.3 |
| N iii | 2.1155 | < -0.2 | — | < -0.1 |
| Br | 2.1661 | -243 | — | -203 |
| He ii | 2.1885 | < -0.2 | — | < -0.4 |
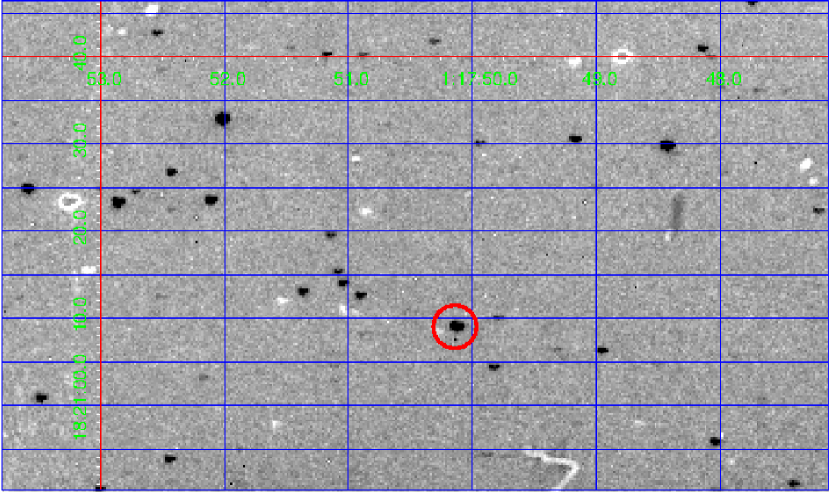
In order to rule out any contamination by an unresolved companion, we compared the same field of view in the -band of 2MASS and UKIDSS as this last survey provides a higher angular resolution. This is a necessary test for faint sources (typically ) as we demonstrated in Rodes-Roca et al. (2013). The source is not blended, as it shown in Fig. 2.
In summary, the NIR spectrum of IGR J19294+1816 points strongly towards a Be nature of the donor. This conclusion is further strengthened by the photometry presented in the next section.
3.2 Photometry
To carry out the photometric analysis we used the Simbad database (Wenger et al., 2000), several optical databases, such as Gaia (Gaia Collaboration et al., 2016b, a; van Leeuwen et al., 2017; Evans et al., 2017), IPHAS (Drew et al., 2005), and PAN-STARRS (Chambers et al., 2016; Magnier et al., 2016a; Waters et al., 2016; Magnier et al., 2016b, c; Flewelling et al., 2016) and several IR databases such as the UK Infrared Telescope (UKIRT) Infrared Deep Sky Survey (UKIDSS, Lawrence et al. (2007)), the Two Micron All Sky Survey (2MASS, Skrutskie et al. (2006)), the GLIMPSE database, the Wide-field Infrared Survey Explorer (WISE) all sky survey (Wright et al., 2010), and the Near-Earth Object WISE (NEOWISE, Mainzer et al. (2014)) obtaining the photometry given in Table 2.
| Photometry | IGR J | ||
|---|---|---|---|
| (mag) | 01583+6713 | 19294+1816 | 22534+6243 |
| 15.650.08 | — | 17.380.11 | |
| 14.430.03 | — | 15.610.01 | |
| 1.220.11 | — | 1.770.12 | |
| 2MASS | |||
| 11.480.03 | 14.560.03 | 11.6440.024 | |
| 11.030.03 | 12.990.03 | 10.9610.023 | |
| 10.6010.021 | 12.1150.023 | 10.460.03 | |
| UKIDSS | |||
| — | 14.30190.0020 | — | |
| — | 12.87100.0009 | — | |
| — | 11.87920.0011 | — | |
| WISE/NEOWISE | |||
| 10.0990.023 | 10.7150.024 | 9.870.04 | |
| 9.7150.020 | 10.2830.022 | 9.450.03 | |
| 8.850.03 | 10.270.15 | 8.570.05 | |
| 8.40.3 | <8.74 | 7.730.19 | |
| GLIMPSE | |||
| 3.6 | — | 10.950.05 | — |
| 4.5 | — | 10.660.05 | — |
| 5.8 | — | 10.390.07 | — |
| 8.0 | — | 10.200.04 | — |
| PAN-STARRS | |||
| (0.477 ) | — | 27.06 | — |
| (0.613 ) | — | 22.290.16 | — |
| (0.748 ) | — | 20.150.05 | — |
| (0.865 ) | — | 18.3350.014 | — |
| (0.960 ) | — | 17.2230.014 | — |
| Gaia | |||
| (0.673 ) | — | 20.71 | — |
| IPHAS | |||
| (0.766 ) | — | 19.510.08 | — |
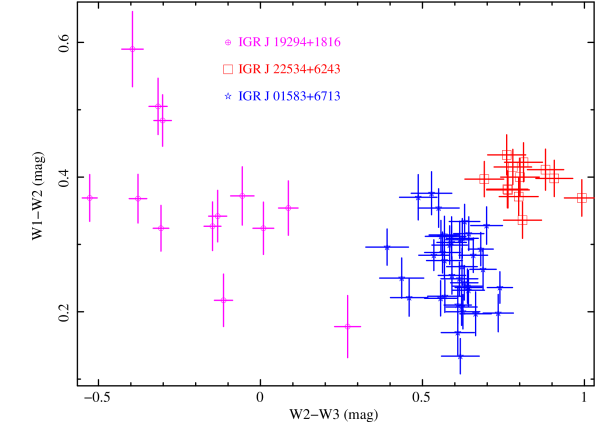
Classical Be stars tend to occupy a reduced region in the colour-colour (CC) diagram [W1W2] vs [W2W3], see figure 5 and figure 7 central panel in Koenig & Leisawitz (2014). They are located in the range [-0.1–0.6] vs [-0.1–1.5] in this diagram. We obtained the single exposure data from the WISE All-Sky Single Exposure (L1b) database. Then, we selected cc_flag equal to 0 or h and non-null data for W3 and did the previous CC diagram on the IRSA (Infrared Science Archive) web application (Fig. 3). For the Be/X-ray binaries IGR J01583+6713 and IGR J22534+6243 all the values are found in the classical Be zone666although can be confused with blue transition disk objects. No significant variability was found within the uncertainties. For IGR J19294+1816 the values of the W3 filter had a spurious detection and only an upper limit on magnitude could be estimated. Therefore, error bars in are the uncertainties measured in . Nevertheless, the points in the CC diagram were also consistent with a classical Be star.
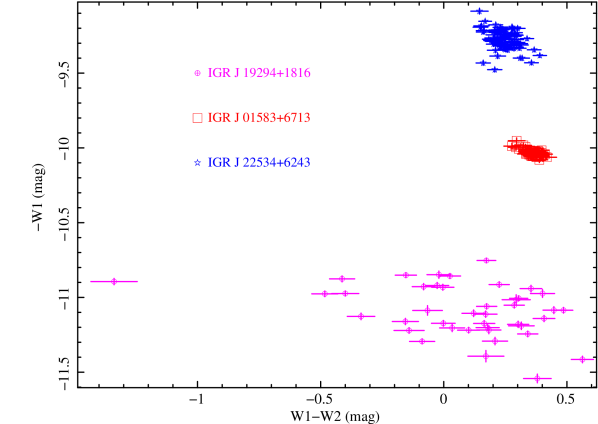
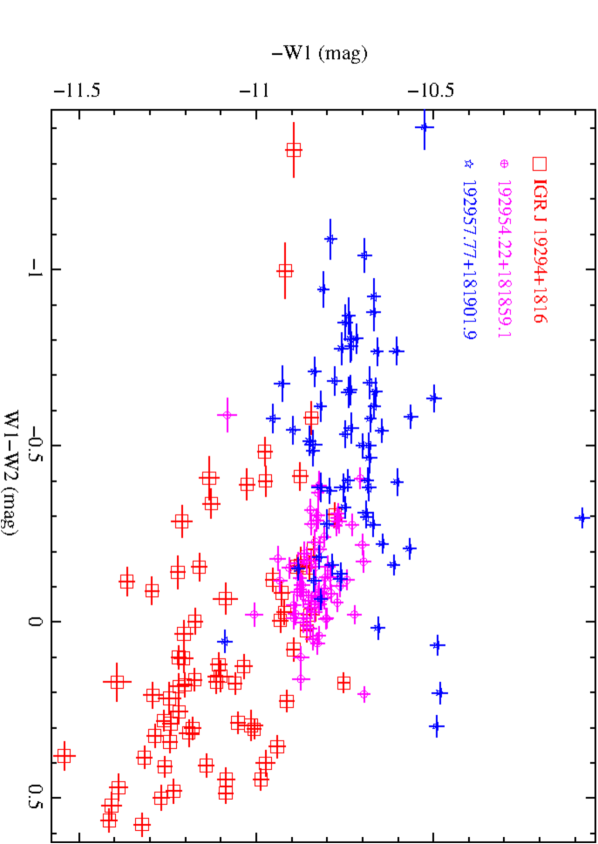
In addition, the NeoWISE database has single exposure data for these objects allowing us to plot the colour-magnitude (CM) diagram [W1] vs [W1W2] (Fig. 4). IGR J19294+1816 seems to be quite variable. However, we built the same CM diagram for two nearby sources and also showed the same behaviour (Fig. 5). The standard deviation of the variability in the WISE colour is , , , respectively.
As seen in Section 3 all IR lines are in emission. The circumstellar envelope emission contaminates the underlying photospheric spectrum of the Be star and produces an overluminosity (for non Be-shell) with respect to B stars of the same spectral type and luminosity class. This leads to a systematic under estimation of the distance and, hence, the X-ray luminosity. We will use the recipes given in Riquelme et al. (2012) to correct for these effects. The distance is computed from the usual equation
| (1) |
where is the observed magnitude, is the absolute magnitude for the corresponding spectral type and luminosity class and has two terms: the interstellar absorption towards the source and the circumstellar emission:
| (2) |
The fact that all the significant lines are in emission implies a well developed envelope which is responsible for the strong IR excess. Both, IGR J01583+6713 (Halpern & Tyagi, 2005) and IGR J22534+6243 (Esposito et al., 2013) have values of measured larger than 15 Å (Table 1) and, therefore, they are in the saturated regime. On the other hand, IGR J19294+1816 presents also all the significant band lines in emission, with comparable equivalent widths, demonstrating that the envelope is well developed. We will then assume that this source is also in the saturated regime. In these conditions:
| (3) |
IGR J19294+1816 has no optical photometry due to the very high extinction. We have derived the excess using the available IR photometry. Be donors in Be-X-ray binaries occupy a rather narrow spectral class interval (Riquelme et al., 2012). We have estimated the distance assuming a B0 V or B2 V spectral type. In Riquelme et al. (2012) it is shown that the visual to infrared colour circumstellar excess is already 3 to 4 times that of for Be-X ray binaries and increases towards longer wavelengths. We estimate that the effect on is of the order of 1 magnitude (Riquelme et al., 2012). That is to say mag. Therefore . Following Fitzpatrick (1999) we can compute subsequently and . In Table 3 we summarize our results. As can be seen, the distances to IGR J19294+1816 are in the range 10-12 kpc. We will assign finally a distance kpc locating the system at the far edge of the Perseus arm. The line of sight passes through the Sagitarius arm tangentially and the Perseus arm, explaining the high extinction. Using the values from Table 4 in Riquelme et al. (2012) and equation 1, we estimate a lower limit for the visual magnitude of mag. This is corroborated by the SED analysis in the next section.
| MK | (mag) | (kpc) | ||||
| B2 Ve | 0.22 | 2.665 | 1.665 | 3.5 | 0.30 | 11.6 |
| B0 Ve | 0.17 | 2.615 | 1.615 | 3.17 | 0.29 | 10.0 |
| bAssuming a saturated H emission. | ||||||
3.3 Spectral energy distribution
In order to extend the characterisation of IGR J19294+1816, we will use the spectral energy distribution (SED) using the photometry on Table 2. It is well known, however, that free-free transitions in the circumstellar envelope of the Be stars produce an excess of photons at long wavelengths with respect to what can be expected from the photospheric flux. The photometric points affected by this infrared excess cannot be taken into account in the SED fitting process.
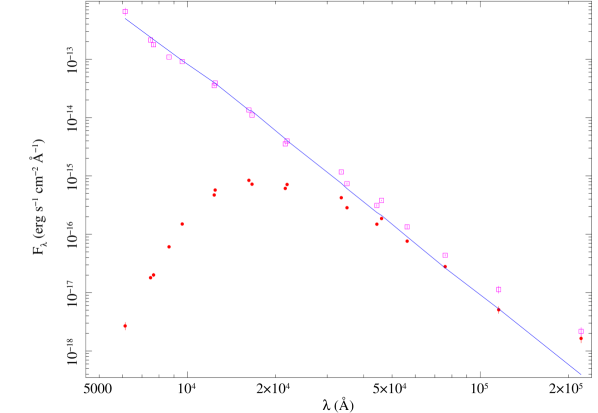
The SED of the source is reported in Figure 6. We built it using the Virtual Observatory (VO) tool VOSA following the method described in Bayo et al. (2008)777Photometric fluxes provided through VO services (Ochsenbein et al., 2000; Ahn et al., 2012; Skrutskie et al., 2006; Bianchi & GALEX Team, 2000; Wright et al., 2010).. The filled (red) circles represent the observed fluxes. The strong reddening is clearly seen. At the wavelength of the filter (5500 Å), the SED flux is of the order of erg s-1 cm-2 Å-1 which corresponds to a magnitude of mag, in agreement with the estimation in the previous section. For de-reddening the SED, we use the deduced and the extinction law by Fitzpatrick (1999) improved by Indebetouw et al. (2005) in the infrared. The resulting de-reddened fluxes are shown as open (magenta) squares. Finally, we fitted the SED with the TLUSTY OSTAR2002+BSTAR2006 grid of stellar atmosphere models (Hubeny & Lanz, 1995; Lanz & Hubeny, 2003, 2007). The best fit (continuous, blue line) corresponds to a K and . The IR excess above 3 is clearly seen (growing towards longer wavelengths). The bolometric luminosity for the IR counterpart can now be estimated from the ratio of observed to de-reddened fluxes888Changing the had no noticeable effect in our fits given the uncertainties and the lack of data below 4000 Å.. This turns out to be erg s. This is consistent with a B0-2 star of luminosity class V.
4 Discussion and conclusions
IGR J19294+1816 is a transient system with a likely B1Ve donor. The unabsorbed X-ray flux (2–10 keV) reported by Rodriguez et al. (2009a) varies in the range of erg s-1 cm-2 following the activity of the source with INTEGRAL, RXTE and Swift, while it reaches erg s-1 cm-2 in outburst (20–50 keV energy band) (Bozzo et al., 2011). At the estimated distance of 11 kpc, the X-ray luminosity would be erg s-1 in quiescence while the peak luminosity would be as high as erg s-1, assuming isotropic emission. The new NIR spectroscopy presented here as well as the WISE photometry analysis strongly favour a Be donor. Hence, our results, combined with the properties of the X-ray data, firmly classify IGR J19294+1816 as a Be X-ray binary.
Acknowledgements
Part of this work was supported by the Spanish MINECO project number ESP2014-53672-C3-3-P. The authors would like to thank the referee for her/his useful comments and suggestions. Based on observations made with the Italian TNG operated on the island of La Palma by the Fundación Galileo Galilei of the INAF (Istituto Nazionale di Astrofisica) at the Spanish ORM of the IAC. This publication makes use of data products from the 2MASS, which is a joint project of the University of Massachusetts and the IPAC/CALTECH, funded by the NASA and the NSF. This publication makes use of data products from the WISE and NeoWISE, which are joint projects of the UCLA, and the JPL/CALTECH, funded by the NASA. This research has made use of the SIMBAD database, operated at CDS, Strasbourg, France. The UKIRT Wide Field Camera project is described in Casali et al. (2007). This work has made use of data from the European Space Agency (ESA) mission Gaia (https://www.cosmos.esa.int/gaia), processed by the Gaia Data Processing and Analysis Consortium (DPAC, https://www.cosmos.esa.int/web/gaia/dpac/consortium). Funding for the DPAC has been provided by national institutions, in particular the institutions participating in the Gaia Multilateral Agreement. J.J.R.R. acknowledges financial support from the Generalitat Valenciana and University of Alicante projects GV/2014/088 and GRE12-35, respectively. A.M. acknowledges the support by the grant by the Vicerectorat d’Investigació, Desenvolupament i Innovació de la Universitat d’Alacant under visiting researcher programme INV15-10.
References
- Ahn et al. (2012) Ahn C. P., et al., 2012, ApJS, 203, 21
- Bayo et al. (2008) Bayo A., Rodrigo C., Barrado Y Navascués D., Solano E., Gutiérrez R., Morales-Calderón M., Allard F., 2008, A&A, 492, 277
- Bianchi & GALEX Team (2000) Bianchi L., GALEX Team 2000, Mem. Soc. Astron. Italiana, 71, 1123
- Blum et al. (1997) Blum R. D., Ramond T. M., Conti P. S., Figer D. F., Sellgren K., 1997, AJ, 113, 1855
- Bozzo et al. (2011) Bozzo E., Ferrigno C., Falanga M., Walter R., 2011, A&A, 531, A65
- Casali et al. (2007) Casali M., et al., 2007, A&A, 467, 777
- Chambers et al. (2016) Chambers K. C., et al., 2016, preprint, (arXiv:1612.05560)
- Drew et al. (2005) Drew J. E., et al., 2005, MNRAS, 362, 753
- Ducati et al. (2001) Ducati J. R., Bevilacqua C. M., Rembold S. B., Ribeiro D., 2001, ApJ, 558, 309
- Esposito et al. (2013) Esposito P., Israel G. L., Sidoli L., Mason E., Rodríguez Castillo G. A., Halpern J. P., Moretti A., Götz D., 2013, MNRAS, 433, 2028
- Evans et al. (2017) Evans D. W., et al., 2017, A&A, 600, A51
- Fitzpatrick (1999) Fitzpatrick E. L., 1999, PASP, 111, 63
- Flewelling et al. (2016) Flewelling H. A., et al., 2016, preprint, (arXiv:1612.05243)
- Gaia Collaboration et al. (2016a) Gaia Collaboration et al., 2016a, A&A, 595, A1
- Gaia Collaboration et al. (2016b) Gaia Collaboration et al., 2016b, A&A, 595, A2
- Halpern & Tyagi (2005) Halpern J. P., Tyagi S., 2005, The Astronomer’s Telegram, 681
- Hanson et al. (1996) Hanson M. M., Conti P. S., Rieke M. J., 1996, ApJS, 107, 281
- Hanson et al. (1998) Hanson M. M., Rieke G. H., Luhman K. L., 1998, AJ, 116, 1915
- Hanson et al. (2005) Hanson M. M., Kudritzki R.-P., Kenworthy M. A., Puls J., Tokunaga A. T., 2005, ApJS, 161, 154
- Hubeny & Lanz (1995) Hubeny I., Lanz T., 1995, ApJ, 439, 875
- Indebetouw et al. (2005) Indebetouw R., et al., 2005, ApJ, 619, 931
- Kaur et al. (2008) Kaur R., Paul B., Kumar B., Sagar R., 2008, MNRAS, 386, 2253
- Koenig & Leisawitz (2014) Koenig X. P., Leisawitz D. T., 2014, ApJ, 791, 131
- Lanz & Hubeny (2003) Lanz T., Hubeny I., 2003, ApJS, 146, 417
- Lanz & Hubeny (2007) Lanz T., Hubeny I., 2007, ApJS, 169, 83
- Lawrence et al. (2007) Lawrence A., et al., 2007, MNRAS, 379, 1599
- Magnier et al. (2016c) Magnier E. A., et al., 2016c, preprint, (arXiv:1612.05242)
- Magnier et al. (2016b) Magnier E. A., et al., 2016b, preprint, (arXiv:1612.05244)
- Magnier et al. (2016a) Magnier E. A., et al., 2016a, preprint, (arXiv:1612.05240)
- Mainzer et al. (2014) Mainzer A., et al., 2014, ApJ, 792, 30
- Martínez-Núñez et al. (2017) Martínez-Núñez S., et al., 2017, Space Sci. Rev.,
- Masetti et al. (2006) Masetti N., et al., 2006, A&A, 455, 11
- Masetti et al. (2012) Masetti N., Jimenez-Bailon E., Chavushyan V., Parisi P., Bazzano A., Landi R., Bird A. J., 2012, The Astronomer’s Telegram, 4248
- Meyer et al. (1998) Meyer M. R., Edwards S., Hinkle K. H., Strom S. E., 1998, ApJ, 508, 397
- Ochsenbein et al. (2000) Ochsenbein F., Bauer P., Marcout J., 2000, A&AS, 143, 23
- Reig (2011) Reig P., 2011, Ap&SS, 332, 1
- Riquelme et al. (2012) Riquelme M. S., Torrejón J. M., Negueruela I., 2012, A&A, 539, A114
- Rodes-Roca et al. (2013) Rodes-Roca J. J., Torrejón J. M., Martínez-Núñez S., Bernabéu G., Magazzú A., 2013, A&A, 555, A115
- Rodriguez et al. (2009a) Rodriguez J., Tomsick J. A., Bodaghee A., Zurita Heras J.-A., Chaty S., Paizis A., Corbel S., 2009a, A&A, 508, 889
- Rodriguez et al. (2009b) Rodriguez J., Tuerler M., Chaty S., Tomsick J. A., 2009b, The Astronomer’s Telegram, 1998
- Schmidt-Kaler (1982) Schmidt-Kaler T., 1982, in Aller L. H., et al., eds, Landolt-Bornstein: Group 6: Astronomy. p. 54
- Sidoli et al. (2017) Sidoli L., Israel G. L., Esposito P., Rodríguez Castillo G. A., Postnov K., 2017, MNRAS, 469, 3056
- Skrutskie et al. (2006) Skrutskie M. F., et al., 2006, AJ, 131, 1163
- Slettebak et al. (1992) Slettebak A., Collins II G. W., Truax R., 1992, ApJS, 81, 335
- Steele & Clark (2001) Steele I. A., Clark J. S., 2001, A&A, 371, 643
- Strohmayer et al. (2009) Strohmayer T., Rodriquez J., Markwardt C., Tomsick J., Bodaghee A., Chaty S., Corbel S., Paizis A., 2009, The Astronomer’s Telegram, 2002
- Turler et al. (2009) Turler M., Rodriguez J., Ferrigno C., 2009, The Astronomer’s Telegram, 1997
- Underhill & Doazan (1982) Underhill A., Doazan V., 1982, Journal of the British Astronomical Association, 92, 290
- Waters et al. (2016) Waters C. Z., et al., 2016, preprint, (arXiv:1612.05245)
- Watson et al. (2009) Watson M. G., et al., 2009, A&A, 493, 339
- Wenger et al. (2000) Wenger M., et al., 2000, A&AS, 143, 9
- Winkler et al. (2003) Winkler C., et al., 2003, A&A, 411, L1
- Wright et al. (2010) Wright E. L., et al., 2010, AJ, 140, 1868
- van Leeuwen et al. (2017) van Leeuwen F., et al., 2017, A&A, 599, A32