Giant electrocaloric response in the prototypical Pb(Mg,Nb)O3
relaxor ferroelectric
from atomistic simulations
Abstract
An atomistic effective Hamiltonian is used to investigate electrocaloric (EC) effects of Pb(Mg1/3Nb2/3)O3 (PMN) relaxor ferroelectrics in its ergodic regime, and subject to electric fields applied along the pseudocubic [111] direction. Such Hamiltonian qualitatively reproduces (i) the electric field-versus-temperature phase diagram, including the existence of a critical point where first-order and second-order transitions meet each other; and (ii) a giant EC response near such critical point. It also reveals that such giant response around this critical point is microscopically induced by field-induced percolation of polar nanoregions. Moreover, it is also found that, for any temperature above the critical point, the EC coefficient-versus-electric field curve adopts a maximum (and thus larger electrocaloric response too), that can be well described by the general Landau-like model proposed in [Jiang et al, Phys. Rev. B 96, 014114 (2017)] and that is further correlated with specific microscopic features related to dipoles lying along different rhombohedral directions. Furthermore, for temperatures being at least 40 K higher than the critical temperature, the (electric field, temperature) line associated with this maximal EC coefficient is below both the Widom line and the line representing percolation of polar nanoregions.
I Introduction
The electrocaloric (EC) effect characterizes the change in dipolar entropy or temperature under the application and/or removal of an electric field Lines1997 ; Jona1993 ; Scott2011 ; Zhang2006 ; Zhang_APL_2006 ; Kutnjak2015 . It has the potential to lead to the design of efficient solid-state cooling devices for a broad range of applications Bai2010 ; Moya2014 ; Kutnjak2015 ; Zhang2014 . As such, EC effects have been intensively studied in recent years (see, e.g., Refs. Liu2013 ; Liu2014 ; Sanlialp2015 ; Lines1997 ; Kutnjak2015 ; Uchino2000 ; Prosandeev2008 ; Lisenkov2009 ; Ponomareva2012 ; Rose2012 ; Marathe2016 ; Geng2015 ; Defay2013 ; Defay2016 ; Defay_2016 ; Guzman-Verri2016 ; Marathe2014 ; Pirc2011-1 ; Marathe2017 and references therein). In particular, a promising large electrocaloric response has been measured in prototypical lead-based relaxor ferroelectrics, such as Pb(Mg,Nb)O3 (PMN), (Pb,La)(Zr,Ti)O3 and Pb(Mg,Nb)O3–PbTiO3 Pirc2011-1 , in the vicinity of the critical point where first-order and second-order transitions meet in the electric field-versus-temperature phase diagram. Relaxor ferroelectrics differentiate themselves from typical ferroelectrics, by, e.g., adopting a frequency-dependent dielectric response-versus-temperature function, as well as several characteristic temperatures Burns1983 ; Dkhil2009 ; Svitelskiy2005 ; Vogel1921 ; Fulcher1925 ; Jeong2005 ; Nahas2016 even if they remain macroscopically paraelectric down to 0 K. It is important to realize that two types of relaxor ferroelectrics should be distinguished because they can exhibit different properties: Pb-based ones, such as PMN, versus lead-free ones, such as Ba(Zr0.5Ti0.5)O3 (BZT). For instance, unlike PMN, there is no aforementioned critical point present in BZT. Another evidence of their possible difference is that the relaxor nature of BZT was predicted to originate from small Ti-rich polar nanoregions (PNRs) as a result of the difference in polarizability between Ti and Zr sites Akbarzadeh2012 , while the lead-based PMN system was numerically found to be a relaxor because of a complex interplay between random electric fields, ferroelectric and antiferroelectric interactions – with such interplay yielding much larger PNRs touching each other at low temperatures Prosandeev2015 .
Due to its complexity, unlike typical ferroelectrics Prosandeev2008 ; Lisenkov2009 ; Ponomareva2012 ; Rose2012 ; Marathe2016 and lead-free relaxor ferroelectrics Jiang2017 , we are not aware of any atomistic simulation devoted to the study of EC effects in lead-based relaxors. Consequently, several questions remain unanswered in systems such as PMN. For instance, are atomistic modeling able to reproduce the existence of a critical point in such complex compound and reveal atomistic features (if any) associated with the enhancement of EC response near the critical point? In particular, could such features be related to electric-field-induced percolation of the polar nanoregions? It is also legitimate to wonder if, for temperatures higher than the critical point, some electric fields can also yield an enhancement of the EC response (i.e., a large electrocaloric response too), and if such enhancement can be traced back to specific atomistic features? In addition, while the simple Landau-type phenomenological model developed in Ref. Jiang2017 can reproduce the temperature- and field-driven behavior of the EC response of typical ferroelectrics and lead-free relaxor ferroelectrics, it is important to determine if such model is also valid in the more complex PMN compound, which will make such model even more general and of broader use (note that such a model predicts that the EC coefficient is directly related to the product of the temperature and the derivative of the square of the polarization with respect to electric field).
The goal of this article is to provide an answer to all the aforementioned questions in the PMN relaxor ferroelectric subject to dc electric fields applied along the pseudocubic [111] direction. For that, we will adopt the following organization. Section II provides details about the atomistic method employed here, as well as our practical way to compute the EC response. Section III.A demonstrates that such atomistic method is indeed able to qualitatively reproduce the peculiar (electric field, temperature) phase diagram of PMN, including its critical point. Section III.B shows that (1) there is indeed an electric field leading to a maximal EC coefficient for any fixed temperature above the critical point, with such maximal EC coefficient being strongly enhanced when decreasing the temperature such as to approach the critical point from above; and (2) that the Landau-type model of Ref. Jiang2017 is still rather accurate for PMN. Section III.C is dedicated to local atomistic features inherently linked to EC responses. In particular, the giant EC coefficient numerically found in the vicinity of the critical point is revealed to be correlated with field-induced percolation of polar nanoregions, while the optimization of the EC response for higher temperature is linked to other, subtle and original microscopic characteristics. Finally, Section IV summarizes this work.
II Methods
Here, we use the first-principles-based effective Hamiltonian () approach developed in Ref. [Prosandeev2015, ]. Its total internal energy contains two main terms, , where is the Pb-centered local soft mode in unit cell (which is proportional to the electric dipole moment of that cell), are variables related to the inhomogeneous strain and are centered on the B sites (Ng or Mg ions), is the homogeneous strain tensor, and characterizes the atomic distribution of Mg and Nb ions. describes the energies of a simple virtual perovskite system and has five terms: (i) the local-mode self-energy; (ii) the long-range dipole-dipole interaction; (iii) the short-range interactions between local modes; (iv) the elastic energy; and (v) the energy representing the interaction between local modes and strains Zhong1995 . mimics how the distribution of Mg and Nb cations alters energetics Prosandeev2015 . We also add to an energy that is proportional to minus the dot product between polarization and electric field, in order to simulate the effect of such field on properties.
We employ this within Monte Carlo (MC) simulations on supercells (29,160 atoms) with periodic boundary conditions. Mg and Nb ions are randomly distributed inside these supercells. 20,000 MC sweeps are used for equilibration and an additional 80,000 MC sweeps are employed to compute statistical averages at desired temperature, , and electric field, , in order to get converged results. Typically and unless specified in figures’ captions, we use here one disordered chemical configuration, in order to capture the first-order nature of some electric-field-driven transitions (since different random arrangements can have slightly different critical fields for these first-order transitions, and therefore averaging over different configurations will, e.g., smear out the first-order-induced jump of the polarization when increasing the electric field).
The EC coefficient, , is defined to be the derivative of the temperature with respect to electric field at constant entropy, and is computed from MC runs via the following cumulant formula Omran2016 ; Jiang2017 :
| (1) |
where is the Born effective charge, is the five-atom lattice constant, is the number of sites in the supercell, is the selected temperature, is the supercell average of the local mode, is the total internal energy of the , and denotes the average over the MC sweeps at every selected temperature. The computation of via Eq. (1) is done for a chosen combination of temperature and magnitude of a dc electric field applied along the pseudocubic [111] direction.
III Results
III.1 - phase diagram
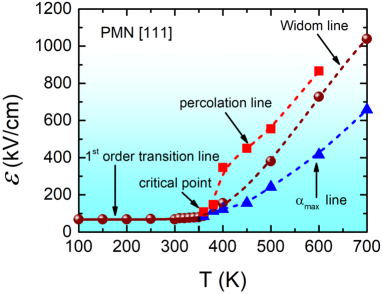
Let us start by determining the - phase diagram of PMN, as predicted from the use of our for a given disordered configuration. Figure 1 shows such phase diagram, when varying the magnitude of the electric field along the [111] direction while keeping the temperature constant (for different choices of this temperature ranging between 100 and 700 K). Two different particular lines can be seen there: (1) a solid line corresponding to a first-order transition from a non-ergodic relaxor state to a ferroelectric state, as consistent with measurements Zhao2007 ; Kutnjak2008 ; Kutnjak2007 and as numerically found via the occurrence of a sudden jump in the polarization-versus- curve at fixed temperature (see Supplemental Material SM ); and (2) a brown dashed line corresponding to the so-called Widom line Xu2005 ; Simeoni2010 ; Kutnjak2007 and that is presently identified via the occurrence of peaks in the dielectric response (see Supplemental Material SM , while the polarization-versus- function is continuous). Interestingly, these two lines meet at a critical point to be denoted as (, ) and which is equal to (86.6 kV/cm, 360 K). Our predicted phase diagram of Fig. 1 therefore qualitatively agrees with those measured in Refs. Kutnjak2007 ; Kutnjak2008 ; Zhao2007 , that also exhibit a critical point, along with a first-order transition line below and a Widom line above . Quantitatively, our simulated is about 22 times larger than the measured one Kutnjak2007 , which is typical for atomistic simulations Jiang2017 ; Xu2017 , while the resulting predicted is about 130 K higher than the observed one of 230 K Kutnjak2008 .
III.2 EC coefficients
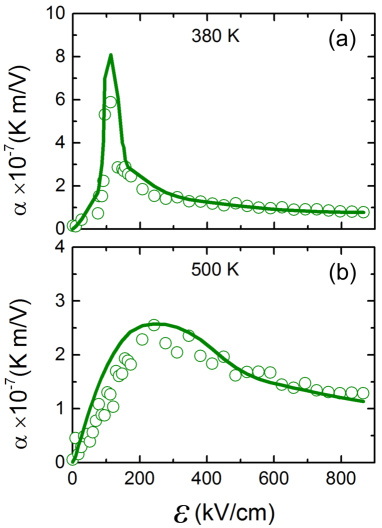
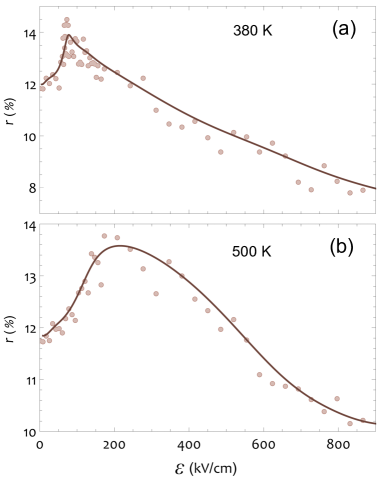
Let us now concentrate on the EC coefficient. It is important to recall that Eq. (1) automatically assumes ergodic conditions. Since such conditions are “only” satisfied for temperatures above for any field in the phase diagram of Fig. 1 (recall that for and , the system is nonergodic), we decided to limit the present investigation of EC effects in PMN for temperatures equal or higher than K. Figure 2 shows the electrocaloric coefficient as a function of electric field, , for two selected temperatures, namely 380 and 500 K (that therefore both lie in the ergodic regime). For any presently investigated temperature, exhibits a non-monotonic behavior with field that has also been previously seen in the lead-free Ba(Zr,Ti)O3 relaxor ferroelectric Jiang2017 . Such behavior consists of vanishing values at low fields, followed by an increase up to a maximum (to be denoted as ) before decreasing for larger fields.
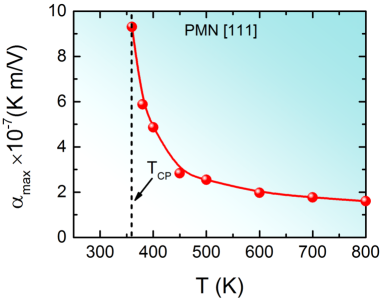
Moreover, Fig. 3 reports as a function of temperature. It is clear that, in the ergodic regime, increases when the temperature decreases down to the critical point K, which is in qualitative agreement with experimental data of PMN Pirc2011-1 and which emphasizes the importance of proximity to the critical point for the enhancement of the electrocaloric effect. Interestingly, our predicted value of at 380 K is of the order of K m/V, that is of the same order than the experimental data of K m/V at the measured critical temperature of PMN Pirc2011-1 . Note that is still large at, e.g., 500 K, since it is computed to be of the order of K m/V.
Furthermore, Fig. 1 further displays the value of the specific electric field at which is maximum for any investigated temperature above . It reveals that, for any of these temperatures (at the sole exception of ), this field is lower than that of the Widom line. Such feature can be understood by the fact that, as previously found for Ba(Zr,Ti)O3 relaxor ferroelectrics as well as for prototypical ferroelectrics Jiang2017 and as shown in Figs. 2(a) and 2(b) by means of solid green curves, the behavior of versus electric field for any considered temperature is found here to be very well reproduced by a simple Landau-derived model (note that Ref. Jiang2017 provides more details about this model, assumptions and the resulting derived final formula) indicating that should be equal to , where is a constant and is the polarization. Such fact further demonstrates the generality of such simple model, and the intrinsic relationship between the EC coefficient and the derivative of the square of the polarization with respect to electric field at constant temperature. The electric field leading to the enhancement of at a fixed temperature is therefore not the one of the Widom line because this latter is related to the vanishing of the derivative of the dielectric constant with respect to temperature at fixed electric field (which thus leads to the annihilation of the second derivative of the polarization with respect to both electric field and temperature) rather than the vanishing of the second derivative of the square of the polarization with respect to electric field at constant temperature (which is the case for ).
Let us now check if the electric fields associated with can be rather traced back to local features.
III.3 Local features
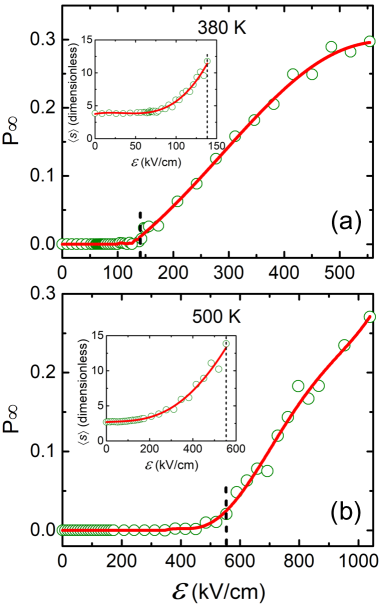
For that, we first decided to resort to percolation theory and computed two specific quantities. The first one is the so-called strength of the percolating cluster Stauffer1994 ; Prosandeev2013 , that is calculated as , where is the number of the distinct Pb sites of the supercell belonging to the (infinite) percolating cluster [note that the infinite cluster is defined to be a cluster spreading from one side of the supercell to the opposite side, and inside which the dipoles are nearly parallel to each other (that is, when the cosine of the angle between two nearest neighboring dipoles is larger than 0.85)] and where is the number of Pb ions in the whole supercell. The second quantity is the average cluster size Stauffer1994 ; Prosandeev2013 ; Prosandeev2015 , which is computed as , where is the number of Pb sites belonging to a polar nanoregion, and the brackets denote the average over all the PNRs existing inside the supercell (note that the criterion presently used to numerically find if two dipoles centered on first nearest-neighbors Pb ions belong to the same PNR is that the angle between these two dipoles has a cosine being between 0.85 and 1.0). Note that is only computed here when the strength of the percolating cluster is negligible, since is only physical when the percolating cluster has not formed yet.
Figures 4(a) and 4(b) show the strength of the percolating cluster as a function of the magnitude of the electric field at 380 and 500 K, respectively, with their insets displaying the corresponding field dependency of the average cluster size at these two temperatures. At 380 K, basically vanishes below 140 kV/cm, and then becomes finite and significantly increases when the field further increases. Moreover, the inset of Fig. 4(a) reveals that is nearly constant, around 4, for fields below 87 kV/cm, and then is rapidly enhanced when increases up to 140 kV/cm. Such behaviors imply that the PNRs are first typically small for low fields and then rapidly become bigger for larger fields, until they percolate at the specific field of 140 kV/cm for the temperature of 380 K. Strikingly, such percolating field of 140 kV/cm is very close to the value of the field at which adopts its maximal value at 380 K [see Fig. 2(a)]. In other words, our results reveal that, close to the critical point (,), the EC coefficient is optimized when percolation of dipoles occurs at the atomistic scale. To know if such fact also holds for higher temperature, one can now pay attention to the data of Fig. 4(b) corresponding to 500 K. In that case, the percolating field is close to 554 kV/cm, which is larger than the field of 290 kV/cm at which is maximum at 500 K [see Fig. 2(b)] (note also that the average cluster size at low fields is now close to 2.5 at 500 K [see the inset of Fig. 4(b)], which is smaller than 4 at 380 K, and which explains why one needs larger fields to induce percolation at larger temperature). In other words, percolating fields are not necessarily the fields at which the EC coefficient is optimal for any temperature above . In fact, and as also demonstrated by Fig. 1 that further reports the fields at which percolation occurs for temperatures above , it is only for temperatures lying between 360 and 400 K (that is near the predicted value Prosandeev2015 of the so-called of PMN Viehland1990 ; Dkhil2001 ; Stock2010 ) that the field yielding a maximum of is close to the percolating field.
Let us thus now search for other local features that can better correlate with the enhancement of the EC coefficient for both 380 and 500 K. For that, we computed the percentage of dipoles in the supercell that lie near (namely, within 25∘) the [11], [11] or [11] pseudocubic directions, as a function of the magnitude of the dc electric field (that, we recall, is applied along [111]). In other words, we numerically determined the percentage of dipoles lying near all the rhombohedral directions that have a positive projection on the applied field, at the sole exception of this applied [111] direction. Figures 5(a) and 5(b) show such percentage at 380 and 500 K, respectively, and reveal that it exhibits a maximum at some specific temperature-dependent field. Interestingly, such latter fields are basically those associated with the maximal values of at 380 and 500 K [see Figs. 2(a) and 2(b)]. In other words, the optimal for temperatures of 380 and 500 K (which is characteristic of the maximal field-induced change of entropy at these temperatures) is accompanied by subtle local rearrangements of the dipolar pattern in PMN. We also numerically checked (not shown here) that at even higher temperature, such as 700 K, is also associated with such aforementioned local features involving dipoles lying near the [11], [11] or [11] pseudocubic directions. Note also that correlation between enhancement of EC coefficients and occurrence of local features was found in the lead-free BZT relaxor ferroelectric too Jiang2017 , except that the precise local quantity associated with is different between BZT and PMN – likely because the field was applied along [001] rather than [111] in our previous study about EC coefficient in BZT Jiang2017 . As a matter of fact, the dipoles involved in the local features of BZT inherent to the enhancement of are those pointing near the four <111> pseudocubic directions having a positive z component, that are [111], [11], [11] and [1].
IV Summary
In summary, we employed the effective Hamiltonian of Ref. [Prosandeev2015, ] to shed some light on electrocaloric effects in PMN. It is particularly striking that such Hamiltonian can qualitatively reproduce not only the peculiar electric field-versus-temperature phase diagram but also the optimization of the EC coefficient near the critical point in this rather complex system. The fact that the recently developed Landau-like model, predicting that the EC coefficient is simply related to the product of temperature and the field derivative of the square of the polarization Jiang2017 , also describes well the EC behavior of PMN as a function of electric field and temperature is also promising for phenomenological modelization of complex inhomogeneous systems. Moreover, we hope that the present discoveries that the giant EC coefficient in the vicinity of the critical point corresponds to the percolation threshold while (the still large) for higher temperatures is related to other specific microscopic features further lead to a better understanding of EC effects and relaxor ferroelectrics. It will also be interesting in a near future to investigate the effect of long-range and/or short-range chemical orders between Mg and Nb ions on the electrocaloric response of PMN, since properties of such system has been shown to be dependent on it Sergey2016 .
Acknowledgements.
Z.J., S. Prokhorenko, and L.B. are grateful for the DARPA Grant No. HR0011-15-2-0038 (MATRIX program) for support. Z.J. also acknowledges support from the National Natural Science Foundation of China (NSFC), Grants No. 11574246, No. 51390472, and No. U1537210, National Basic Research Program of China, Grant No. 2015CB654903, and China Scholarship Council. Y.N. is supported by ARO Grant No. W911NF-16-1-0227. S. Prosandeev is supported by ONR Grants No. N00014-12-1-1034 and N00014-17-1-2818, and Grants No. 3.1649.2017/4.6 from RMES (Russian Ministry of Education and Science), and No. 18-52-0029 Bel_a from RFBR (Russian Foundation for Basic Research). We also acknowledge funding from the Luxembourg National Research Fund through the intermobility (Grant No. 15/9890527 Greenox, J.Í. and L.B.) program. Some computations were also made possible owing to MRI Grant No. 0722625 from NSF, ONR Grant No. N00014-15-1-2881 (DURIP), and a Challenge grant from the Department of Defense.References
- (1) M. E. Lines and A. M. Glass, Principles and Applications of Ferroelectrics and Related Materials (Oxford University Press, New York, 1977).
- (2) F. Jona and G. Shirane, Ferroelectric Crystals (Dover Publications, New York, 1993).
- (3) J. F. Scott, Annu. Rev. Mater. Sci. 41, 229 (2011).
- (4) A. S. Mischenko, Q. Zhang, J. F. Scott, R. W. Whatmore, and N. D. Mathur, Science 311, 1270 (2006).
- (5) A. S. Mischenko, Q. Zhang, R. W. Whatmore, J. F. Scott, and N. D. Mathur, Appl. Phys. Lett. 89, 242912 (2006).
- (6) Z. Kutnjak, B. Rožič, and R. Pirc, Electrocaloric Effect: Theory, Measurements, and Applications (Wiley Encyclopedia of Electrical and Electronics Engineering, 2015).
- (7) Electrocaloric Materials, edited by T. Correia and Q. Zhang (Springer, Berlin, 2014).
- (8) Y. Bai, G.-P. Zheng, and S.-Q. Shi, J. Appl. Phys. 108, 104102 (2010).
- (9) X. Moya, S. K.-Narayan, and N. D. Mathur, Nat. Mater. 13, 439 (2014).
- (10) X. Q. Liu, T. T. Chen, Y. J. Wu, and X. M. Chen, J. Am. Ceram. Soc. 96, 1021 (2013).
- (11) Y. Liu, I. C. Infante, X. Lou, D. C. Lupascu, and B. Dkhil, Appl. Phys. Lett. 104, 012907 (2014).
- (12) M. Sanlialp, V. V. Shvartsman, M. Acosta, B. Dkhil, and D. C. Lupascu, Appl. Phys. Lett. 106, 062901 (2015).
- (13) K. Uchino, Ferroelectric Devices (Marcel Dekker, New York, 2000), Chap. 6.
- (14) S. Prosandeev, I. Ponomareva, and L. Bellaiche, Phys. Rev. B 78, 052103 (2008).
- (15) S. Lisenkov and I. Ponomareva, Phys. Rev. B 80, 140102 (2009).
- (16) I. Ponomareva and S. Lisenkov, Phys. Rev. Lett. 108, 167604 (2012).
- (17) M. C. Rose and R. E. Cohen, Phys. Rev. Lett. 109, 187604 (2012).
- (18) M. Marathe, A. Grünebohm, T. Nishimatsu, P. Entel, and C. Ederer, Phys. Rev. B 93, 054110 (2016).
- (19) M. Marathe, D. Renggli, M. Sanlialp, M. O. Karabasov, V. V. Shvartsman, D. C. Lupascu, A. Grünebohm, and C. Ederer, Phys. Rev. B 96, 014102 (2017).
- (20) W. Geng, Y. Liu, X. Meng, L. Bellaiche, J. F. Scott, B. Dkhil, and A. Jiang, Adv. Mater. 27, 3165 (2015).
- (21) E. Defay, S. Crossley, S. KarNarayan, X. Moya, and N. D. Mathur, Adv. Mater. 25, 3337 (2013).
- (22) Y. Liu, B. Dkhil, and E. Defay, ACS Energy Lett. 1, 521 (2016).
- (23) Y. Liu, H. Strozyk, B. Dkhil, and E. Defay, Appl. Phys. Lett. 109, 212902 (2016).
- (24) G. G. Guzmán-Verri and P. B. Littlewood, APL Mater. 4, 064106 (2016).
- (25) M. Marathe and C. Ederer, Appl. Phys. Lett. 104, 212902 (2014).
- (26) B. Rožič, M. Kosec, H. Uršič, J. Holc, B. Malič, Q. M. Zhang, R. Blinc, R. Pirc, and Z. Kutnjak, J. Appl. Phys. 110, 064118 (2011).
- (27) G. Burns and F. H. Dacol, Phys. Rev. B 28, 2527 (1983).
- (28) H. Vogel, Phys. Z. 22, 645 (1921).
- (29) G. S. Fulcher, J. Am. Ceram. Soc. 8, 339 (1925).
- (30) I.-K. Jeong, T. W. Darling, J. K. Lee, Th. Proffen, R. H. Heffner, J. S. Park, K. S. Hong, W. Dmowski, and T. Egami, Phys. Rev. Lett. 94, 147602 (2005).
- (31) B. Dkhil, P. Gemeiner, A. Al-Barakaty, L. Bellaiche, E. Dul’kin, E. Mojaev, and M. Roth, Phys. Rev. B 80, 064103 (2009).
- (32) O. Svitelskiy, D. La-Orauttapong, J. Toulouse, W. Chen, and Z.-G. Ye, Phys. Rev. B 72, 172106 (2005).
- (33) Y. Nahas, S. Prokhorenko, I. Kornev, and L. Bellaiche, Phys. Rev. Lett. 116, 127601 (2016).
- (34) A. R. Akbarzadeh, S. Prosandeev, E. J. Walter, A. Al-Barakaty, and L. Bellaiche, Phys. Rev. Lett. 108, 257601 (2012).
- (35) A. Al-Barakaty, S. Prosandeev, D. Wang, B. Dkhil, and L. Bellaiche, Phys. Rev. B 91, 214117 (2015).
- (36) Z. Jiang, S. Prokhorenko, S. Prosandeev, Y. Nahas, D. Wang, J. Íñiguez, E. Defay, and L. Bellaiche, Phys. Rev. B 96, 014114 (2017).
- (37) W. Zhong, D. Vanderbilt and K. M. Rabe, Phys. Rev. B 52, 6301 (1995).
- (38) S. Bin-Omran, I. A. Kornev, and L. Bellaiche, Phys. Rev. B 93, 014104 (2016).
- (39) Z. Kutnjak, B. Vodopivec, and R. Blinc, Phys. Rev. B 77, 054102 (2008).
- (40) X. Zhao, W. Qu, X. Tan, A. A. Bokov, and Z.-G. Ye, Phys. Rev. B 75, 104106 (2007).
- (41) Z. Kutnjak, R. Blinc, and Y. Ishibashi, Phys. Rev. B 76, 104102 (2007).
- (42) See Supplemental Material for more details about the EC effects in PMN.
- (43) L. Xu, P. Kumar, S. V. Buldyrev, S.-H. Chen, P. H. Poole, F. Sciortino, and H. E. Stanley, Proc. Natl. Acad. Sci. U.S.A. 102, 16558 (2005).
- (44) G. Simeoni, T. Bryk, F. Gorelli, M. Krisch, G. Ruocco, M. Santoro, and T. Scopigno, Nat. Phys. 6, 503 (2010).
- (45) B. Xu, J. Íñiguez, and L. Bellaiche, Nat. Commun. 8, 15682 (2017).
- (46) S. Prosandeev, D. Wang, A. R. Akbarzadeh, B. Dkhil, and L. Bellaiche, Phys. Rev. Lett. 110, 207601 (2013).
- (47) D. Stauffer and A. Aharony, Introduction to Percolation Theory (Taylor & Francis, London, 1994).
- (48) D. Viehland, S. J. Jang, L. E. Cross, and M. Wuttig, J. Appl. Phys. 68, 2916 (1990).
- (49) B. Dkhil, J. M. Kiat, G. Calvarin, G. Baldinozzi, S. B. Vakhrushev, and E. Suard, Phys. Rev. B 65, 024104 (2001).
- (50) C. Stock, L. VanEijck, P. Fouquet, M. Maccarini, P. M. Gehring, G. Xu, H. Luo, X. Zhao, J.-F. Li, and D. Viehland, Phys. Rev. B 81, 144127 (2010).
- (51) S. Prosandeev and L. Bellaiche, Phys. Rev. B 94, 180102 (2016).