Further author information: (Send correspondence to E.S.D.)
E.S.D.: E-mail: douglase@bu.edu
Wavefront Sensing in Space: Flight Demonstration II of the PICTURE Sounding Rocket Payload
Abstract
A NASA sounding rocket for high-contrast imaging with a visible nulling coronagraph, the Planet Imaging Concept Testbed Using a Rocket Experiment (PICTURE) payload, has made two suborbital attempts to observe the warm dust disk inferred around Epsilon Eridani. The first flight in 2011 demonstrated a 5 milliarcsecond fine pointing system in space. The reduced flight data from the second launch, on 25 November 2015, presented herein, demonstrate active sensing of wavefront phase in space. Despite several anomalies in flight, post-facto reduction phase stepping interferometer data provides insight into the wavefront sensing precision and the system stability for a portion of the pupil. These measurements show the actuation of a 3232-actuator microelectromechanical system deformable mirror. The wavefront sensor reached a median precision of 1.4 nanometers per pixel, with 95% of samples between 0.8 and 12.0 nanometers per pixel. The median system stability, including telescope and coronagraph wavefront errors other than tip, tilt, and piston, was 3.6 nanometers per pixel, with 95% of samples between 1.2 and 23.7 nanometers per pixel.
keywords:
Visible Nulling Coronagraph, Interferometry, Sounding Rockets, Wavefront Sensing, Deformable Mirrors, Active Optics, Direct imaging, High-contrast Imaging, Debris Disks, Exozodi, Exoplanets1 INTRODUCTION
Resolving reflected light from planets in distant star systems analogous to our own solar system requires overcoming exoplanet-host star flux ratios between 10-9 and 10-11. Imaging at these extreme contrast ratios[1, 2] will be enabled by coronagraphs on the next generation of space telescopes. Coronagraphs block light from the host star and transmit light from dim companions to a detector. An internal coronagraph suppresses starlight between the primary mirror and the detector image plane of a telescope. Coronagraphy requires wavefront stability, and with stellar leakage typically proportional to the square of the wavefront error dynamic and static aberrations in wavefront phase must be controlled to nanometer levels to detect self-luminous giant planets and debris disks[3]. Detection of terrestrial planets requires picometer level control[4, 5].
The suborbital PICTURE [6, 7, 8, 9, 10, 11, 12] sounding rocket payload employs an internal Visible Nulling Coronagraph (VNC), behind a half-meter telescope, intended to perform high-contrast observations of exozodiacal dust in space while demonstrating internal coronagraphy along with the requisite wavefront sensing and control.
1.1 Objectives
The PICTURE observational objective was to measure the scattered light from exozodiacal dust around Epsilon Eridani ( Eri) at visible wavelengths (600 nm to 750 nm). Eri has a large infrared excess at 20 m which has been attributed to a dusty exozodiacal debris disk[13]. With an expected integrated brightness of approximately 2, this dust may be arranged in a thin ring[14, 15]. The PICTURE missions planned to test for emission at separations from 2 AU to 20 AU, constraining scattered light brightness and morphology and advancing our knowledge of the dust composition around sun-like stars. The predicted ring of emission would provide a relatively bright target for high-contrast imaging. The instrument development carried out to achieve these objectives matures coronagraphy and wavefront sensing technology[12].
1.2 Wavefront Control
Deviations from uniformity in both phase and amplitude contribute to coronagraph leakage[16, 3]; however, the PICTURE VNC only corrects for, more significant, phase errors. Thus, for brevity, in this work Wavefront Error (WFE) will refer solely to phase errors. Space-based telescopes are unaffected by atmospheric turbulence, enabling diffraction limited imaging even at visible wavelengths. In space, time-varying WFE primarily arises from the coupling of mechanical and thermomechanical perturbations of the spacecraft structure to the alignment and surfaces of optical components.
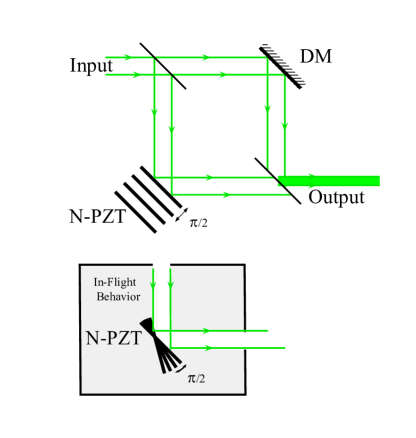
The ongoing Gaia mission employs a passive Shack-Hartmann wavefront sensor[17] and a wide variety of new wavefront sensing techniques are being developed for future space telescopes[18, 19, 20]. A simplified optical layout in Fig. 1 shows how the PICTURE VNC interferes the white-light fringes of two offset (or “sheared”) copies of the input telescope pupil in a Mach-Zender instrument with a phase offset between the two pupils. Active wavefront phase sensing is implemented in the PICTURE VNC using phase stepping interferometry[21], where the intensity is measured at multiple points across the fringe pattern by changing the relative path length before beginning science observations. Basics of the VNC wavefront sensing are further described in the Appendix and details of the coronagraph implementation and optical design are given elsewhere[8, 10, 12].
1.3 Deformable Mirrors
Deformable Mirror (DM) s enable precision wavefront control by dynamically minimizing the WFE across a range of spatial frequencies. The PICTURE VNC employs a DM to minimize the path difference between the between the two arms of the interferometer, enabling the nulling of starlight even in the presence of wavefront error between the sheared pupil sub-apertures. Numerous DM technologies exist or have been proposed, including piezoelectric[22], thermoelectric coolers[23], ferrofluid [24], and microelectromechanical systems (MEMS) [25]. Compact size, high-actuator count, low-power consumption, and extensive use in ground-based adaptive optics[26] make MEMS DM s particularly desirable for space-based applications. MEMS DM s typically rely on voltages up to 250 V to electrostatically displace a membrane on sub-angstrom to micron scales[25]. There are few references to MEMS optical device operation in space. Yoo et al.[27] found a non-deformable (on-off only) MEMS micromirror device maintained functionality after undergoing launch and was successfully operated on the International Space Station (ISS). A magnetically actuated MEMS microshutter array has been flown on the Far-ultraviolet Off Rowland-circle Telescope for Imaging and Spectroscopy (FORTIS) sounding rocket[28]. Finite element modeling has been used to predict the survival of MEMS DM s subjected to launch[29], but survival in a harsh launch environment has not been found previously demonstrated in the literature.
The PICTURE DM is a Boston Micromachines 32 32 square Kilo-DM with a 1.5 m stroke, a continuous gold-coated silicon membrane, a 340 m actuator pitch, and custom drive electronics[8]. Actuator drive voltages are limited to 150 V to prevent actuator snap down[26]. To avoid chromatic optical path mismatch between the two VNC arms, the DM lacks the protective window commonly included to prevent mirror surface contamination.
1.4 Sounding Rocket Flights
Flight I of the PICTURE payload launched[9, 10, 30, 31] aboard NASA sounding rocket 36.225 UG (a Black Brant IX University Galactic Astronomy mission) on 8 October 2011 from White Sands Missile Range (WSMR). The flight suffered a telemetry failure approximately seventy seconds after launch during calibration observations of Rigel. Unfortunately, limited wavefront sensor (WFS) data was transmitted before a telemetry relay failed[32] and no interference fringes were observed, preventing wavefront sensing or nulling. A second mission, renamed PICTURE-B (Planet Imaging Coronagraphic Technology Using a Reconfigurable Experimental Base) refurbished and relaunched the same payload with minor modifications in the fall of 2015. The results of this nearly identical mission, which had the same science goals as the original flight, are discussed in this paper.
The flight data presented herein was collected during flight of the refurbished payload, PICTURE-B (NASA 36.293 UG), launched from WSMR at 9:17 p.m. MST November 24th (25 November 2015 0417 UT). The payload design, concept of operations, and the Flight I telemetry failure were described previously by Mendillo et al.[10], and refurbished telescope and nulling coronagraph integration and laboratory performance were summarized by Chakrabarti et al[12]. Fortunately, the Flight II (36.293) telemetry system performed as designed, and data were redundantly stored onboard, providing far more insight into instrument performance in flight. In this work we focus on the operation of the WFS and DM in space during Flight II. Section 2 briefly summarizes the refurbishment of the payload. Section 3 describes the flight observation sequence and the anomalous WFS measurements recorded in flight. Section 4 details the post-processing methods used to interpret the flight data. Section 5 presents the estimated precision of these measurements. Finally, Section 6 remarks on conclusions and future directions.
2 Refurbishment
2.1 Deformable Mirror
The cabling to the DM was damaged during the assembly of the payload for Flight I. Thus, a new polyimide flex cable assembly was manufactured and installed along with a replacement Boston Micromachines Corporation Kilo-DM (S.N. 11W310#002). MEMS DM actuator yield has improved greatly over time: early Kilo-DM models had yield as low as 96.9%[33], whereas this DM has two inactive actuators (a 99.8% yield). Fortunately, both inactive actuators were positioned behind the Lyot mask, which blocks un-interfered light from behind the sheared secondary obscurations, allowing phase control across the entire output pupil. To best match reflectivity between the interferometer arms, a new Nuller piezoelectric transducer (N-PZT) mirror, coated in the same chamber as the replacement DM, was also installed. Located in the VNC arm opposite the DM, the N-PZT mirror is mounted on a Physik Instrumente S-316 piezoelectric stage, driven by custom electronics, which corrects tip, tilt, and piston (T/T+piston) errors between the two interferometer arms with maximum piston range of approximately 8.5 m. The two optics were aligned in the laboratory such that the N-PZT mirror flattened the wavefront error in the VNC at room temperature in the middle of the piezoelectric stage’s range.
2.2 Preflight Testing
The VNC was tested post-refurbishment, without the telescope, using a simulated point source and a retro-reflecting mirror. The contrast was found to be comparable to previous tests with central star leakage of approximately [8, 12]. The VNC residual wavefront error at DM controllable spatial frequencies was corrected to an root mean squared error (RMSE) phase of 5.7 nm2.6 nm[34]. The fully assembled payload was tested end-to-end on a vibration suppressing optical table and nulling was observed [12].
The integrated payload was shake-tested at WSMR to Vehicle Level Two random thrust vibration[35, Table 6.3.4-1]. The sounding rocket payload assembly provides some damping and the integrated acceleration of the nuller assembly during the random vibration was 10.4 g root mean squared (RMS) versus the 12.7 g RMS input.
3 Observations
3.1 Target Acquisition
Both Flight I and II used Rigel ( Orionis, =0.13) as the initial calibration star. Unfortunately, neither flight successfully advanced from Rigel to Eri. During both missions, a manual uplink successfully provided the pointing correction to the Attitude Control System (ACS), placing Rigel on the angle tracker camera near the nominal t+105 second observing start time. Additional uplinks commanded centering of the star on the angle tracker to the ACS accuracy of approximately 1 arcsecond. Once Rigel was centered, the fine pointing system (FPS) control loop locked, providing pointing precision of approximately five milliarcseconds (1), consistent with Flight I[9].
After acquisition and FPS lock, three attitude control system maneuvers were planned: 1) Nuller alignment and 10 seconds of speckle observations on Rigel, 2) Slew to Eri and observe the circumstellar environment, 3) Roll payload 90 degrees during the Eri observation to characterize speckles. Flight II did not complete nuller alignment, but a number of on-star observations were recorded.
3.2 Data Products
Two cameras observed the VNC output after the Lyot stop, which transmitted only regions where the two sheared interferometer arms overlap, the science camera to image the sky and the WFS camera to image the interference fringes in the pupil plane. Cut-off filters limited the observed bandwidth of both cameras to between 600 nm and 750 nm. Due to lack of nulling, the science camera saturated throughout the flight and will not be considered further. The WFS and science cameras were CCD detectors developed for the Astro-E2 X-ray Imaging Spectrometer[36]. These 10241024 pixel MIT Lincoln Laboratory model CCID41 detectors were cryogenically cooled to -70∘C for a dark noise of approximately 1 e-/s/pixel. In order to allow short exposure times, only small subregions were read-out from each camera. The WFS readout area was 76 pixel 76 pixel. The integration time of each WFS frame time was 0.23 seconds. The laboratory measured read noise rate was 2.3 e- per pixel per exposure.
3.3 Wavefront Sensing Data
During Flight II the Wavefront Control System (WFCS) advanced to the VNC phase-up or “coarse mode” [detailed in Fig 9][10] stage of wavefront sensing and low-order correction. This included locating the white-light fringe packet; applying a predetermined set of voltages to the DM, thereby removing the stress-induced surface concavity from fabrication[37]; and low-order WFE correction of between the interferometer arms with the N-PZT mirror in T/T+piston. In the planned flight sequence, phase-up was followed by fine correction of higher spatial frequencies with the DM and finally a transition to nulling mode with the N-PZT shifted to the dark fringe for high-contrast science observation over the remainder of the flight.
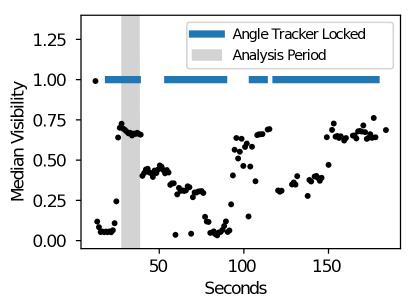
Flight II did not reach the fine-mode correction or nulling modes because the wavefront could not be flattened, likely due to shift in the DM mount, as discussed in Sec. 5.1. Fringe visibility was used as the in-flight metric of coherence and is calculated from the maximum and minimum intensity in a pixel, : Black dots in Fig. 2 show this median versus time at the WFS’ approximately 1 sec cadence. The closed-loop correction of wavefront mismatch between the arms with the DM was not initiated because the fringe packet was outside the range of the N-PZT to correct T/T+piston errors, keeping below the threshold to advance modes. The magnitude of this misalignment is estimated in Section 5.1. The phase-up flattening mode required accurate measurements of the WFE. Thus, the mission returned measurements of phase error and WFS stability; the remainder of this analysis will focus solely on this WFS camera data.
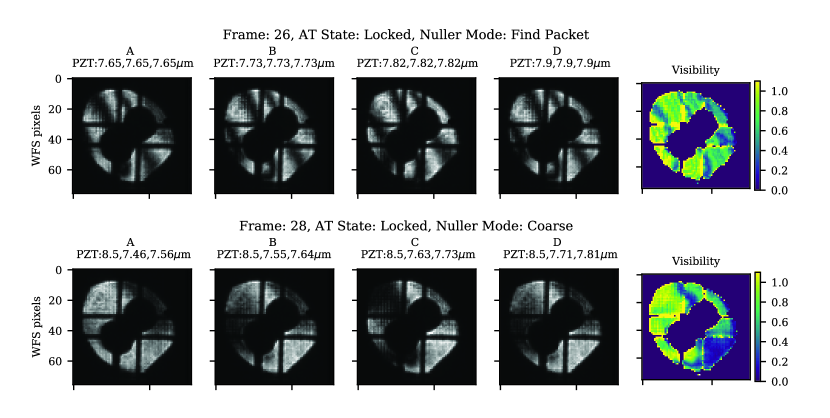
The example sets of interferometric WFS images shown in Fig. 3 typify the range of raw measurements recorded over the course of the flight. While the wavefront was not flattened, these fringes are visible across the pupil plane images recorded by the WFS camera and provide insight into the alignment of the VNC and the state of the DM. Each row of Fig. 3 is an example set of fringe measurements from different times in the flight. Each set of fringe measurements corresponds to a wavefront sensor image at four unique Optical Path Difference (OPD) points, separated by radians, which together are used to reconstruct the WFE at a point in the flight (see illustration in Fig. 1 and derivation in Appendix). The left four columns illustrate the background subtracted raw intensity. (Background noise levels were calculated from the median of WFS exposures recorded in-flight before and after the Rigel observation.) When the system was first powered on the WFS fringe was low, as seen in the top row of Fig. 3. The N-PZT was functioning normally, stepping steps, but far from the center of the coherent fringe packet, as the fringe flattening T/T+piston correction had not yet been applied. The sequence of high- measurements, as seen in the bottom row of Fig. 3, were recorded at the beginning of the flight when the flight software was attempting to flatten the OPD across the pupil (the analysis period, shaded in Fig. 2). The bottom row of Fig. 3 is representative of this series of phase-up measurements which will be used for the bulk of the following analysis. The map of per-pixel in the rightmost column of Fig. 3 is higher on the left side of of the WFS image but decreases towards the lower right because the N-PZT actuator in that corner is out of range and “railed” at the maximum displacement, indicating the the central white light fringe was just beyond the range of the stage. The geometry of this anomalous behavior is shown schematically in the inset of Fig. 1.
A high visibility, across the pupil was expected; however, the median flight visibilities never exceeded 0.8 due to incomplete stepping of the N-PZT mirror, as will be described in Sec. 3.3. Before the telescope shutter closed for reentry, several unsuccessful attempts were made to repoint the payload via human-in-the-loop command uplinks from the ground to bring the N-PZT into piston range. This caused low during each pointing maneuver and re-acquisition of Rigel by the FPS. Closed-loop FPS control was lost during repointing, as seen in the “lock” status of the FPS angle tracker. This status is plotted as a horizontal line in Fig. 2. The futility of these attempts is seen in the increased variability of the as a function of time, as telescope focus deteriorated and the coherent fringe packet drifted further out of the N-PZT range. The focus degraded due to thermal gradients across the telescope optical bench (see Douglas[34] for details on the thermal environment and the evolution of the Point Spread Function (PSF) as measured by the FPS camera).
4 Methods
The PICTURE design leverages the interferometric nature of a nulling coronagraph to directly measure wavefront error by imaging the pupil at the science output of the VNC. Before nulling, the wavefront into the system must first be measured and corrected to flatten the interference fringe. This section describes issues encountered in flight, and post-facto analysis to retrieve the phase which will be used to quantify WFS performance and show actuation of the deformable mirror surface.
The VNC control software expected phase steps to calculate the WFE error (Appendix Eq. 2) to be corrected by the N-PZT and DM [10]. During Flight II one of the three piezo actuators translating the N-PZT mirror was railed high for many of the ABCD measurements, while the other two actuators moved the mirror in steps, causing a varying phase shift () across the pupil image.
This is particularly true of the high- measurements (e.g., bottom panels of Fig. 3) where the path length between the arms was best matched, meaning the railed images are also the measurements with the most coherent interference. In order to better estimate the uncertainties in the returned data given the anomalous N-PZT steps, raw intensity maps are re-reduced to find the best-fit phase in each pixel. We recover the WFE from these maps by fitting the phase in each pixel, as described in the Appendix.
5 Wavefront Sensor Results
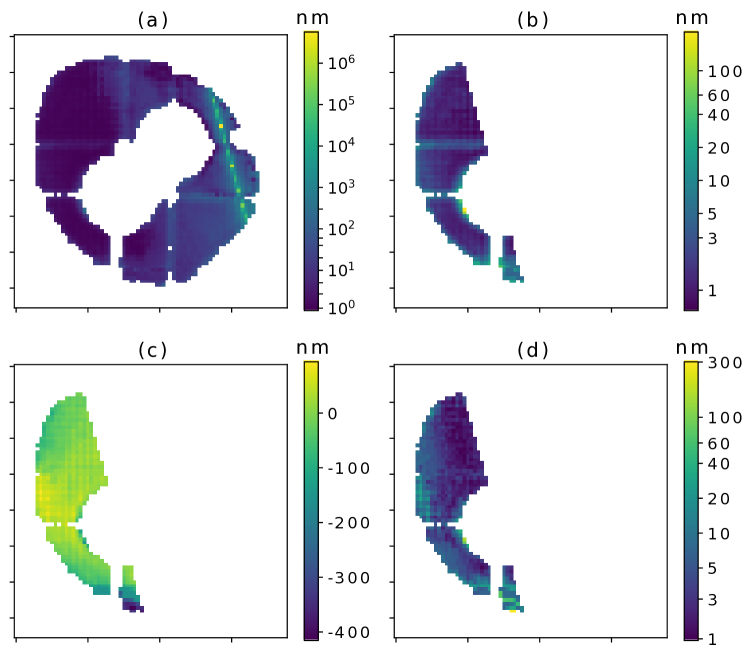
This section presents a stability analysis of the in-flight wavefront error during the period of consecutive phase-up measurements recorded after the FPS first locked and before repointing was attempted. These ten ABCD image sets and phase measurements, calculated a described in the Appendix, correspond to the best instrument focus and the highest- fringes. The mean precision of each phase measurement, mapped in Fig. 4(a), is the standard deviation of the phase fitting error, including photon noise, for each of the pixels across the pupil. This mean measurement error across the interfering pupil becomes highly uncertain (exceeding radians) where the phase steps become small due to lack of relative motion of the N-PZT mirror.
In order to compare the wavefront sensor precision to the expected performance of a fully stepping wavefront sensor, we define a sufficiently stepping region and exclude the regions of the pupil where the N-PZT step-size was relatively small (below ). This sufficiently stepped region has an area of 759 WFS pixels (35% of the pupil area), providing a relatively large sample with which to assess the instrument stability and sensing precision. The mean of the standard fitting error across this region, Fig. 4(a), is less than and relatively uniform.
To assess the wavefront sensing stability, T/T+piston errors are subtracted from each phase measurement by fitting a two dimensional plane to the remaining phase pixels, because the N-PZT was operating in a closed-loop correction mode and each N-PZT position varied slightly. Due to the shearing mechanism of the VNC, this approach also removes errors due to changes in telescope focus and astigmatism[34]. The mean map of the T/T+piston subtracted phase measurements in the ¿ step region, Fig. 4(c), is relatively uniform with a drop off at the bottom of the map where the uncertainty is also higher. The system stability, including both the telescope and VNC, is measured by taking the standard deviation of the recovered phase in each pixel across the ten recorded WFS sequences, Fig. 4(d).
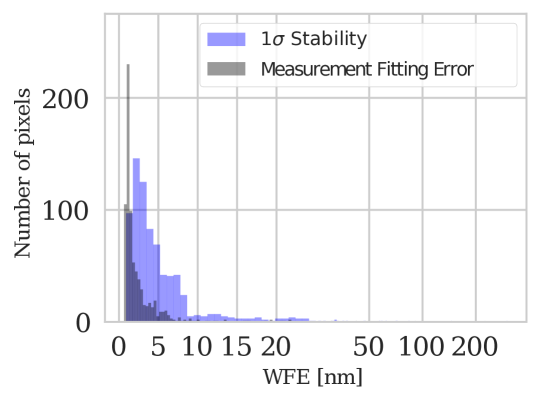
The distributions of uncertainty for both the measurement error (dark gray, Fig. 5) and the system stability (light blue, Fig. 5), exhibit strong peaks at a few nanometers with median values of 1.4 nm/pixel and 3.6 nm/pixel, respectively. These distributions of WFE per pixel exhibits long tails, or a few pixels with very high uncertainty. These pixels corresponds to the low- region at the bottom edge of the pupil. Since the distributions are highly skewed, the range of values is well represented by calculation of the sample interval, the percent of values within a range. Sample intervals were calculated using the mquantiles statistics function with default values as implemented in SciPy[38] version 0.19. A 95% sample interval of the wavefront stability spans from 1.2 nm/pixel to 23.7 nm/pixel. The wavefront sensor fitting error sample interval spans from 0.8 nm/pixel to 12.0 nm/pixel.
5.1 Discussion
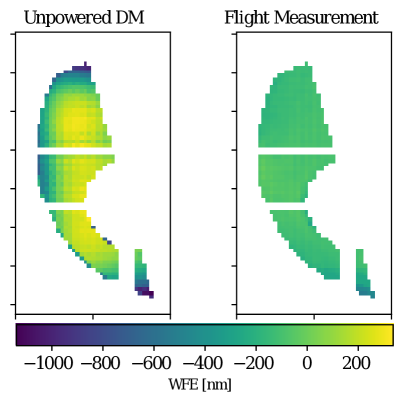
The in-flight wavefront error lacks the stress-induced surface concavity expected for the unpowered DM. This is illustrated in Fig 6, the left panel presents an unpowered laboratory surface measurement, rescaled to correspond to wavefront error in the interferometer (, where is the angle of incidence), and masked before subtraction of T/T+piston terms. The unpowered WFE exceeds a micron and exhibits a clear roll-off toward the edges of the square DM. In contrast, the WFE measured in flight (right panel, Fig. 6) is nearly flat, with a few hundred nanometer downturn at the bottom of the pupil, where measurement errors are highest (Figs. 4(b) and (d). This indicates that the DM was powered on, and the measured actuators were responding appropriately, moving to the commanded default positions.
The observed fringe provides a first-order estimate of the N-PZT mirror position relative to the center of the fringe packet. The translating mirror was originally aligned to the mid-point of the 8.5 micron range. As discussed in the Appendix, the coherence length of the VNC is approximately 3 m. The visibility was moderate, with approximately one wave of phase tilt across the pupil in the first measurement (Fig. 3, top row). Thus, the central fringe was within a few microns of the N-PZT limit, implying a total motion of no more than half the range plus the coherence length or 7 m from the original alignment at the center of the N-PZT range. Post-flight laboratory testing found a displacement consistent with this estimate; the optimal N-PZT mirror position has shifted several microns compared to the prelaunch alignment, implying minimal movement during re-entry and recovery.
This shift is likely due to motion of the 6-degrees-of-freedom DM mount. Whether this shift occurred due to launch forces or upon reentry and impact cannot be definitively determined since a flight shift of the N-PZT or DM mounts could also have been due to a large temperature gradient within the payload. However, the DM mount temperature was stable to approximately 0.3∘ C in flight[34] and prior laboratory tests found the VNC path length has an approximately 700 nm/∘C dependency[31], well within the range of the N-PZT to correct. Random vibration is a large contributor to optical bench instability in spacecraft[39], making the sounding rocket launch environment the most likely cause of a few micron displacement. This suggests improved mount designs, or additional active correction stages, are required for future missions with micron-scale alignment tolerances. While the payload underwent random vibration before launch, the launch of a sounding rocket also subjects the payload to additional acoustic loads (sound pressure levels typically exceed 100 dB [40]), as well as continuous vertical launch acceleration and centripetal acceleration due to the 4 Hz rotation of the sounding rocket[35]. Constant acceleration in particularly is difficult to replicate in testing and may have contributed inelastic deformation or slippage of the DM mounting structure.
The stability of the WFS measurements indicates the DM surface and the step positions were relatively stable and lower than the laboratory measured stability for the VNC alone (Sect. 2.2). Four wavefront sensor pixels sample each DM actuator; thus, assuming the actuator errors are uncorrelated, the uncertainty in phase per actuator is half the values reported herein. The measurement error in the sufficiently stepping region reached the expected 2 nm wavefront error floor[31] due to photon noise for Rigel. Including the instability, had these WFS measurements been applied to the DM to correct phase mismatch between the VNC arms, theoretical total leakage per actuator due to residual phase error[16] would have been approximately , exceeding laboratory performance.
6 Conclusions
The PICTURE sounding rocket program has advanced exoplanet imaging technology by translating laboratory demonstrated concepts into deployed spaceflight hardware. The PICTURE program has previously demonstrated an FPS that provides precision pointing, and this analysis of the second PICTURE flight shows active wavefront sensing precision at nanometer scales with a VNC. The higher-order WFE was stable over the ten second analysis period, ten times faster than the control loop update rate[10], indicating the residual WFE was correctable by the DM had the loop closed. The difficulty in operating the VNC in space illustrates the challenge of maintaining the alignment of an interferometer. This suggests future work is necessary to increase the robustness of VNC s if they are to be alternatives to more robust coronagraph designs, such as the Shaped Pupil Coronagraph (SPC) [41] or the Vector Vortex Coronagraph (VVC) [42]. One example of a structurally robust interferometer concept is the monolithic achromatic nulling interference coronagraph[43].
The observations described herein also demonstrate the first operation and measurement of a DM for high-contrast imaging in space in reflected light. Several upcoming missions will continue progress in high-contrast imaging from space over longer durations and/or larger telescope apertures. The Planetary Imaging Concept Testbed Using a Recoverable Experiment - Coronagraph (PICTURE – C) high-altitude balloon will demonstrate wavefront sensing and control of both phase and amplitude with a VVC [44, 45] over a timescale of hours with a half-meter telescope. The DM Demonstration Mission CubeSat[46] is being built as a MEMS DM testbed to operate for over a year in low-Earth with an few centimeter diameter telescope. The Wide-Field InfrarRed Survey Telescope (WFIRST) coronagraph instrument[47] is planned to demonstrate wavefront sensing and control for both SPC and hybrid-lyot internal coronagraphs behind an obscured telescope aperture during a multiyear mission.
Acknowledgements.
The PICTURE-B team would like to thank the NASA Sounding Rocket Program Office, the Wallops Flight Facility, and the Orbital ATK NSROC II team for their support, particularly our mission managers: Christine Chamberlain and David Jennings. We are also deeply indebted to everyone in the WSMR Naval Research Rocket Support Office and NMSU Physical Science Laboratory teams for their leadership and assistance. This work was supported by NASA grants NNG05WC17G, NNX11AD53G, NNX13AD50G,NNX15AG23G, and through graduate fellowships awarded to E.S. Douglas by the Massachusetts Space Grant Consortium. Computing resources were provided by two interfaces to the Massachusetts Green Computing Facility: MIT Research Computing and the Boston University Scientific Computing Cluster. Special thanks to Brian A. Hicks of NASA Goddard Space Flight Facility, Benjamin F. Lane of MIT Draper Laboratory, and Shanti Rao and J. Kent Wallace of the Jet Propulsion Laboratory. The Boston University Scientific Instrument Facility worked tirelessly to support to integration of both PICTURE payloads. Paul Bierden, Charles Conway, and the rest of the staff of Boston Micromachines Corporation provided invaluable support to this project. The staff at AOA Xinetics Northrop Grumman and John G. Daly of Vector Engineering provided essential support to the refurbishment of the flight telescope. E.S.D. would especially like to thank Catherine Espaillat, Alan Marscher, Donald W. McCarthy, and Michael Mendillo for their valuable input. This research made use of community-developed core Python packages, including: Astropy[48], Matplotlib[49], SciPy[38], and the IPython Interactive Computing architecture [50]. Additional data analyses were done using IDL (Exelis Visual Information Solutions, Boulder, Colorado). This research has made use of the SIMBAD database, operated at CDS, Strasbourg, France.
Disclosures
The authors have no financial interests to disclose.
7 Appendix: Calculating the phase
In the nulling coronagraph architecture[51] (“nuller”) two equal intensity beams of quasi-coherent starlight, collected by apertures separated by a baseline (interferometer “arms”) with a relative phase shift of are combined to form a fringe pattern on the sky. When recombination occurs at a beamsplitter, the output is divided into two paths: the “dark fringe” path where starlight destructively interferes (“nulling”), and a second path where light constructively interferes, the “bright fringe”. Nulling coronagraphy requires coherent interference, which means the absolute path between each interferometer arm must be matched, otherwise the beams are temporally incoherent and interference fringes will not be observed. Within a few wavelengths of this absolute phase shift light remains quasi-coherent, with the VNC bandwidth in wavelength space defining the coherence length of this interference fringe packet. The relative path differences between the two arms of the interferometer depend on the source angle on the sky with respect to the optical axis. Thus, when the fringe pattern is centered on a star, the light from exoplanets at small angular separations is partially transmitted while the starlight is nulled.
The PICTURE VNC design[8] is a uni-axial Mach-Zehnder Lateral Shearing Interferometer (LSI) design[52, 53, 54, 55] with dispersion plates which allow for broadband nulling[56]. By splitting the input wavefront with a beamsplitter and offsetting the two arms laterally, the LSI design allows for interference between two sub-apertures formed from a single telescope pupil at the second beamsplitter.
Simplifying the interference equation[57] by assuming two beams of equal intensity () gives a relation between the phase difference, , and the fringe intensity, ) between the beams:
| (1) |
Here is the coherence between the two beams. is near unity for measurements at the center of the interference fringe packet. The total phase difference can be written as where is the WFE and is a known relative phase step between separate measurements. This allows expansion of the cosine term: . Defining three new variables allows us to simplify the relation, , , and , such that: .
The PICTURE VNC was designed to recover phase by recording WFS intensity measurements as a sequence of four measurements separated by . For convenience, we rename each of these intensities: A, B, C, D. Solving the system of equations composed of the four intensity measurements and the known phase step values permits calculation of the WFE of each pixel in a set of ABCD measurements[58, 21]:
| (2) |
Interference fringes in intensity due to are visible when the path lengths are matched to within the coherence length of the fringe packet. (For the 150 nm bandpass, the coherence length at 675 nm is approximately 3 m.)
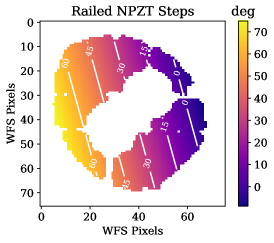
To compensate for the uneven shifting of the N-PZT mirror, an alternative approach to measuring phase was applied. For varying values of , the phase error () can be recovered by least-squares fitting of the intensity () versus phase step-size (). values for each WFS pixel were calculated from commanded N-PZT positions using a laboratory calibrated transformation matrix of N-PZT data values to the T/T+piston values in units of distance. The resulting step map is shown in Fig. 7. Allowing for variation in coherence, we again expand Eq. 1 and fit a model of three unknowns:
| (3) |
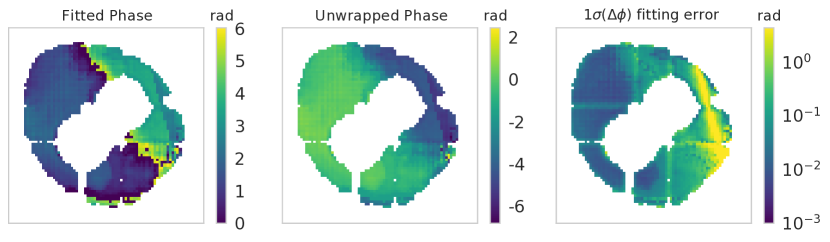
To constrain the problem, bounds were set requiring a coherence between and unity and a phase shift between and . This least squares bound-constrained minimization was solved using the subspace trust region interior reflective algorithm[59] implemented in SciPy 0.19[38]. Least-squares fitting of each pixel was repeated on the four images of a railed measurement with varying values of . The left panel of Fig. 8 shows the resulting phase map. These phase measurements wrap about radians and were unwrapped in order of pixel reliability in a noncontiguous fashion via the Herráez[60] method, middle panel of Fig. 8. The rightmost panel of Fig. 8 shows the corresponding fitting error, including the photon noise, calculated by taking the diagonal of the covariance matrix. The phase error measurement rapidly deteriorates once the phase step across the pupil drops below due to the railed actuator.
References
- [1] M. C. Turnbull, W. A. Traub, K. W. Jucks, N. J. Woolf, M. R. Meyer, N. Gorlova, M. F. Skrutskie, and J. C. Wilson, “Spectrum of a habitable world: Earthshine in the near-infrared,” The Astrophysical Journal 644(1), p. 551, 2006.
- [2] K. L. Cahoy, M. S. Marley, and J. J. Fortney, “Exoplanet Albedo Spectra and Colors as a Function of Planet Phase, Separation, and Metallicity,” ApJ 724, pp. 189–214, Nov. 2010.
- [3] W. A. Traub and B. R. Oppenheimer, “Direct imaging of exoplanets,” in Exoplanets, pp. 111–156, University of Arizona Press, Tucson, AZ, USA, 2010. Seager, S., ed.
- [4] O. Guyon, E. A. Pluzhnik, M. J. Kuchner, B. Collins, and S. T. Ridgway, “Theoretical Limits on Extrasolar Terrestrial Planet Detection with Coronagraphs,” The Astrophysical Journal Supplement Series 167, pp. 81–99, Nov. 2006.
- [5] J. T. Trauger and W. A. Traub, “A laboratory demonstration of the capability to image an Earth-like extrasolar planet,” Nature 446, pp. 771–773, Apr. 2007.
- [6] M. Shao, B. M. Levine, J. K. Wallace, G. S. Orton, E. Schmidtlin, B. F. Lane, S. Seager, V. Tolls, R. G. Lyon, R. Samuele, D. J. Tenerelli, R. Woodruff, and J. Ge, “A nulling coronagraph for TPF-C,” Proc. SPIE 6265, pp. 626517–626517, June 2006.
- [7] R. Samuele, J. Wallace, E. Schmidtlin, M. Shao, B. Levine, and S. Fregoso, “Experimental Progress and Results of a Visible Nulling Coronagraph,” in 2007 IEEE Aero. Conf., pp. 1 –7, Mar. 2007.
- [8] S. R. Rao, J. K. Wallace, R. Samuele, S. Chakrabarti, T. Cook, B. Hicks, P. Jung, B. Lane, B. M. Levine, C. Mendillo, E. Schmidtlin, M. Shao, and J. B. Stewart, “Path length control in a nulling coronagraph with a MEMS deformable mirror and a calibration interferometer,” in Proc. SPIE, 6888, pp. 68880B–68880B, Feb. 2008.
- [9] C. B. Mendillo, S. Chakrabarti, T. A. Cook, B. A. Hicks, and B. F. Lane, “Flight demonstration of a milliarcsecond pointing system for direct exoplanet imaging,” Appl. Opt. 51, pp. 7069–7079, Oct. 2012.
- [10] C. B. Mendillo, B. A. Hicks, T. A. Cook, T. G. Bifano, D. A. Content, B. F. Lane, B. M. Levine, D. Rabin, S. R. Rao, R. Samuele, E. Schmidtlin, M. Shao, J. K. Wallace, and S. Chakrabarti, “PICTURE: a sounding rocket experiment for direct imaging of an extrasolar planetary environment,” in Proc. SPIE, 8442, Sept. 2012.
- [11] E. S. Douglas, K. Hewasawam, C. B. Mendillo, K. L. Cahoy, T. A. Cook, S. C. Finn, G. A. Howe, M. J. Kuchner, N. K. Lewis, A. D. Marinan, D. Mawet, and S. Chakrabarti, “End-to-end simulation of high-contrast imaging systems: methods and results for the PICTURE mission family,” in Proc. SPIE, 9605, pp. 96051A–96051A–13, 2015.
- [12] S. Chakrabarti, C. B. Mendillo, T. A. Cook, J. F. Martel, S. C. Finn, G. A. Howe, K. Hewawasam, and E. S. Douglas, “Planet Imaging Coronagraphic Technology Using a Reconfigurable Experimental Base (PICTURE-B): The Second in the Series of Suborbital Exoplanet Experiments,” Journal of Astronomical Instrumentation 05, p. 1640004, Mar. 2016.
- [13] E. di Folco, O. Absil, J.-C. Augereau, A. Mérand, V. Coudé du Foresto, F. Thévenin, D. Defrère, P. Kervella, T. A. ten Brummelaar, H. A. McAlister, S. T. Ridgway, J. Sturmann, L. Sturmann, and N. H. Turner, “A near-infrared interferometric survey of debris disk stars. I. Probing the hot dust content around ɛ Eridani and τ Ceti with CHARA/FLUOR,” A&A 475, pp. 243–250, Nov. 2007.
- [14] D. Backman, M. Marengo, K. Stapelfeldt, K. Su, D. Wilner, C. D. Dowell, D. Watson, J. Stansberry, G. Rieke, T. Megeath, G. Fazio, and M. Werner, “Epsilon Eridani’s Planetary Debris Disk: Structure and Dynamics Based on Spitzer and Caltech Submillimeter Observatory Observations,” ApJ 690, pp. 1522–1538, Jan. 2009.
- [15] K. Y. L. Su, J. M. D. Buizer, G. H. Rieke, A. V. Krivov, T. Löhne, Massimo Marengo, K. R. Stapelfeldt, N. P. Ballering, and W. D. Vacca, “The Inner 25 au Debris Distribution in the ϵ Eri System,” AJ 153(5), p. 226, 2017.
- [16] E. Serabyn, “Nulling interferometry: symmetry requirements and experimental results,” in Proc. SPIE, 4006, pp. 328–339, 2000.
- [17] L. L. A. Vosteen, F. Draaisma, W. P. Van Werkhoven, L. J. M. Van Riel, M. H. Mol, and G. den Ouden, “Wavefront sensor for the ESA-GAIA mission,” in Astronomical and Space Optical Systems], Society of Photo-Optical Instrumentation Engineers (SPIE) Conference Series, 7439, p. 743914, 2009.
- [18] L. D. Feinberg, B. H. Dean, D. L. Aronstein, C. W. Bowers, W. Hayden, R. G. Lyon, R. Shiri, J. S. Smith, D. S. Acton, L. Carey, A. Contos, E. Sabatke, J. Schwenker, D. Shields, T. Towell, F. Shi, and L. Meza, “TRL-6 for JWST wavefront sensing and control,” p. 668708, Sept. 2007.
- [19] A. Z. Greenbaum and A. Sivaramakrishnan, “In-focus wavefront sensing using non-redundant mask-induced pupil diversity,” Opt. Express, OE 24, pp. 15506–15521, July 2016.
- [20] F. Shi, K. Balasubramanian, R. Bartos, R. Hein, R. Lam, M. Mandic, D. Moore, J. Moore, K. Patterson, I. Poberezhskiy, J. Shields, E. Sidick, H. Tang, T. Truong, J. K. Wallace, X. Wang, and D. W. Wilson, “Low order wavefront sensing and control for WFIRST coronagraph,” in Proc. SPIE, p. 990418, July 2016.
- [21] J. C. Wyant, “Use of an ac heterodyne lateral shear interferometer with real-time wavefront correction systems,” Appl. Opt. 14, pp. 2622–2626, Nov. 1975.
- [22] M. A. Ealey and J. A. Wellman, “Xinetics low-cost deformable mirrors with actuator replacement cartridges,” in 1994 Symposium on Astronomical Telescopes & Instrumentation for the 21st Century, pp. 680–687, International Society for Optics and Photonics, 1994.
- [23] L. Huang, X. Ma, M. Gong, and Q. Bian, “Experimental investigation of the deformable mirror with bidirectional thermal actuators,” Optics Express 23, p. 17520, June 2015.
- [24] A. J. Lemmer, I. M. Griffiths, T. D. Groff, A. W. Rousing, and N. J. Kasdin, “Mathematical and computational modeling of a ferrofluid deformable mirror for high-contrast imaging,” 9912, pp. 99122K–99122K–15, 2016.
- [25] T. G. Bifano, J. Perreault, R. K. Mali, and M. N. Horenstein, “Microelectromechanical deformable mirrors,” IEEE Journal of Selected Topics in Quantum Electronics 5, pp. 83–89, Jan. 1999.
- [26] K. M. Morzinski, A. P. Norton, J. W. Evans, L. Reza, S. A. Severson, D. Dillon, M. Reinig, D. T. Gavel, S. Cornelissen, and B. A. Macintosh, “MEMS practice: from the lab to the telescope,” in SPIE MOEMS-MEMS, pp. 825304–825304, 2012.
- [27] B.-W. Yoo, J.-H. Park, I. H. Park, J. Lee, M. Kim, J.-Y. Jin, J.-A. Jeon, S.-W. Kim, and Y.-K. Kim, “MEMS micromirror characterization in space environments,” Optics Express 17, p. 3370, Mar. 2009.
- [28] B. T. Fleming, S. R. McCandliss, K. Redwine, M. E. Kaiser, J. Kruk, P. D. Feldman, A. S. Kutyrev, M. J. Li, S. H. Moseley, O. Siegmund, J. Vallerga, and A. Martin, “Calibration and flight qualification of FORTIS,” 8859, pp. 88590Q–88590Q–12, 2013.
- [29] E. J. Aguayo, R. Lyon, M. Helmbrecht, and S. Khomusi, “FEM correlation and shock analysis of a VNC MEMS mirror segment,” in SPIE Astronomical Telescopes+ Instrumentation, pp. 91435C–91435C, International Society for Optics and Photonics, 2014.
- [30] B. A. Hicks, Nulling interferometers for space-based high contrast visible imaging and measurement of exoplanetary environments. PhD thesis, Boston University, Boston, MA, USA, 2012.
- [31] C. B. Mendillo, Scattering properties of dust in Orion and the Epsilon Eridani exoplanetary system. PhD thesis, Boston University, Boston, MA, USA, 2013.
- [32] C. Yuhas, “Sounding Rocket Program Update to the Heliophysics Subcommittee,” July 2012.
- [33] J. W. Evans, B. Macintosh, L. Poyneer, K. Morzinski, S. Severson, D. Dillon, D. Gavel, and L. Reza, “Demonstrating sub-nm closed loop MEMS flattening,” Optics Express 14(12), pp. 5558–5570, 2006.
- [34] E. S. Douglas, Advancing spaceborne tools for the characterization of planetary ionospheres and circumstellar environments. PhD thesis, Boston University, Boston, MA, USA, 2016.
- [35] Sounding Rocket Handbook, Sounding Rockets Program Office Suborbital & Special Orbital Projects Directorate, Wallops Flight Facility Wallops Island, Virginia, USA. https://sites.wff.nasa.gov/code810/files/SRHB.pdf, 2015.
- [36] M. W. Bautz, S. E. Kissel, G. Y. Prigozhin, B. LaMarr, B. E. Burke, and J. A. Gregory, “Progress in x-ray CCD sensor performance for the Astro-E2 x-ray imaging spectrometer,” in Proc. SPIE, 5501, pp. 111–122, 2004.
- [37] T. G. Bifano, J. A. Perreault, and P. A. Bierden, “Micromachined deformable mirror for optical wavefront compensation,” in International Symposium on Optical Science and Technology, pp. 7–14, International Society for Optics and Photonics, 2000.
- [38] E. Jones, T. Oliphant, and P. Peterson, “SciPy: Open source scientific tools for Python,” http://www. scipy. org/ , 2001.
- [39] R. Edeson, N. Morris, A. Tatnall, and G. S. Aglietti, “Dimensional Stability Testing on a Space Optical Bench Structure,” AIAA Journal 47, pp. 219–228, Jan. 2009.
- [40] S. Griffin, S. A. Lane, and A. Lazzaro, “Active Vibroacoustic Device for Noise Reduction in Launch Vehicles,” Journal of Spacecraft and Rockets 45, pp. 1282–1292, Nov. 2008.
- [41] N. J. Kasdin, R. J. Vanderbei, D. N. Spergel, and M. G. Littman, “Extrasolar Planet Finding via Optimal Apodized-Pupil and Shaped-Pupil Coronagraphs,” ApJ 582, p. 1147, Jan. 2003.
- [42] D. Mawet, E. Serabyn, K. Liewer, R. Burruss, J. Hickey, and D. Shemo, “The Vector Vortex Coronagraph: Laboratory Results and First Light at Palomar Observatory,” ApJ 709, p. 53, Jan. 2010.
- [43] B. A. Hicks, T. A. Cook, B. F. Lane, C. B. Mendillo, P. Jung, and S. Chakrabarti, “The Monolithic Achromatic Nulling Interference Coronagraph (MANIC) testbed,” in SPIE Optical Engineering+ Applications, pp. 74401B–74401B, 2009.
- [44] T. Cook, K. Cahoy, S. Chakrabarti, E. Douglas, S. C. Finn, M. Kuchner, N. Lewis, A. Marinan, J. Martel, D. Mawet, B. Mazin, S. R. Meeker, C. Mendillo, G. Serabyn, D. Stuchlik, and M. Swain, “Planetary Imaging Concept Testbed Using a Recoverable Experiment–Coronagraph (PICTURE C),” J. Astron. Telesc. Instrum. Syst 1(4), pp. 044001–044001, 2015.
- [45] C. B. Mendillo, G. A. Howe, K. Hewawasam, J. Martel, S. C. Finn, T. A. Cook, and S. Chakrabarti, “Optical tolerances for the PICTURE-C mission: error budget for electric field conjugation, beam walk, surface scatter, and polarization aberration,” in Proc SPIE, 10400, p. 1040010, International Society for Optics and Photonics, Sept. 2017.
- [46] E. S. Douglas, G. Allan, D. Barnes, J. S. Figura, C. A. Haughwout, J. N. Gubner, A. A. Knoedler, S. LeClair, T. J. Murphy, N. Skouloudis, J. Merck, R. A. Opperman, and K. L. Cahoy, “Design of the deformable mirror demonstration CubeSat (DeMi),” in Proc SPIE, 10400, p. 1040013, International Society for Optics and Photonics, Sept. 2017.
- [47] D. Spergel, N. Gehrels, C. Baltay, D. Bennett, J. Breckinridge, M. Donahue, A. Dressler, B. S. Gaudi, T. Greene, O. Guyon, C. Hirata, J. Kalirai, N. J. Kasdin, B. Macintosh, W. Moos, S. Perlmutter, M. Postman, B. Rauscher, J. Rhodes, Y. Wang, D. Weinberg, D. Benford, M. Hudson, W.-S. Jeong, Y. Mellier, W. Traub, T. Yamada, P. Capak, J. Colbert, D. Masters, M. Penny, D. Savransky, D. Stern, N. Zimmerman, R. Barry, L. Bartusek, K. Carpenter, E. Cheng, D. Content, F. Dekens, R. Demers, K. Grady, C. Jackson, G. Kuan, J. Kruk, M. Melton, B. Nemati, B. Parvin, I. Poberezhskiy, C. Peddie, J. Ruffa, J. K. Wallace, A. Whipple, E. Wollack, and F. Zhao, “Wide-Field InfrarRed Survey Telescope-Astrophysics Focused Telescope Assets WFIRST-AFTA 2015 Report,” ArXiv e-prints 1503, p. 3757, Mar. 2015.
- [48] The Astropy Collaboration, T. P. Robitaille, E. J. Tollerud, P. Greenfield, M. Droettboom, E. Bray, T. Aldcroft, M. Davis, A. Ginsburg, A. M. Price-Whelan, W. E. Kerzendorf, A. Conley, N. Crighton, K. Barbary, D. Muna, H. Ferguson, F. Grollier, M. M. Parikh, P. H. Nair, H. M. Günther, C. Deil, J. Woillez, S. Conseil, R. Kramer, J. E. H. Turner, L. Singer, R. Fox, B. A. Weaver, V. Zabalza, Z. I. Edwards, K. Azalee Bostroem, D. J. Burke, A. R. Casey, S. M. Crawford, N. Dencheva, J. Ely, T. Jenness, K. Labrie, P. L. Lim, F. Pierfederici, A. Pontzen, A. Ptak, B. Refsdal, M. Servillat, and O. Streicher, “Astropy: A community Python package for astronomy,” Astronomy & Astrophysics 558, p. A33, Oct. 2013.
- [49] J. D. Hunter, “Matplotlib: A 2d graphics environment,” Computing In Science & Engineering 9(3), pp. 90–95, 2007.
- [50] F. Pérez and B. Granger, “IPython: A System for Interactive Scientific Computing,” Computing in Science Engineering 9, pp. 21–29, May 2007.
- [51] R. N. Bracewell, “Detecting nonsolar planets by spinning infrared interferometer,” Nature 274, pp. 780–781, Aug. 1978.
- [52] M. Shao, J. K. Wallace, B. M. Levine, and D. T. Liu, “Visible nulling interferometer,” in Proc. SPIE, 5487, pp. 1296–1303, Oct. 2004.
- [53] M. Shao, J. J. Green, B. Lane, J. K. Wallace, B. M. Levine, R. Samuele, S. Rao, and E. Schmidtlin, “Calibration of Residual Speckle Pattern in a Coronagraph,” Proceedings of the International Astronomical Union 1(Colloquium C200), pp. 525–528, 2005.
- [54] R. G. Lyon, M. Clampin, R. Woodruff, G. Vasudevan, M. Shao, M. Levine, G. Melnick, V. Tolls, P. Petrone, and P. Dogoda, “Visible nulling coronagraphy for exo-planetary detection and characterization,” IAU Colloquim 200, 2006.
- [55] B. M. Levine, F. Aguayo, T. Bifano, S. F. Fregoso, J. J. Green, B. F. Lane, D. T. Liu, B. Mennesson, S. Rao, R. Samuele, M. Shao, E. Schmidtlin, E. Serabyn, J. Stewart, and J. K. Wallace, “The visible nulling coronagraph: architecture definition and technology development status,” in Proc. SPIE, J. C. Mather, H. A. MacEwen, and M. W. M. de Graauw, eds., pp. 62651A–62651A–13, June 2006.
- [56] R. M. Morgan, J. H. Burge, and N. J. Woolf, “Nulling interferometric beam combiner utilizing dielectric plates: experimental results in the visible broadband,” in Proc. SPIE, 4006, pp. 340–348, July 2000.
- [57] M. Born and E. Wolf, Principles of Optics Electromagnetic Theory of Propagation, Interference and Diffraction of Light, Pergamon Press, 6th ed., 1980.
- [58] J. C. Wyant, “Phase-Shifting Interferometry,” tech. rep., https://wp.optics.arizona.edu/jcwyant/wp-content/uploads/sites/13/2016/08/Phase-Shifting-Interferometry.nb_.pdf, 2011.
- [59] M. Branch, T. Coleman, and Y. Li, “A Subspace, Interior, and Conjugate Gradient Method for Large-Scale Bound-Constrained Minimization Problems,” SIAM J. Sci. Comput. 21, pp. 1–23, Jan. 1999.
- [60] M. A. Herráez, D. R. Burton, M. J. Lalor, and M. A. Gdeisat, “Fast two-dimensional phase-unwrapping algorithm based on sorting by reliability following a noncontinuous path,” Applied Optics 41, p. 7437, Dec. 2002.