75282
Role of THESEUS in Understanding the Radiation Mechanism of GRB Prompt Emission
Abstract
The radiation process of GRB prompt emission remains highly debated till date. Though a smoothly broken powerlaw function like Band provides an excellent fit to most of the cases, a spectrum with a broad top or double hump structure has emerged recently for several GRBs, specifically for the bright ones that have high signal to noise data. A number of models have been proposed to capture this shape which includes an additional blackbody component along with the Band, or a double smoothly broken powerlaw, or two blackbodies with a powerlaw/cut-off powerlaw and so on. However, finding the statistically favourable model has not always been possible primarily due to the limited resolution of GRB detectors. Recently, we have identified a number of interesting cases where an observation with focusing detectors are available at a later part of the prompt emission. Their high resolution data helped in identifying additional spectral component (a blackbody) in lower energies. The proposed THESEUS mission, with its unprecedented sensitivity and spectral resolution available from the very beginning of the prompt emission holds the key to identify the correct spectral model and thereby the radiation process.
keywords:
Radiation mechanisms: general – Methods: data analysis – Methods: observational – Gamma-ray burst: general1 Introduction
Gamma-ray Bursts (GRBs) are the strongest sources of enormous gravitational and electromagnetic energy. From the recent detection of gravitational wave with electromagnetic counterpart (Abbott et al., 2017), we are now very sure that a class of GRBs known as the short GRBs are produced by coalescing binary compact stars in which at least one of the binary stars is a neutron star. On the other hand, the detection of core-collapse supernovae during the afterglow of nearby long GRBs (Galama et al., 1998; Hjorth et al., 2003) points towards a collapsar scenario for the class of long GRBs. While the initial collapse or coalescence is the main source of gravitational wave, the electromagnetic energy is believed to be produced by a relativistic bipolar jet that is launched by the new born central engine. Yet, the mechanism by which the jet radiates remains a highly debated topic. Understanding the radiation process holds the key by which we can trace back the nature of the central engine which may not be determined by other methods. For example, in the discovery event of electromagnetic counterpart involving coalescing neutron star, the nature of the end product remains undetermined based on the mass estimate. The study of radiation process may provide valuable input in this regard.
GRB radiation occurs in two phases – prompt emission and afterglow. While the afterglow phase being a radiation from the shocked circumstellar matter is related more to the external medium, the prompt emission is intrinsic to the GRB. Hence, in order to understand the GRB radiation process, it is necessary to model the profile of the prompt emission spectrum. However, the prompt emission spectroscopy faces a number of challenges as follows. (a) The spectrum evolves quite rapidly, (b) There can be a number of overlapping pulses. Hence, it is difficult to follow the spectral evolution of the individual pulses (Hakkila & Preece, 2011). (c) GRB detectors are background dominated and their spectral sensitivity and resolution are quite poor. While the rapid spectral evolution demands fine time resolved study, the detectors are unable to provide good signal to noise ratio in the time resolved data.
In order to tackle these, a number of strategies have been adopted. For example, some studies involve only GRBs with single pulse (Ryde, 2004; Ryde & Pe’er, 2009), and thus avoid the pulse overlapping effect. These studies generally find that the spectral evolution is quite smooth. Even for GRBs with multiple but separable pulses, the portion with no overlap do show a smooth evolution (Basak & Rao, 2013). Some of these studies also show strong evidence of a thermal blackbody component mostly at the beginning of the prompt emission (Ghirlanda et al., 2003; Ryde, 2004; Ryde et al., 2010). A thermal component indicates an optically thick emission. In the standard fireball model, such an emission is in fact expected from the photosphere, though the actual spectral shape can be slightly broader compared to a blackbody due to sub-photospheric dissipations (Rees & Mészáros, 2005; Pe’er, 2008; Pe’er & Ryde, 2011).
In recent years, we have adopted a new strategy to overcome the third problem (Basak & Rao, 2015a, b). GRB detectors have wide field of view (FoV) in order to detect a GRB occurring at a random sky direction. But, this allows for huge background and consequently the detectors are background limited and their sensitivity is quite poor. While it is necessary to have a wide FoV detector at the beginning, focusing instruments like Swift X-ray Telescope (XRT) can in principle operate at a later phase. These instruments have a much better sensitivity than the wide FoV detectors, and their CCD detectors have an order of magnitude better spectral resolution. Hence, they can be excellent tools to find additional spectral component at lower energies with statistical significance. At the later phase, Swift Burst Alert Telescope (BAT) type of detectors can also be employed to provide a wider energy coverage. But, Fermi Gamma-ray Burst Monitor (GBM) cannot be used due to its limited sensitivity. The GBM can be used at the beginning in stead where the signal is higher, and GBM can provide a much wider energy coverage.
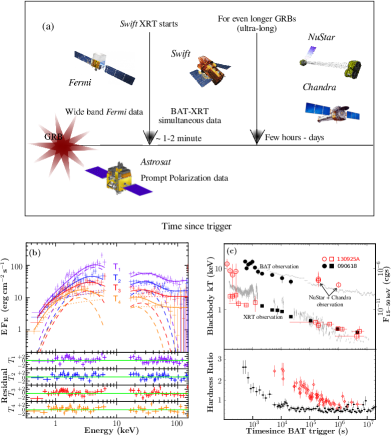
In addition to this, the CZT imager (CZTI) of the Indian space mission Astrosat is providing the valuable polarization measurement during the prompt emission. A joint spectro-polarimetric study is first of its kind. As different model of prompt emission predict different degree of polarization, this measurement can give independent constraints on the possible model. The strategy outlined above is illustrated in Fig. 1 a.
The proposed THESEUS mission (Amati et al., 2017) will have an enormous capability to automate the strategy of obtaining high resolution data in a wide band, and that too from the very beginning of the prompt emission. Hence, the above strategic observation can be routinely done without human intervention. In this paper, we highlight some of the strategic analysis and how THESEUS can contribute in studying GRB prompt emission spectrum.
| GRB | Fermi GBM | Fermi LAT | Swift BAT | Swift XRT | Other | Polarization |
|---|---|---|---|---|---|---|
| 090618 | Yes | No | Yes | Yes | No | |
| 130925A | No | No | Yes | Yes | Nustar, Chandra | No |
| 151006A | Yes | Yes | Yes | Yes | Yes |
2 Strategic Analysis
We demonstrate the strategic analysis with three GRBs namely, GRB 090618, GRB 130925A and GRB 151006A.
GRB 090618 is a bright GRB detected by both Fermi and Swift. The prompt emission lasted quite long ( s), and the XRT started observing the GRB from 125 s after the BAT trigger time. The XRT covers the falling part of the last pulse of the prompt emission. As this part is devoid of pulse overlapping effect, the spectrum is expected to show a smooth evolution. Page et al. (2011), using the XRT data at this phase find an evidence of a thermal component. The temperature and the normalization of this component decreases monotonically and smoothly with time. In our analysis of this GRB (Basak & Rao, 2015a), see Fig. 1 b, we include the BAT detector at the late phase and further divide the BAT-XRT overlapping time into four equal time bins. The joint BAT-XRT data shows that there is an evidence of a blackbody component in the XRT band as pointed out by Page et al. (2011), while in the BAT energy band another blackbody component shows up, see Fig. 1 b. The temperature of these two blackbodies evolve in the same manner. For the data before and after the joint BAT-XRT observation, we fit a single blackbody. The temperature of the single blackbody fitted to the BAT only data in the previous bins show a similar evolution as that of the higher-temperature blackbody of the joint BAT-XRT data. Also, the temperature of a single blackbody fitted to the XRT data at later bins show a similar evolution as the lower-temperature blackbody of the joint data. This indicates that the spectrum always has the double hump modelled with two blackbodies, but they show up only when we have a good enough spectral coverage with BAT and XRT. This example illustrates the importance of the high resolution XRT data at the right moment of GRB emission.
GRB 130925A is an interesting and a highly debated event. First of all, was it at all a GRB or a tidal disruption event (TDE)? Though an image taken with Hubble Space Telescope (Tanvir et al., 2013) shows an off-set from the host galaxy, but as the morphology of the host points to a recent major merger, it cannot fully rule out a TDE. Hence, it is very important to study the radiation process and compare with other GRBs. If the event is a GRB, it is the longest ultra-long GRB till date. The event got considerable attention and was observed as a target of opportunity (ToO) with Nustar and Chandra at a later phase, see Table 1. The radiation process of the event was also debated. Piro et al. (2014) using the XRT data till late time find an evolving blackbody with a temperature varying from keV to keV. But, Bellm et al. (2014) using the Nustar and Chandra data find a temperature at a much higher value keV. These two observations already indicates the presence of two backbodies. When we combine the data and also include the BAT data at the beginning, we find two blackbody components throughout the burst with the temperature falling off quite smoothly with time (Basak & Rao, 2015b). Moreover, when we compare the evolution of the temperature and hardness ratio of this event with that of the long GRB 090618, we find a remarkable similarity, see Fig. 1 c. The only difference is the time scale of variation which is much slower in the ultra-long case denoting a much larger progenitor that underwent a collapse. Hence, our observation indicates that first of all, this event is a GRB and second, the radiation process of the ultra-long GRB is also similar to the long GRB class.
Our third example is GRB 151006A (Rao et al., 2016; Basak et al., 2017). This is the first GRB detected by Astrosat CZTI and has a polarization measurement (Rao et al., 2016). We fit a Band function to the time resolved spectra. We find that the peak of the spectrum initially shows a hard-to-soft evolution, but then show a sudden jump reaching values beyond MeV. The changeover time also coincide with the first LAT detected photon. This indicates either a beginning of an afterglow or a second pulse of the prompt emission, which however is not seen in the lightcurve at any energy. Our analysis show that it is indeed the second case because (a) the late time data from BAT and XRT shows considerable curvature in the data unlike the simple powerlaw shape of afterglow spectrum, (b) the hardness ratio plot shows an underlying second pulse at this phase, (c) also the polarization data at these two phases are quite high which is unattainable by the random magnetic field expected during an afterglow phase. This study shows the power of the strategic analysis along with polarimetric data. The CZTI has by now detected over 50 GRBs and in several cases we have polarization measurement (Chattopadhyay et al., 2017). Over the mission lifetime we expect to observe at least 50 GRBs with measured polarization, which will be a huge contribution in understanding the correct radiation process.
3 Role of THESEUS
The proposed THESEUS mission (Amati et al., 2017) has a number of unique capabilities that will be helpful in the study of prompt emission spectrum.
The three units of X-Gamma Imaging Spectrometer (XGIS) cover a wide energy range of 2 keV – 20 MeV. The detector is a combination of solid state detector – a Si drift detector, and a scintillator – CsI (Tl). The detector provides an unprecedented resolution of 200 eV FWHM at 6 keV in the energy range 2–30 keV. The resolution at higher energies are moderate – 18% FWHM at 60 keV (30–150 keV) and 6% FWHM at 500 keV ( keV). This instrument has a coded aperture mask (CAM) as used in case of Swift BAT. It has a large enough FoV ( full FoV in the range 2–30 keV and sr at energies keV) to detect GRBs.
In addition, the Soft X-ray Imager (SXI) of THESEUS with its four “Lobster-Eye” provides a FoV of 1 sr and can detect the prompt emission in the softer energies. The CCD covers an energy range 0.3–6 keV which will complement the range covered by XGIS. This energy range is also important to constraint the line of sight column density that must be included in the analysis of soft X-ray data.
The high resolution detectors that are capable of detecting GRBs makes the THESEUS an extremely powerful mission for prompt emission spectroscopy. As this high resolution data at lower energies is available from the very beginning of the prompt emission, the strategic analysis described above will be routinely done by THESEUS.
4 Conclusions
The prompt emission of GRBs remains a highly debated topic. The main hurdle seems to be the quality of data that can be afforded maintaining a large FoV of the GRB instruments. The detectors in general suffer from poor sensitivity and resolution. We have shown that meaningful spectral evolution studies can be performed if we take certain strategy in our analysis. These includes e.g., high resolution data at the late phase of the prompt emission corroborated with the wide band data from Fermi at the beginning of the GRB. The polarization measurement with Astrosat CZTI adds another dimension to this effort.
The proposed mission THESEUS has a wide enough FoV, and the GRB detectors have an order of magnitude better spectral resolution at lower energies compared to the traditional GRB detectors. Moreover, this high resolution data is available from the very beginning of the prompt emission. Hence, it is expected that the prompt emission spectroscopy will get a boost with the advent of this type of mission.
Acknowledgements.
We thank A. R. Rao and the CZTI collaboration for the contribution in the published works. We gratefully acknowledge L. Amati and other members of the THESEUS collaboration for the information regarding the mission.References
- Abbott et al. (2017) Abbott, B. P., Abbott, R., Abbott, T. D., et al. 2017, Physical Review Letters, 119, 161101
- Amati et al. (2017) Amati, L., O’Brien, P., Goetz, D., et al. 2017, arXiv:1710.04638
- Basak et al. (2017) Basak, R., Iyyani, S., Chand, V., et al. 2017, MNRAS, 472, 891
- Basak & Rao (2013) Basak, R. & Rao, A. R. 2013, ApJ, 768, 187
- Basak & Rao (2015a) Basak, R. & Rao, A. R. 2015a, ApJ, 812, 156
- Basak & Rao (2015b) Basak, R. & Rao, A. R. 2015b, ApJ, 807, 34
- Bellm et al. (2014) Bellm, E. C., Barrière, N. M., Bhalerao, V., et al. 2014, ApJ, 784, L19 (B14)
- Chattopadhyay et al. (2017) Chattopadhyay, T., Vadawale, S. V., Aarthy, E., et al. 2017, arXiv:1707.06595
- Galama et al. (1998) Galama, T. J., Vreeswijk, P. M., van Paradijs, J., et al. 1998, Nature, 395, 670
- Ghirlanda et al. (2003) Ghirlanda, G., Celotti, A., & Ghisellini, G. 2003, A&A, 406, 879
- Hakkila & Preece (2011) Hakkila, J. & Preece, R. D. 2011, ApJ, 740, 104
- Hjorth et al. (2003) Hjorth, J., Sollerman, J., Møller, P., et al. 2003, Nature, 423, 847
- Page et al. (2011) Page, K. L., Starling, R. L. C., Fitzpatrick, G., et al. 2011, MNRAS, 416, 2078
- Pe’er (2008) Pe’er, A. 2008, ApJ, 682, 463
- Pe’er & Ryde (2011) Pe’er, A. & Ryde, F. 2011, ApJ, 732, 49
- Piro et al. (2014) Piro, L., Troja, E., Gendre, B., et al. 2014, ApJ, 790, L15 (P14)
- Rao et al. (2016) Rao, A. R., Chand, V., Hingar, M. K., et al. 2016, ApJ, 833, 86
- Rees & Mészáros (2005) Rees, M. J. & Mészáros, P. 2005, ApJ, 628, 847
- Ryde (2004) Ryde, F. 2004, ApJ, 614, 827
- Ryde et al. (2010) Ryde, F., Axelsson, M., Zhang, B. B., et al. 2010, ApJ, 709, L172
- Ryde & Pe’er (2009) Ryde, F. & Pe’er, A. 2009, ApJ, 702, 1211
- Tanvir et al. (2013) Tanvir, N. R., Levan, A. J., Hounsell, R., et al. 2013, GRB Coordinates Network, Circular Service, No. 15489, #1 (2013), 15489, 1