3D Snapshot Microscopy of Extended Objects
Abstract
Volumetric biological imaging often involves compromising high temporal resolution at the expense of high spatial resolution when popular scanning methods are used to capture 3D information. We introduce an integrated experimental and image reconstruction method for capturing dynamic 3D fluorescent extended objects as a series of synchronously measured 3D snapshots taken at the frame rate of the imaging camera. We employ multifocal microscopy (MFM) to simultaneously image at 25 focal planes and process this depth-encoded image to recover the 3D structure of extended objects, such as bacteria, using a sparsity-based reconstruction approach. The combined experimental and computational method produces image quality similar to confocal microscopy in a fraction of the acquisition time. In addition, our computational image reconstruction approach allows a simplified MFM optical design by correcting aberrations using the measured response to point sources. This “compressive” MFM acquisition and reconstruction method, where an image volume with roughly 8 million voxels is recovered from a single 1-megapixel captured image, enables straightforward study of dynamic processes in 3D, and as a simultaneous snapshot advances the state of the art in dynamic 3D microscopy.
Introduction
Modern imaging systems such as spinning-disk confocal [1, 2] and light-sheet microscopy [3, 4] can capture high-fidelity 3D images by sequential refocusing, where the objective captures a single focal plane at a time as it scans through the sample, typically requiring seconds to acquire the entire target volume [5]. In a cell, however, typical time scales of interest are on the order of milliseconds, which cannot be resolved with sequential refocusing [6, 7].
Multifocal microscopy [8], an advance over multifocal plane microscopy (MUM) [9, 10], provides a way to capture 3D data in a single synchronous snapshot, thereby removing the limitations of sequential refocusing. The potential of multifocal imaging for obtaining volumetric information can be appreciated by realizing that an out-of-focus image of a point source provides better localization of its z-position than an in focus image [9]. Our goal is to reconstruct 3D information about biological objects from MFM images. Previous MFM systems [10, 11, 12] have developed approaches that localize point sources. These approaches will not be applicable to recovering extended objects, such as unresolved distributions of fluorescent molecules with a bacterium. Here we present an approach that will recover the detailed distribution of fluorescence in an extended object.
Results
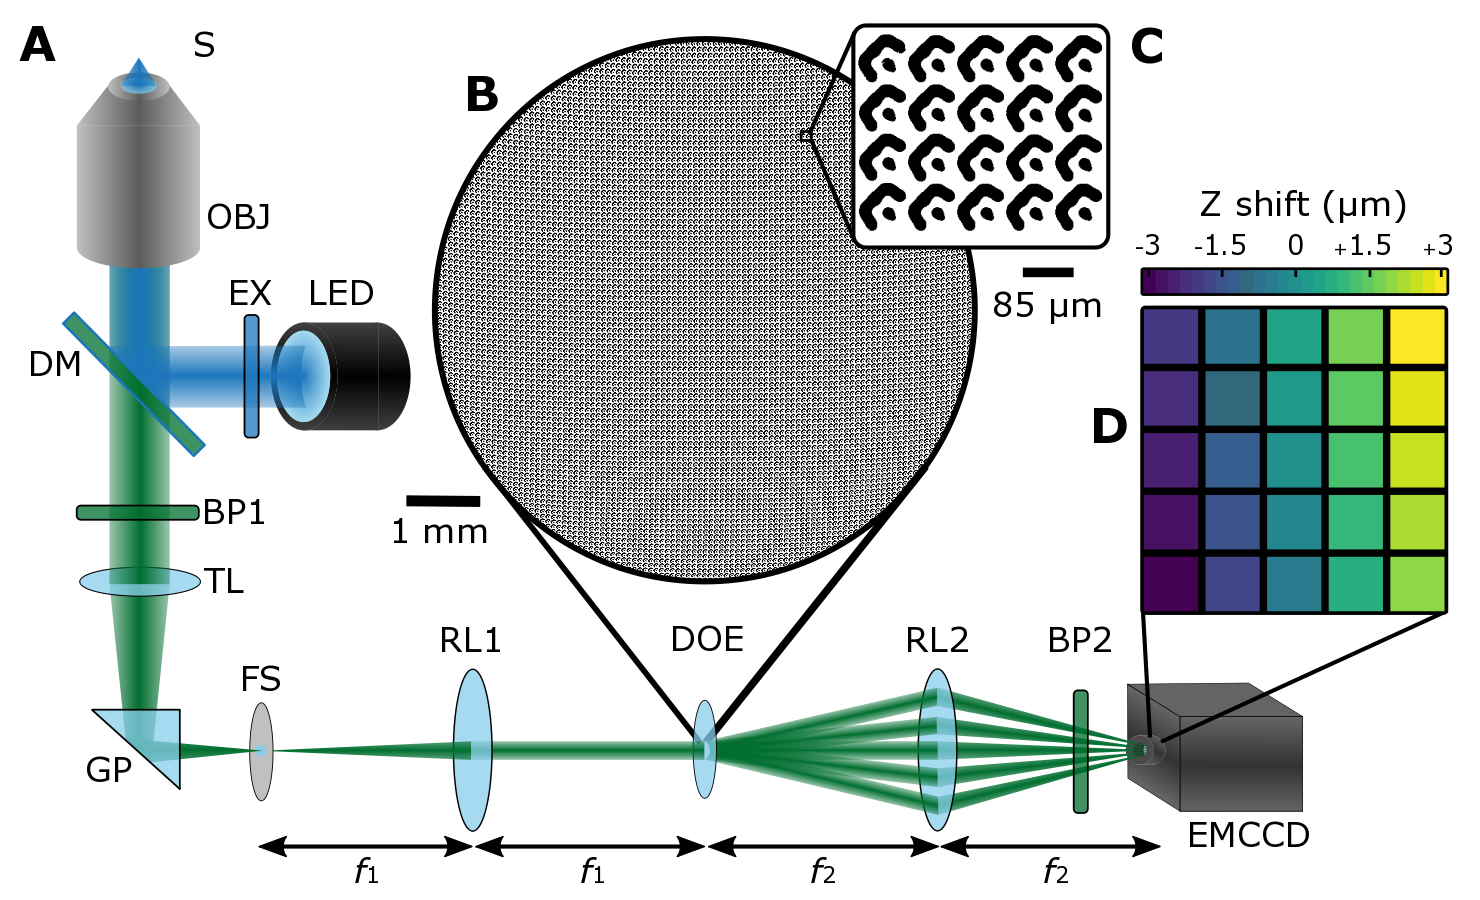
We introduce a 3D computational imaging method that overcomes these limitations and demonstrate it on dynamical extended objects by capturing the volumetric data required for reconstruction at 25 Hz (limited only by the detector frame rate). As shown in figure 1, the approach combines (i) capture of depth-encoded snapshot acquired images based on multifocal microscopy (MFM), and (ii) a method for sparse reconstruction of the 3D volume from the 2D snapshot.
Optical Setup
For MFM the light from an infinity-corrected objective is split into several beams where each beam can be understood to create an image with a tube lens with a different focal length. Therefore, each tube lens-objective combination provides a widefield image of a different focal plane in the sample volume. The speed of 3D acquisition is limited only by the camera frame rate and the brightness of the sample. Abrahamsson et al. [8] demonstrated MFM using a novel diffractive optical element and a single detector, a configuration we adapt here (figure 1(a)). Each lens-objective combination forms a spatially distinct sub-image at the detector plane.
A single diffractive element (DOE) provides depth-encoding of our 3D sample volume. We designed the diffractive element to split the beam into an array of differently focused tiles on the detector following the procedure outlined by Abrahamsson et al. [8] for their multi-focus grating (see Supplementary Materials for details). Our optical design forgoes the corresponding chromatic correction grating and custom multi-faceted prism. The chromatic aberration introduced by the DOE for the 15 nm bandpass for each beam is accounted for through its signature in the PSF.
The Snapshot and PSF
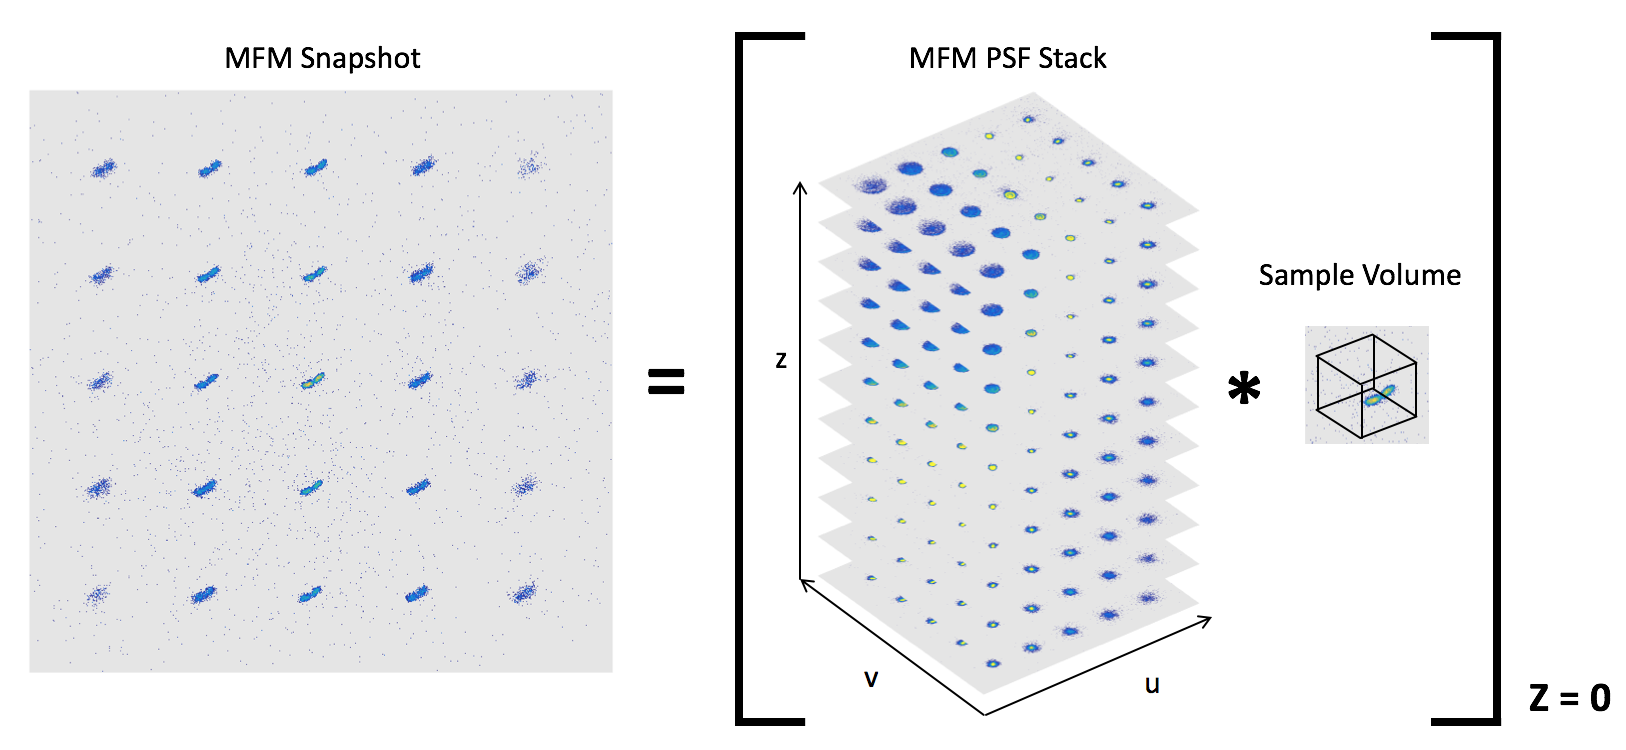
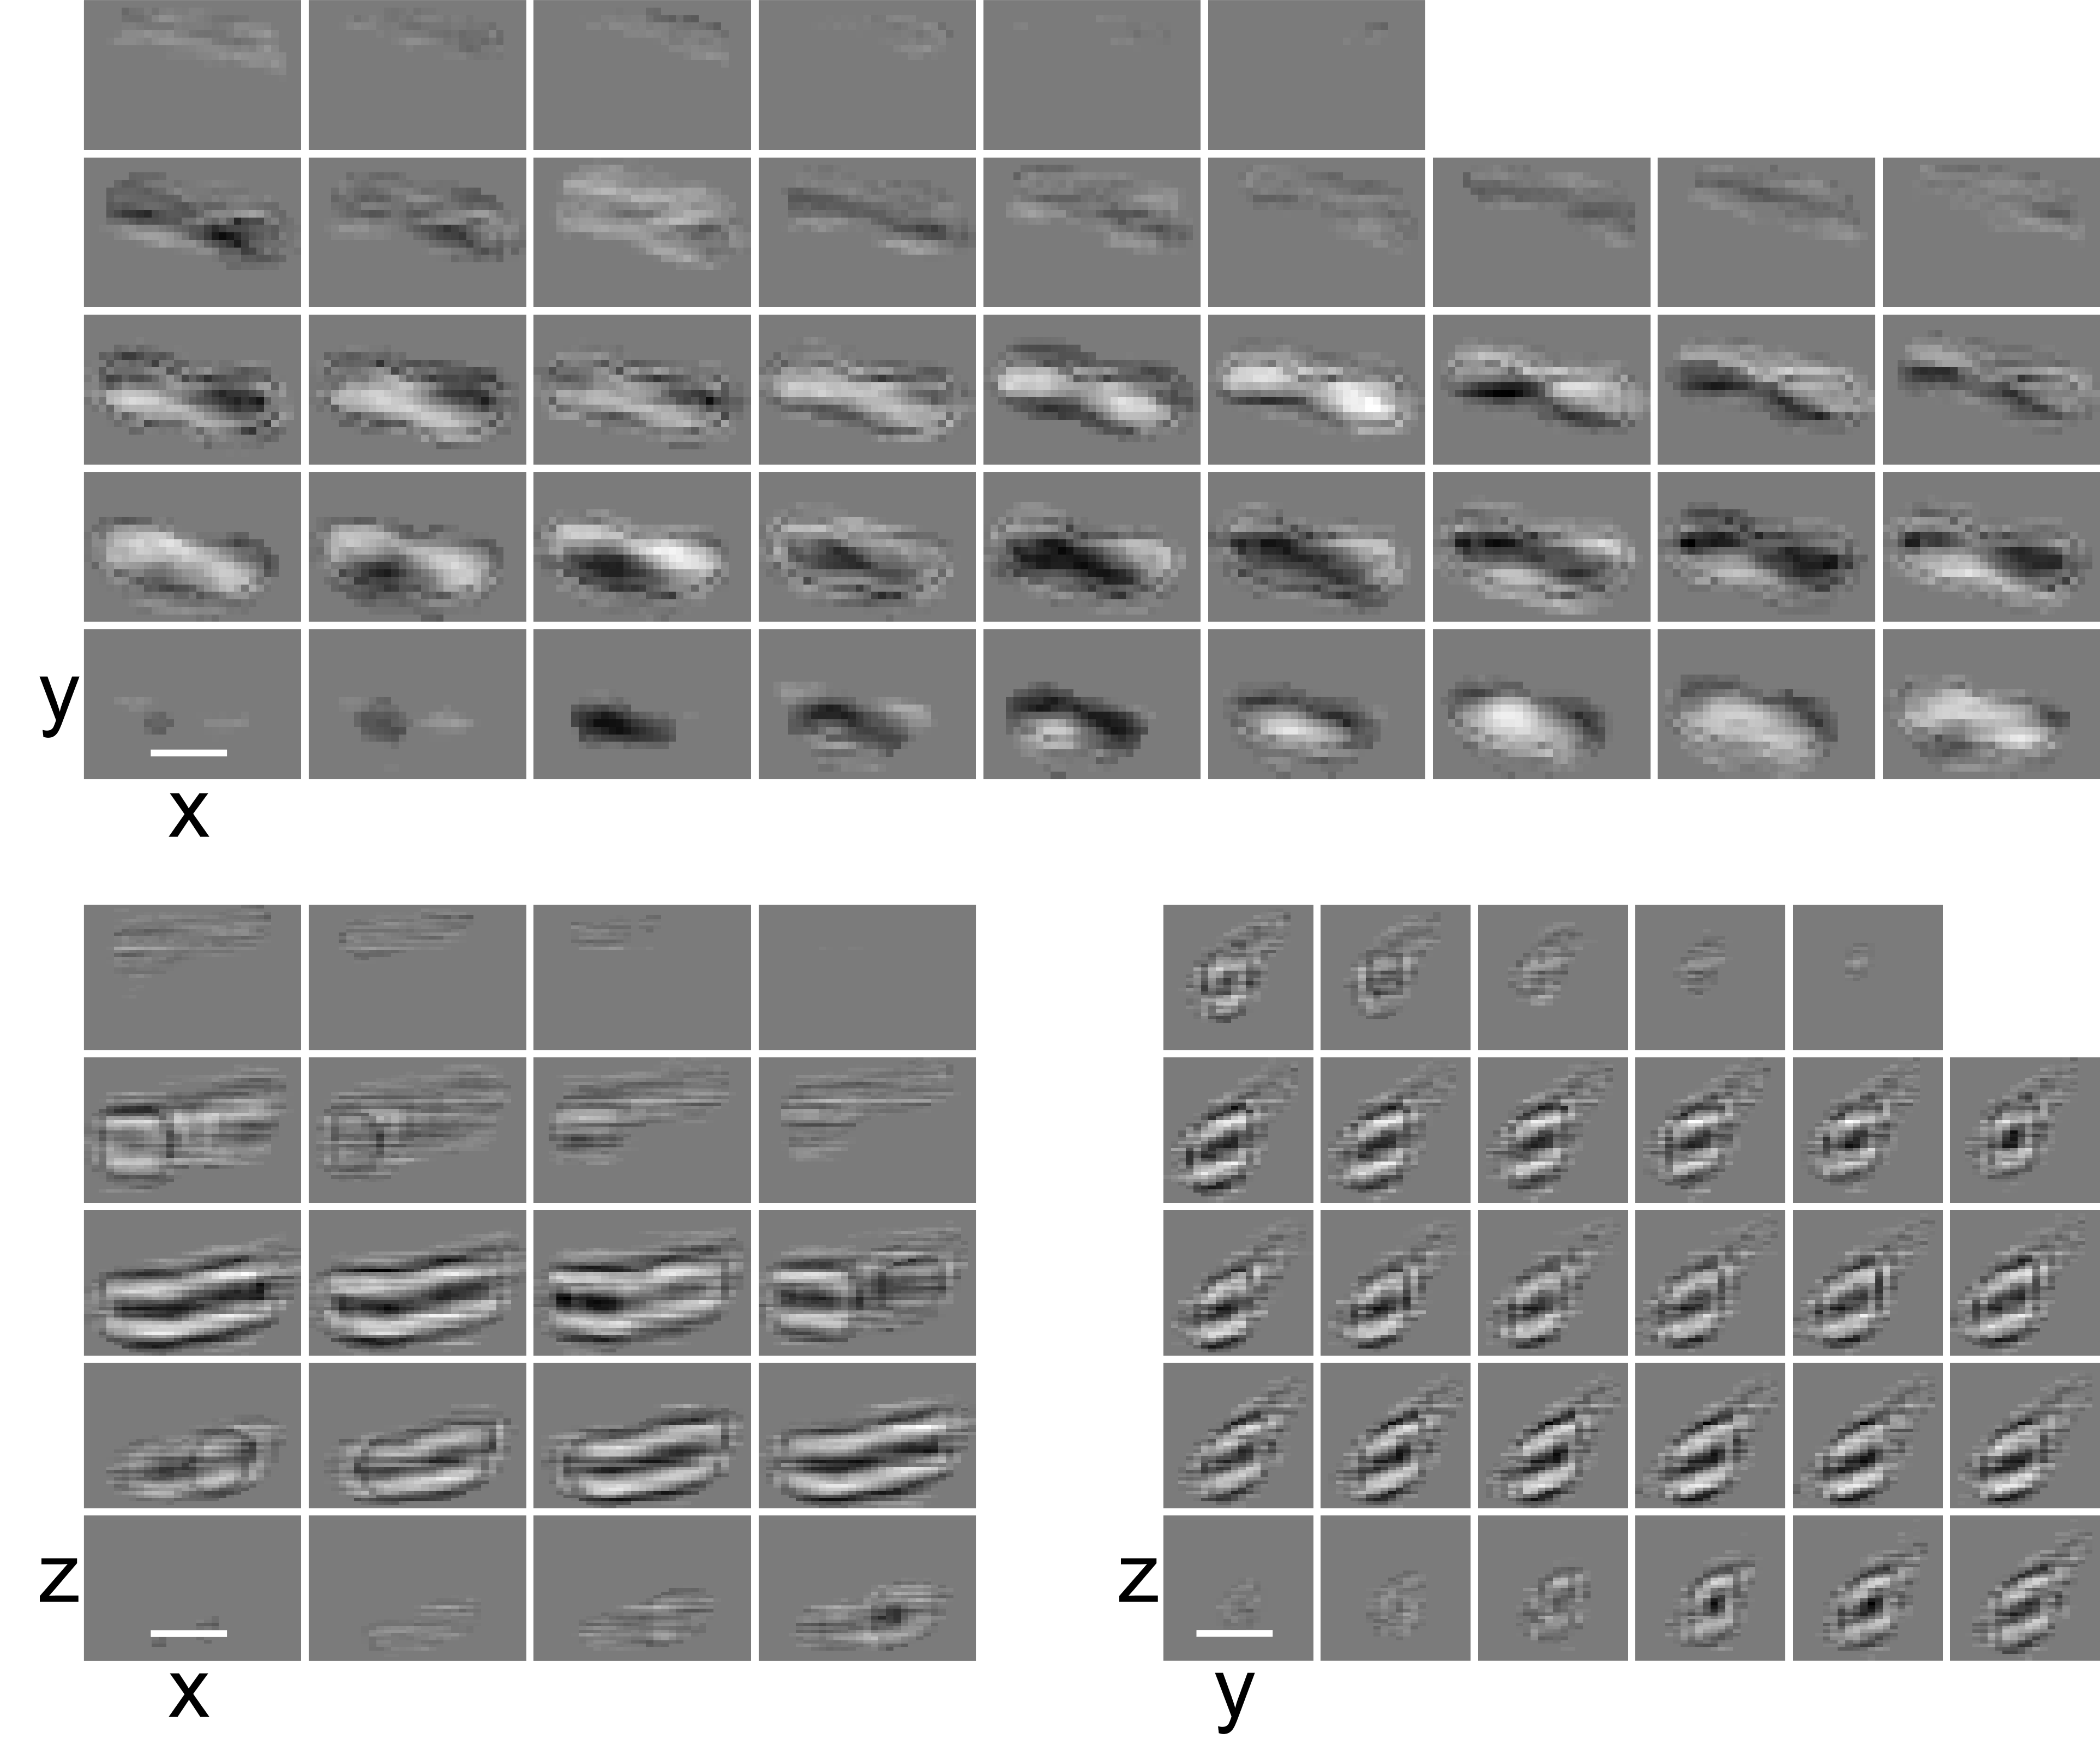
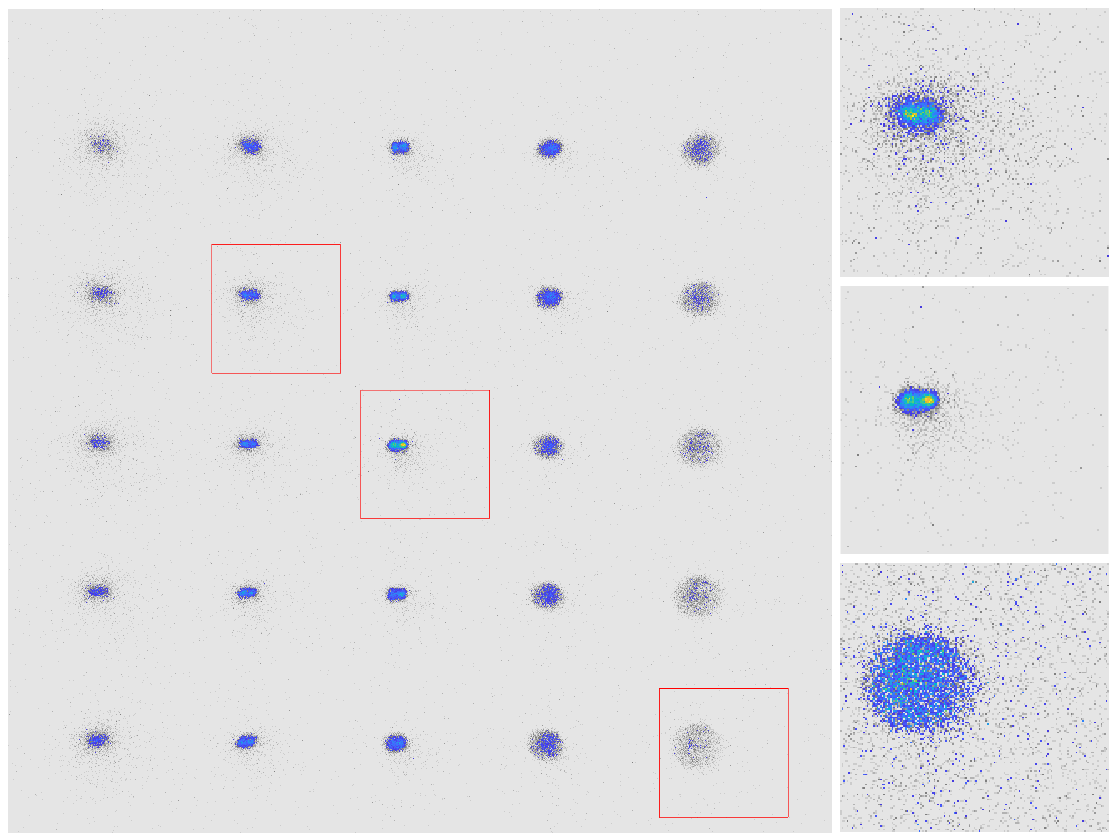
To inform the 3D reconstruction, we measure the response of the system by collecting MFM images of a nominal point source at 50 nm intervals along (figure 1(b)). An individual slice of the PSF includes 25 widefield exposures spanning in 250 nm focus increments, each “distorted” by its own chromatic aberrations from the DOE. For extended objects, details about the sample structure are obfuscated by the out-of-focus sub-images, because MFM is a widefield microscopy.
Given a captured MFM image of an object, our algorithm estimates the 3D object image that produces the best match to the measured 2D MFM image using a sparsity-based reconstruction framework [13] By doing so, the resulting solution incorporates all of the data in the MFM image, using the information captured in the PSF about correlations between pixel intensities in the 25 focal tiles and through the fine grain -slicing of the PSF.
3D Reconstruction
The algorithm is implemented by discretizing a sample volume, , into 108 nm 108 nm 50 nm voxels, matching the pixel scale and the -step size of the PSF. For each -plane of the object volume we compute its contribution to the simulated MFM image, , by performing a 2D convolution with the corresponding plane in the PSF. Summing these contributions gives the forward projection of the object volume through the MFM optical system. This prescription of the forward model, , for MFM imaging is equivalent to extracting the plane of the volume convolved with the 3D PSF (figure 1). It maps a 3D volumetric fluorescence distribution in object space (e.g., from a bacterium) to a 2D MFM image in the microscope’s detector space (see supplementary material).
Using this forward imaging model, we formulate the volume reconstruction as an optimization problem [13, 14, 15]. The dimension of the 3D volume to be reconstructed is much larger than the dimension of the observed data (i.e., the 2D image on the detector). Hence, direct inversion of the forward imaging model, , to find is an ill-posed problem [16]. We take a well-studied approach [17, 18] to this circumstance by instead solving a constrained optimization problem that simultaneously minimizes the error between the fit of data to the forward model and a constraint enforcing a prior model on the form of the solution,
| (1) |
The prior model, , can be selected to encode prior knowledge about the solution such as smoothness or sparsity of the signal (see Supplementary Materials for details). In our results we use the L1 norm of , which favors sparsely filled solutions. We use TwIST [19] modified to incorporate non-negative thresholding at each iteration to solve the optimization problem in Equation (1).
Measurements
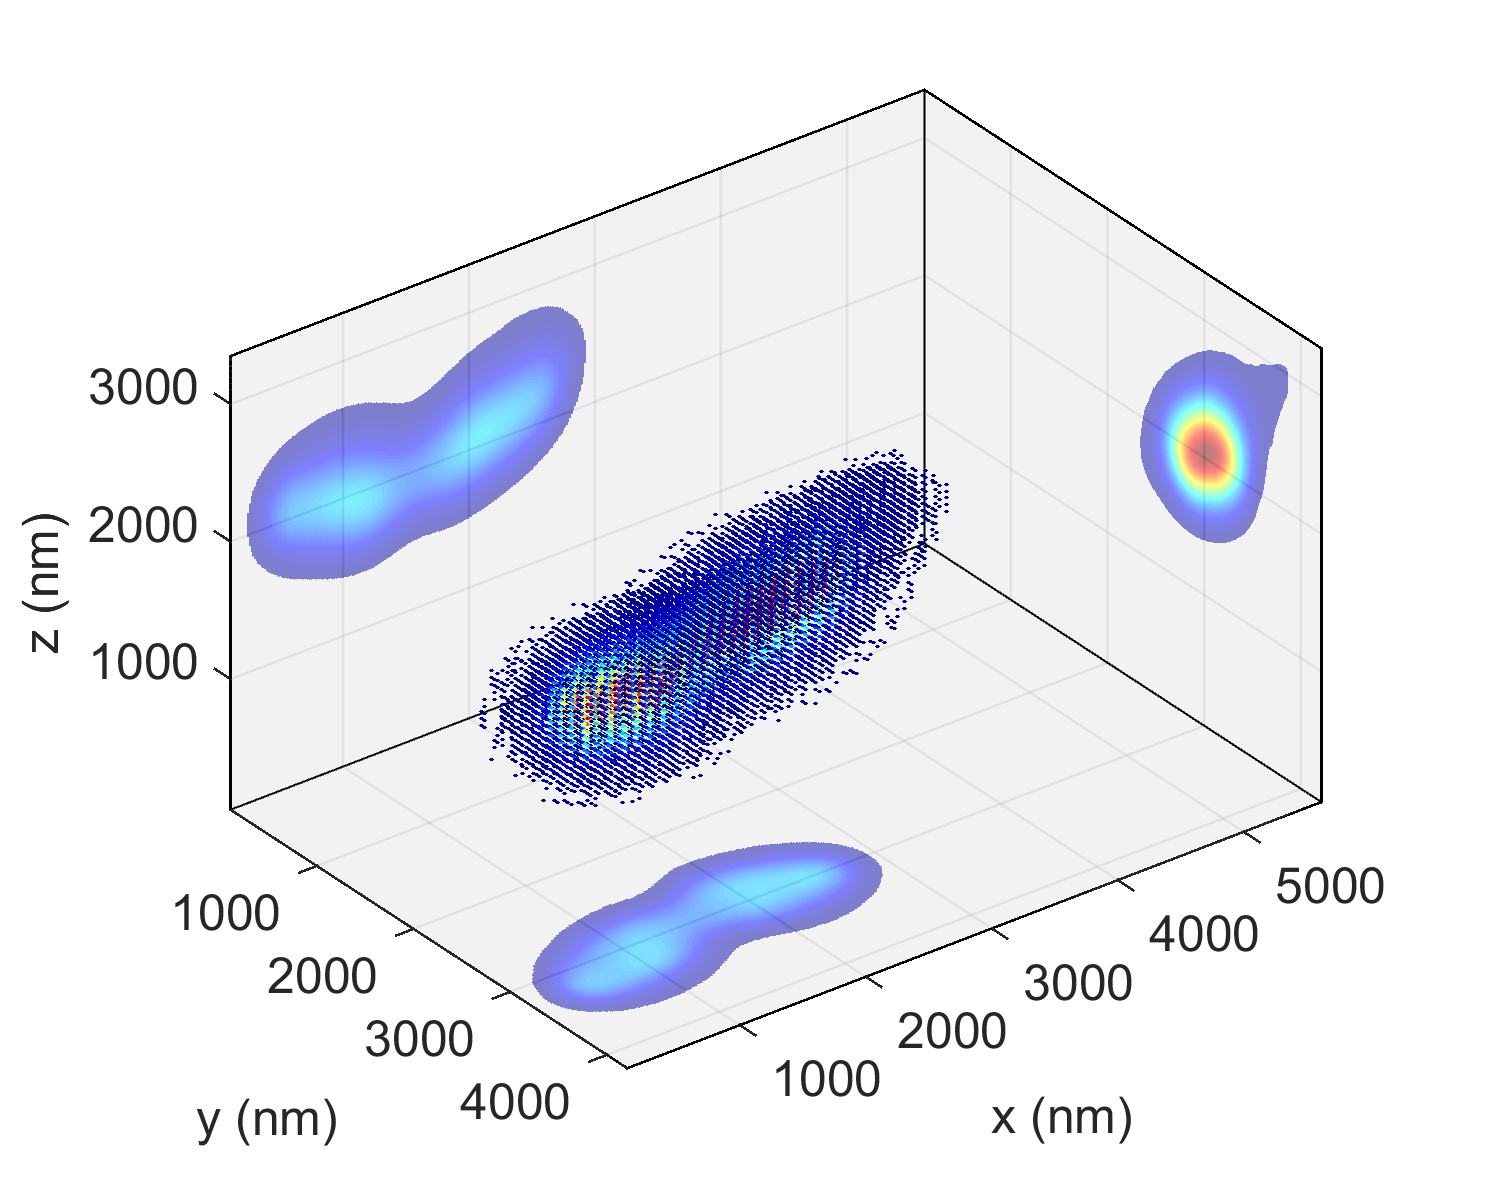
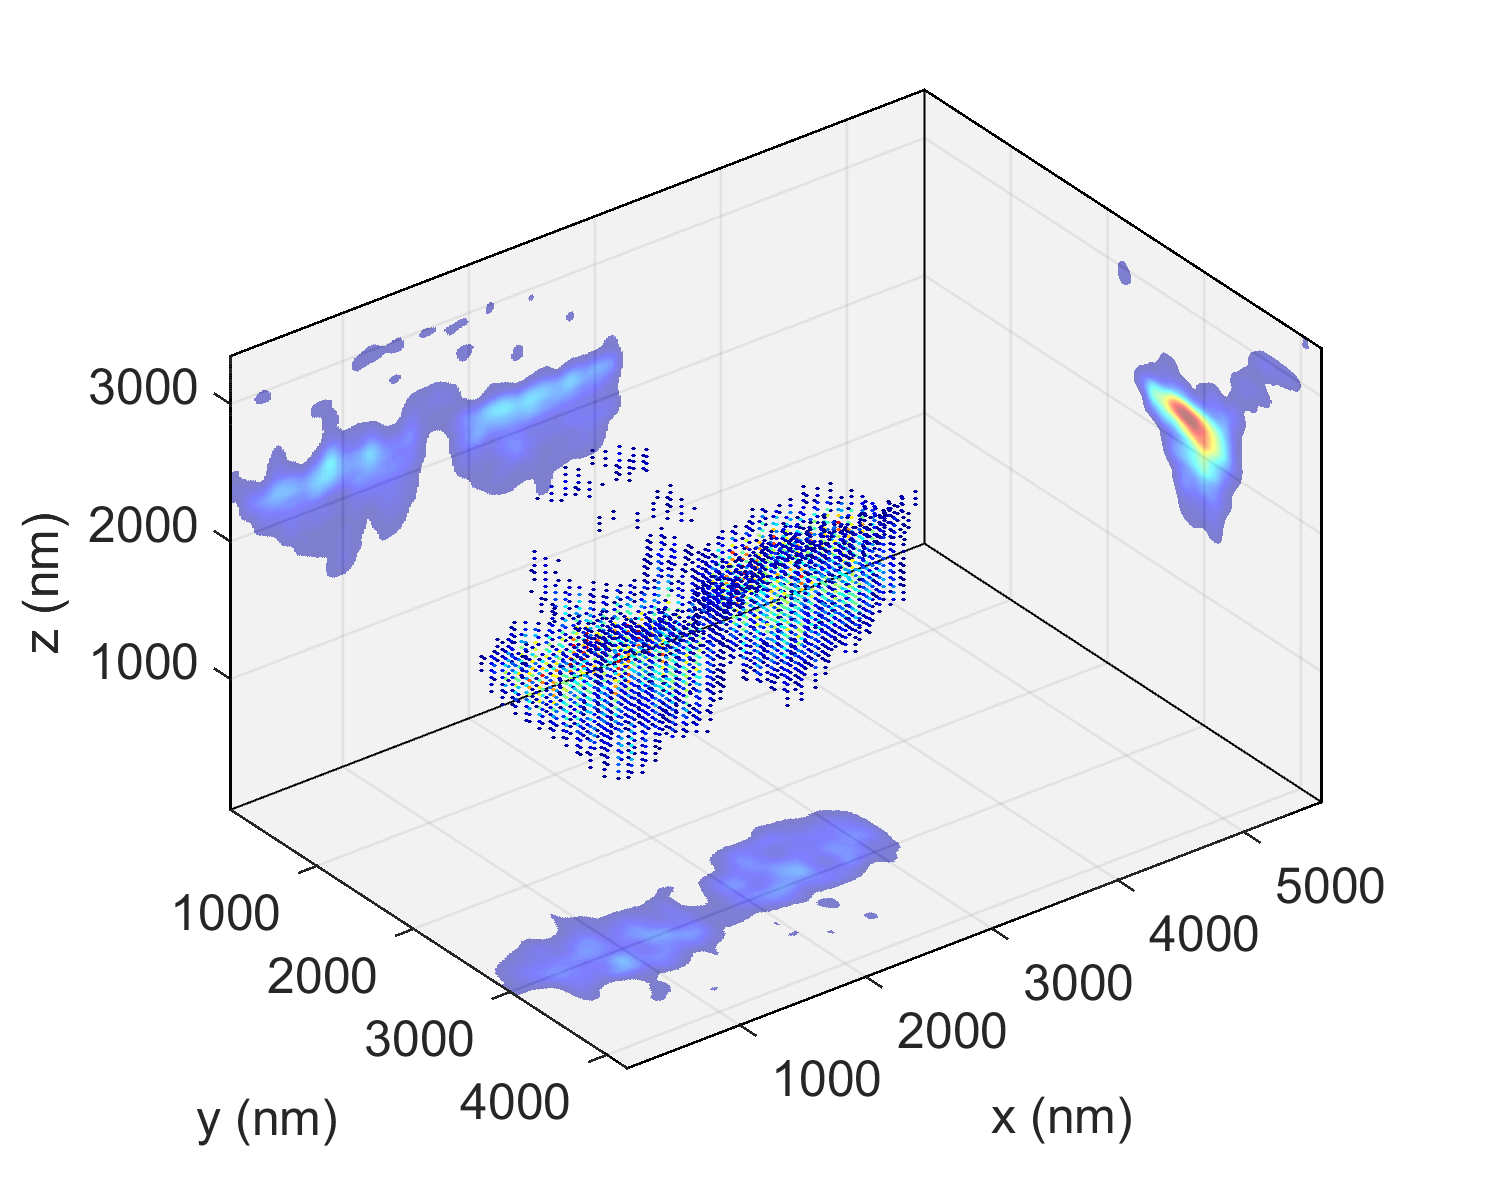
Three dimensional reconstructions of fluorescently labeled Pseudomonas fluorescens bacteria using this method compare well with volumetric data from a confocal microscope of the identical bacteria deconvolved with its point spread function (PSF) (figure 2(a) and (b)). The 3D snapshot data acquisition was over 600 times faster than the confocal data acquisition time; in this instance, 40 ms compared to 26 s.
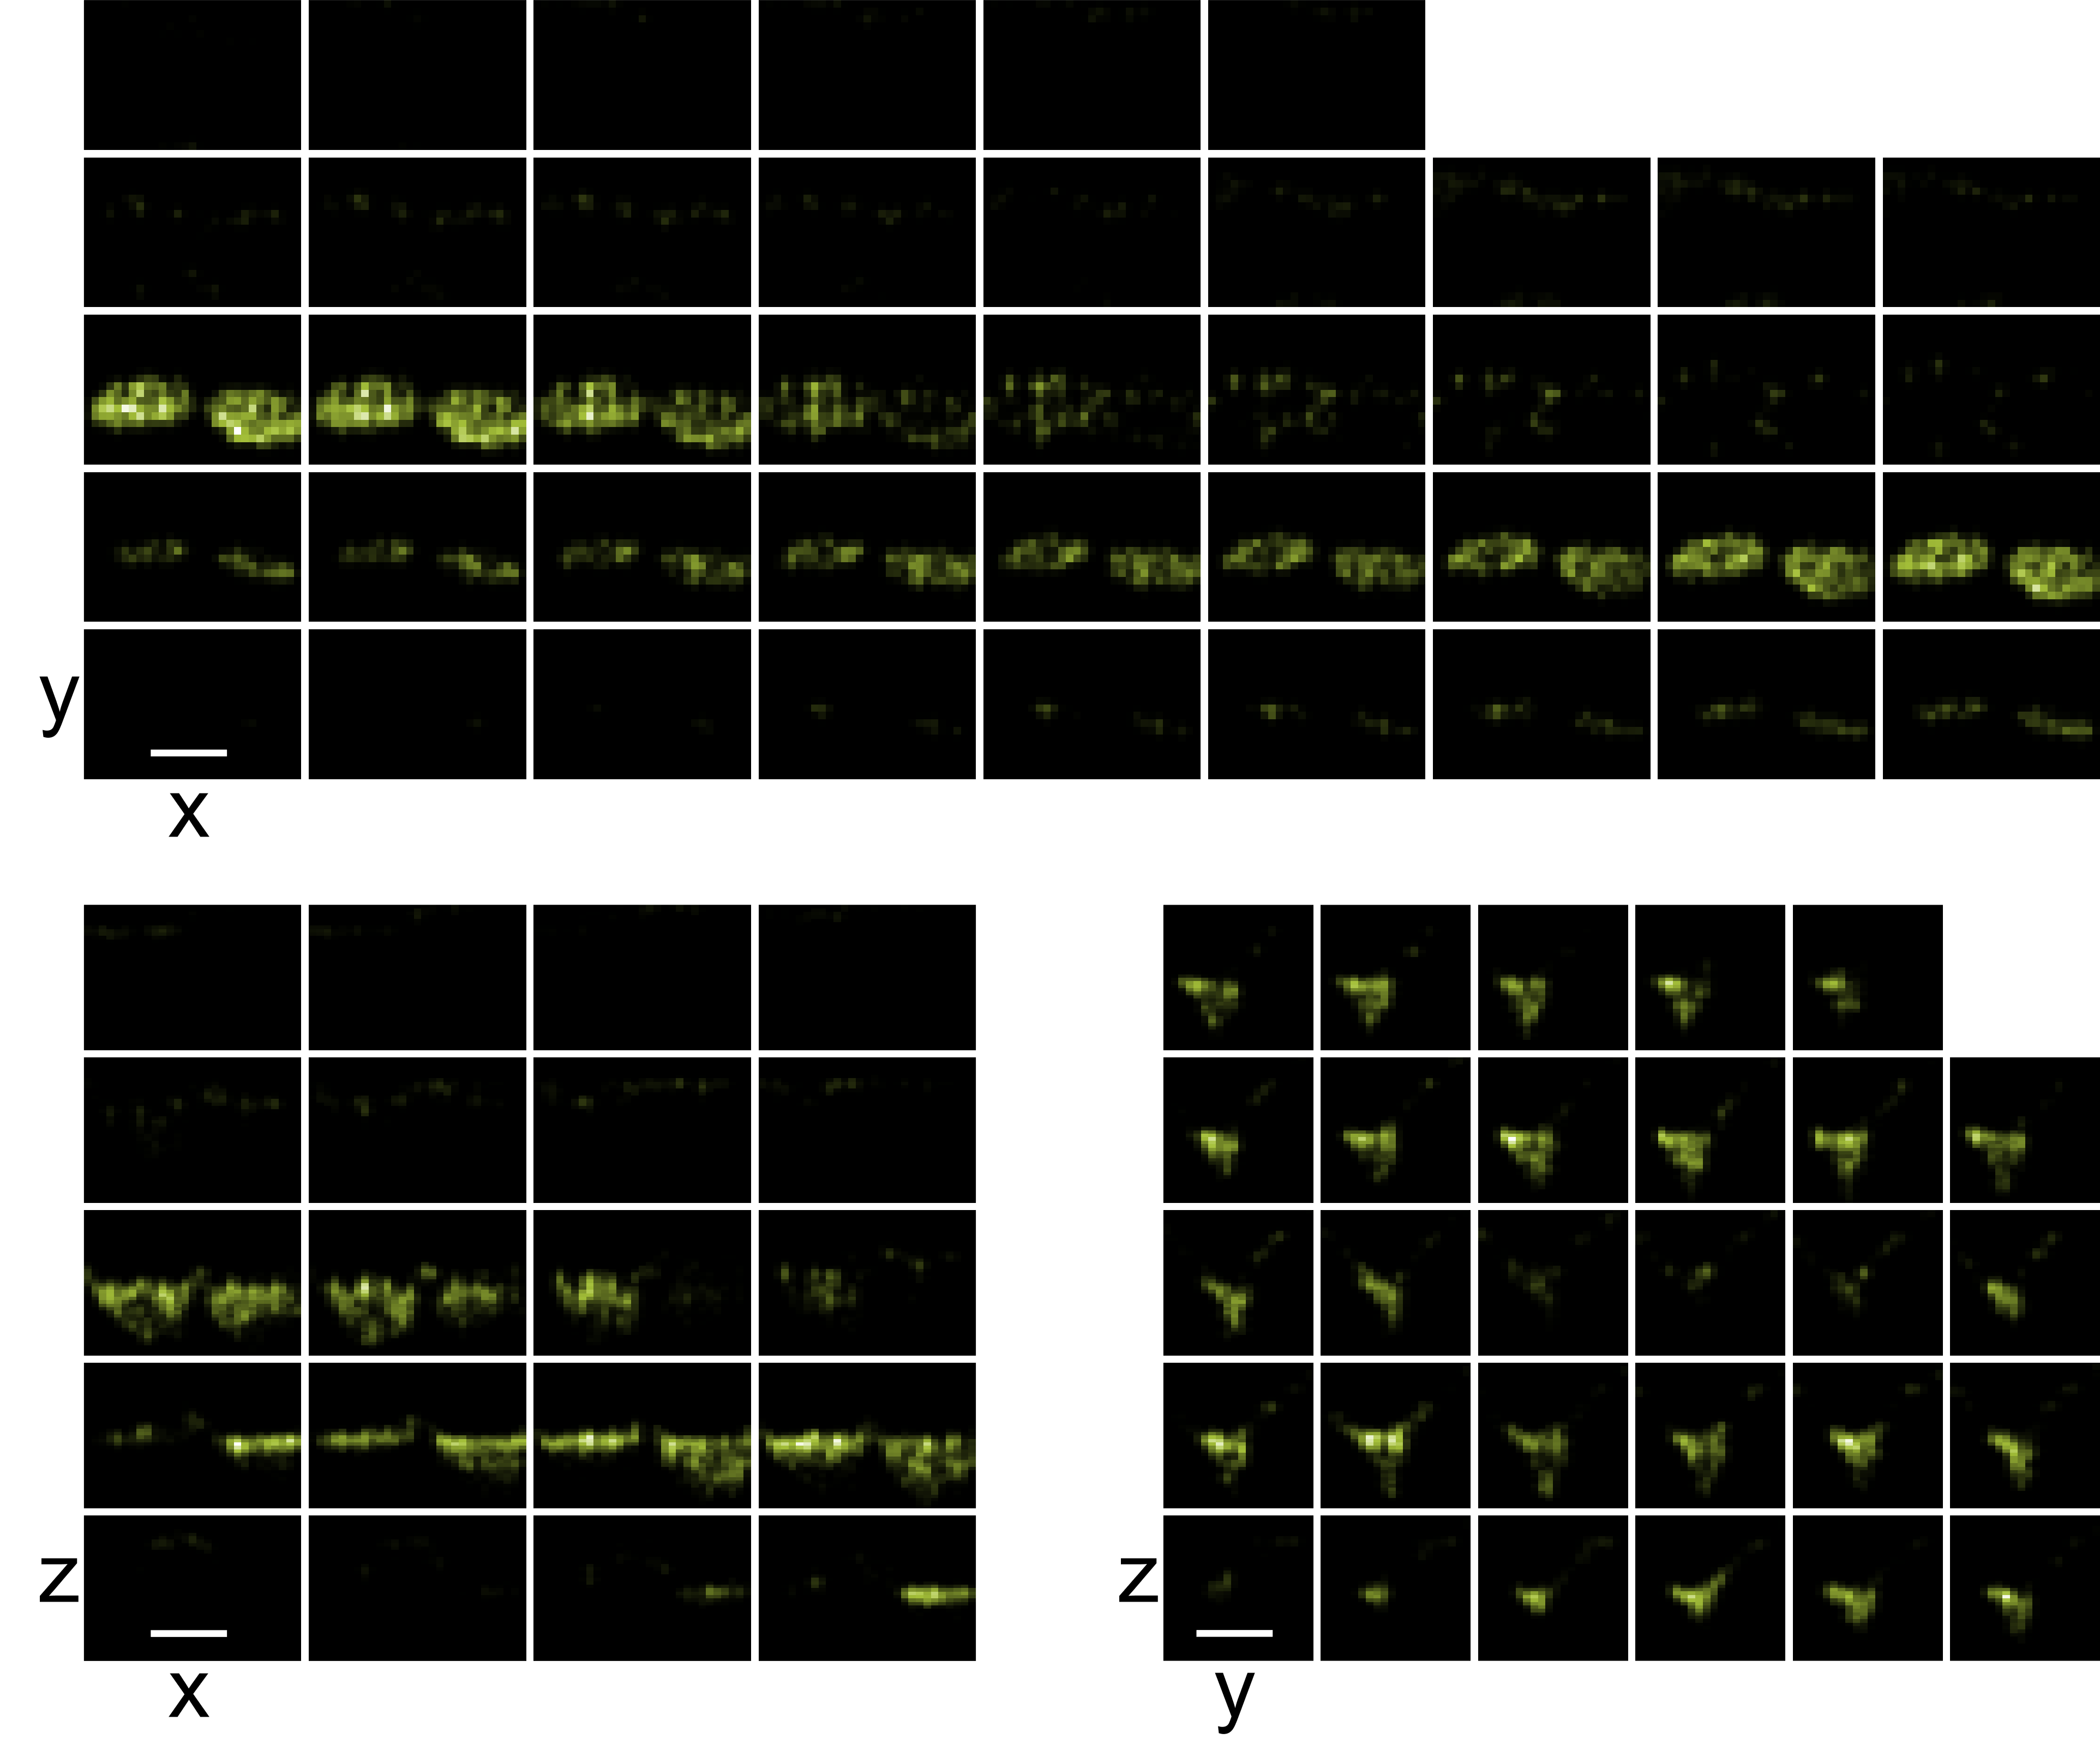
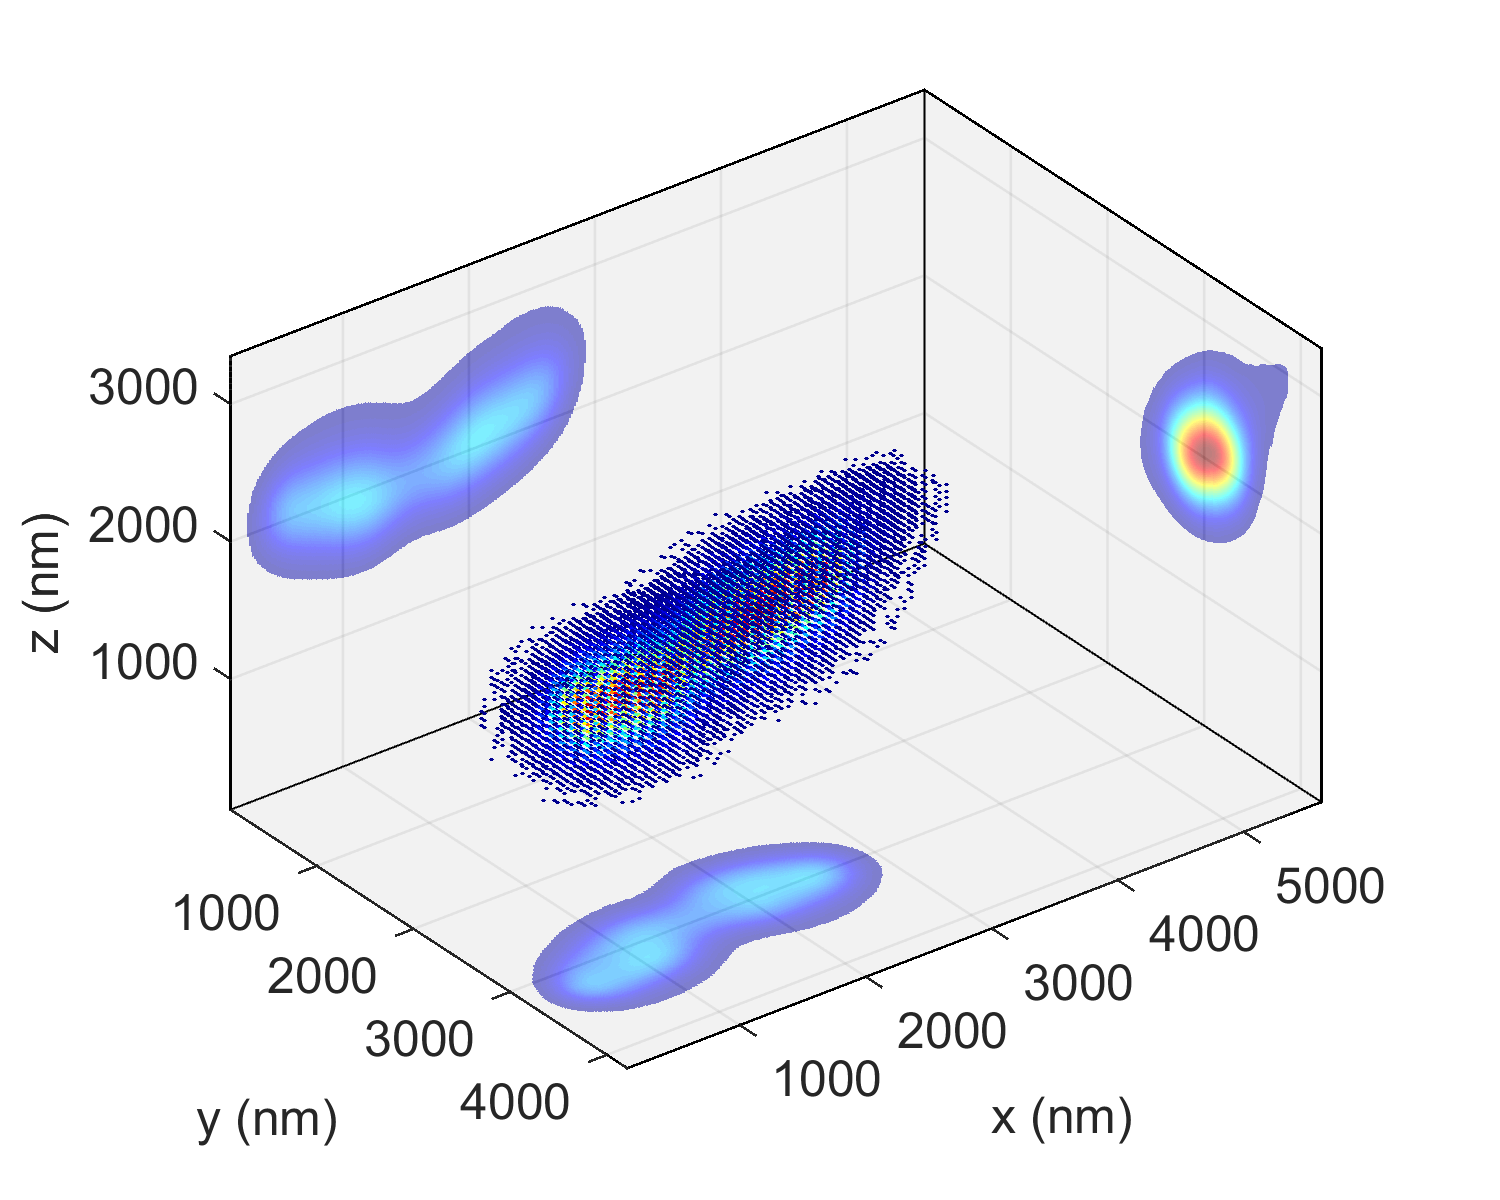
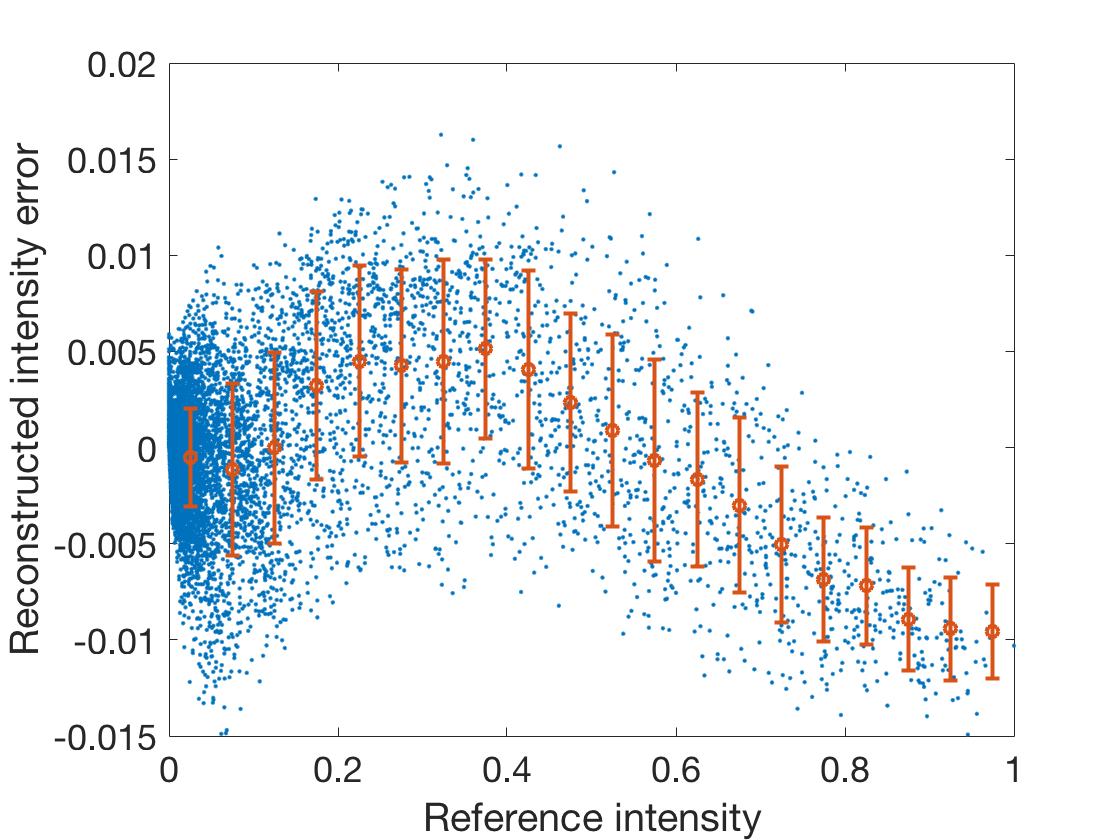
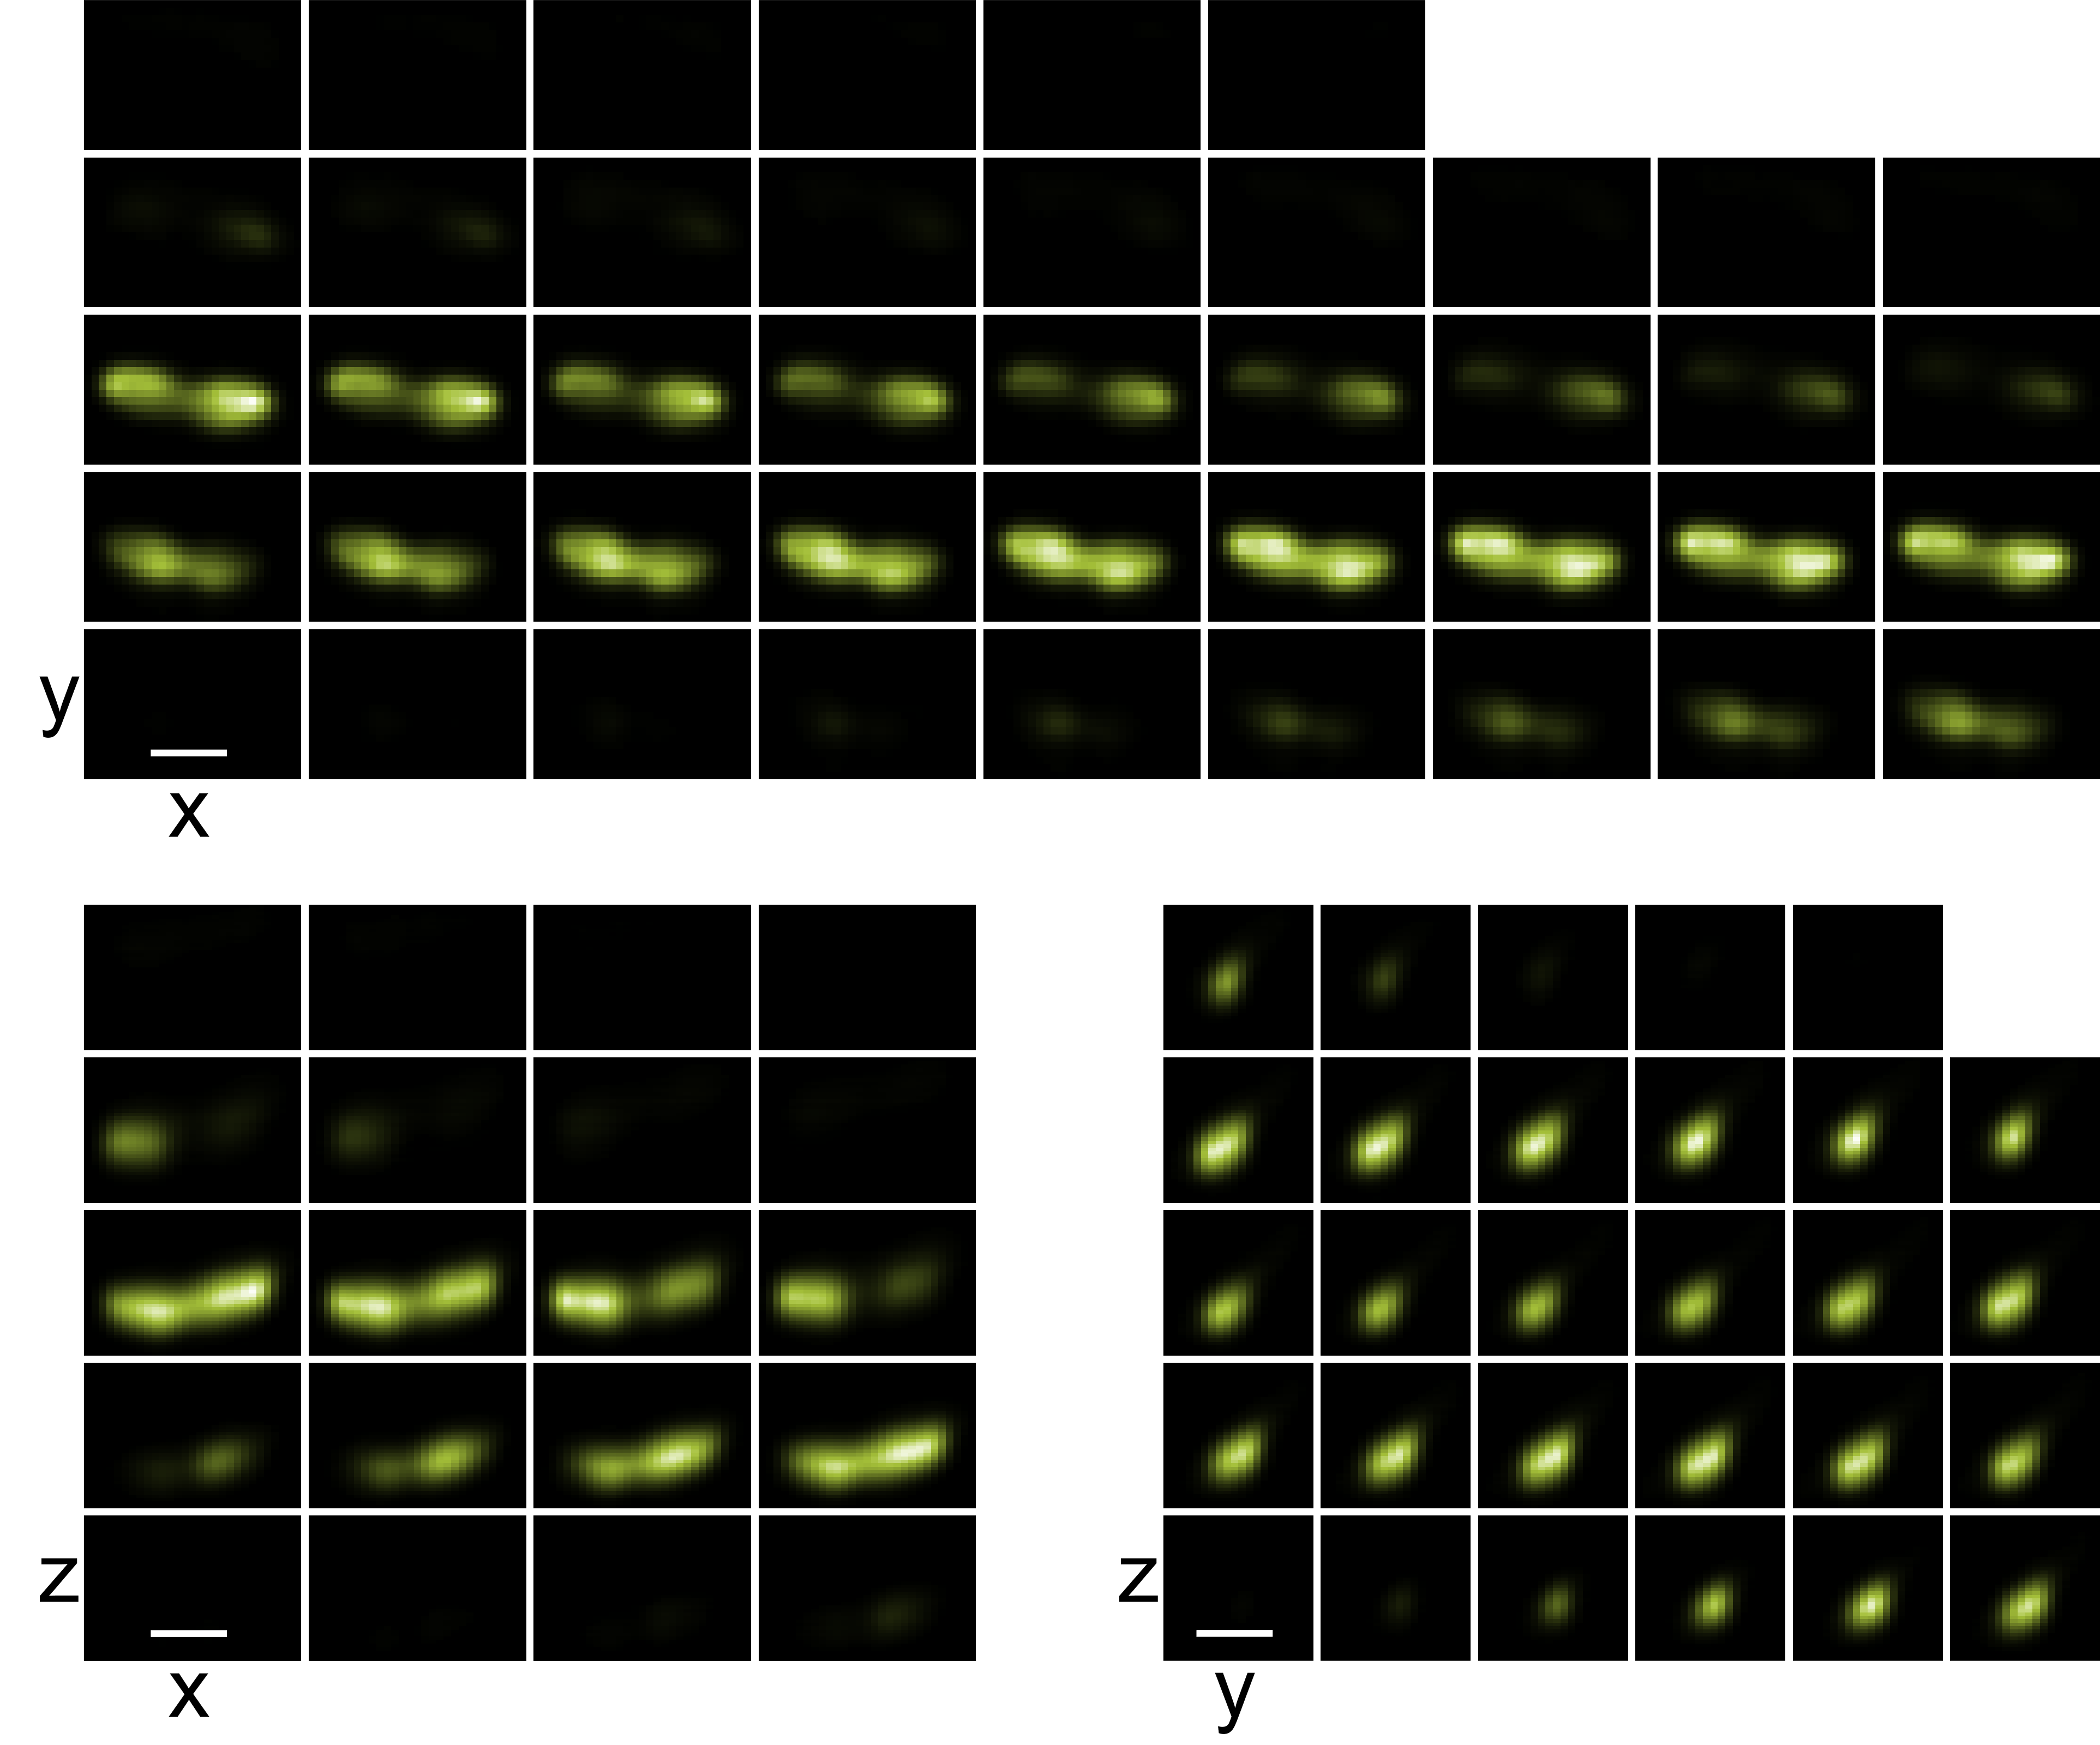
To validate our method, we first created a reference volume using confocal imaging of a single bacterium. This data was resampled to 108 nm 108 nm 50 nm. We simulated an MFM snapshot of the bacterium, as seen in figure 3, by applying the forward model to this resampled volume. The 3D reconstruction from this simulated snapshot provides us with a measure of the ideal performance of the algorithm in the absence of added noise. Analysis and visualization (figure 3(c-d)) of the voxel-by-voxel comparison of the reference volume to the 3D reconstruction demonstrate that each voxel value can be interpreted as a measurement of the intensity in the sample accurate to 1% of the peak intensity.
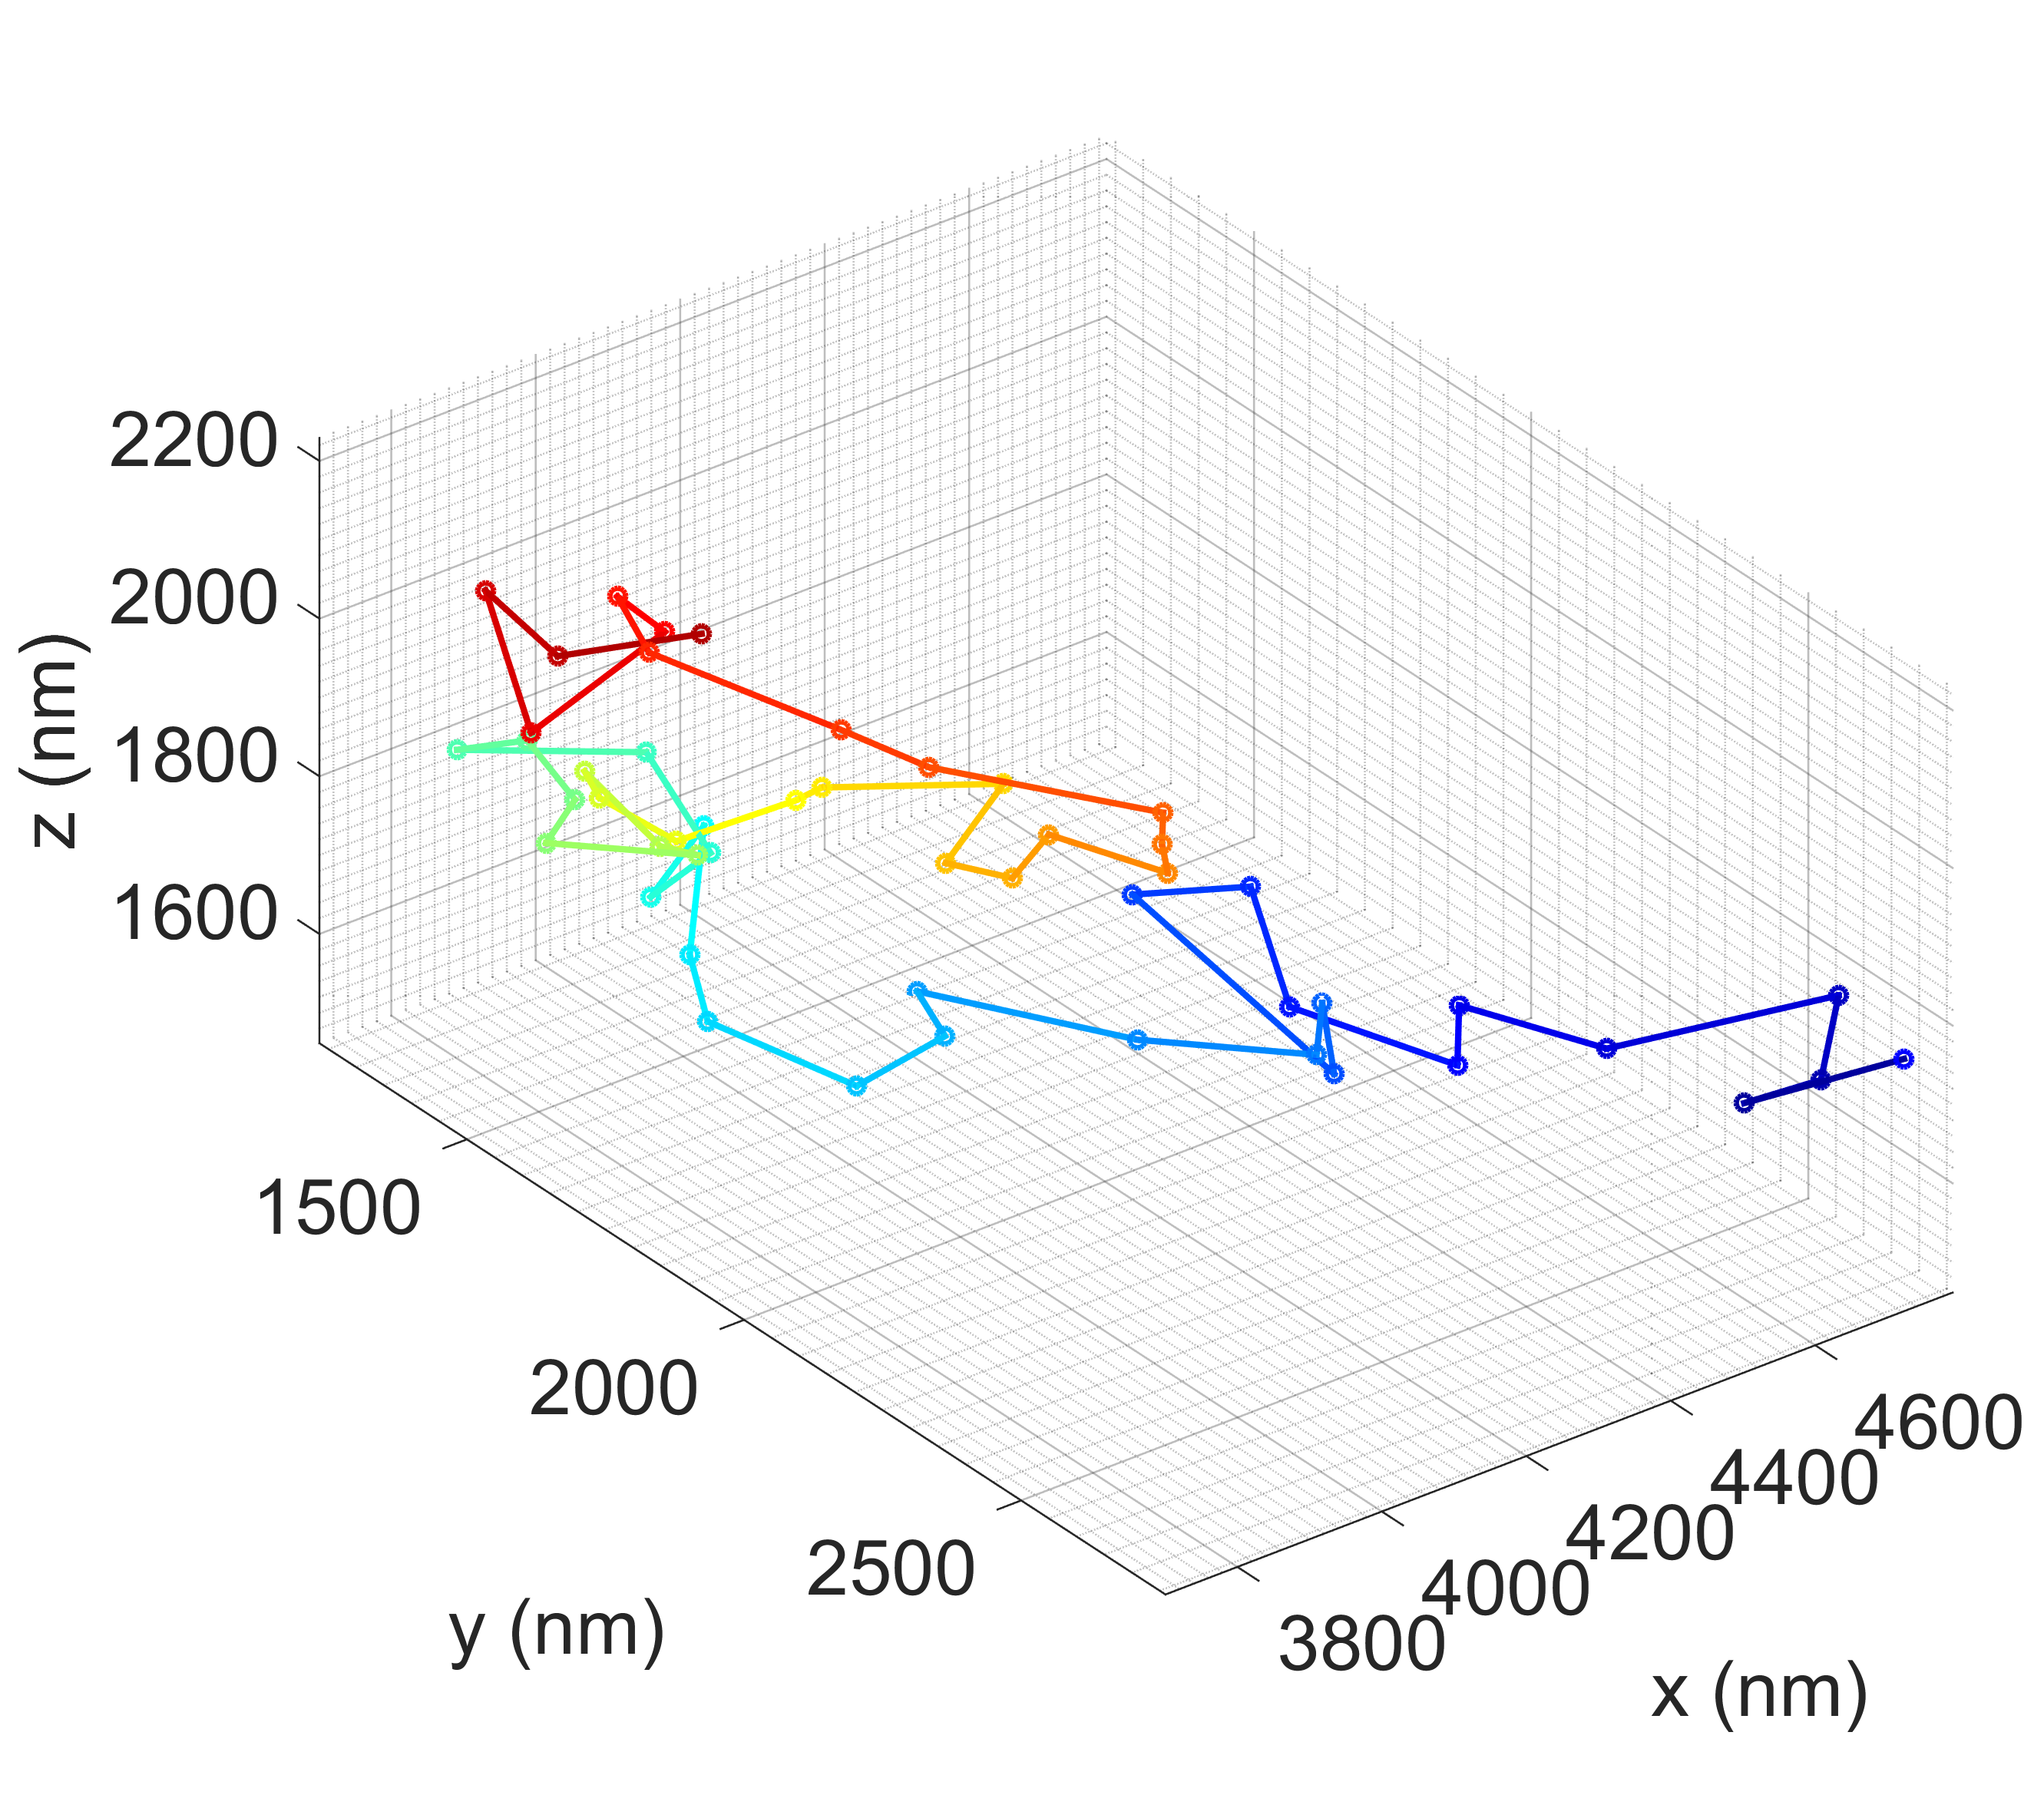
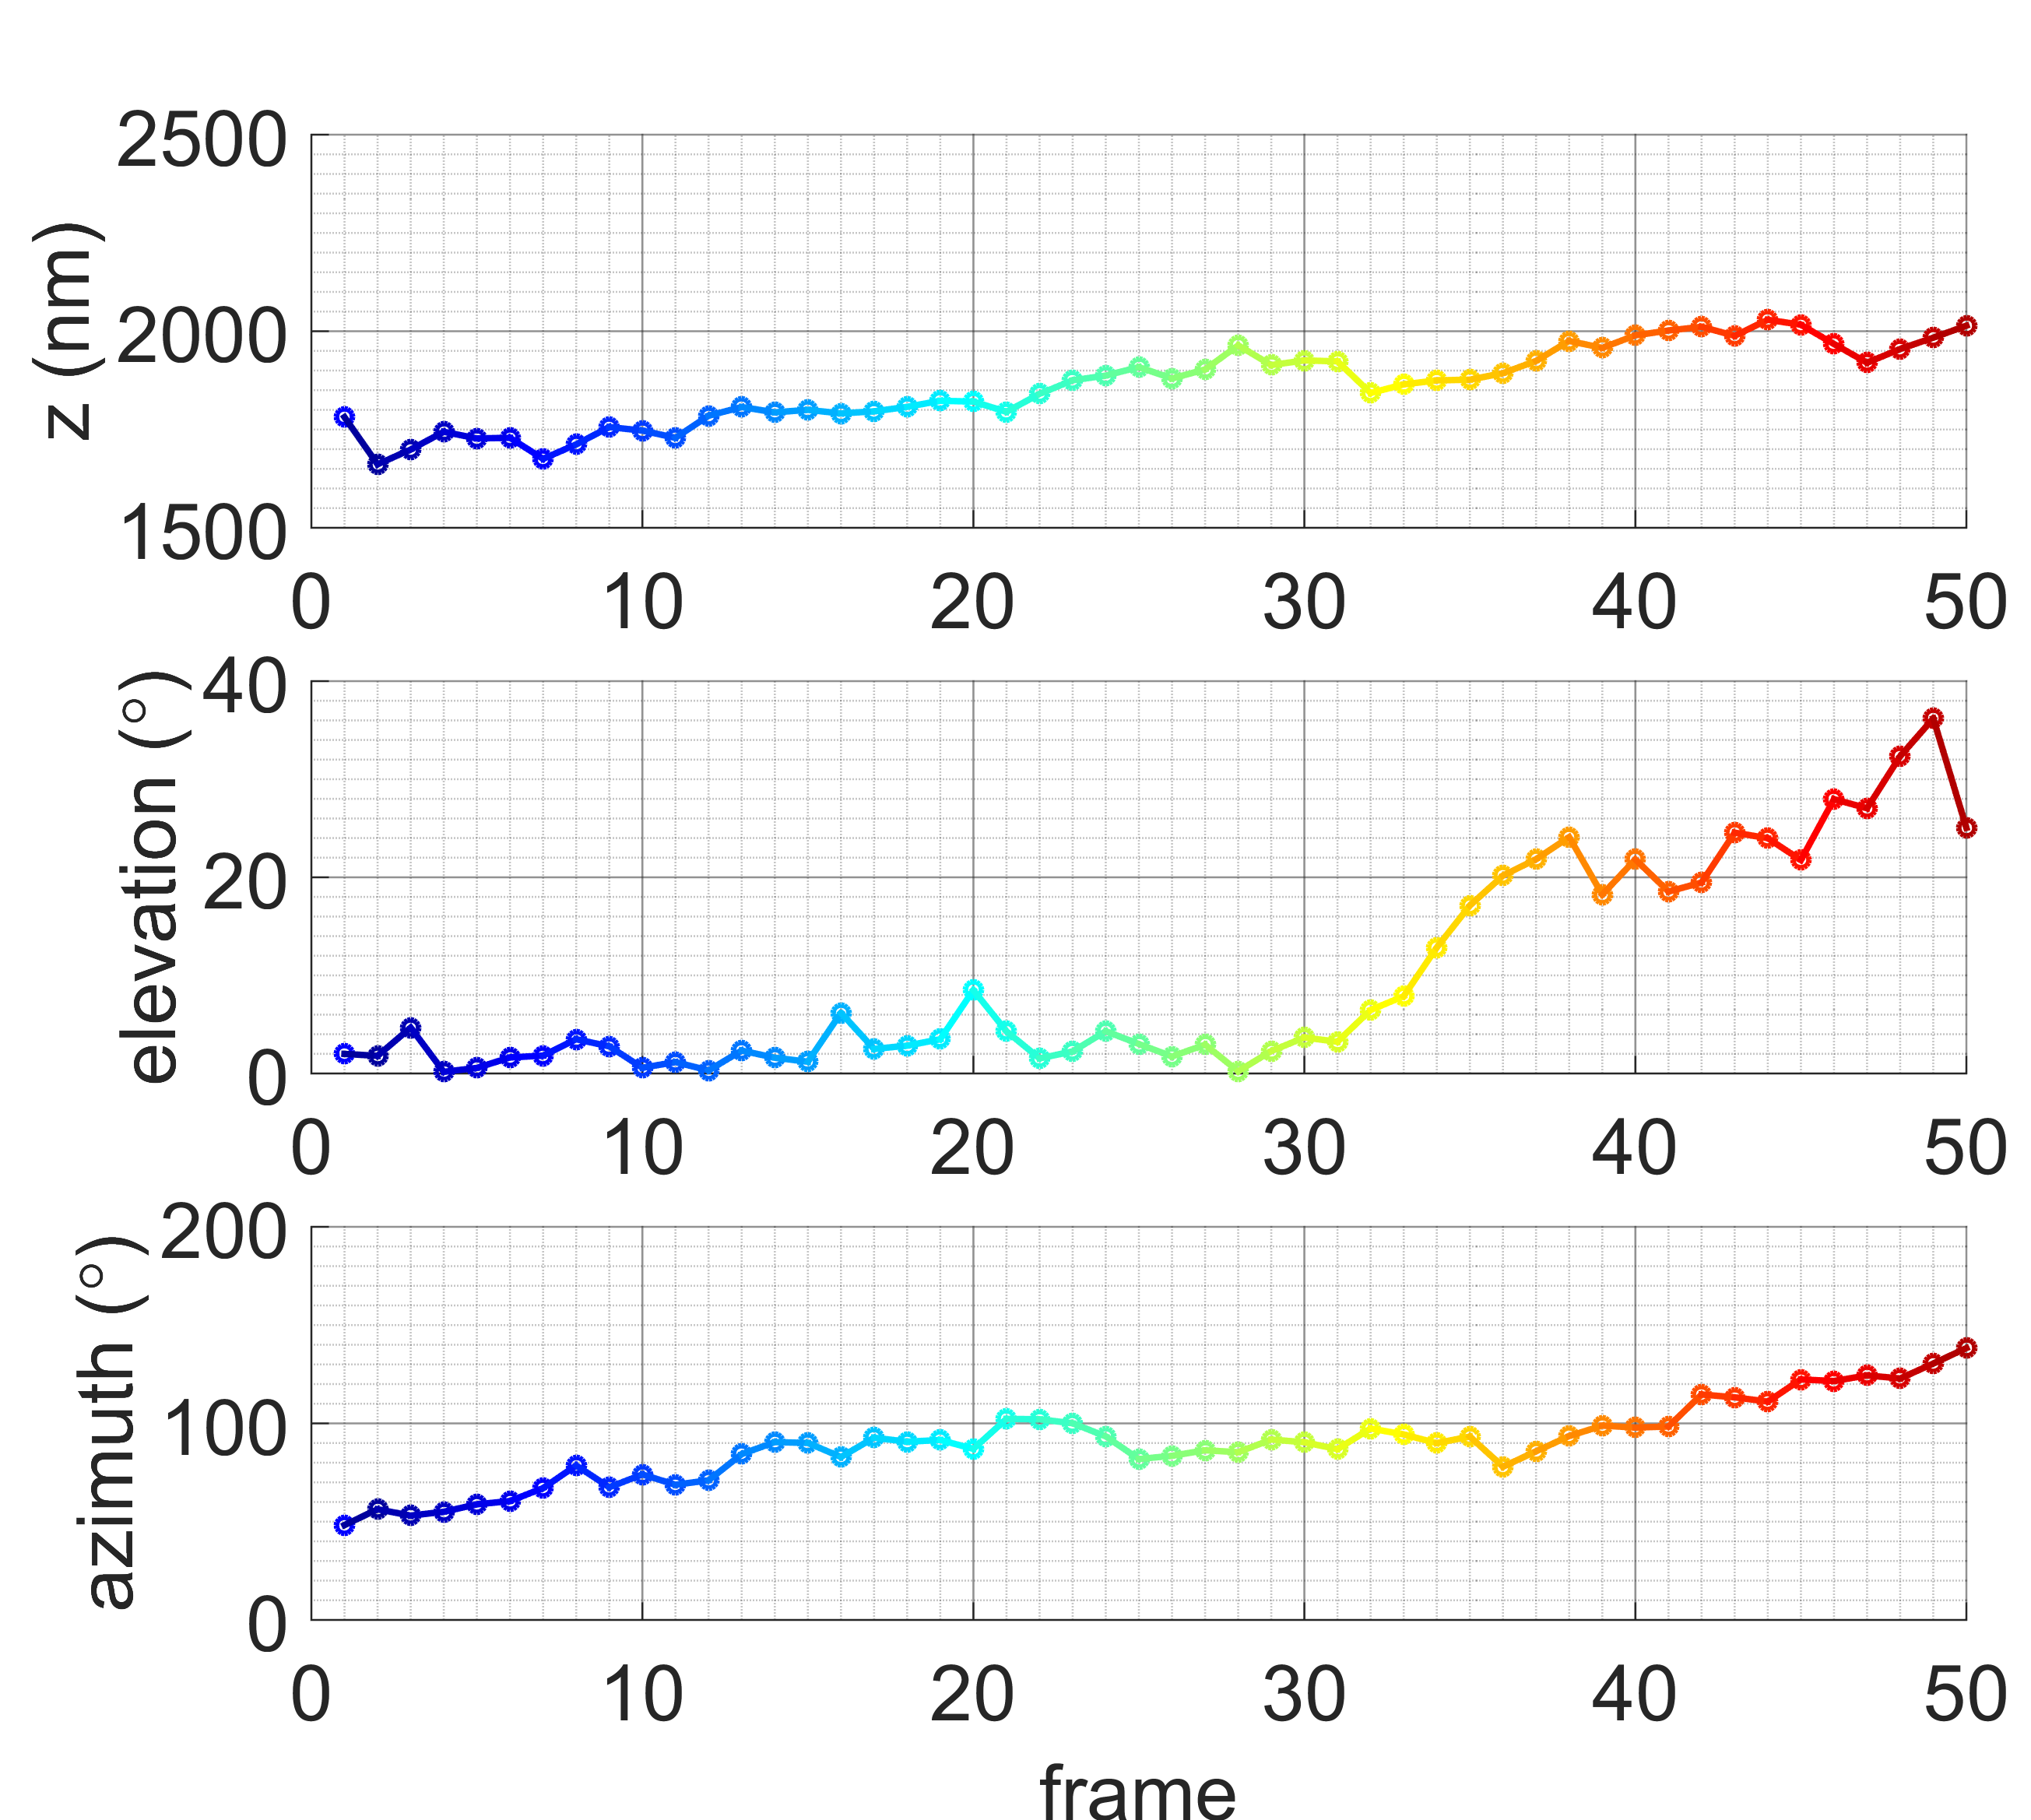
The imaging rate, signal to noise ratio (SNR), and robust reconstruction of the method allowed tracking the 3D motion of a chemically fixed bacterium (i.e., not live) diffusing in water to demonstrate its ability to capture dynamics of rigid body motion of a biological sample (movie S1). Figure 4 (a) plots the 3D coordinates of the centroid of the bacterium over 50 frames (2 seconds) and (b) plots the -position and the elevation and azimuth angles of the major axis of the bacterium. Its major axis remains parallel to the - plane (elevation angle near zero) for the first 30 frames while the bacterium turns freely about the -axis (azimuth angle). As the centroid moves upward in , presumably away from the coverslip, the bacterium is able to tilt upward, increasing the elevation angle of its major axis. We believe this is the first demonstration of 3D volume reconstruction at these frame-rates for extended objects.
Discussion
The 3D snapshot MFM imaging system simultaneously captures a full 3D dynamic fluorescent scene of approximately 20 m 20 m 10 m in size at 25 Hz rendered with 108 nm 108 nm 50 nm voxels. Its snapshot capability distinguishes it from conventional microscopies, which is of particular significance for studying high speed dynamical processes. Computational imaging in this system enables a relatively inexpensive alternative to complex optical elements while extending the reach of MFM to include capture of complex scenes including extended objects and confusion-limited aggregates of point sources. Further development of this method to improve resolution and accuracy by better characterization of the instrumental PSF, improved accounting of the image noise model, and improved modeling of the image priors will further enhance its potential to contribute to the study of dynamical processes at very high spatio-temporal resolution.
Methods
The following sections give details on the experimental and mathematical methods in support of the results presented in the paper.
Multifocal Microscope.
Our multifocal microscope was built around a Nikon Eclipse Ti inverted microscope and is outlined in Figure 1(a) in the main text. Our instrument is based on the design in [8]. In a significant departure from that design, we discard the aberration correcting elements–the chromatic correction grating and custom multifaceted prism and address aberration correction computationally in image reconstruction. The sample (S) was mounted on a mechanical stage (Ludl 99S106-N2K- LE2, controller MAC5000). Epifluorescence emission collected through the objective (OBJ, Nikon 60x 1.27 NA CFI Plan Apo water immersion, MRD07650) was separated from excitation light by a dichroic mirror (DM, Semrock 488 LP, Di03-R488-t3-25x36) and bandpass filter (BP1, Semrock 520/28, FF02-520/28-25). Excitation light was bandpass filtered (EX, Semrock 472/30, FF02-472/30-25) from the cyan channel (196 mW LED) of a Spectra X light engine (Lumencor). A field stop (FS) crops the field of view to 1 mm2. The field stop consists of a circular mm diameter by 1 mm thick fused silica substrate (Thorlabs WG41010) with a 50 nm Cr layer deposited on the entire surface except for a 1 mm square in the center. A 4-f lens system relays the light from the side port onto the camera (Andor iXon Ultra 888 EMCCD) with an additional 2x magnification for a total system magnification of 120x. The first lens (RL1, f = 200 mm, Thorlabs AC508-200-A) matches the focal length of the tube lens (TL, Nikon, f = 200 mm) and images the secondary pupil plane of the objective onto the custom-made (see below) MFM diffractive optical element (DOE). The second lens (RL2, f = 400 mm, Thorlabs AC508-400-A) images the diffracted and shifted fields of view from the DOE onto the camera (EMCCD). A second, narrower bandpass filter (BP2, Semrock 520/15, FF01-520/15-25) is placed immediately before the camera to narrow the bandwidth of the emission light to mitigate chromatic aberration. The 120x magnification gives a theoretical lateral pixel size of 108 nm, which was confirmed by imaging a ruled slide. The lateral field of view in each MFM tile is 16.6 m by 16.6 m (Figure 1a, main text).
MFM Diffractive Optical Element Design and Fabrication.
The MFM DOE was designed with an undistorted pitch of 91 m and a focal shift nm between tiles following a procedure outlined by Abrahamsson et al.[8]. The result of the iterative algorithm is a binary grating function representing phase shifts of 0 and at each pixel.
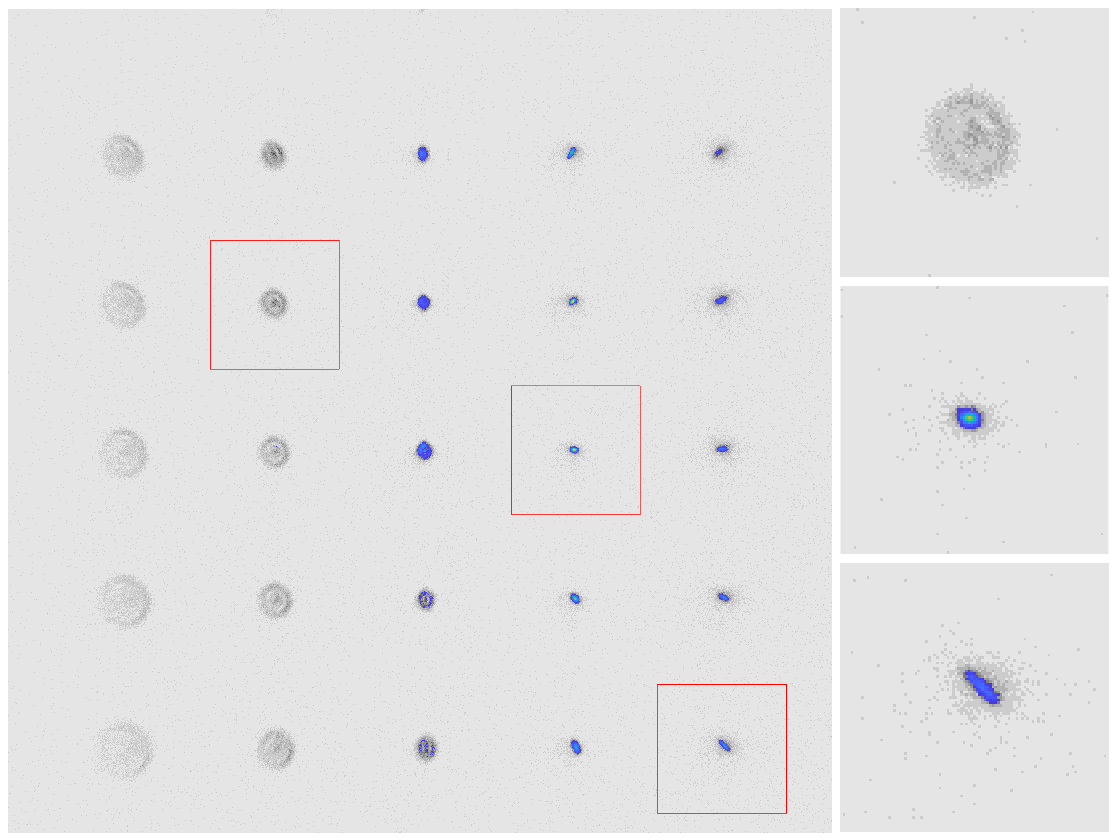
Our grating function produces a 5 by 5 grid and has a diffraction efficiency of 78%. In order to construct the DOE, a 5-mm thick UV fused silica substrate (Thorlabs WG41050) was cleaned by using an oxygen plasma and spin-coated with a 2 m layer of S1813 photoresist (Shipley). A laser writer (Heidelberg) exposed the MFM grating pattern into the photoresist (402 nm laser at a dose of 80 mJ). The photoresist was developed in AZ-300 MIF developer (Integrated Micro Materials) for 20 s. Then the pattern was etched in a fluorine reactive ion etcher (RIE, Oxford Instruments). The etch depth of 578 nm for the design wavelength of 525 nm was etched by using gases Ar (25 standard cubic centimeters per minute (sccm)) and (25 sccm), an RF power of 200 W, and inductive plasma coupling power of 250 W (etch rate of 32 nm/min, 1:7 photoresist to fused silica selectivity). The photoresist remaining after etching was stripped with acetone in an ultrasonic bath. The mean amplitude of the surface roughness of the finished diffractive optic was determined to be using contact profilometry. All fabrication steps were completed at the Pritzker Nanofabrication Facility at the University of Chicago. The MFM grating produced with this procedure is shown (inset) in Figure 1a. Examples of the resulting MFM image structure (Figure 5) show the placement of 25 focal shifted sub-images folded into a 5 5 grid of tiles on the detector.
Pseudomonas fluorescence SBW25 Strain Modification and Sample Preparation.
SBW25, isolated from sugar beet leaf in 1989, is widely studied as a model system of plant colonization and plant-microbe interactions [20]. Its genome has been sequenced and analyzed by Silby et al. [21]. SBW25 has plant growth promoting properties and acts as a biocontrol agent, mediating systemic resistance to bacterial, fungal, and oomycete pathogens (for example, Trippe et al. [22]; Naseby et al. [23]). We aim to study the dynamics, organization, and interactions of SBW25 with plant roots and other microbial species in the rhizosphere. To achieve this objective, we have labeled SBW25 with a rhizosphere-stable plasmid expressing the fluorescent protein mNeonGreen [24]. The plasmid is a derivative of pME6031 [25] and was adapted for our use by introduction of a constitutive promoter for strong expression of the fluorescent protein. The plasmid is stably maintained in SBW25 during rhizosphere colonization permitting bright labeling of SBW25 in the absence of selective pressure.
SBW25 bacteria expressing unconjugated mNeonGreen were prepared fresh by transferring a colony from an agar plate with a 1 L sterile loop to 5 mL of nutrient broth. The bacteria then were grown in the dark for 10 hours at room temperature with gentle agitation. After growth, the bacteria were chemically fixed as previously described [26, 27] to preserve the mNeonGreen fluorescence.
All samples were prepared on a mm No. 1.5H ( m thickness) glass coverslip (Bioscience Tools, San Diego, CA), mounted onto a 1 mm thick glass slide (Fisher Scientific), and sealed with nail polish (Electron Microscopy Sciences, Hatfield, PA). For PSF measurements (Figures 5a and 6), 170 nm carboxylated polystyrene beads infused with green fluorophores (Invitrogen) were diluted 100-fold in poly-l-lysine (Sigma). A 1 L drop was pipetted on the coverslip. The coverslip was mounted as described above. The coverslips were plasma cleaned for samples of stationary bacteria (Figures 2 and 3 in the main text, Figure 5b)After cleaning, three fiducial marks were made on the sample side of the coverslip with permanent marker in order to be able to relocate the same bacterium between the MFM and confocal microscopes [27]. Then, a 1 L drop of the diluted (M9 buffer) fixed bacteria suspension (20,000 bacteria) was pipetted onto a coverslip, and the coverslip was mounted as described above. For diffusing bacteria samples (Figure 4, main text), a 10 L drop was pressed between the coverslip and glass slide. The sample was prepared immediately before imaging, because the untreated glass would slowly adsorb the bacteria.
Confocal Microscopy and Correlative MFM-Confocal Imaging.
Confocal microscopy images were acquired with a 100x 1.45 NA oil immersion objective (Nikon 100x NA 1.45 Plan Apo oil immersion, MRD01905) through a Yokogawa W1 spinning disk (CSU-W1, 50 m pinhole; Solamere Technology Group, Salt Lake City, Utah) attached to a Nikon Eclipse Ti. The W1 was equipped with a custom 1.83x magnification lens insert (Solamere Technology Group) for a total magnification of 183x. The resulting pixel size was 71 nm on the detector (Andor iXon Ultra 888 EMCCD) as measured with a ruled slide. mNeonGreen fluorescence excitation employed a 488 nm laser diode (Spectra-Physics Excelsior One 488C-100) and emission was filtered by a dichroic beamsplitter (Semrock, Di01-T405/488/568/647-13x15x0.5) and emission filter (Chroma, ET525/50m). Data collection and system control were managed by Manager software[28].
Correlative imaging between MFM and confocal microscopy was accomplished by using the FARMER method [27] to relocate the field of view from the MFM mechanical stage to the Prior mechanical stage (Prior stage H117E1N5/F, controller H31XYZ7EF) on the confocal microscope. Several bacteria with unique shapes and in sparse locations were imaged by using MFM, and their x, y, z coordinates were recorded with Manager. The fiducial marks on the cover slip were imaged using brightfield microscopy and the x, y, z coordinates were recorded. The coordinates provided by FARMER were used to relocate each bacterium. The unique shapes and sparsity of the sample allowed for correction of small errors in the relocation. The confocal images stacks were acquired with a step of 50 nm, an EM gain of 250, and an exposure time of 200 ms. These image stacks were used as part of validation of the computational image reconstruction method we developed.
Imaging Acquisition Parameters.
For diffusing bacteria (Figure 4, main text), the detector was operated at the hardware maximum 25 Hz frame rate (full frame) with an EM gain of 760. The motion of the bacteria induced motion blur when using a 40 ms exposure, as in previous experiments. In order to further reduce motion blur, the exposure time was reduced by strobing the excitation light synchronously with camera exposure with a duty cycle (i.e., illuminated for 20 ms of a 40 ms exposure) using custom software written in Labview.
MFM Forward Model.
We present a mathematical model describing the formation of the 2D MFM image from the 3D object volume. This forward model incorporates the physical elements of the system and provides a tool to be used both in our reconstruction algorithm, to recover a 3D object volume from a measured 2D MFM image, and in our simulation experiments, to generate a simulated 2D MFM image from a given 3D object volume.
The MFM forward model links a 3D volumetric fluorescence distribution in object space (e.g., from a bacterium) with its corresponding 2D MFM image in the microscope’s detector space. We discretize the sample volume into voxels and denote by the intensity of voxel . Because the emitted fluorescent light is incoherent, the image formulation process is linear in power; hence, for each tile , the observed 2D image of the volumetric object is a linear superposition.
The imaging system is shift invariant within each tile so that the image formation model can be expressed as the 2D convolution of the source volume with the PSF tile and then summed along ,
| (2) |
where . We have verified the intra-tile spatial shift invariance both by simulation and experiment. This property is essential in order to quickly measure the PSFs and develop efficient reconstruction algorithms that utilize fast Fourier transforms (FFTs). Figure 1b (main text) is a pictoral representation of Equation (2).
In our computations we set the dimension of the voxel as 50 nm to match the step size used when measuring the PSF, and we set the and dimensions (108 nm) of the voxel to match the sensor’s pixel pitch ( m) divided by the magnification . Those choices are convenient because they remove the need for resampling when applying the forward model. The most appropriate choice of resolution parameters (voxel dimensions) will generally depend on the signal-to-noise ratio, number of focal planes sampled by the MFM snapshot (25 in our setup), and step size used in measuring the PSF.
To simplify the notation and formulate the volume reconstruction as a optimization problem, we represent and in lexicographic vector form [29] from the 3D object voxels and the entire set of 2D sensed pixels for each tile.111A 2D image or 3D volume can be laid out as a single vector. In MATLAB™syntax, for example, the volume f(:,:,:) can be represented lexicographically by using the expression f(:). We can now rewrite Equation (2) as the linear matrix vector multiplication,
| (3) |
where the elements of the coefficient matrix are a reorganization of the elements of the PSF for each tile . Note that the matrix characterizes the effects of the elements of the optical system including the DOE, wavelength of light, pixelization at the detector, field stop, and lenses. Errors in the forward model arise from multiple sources such as noise in the measured PSF, errors in the PSF, and errors in modeling the effects of the field stop.
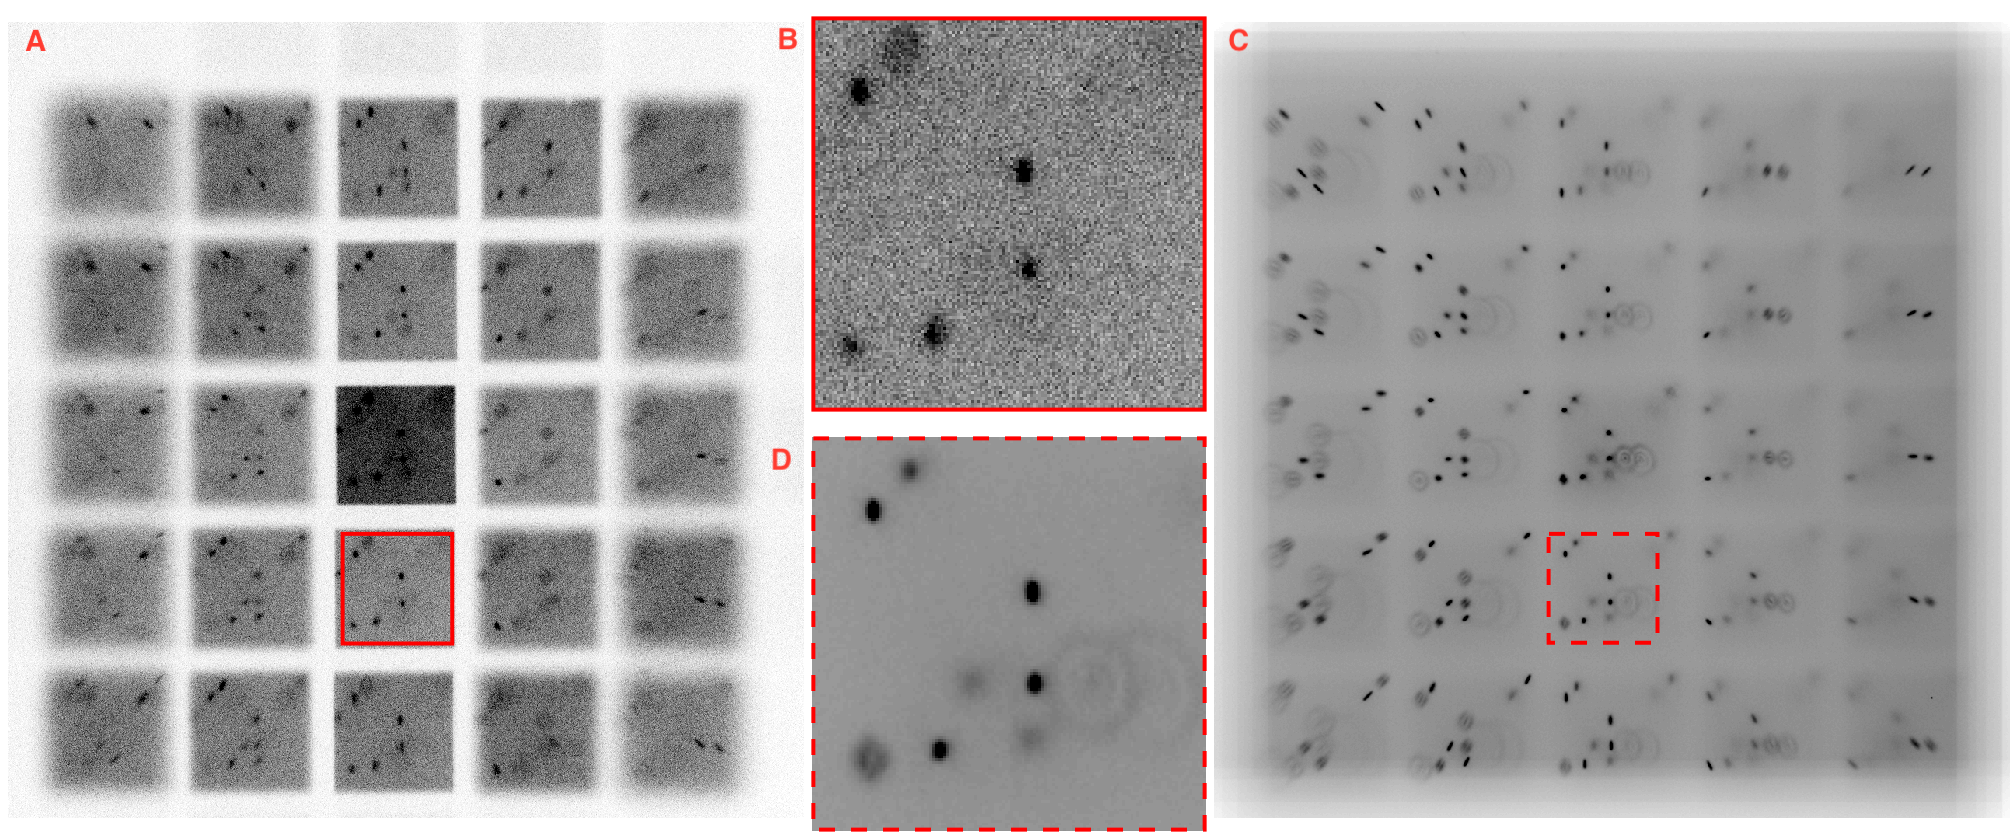
Figure 6 demonstrates the ability of the forward model to represent a measured MFM image of a 3D scene. A volume containing 15 point sources is used as input to our forward model. The image on the left side shows the forward model for this volume. The point source locations are selected based on the MFM image shown on the right.
Computational Reconstruction of a 3D Object Image from a 2D MFM Image.
Our goal is to reconstruct 3D information about biological objects from MFM images. Previous MFM systems [10] have developed approaches that localize point sources. These approaches will not be applicable to recovering extended objects, such as unresolved distributions of fluorescent molecules with a bacterium. Here we present an approach that will recover the detailed distribution of fluorescence in an extended object. Using the forward imaging model, we restate our goal using the terms in Equation (3). We treat our MFM measurements as compressive (i.e., ) so that inversion of Equation (3) is an ill-posed problem. As is common for ill-posed problems, we recover the 3D volume by finding the solution to the following minimization problem,
| (4) |
where the left hand term tries to enforce Equation (3) and the right hand term, , is the regularization functional that can be selected to encode desirable properties of . Often the regularization term rewards smoothness, piecewise smoothness, or sparsity in the signal. For example, might bias , or some transformation of to another domain, , to be a sparse signal. In the present work, we tested both the norm and the total variation (TV) as regularizers. The norm regularizer
| (5) |
approximates the sparsity of the signal. On the other hand, the total variation
| (6) |
promotes sparsity in the signal gradient.
The Lagrange multiplier, , in Equation (4) is a weighting factor that trades off the fit to the data against the fit to the prior model of as encoded in . Often depends on the measurement noise and the conditioning of the forward operator . Setting produces a least-squares fit to the measurements. Because the problem is ill-posed, however, a least-squares result will produce an error prone and statistically implausible result. For large , the solution is heavily biased by the prior model.
Once formulated as a minimization problem, equation (4) can be computed by using optimization tools. A number of optimization/minimization computational methods have been developed to solve problems of the form in Equation (4). Here we use the two-step iterative shrinkage/thresholding (TwIST) algorithm [19].
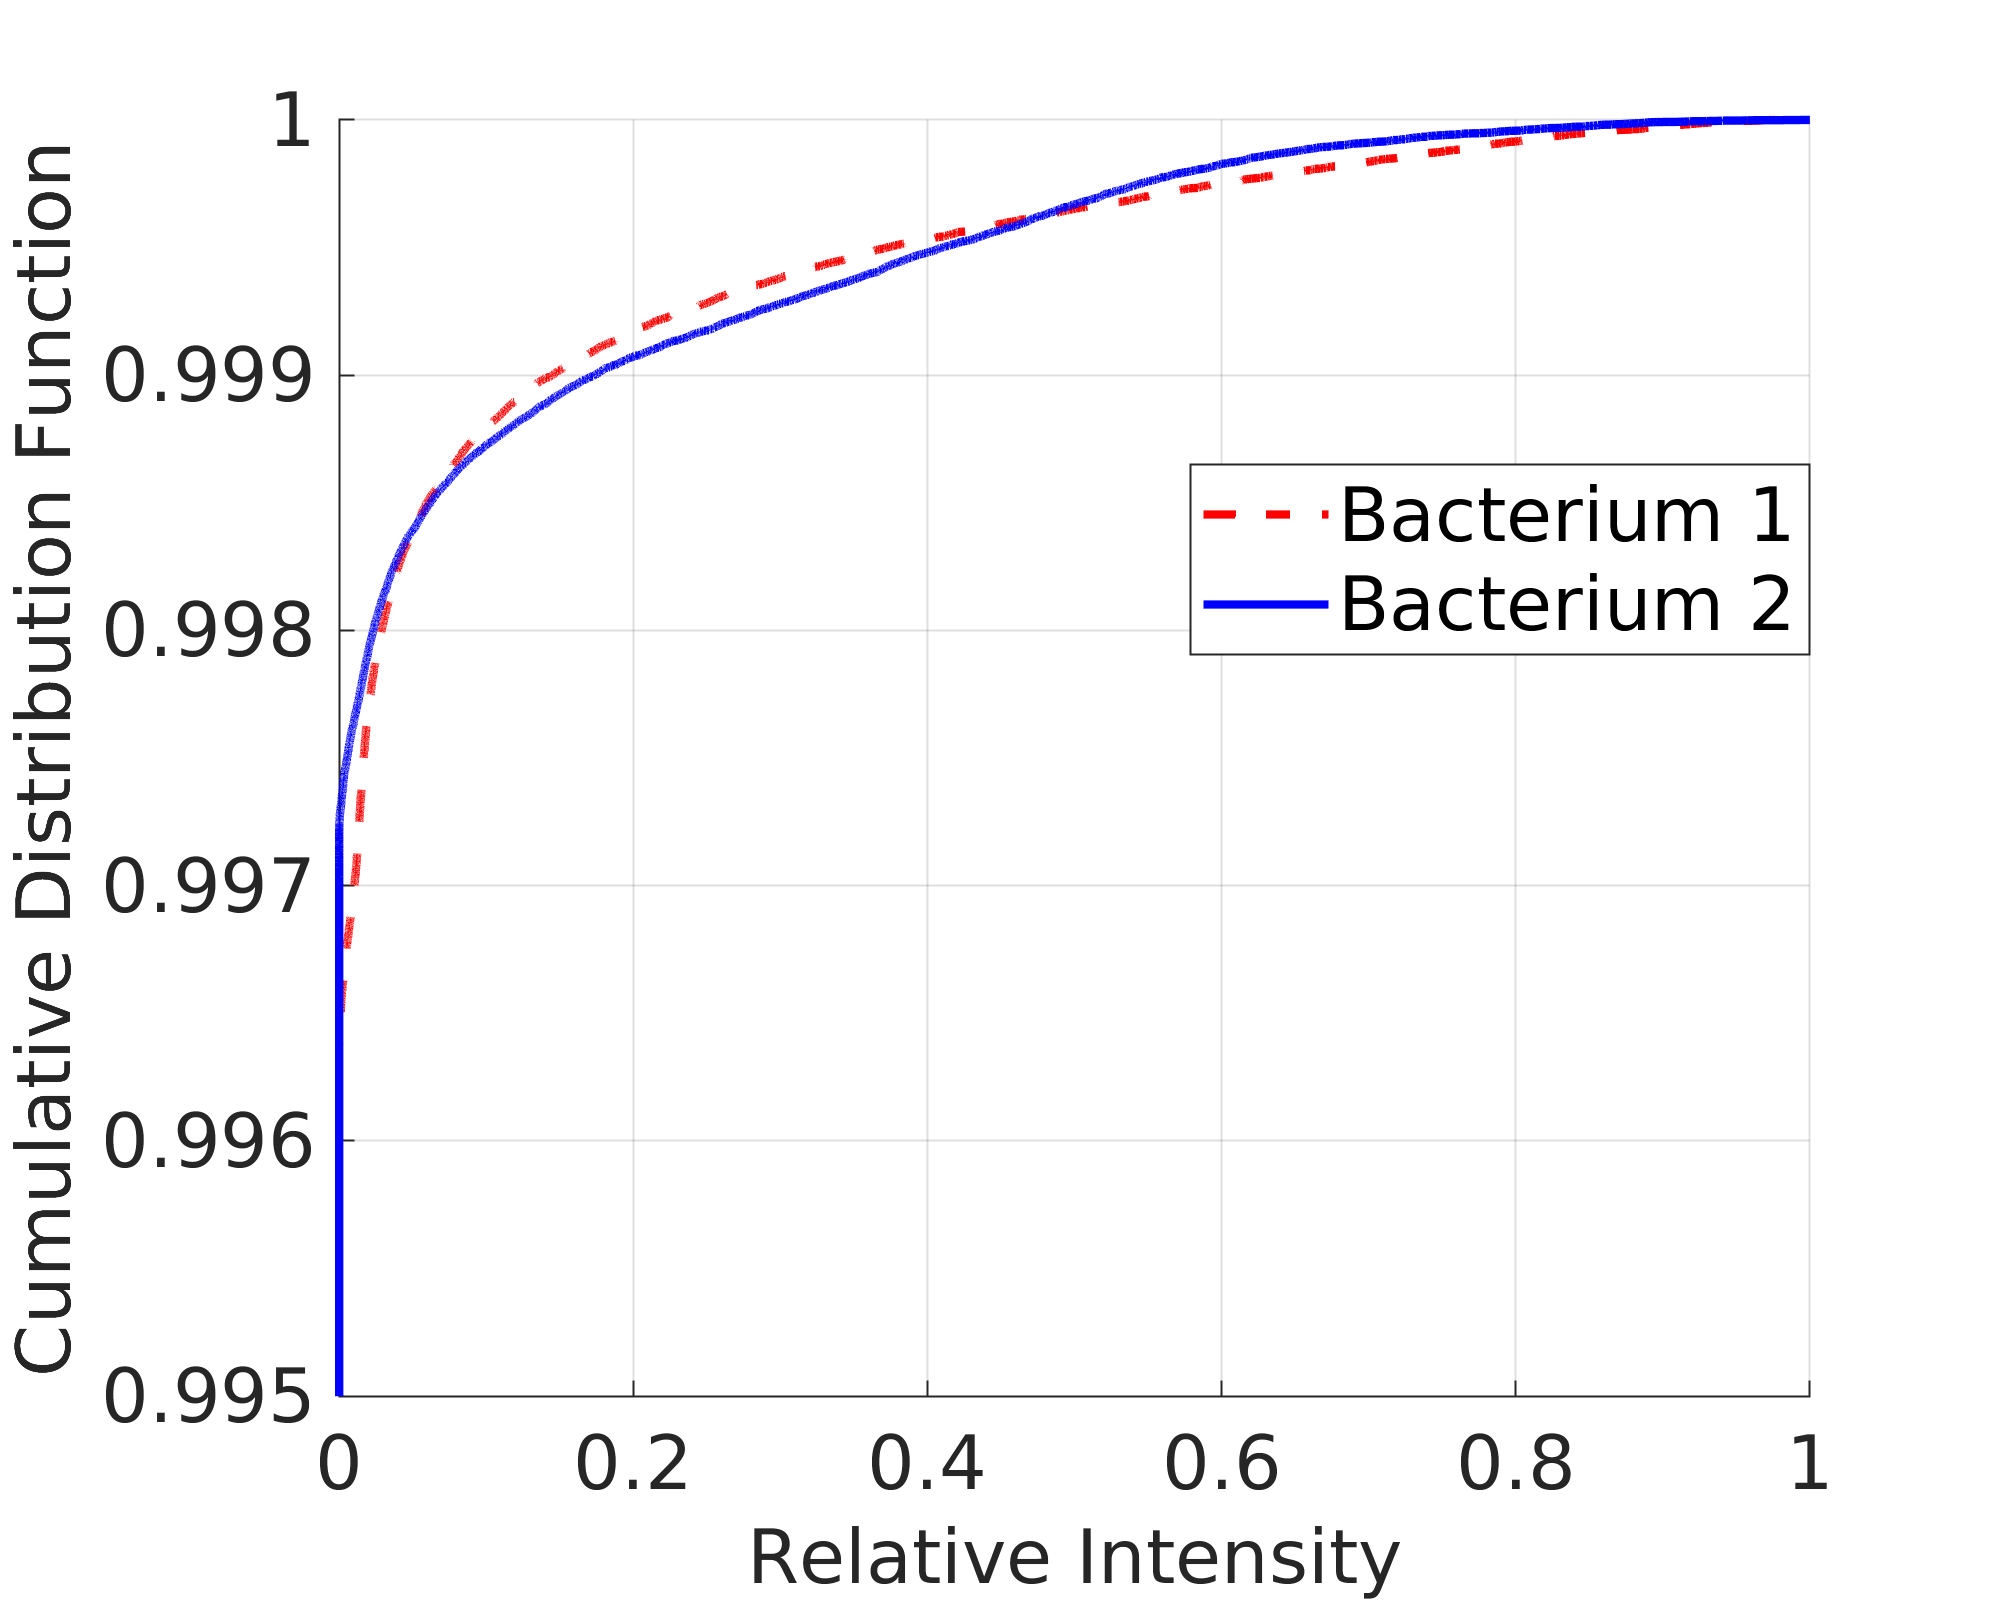
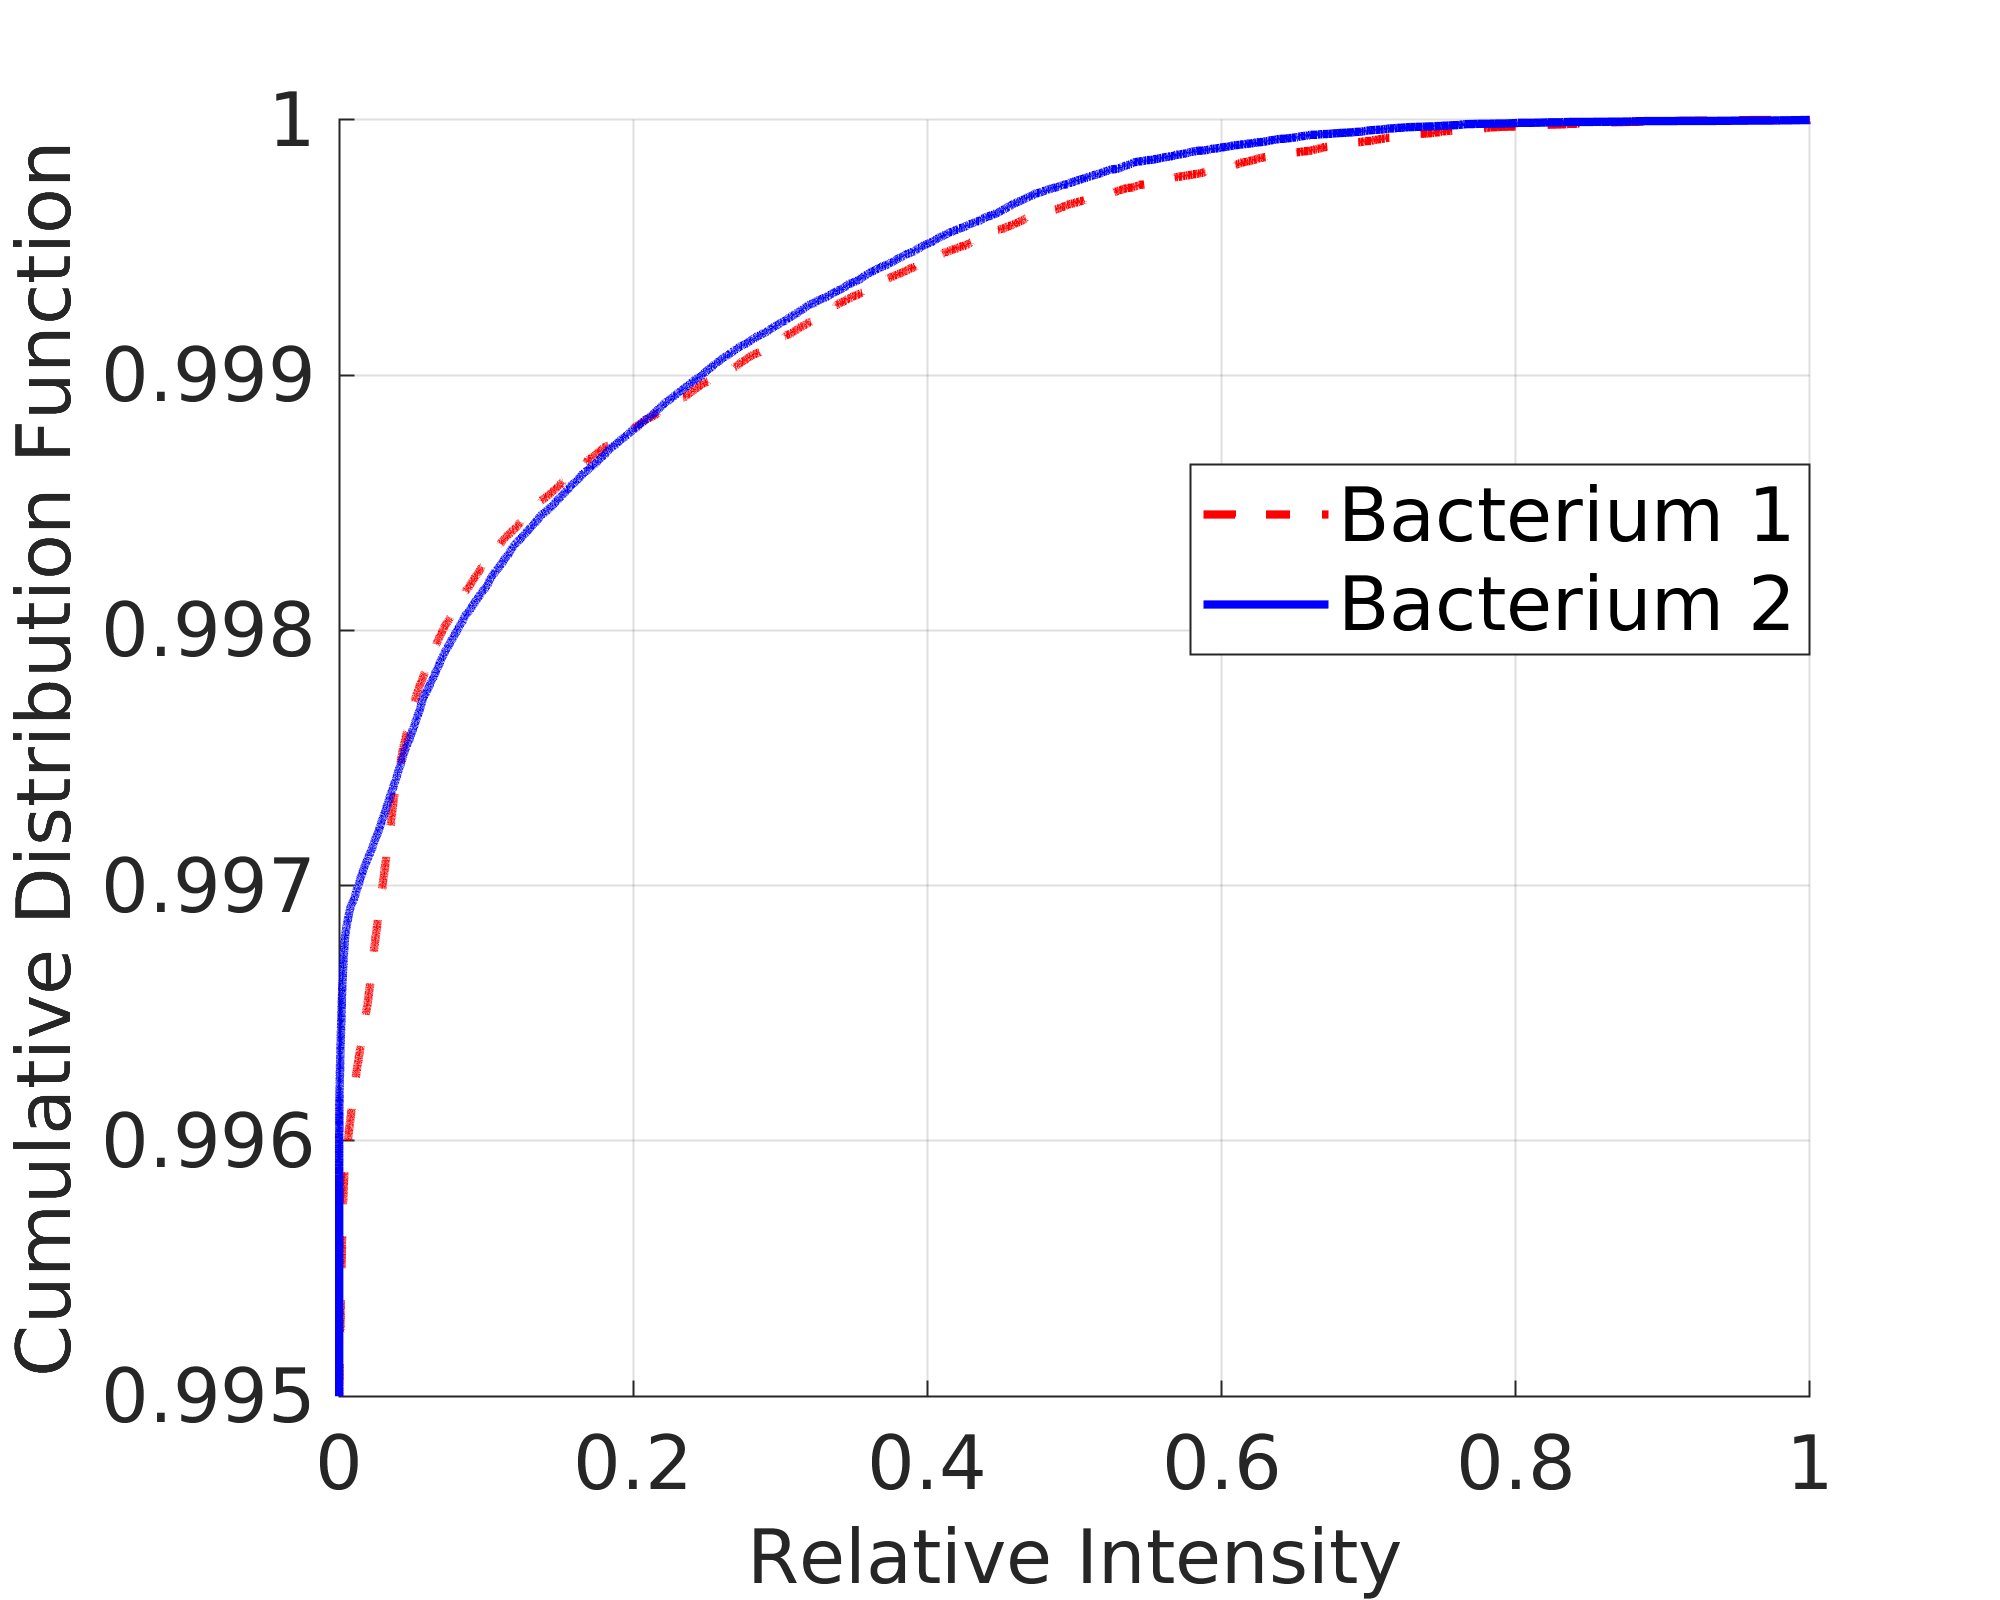
While many linear systems (e.g. Equation (3)) can be solved as a minimization problem in the form of Equation (4), the prior information about the signal as encoded in is crucial [30] to the success of the solution as a representation of the real system. Sparsity is an important assumption because the dimension of is significantly smaller than that of . The question arises, then, whether our observations warrant enforcing this assumption. Figure 7 presents the cumulative distribution for both the intensity and gradient magnitude of intensity of typical 3D images of two bacteria obtained by using our confocal measurement. In both cases, all but about 0.3% of the voxels are essentially zero. Thus, a sparsity prior using either the L1 regularizer or a TV (gradient) regularizer is suitable for samples of this kind.
Reconstruction Parameters.
The following summary of the parameters used in reconstruction computations for the results presented in the main text and in Movie S1 to facilitate comparison and to illustrate the variety of circumstances that effect parameter selection.
The confocal image stack presented in Figures 2 and 3 of the main text is comprised of 130 images taken at 50 nm intervals along the axial direction. Each required 200 ms. The resulting raw stack was deconvolved with the 3D instrumental point spread function using Huygens software (Scientific Volume Imaging, The Netherlands, http://svi.nl). The images in this enhanced volume were re-sampled from the native 71 nm pixels of the to match the 108 nm pixel pitch of the MFM measurements.
The MFM snapshot used for the reconstruction in Figure 2 of the main text was captured in 50 ms. The reconstruction used for 1000 iterations, reaching the point of diminishing return determined by the level of noise in the image. To compensate for the finite size of the fluorescent bead used in the point spread function measurement, the resulting volume was convolved with a uniformly labelled 170 nm sphere.
Because no noise was added to the simulated MFM image used in Figure 3 of the main text, reconstruction quality continues to improve for 12,000 iterations with . The resulting reconstruction is in excellent agreement with the reference volume used to generate the simulated MFM image.
The 50 frames of MFM snapshot data used in the tracking plots of Figure 4 (main text) and the animation in Movie S1 were processed into 3D reconstructions with 1000 iterations using , as in the snapshot used for Figure 2. By synchronized shuttering of the excitation source, frames were exposed for 20 ms out of the 40 ms available to reduce the effects of motion blur.





 |
 |
| (a) | (b) |
![[Uncaptioned image]](/html/1802.01565/assets/Figures/MFM25_tumbling_bacteria_1_frame1_50_20170201_3DVolumeRotPara_f30cp.png)
Caption for Movie S1: A 3D animation of a single, fixed organism (P. fluorescens) in water. MFM snapshot images measured at 25 fps were analyzed for 3D distribution of fluorescence frame-by-frame. The left half of the animation shows the bacterium rendered as cloud of points, one point per voxel colored by the intensity of the reconstructed emission from that voxel. The organism is approximately 2 m 0.5 m 0.5 m in size, and has enhanced fluorescent concentrations in two lobes along its major axis (i.e. at the poles). The position of its centroid is plotted at the top right. The elevation angle of the major axis measured from the plane is plotted below that. The azimuth angle of the major axis projected onto the plane, measured from the -axis is plotted at the bottom right. At the outset, the organism is horizontal and appears to be near the bottom cover slip which would keep it from tilting in elevation angle. When it rises high enough in , around frame 30, it can then tilt more freely in elevation.
References
- [1] Minsky, M. Microscopy apparatus, US Patent 3,013,467 (1961). URL https://www.google.com/patents/US3013467.
- [2] Nakano, A. Spinning-disk confocal microscopy; a cutting-edge tool for imaging of membrane traffic. \JournalTitleCell Structure and Function 27, 349–355 (2002). DOI 10.1247/csf.27.349.
- [3] Voie, A. H., Burns, D. H. & Spelman, F. A. Orthogonal-plane fluorescence optical sectioning: Three-dimensional imaging of macroscopic biological specimens. \JournalTitleJournal of Microscopy 170, 229–236 (1993). URL http://dx.doi.org/10.1111/j.1365-2818.1993.tb03346.x. DOI 10.1111/j.1365-2818.1993.tb03346.x.
- [4] Chen, B.-C. et al. Lattice light-sheet microscopy: imaging molecules to embryos at high spatiotemporal resolution. \JournalTitleScience (New York, N.Y.) 346, 1257998 (2014). URL http://www.ncbi.nlm.nih.gov/pubmed/25342811http://www.pubmedcentral.nih.gov/articlerender.fcgi?artid=PMC4336192. DOI 10.1126/science.1257998.
- [5] Wang, E., Babbey, C. & Dunn, K. W. Performance comparison between the high-speed yokogawa spinning disc confocal system and single-point scanning confocal systems. \JournalTitleJournal of Microscopy 218, 148–159 (2005).
- [6] Tabei, S. M. A. et al. Intracellular transport of insulin granules is a subordinated random walk. \JournalTitleProceedings of the National Academy of Sciences of the United States of America 110, 4911–6 (2013). URL http://www.ncbi.nlm.nih.gov/pubmed/23479621http://www.pubmedcentral.nih.gov/articlerender.fcgi?artid=PMC3612641. DOI 10.1073/pnas.1221962110.
- [7] Barlan, K., Rossow, M. J. & Gelfand, V. I. The journey of the organelle: teamwork and regulation in intracellular transport. \JournalTitleCurrent Opinion in Cell Biology 25, 483–488 (2013). URL http://www.ncbi.nlm.nih.gov/pubmed/23510681http://www.pubmedcentral.nih.gov/articlerender.fcgi?artid=PMC3723706http://linkinghub.elsevier.com/retrieve/pii/S0955067413000410. DOI 10.1016/j.ceb.2013.02.018.
- [8] Abrahamsson, S. et al. Fast multicolor 3d imaging using aberration-corrected multifocus microscopy. \JournalTitleNature Methods 10, 60–63 (2013).
- [9] Prabhat, P., Ram, S., Ward, E. S. & Ober, R. J. Simultaneous imaging of different focal planes in fluorescence microscopy for the study of cellular dynamics in three dimensions. \JournalTitleIEEE Transactions on Nanobioscience 3, 237–242 (2004).
- [10] Ram, S., Prabhat, P., Chao, J., Ward, E. S. & Ober, R. J. High accuracy 3D quantum dot tracking with multifocal plane microscopy for the study of fast intracellular dynamics in live cells. \JournalTitleBiophysical Journal 95, 6025–43 (2008). URL http://dx.doi.org/10.1529/biophysj.108.140392$\$nhttp://linkinghub.elsevier.com/retrieve/pii/S0006349508820176$\$nhttp://www.ncbi.nlm.nih.gov/pubmed/18835896$\$nhttp://www.pubmedcentral.nih.gov/articlerender.fcgi?artid=PMC2599831. DOI 10.1529/biophysj.108.140392.
- [11] Abrahamsson, S. et al. MultiFocus Polarization Microscope (MF-PolScope) for 3D polarization imaging of up to 25 focal planes simultaneously. \JournalTitleOptics Express 23, 7734–54 (2015). URL http://www.osapublishing.org/viewmedia.cfm?uri=oe-23-6-7734{&}seq=0{&}html=true. DOI 10.1364/OE.23.007734.
- [12] Oudjedi, L. et al. Astigmatic multifocus microscopy enables deep 3D super-resolved imaging. \JournalTitleBiomedical Optics Express 7, 2163–2173 (2016). DOI 10.1364/BOE.7.002163.
- [13] Baraniuk, R. Compressive Sensing [Lecture Notes]. \JournalTitleIEEE Signal Processing Magazine 24, 118–121 (2007). URL http://ieeexplore.ieee.org/document/4286571/. DOI 10.1109/MSP.2007.4286571.
- [14] Candes, E. J., Romberg, J. & Tao, T. Robust uncertainty principles: exact signal reconstruction from highly incomplete frequency information. \JournalTitleIEEE Transactions on Information Theory 52, 489–509 (2006). DOI 10.1109/TIT.2005.862083.
- [15] Donoho, D. L. Compressed sensing. \JournalTitleIEEE Transactions on Information Theory 52, 1289–1306 (2006). DOI 10.1109/TIT.2006.871582.
- [16] Tikhonov, A. N., Arsenin, V. I. & John, F. Methods for Solving Ill-Posed Problems (John Wiley and Sons, Inc, 1977).
- [17] Carrington, W. A. Image restoration in 3-D microscopy with limited data. In Smith, L. C. (ed.) OE/LASE’90, vol. 1205, 72–83 (International Society for Optics and Photonics, Los Angeles, 1990). URL http://proceedings.spiedigitallibrary.org/proceeding.aspx?articleid=935553. DOI 10.1117/12.17785.
- [18] Carrington, W. A. et al. Superresolution three-dimensional images of fluorescence in cells with minimal light exposure. \JournalTitleScience (New York, N.Y.) 268, 1483–7 (1995). URL http://www.ncbi.nlm.nih.gov/pubmed/7770772.
- [19] Beck, A. & Teboulle, M. A fast iterative shrinkage-thresholding algorithm for linear inverse problems. \JournalTitleSIAM Journal on Imaging Sciences 2, 183–202 (2009). URL http://epubs.siam.org/doi/10.1137/080716542. DOI 10.1137/080716542.
- [20] Bailey, M. J., Lilley, A. K., Thompson, I. P., Rainey, P. B. & Ellis, R. J. Site directed chromosomal marking of a fluorescent pseudomonad isolated from the phytosphere of sugar beet; stability and potential for marker gene transfer. \JournalTitleMol. Ecol. 4, 755–764 (1995).
- [21] Silby, M. W. et al. Genomic and genetic analyses of diversity and plant interactions of Pseudomonas fluorescens. \JournalTitleGenome Biology 10 (2009).
- [22] Trippe, K., McPhail, K., Armstrong, D., Azevedo, M. & Banowetz, G. Pseudomonas fluorescens SBW25 produces furanomycin, a non-proteinogenic amino acid with selective antimicrobial properties. \JournalTitleBMC Microbiology 13 (2013).
- [23] Naseby, D., Way, J., Bainton, N. & Lynch, J. Biocontrol of Pythium in the pea rhizosphere by antifungal metabolite producing and non-producing Pseudomonas strains. \JournalTitleJournal of Applied Microbiology 90, 421–429 (2001).
- [24] Shaner, N. C. et al. A bright monomeric green fluorescent protein derived from Branchiostoma lanceolatum. \JournalTitleNature Methods 10, 407–409 (2013).
- [25] Heeb, S. et al. Small, stable shuttle vectors based on the minimal pVS1 replicon for use in gram-negative, plant-associated bacteria. \JournalTitleMol Plant Microbe Interact. 13, 232–237 (2000).
- [26] Rossanese, O. W. et al. A role for actin, Cdc1p, and Myo2p in the inheritance of late Golgi elements in Saccharomyces cerevisiae. \JournalTitleJ. Cell Biol. 153, 47–62 (2001).
- [27] Huynh, T. et al. Correlative imaging across microscopy platforms using the Fast and Accurate Relocation of Microscopic Experimental Regions (FARMER) Method. \JournalTitleSubmitted to Review of Scientific Instruments (2017).
- [28] Edelstein, A. D. et al. Advanced methods of microscope control using Manager software. \JournalTitleJournal of Biological Methods 1, 10 (2014). URL http://www.jbmethods.org/jbm/article/view/36. DOI 10.14440/jbm.2014.36.
- [29] Katsaggelos, A. K., Molina, R. & Mateos, J. Super Resolution of Images and Video (Google eBooks, 2007).
- [30] Henderson, R. Avoiding the pitfalls of single particle cryo-electron microscopy: Einstein from noise. \JournalTitleProceedings of the National Academy of Sciences of the United States of America 110, 18037–41 (2013). URL http://www.pubmedcentral.nih.gov/articlerender.fcgi?artid=3831464{&}tool=pmcentrez{&}rendertype=abstract. DOI 10.1073/pnas.1314449110.
Acknowledgments
We acknowledge helpful discussions with Ben Glick and Robin Graham. This work was supported by funding through the Biological Systems Science Division, Office of Biological and Environmental Research, Office of Science, U.S. Department of Energy, under Contract DE-AC02-06CH11357.
Contributions
XH, MH, NJF, AS, MKD, NFS, RW, AKK and OC contributed to writing the manuscript. AS, XW, MKD, and NFS designed and implemented the microscope. AS and XW performed the laboratory experiments. RW developed the engineered biological organisms. XH, MH, NJF, SY, KH, AKK, and OC developed the computational imaging approach and software. XH, MH, NJF, KH, and SY performed the computational experiments.
Additional information
The authors have no competing interests to declare.
COPYRIGHT NOTICE:
This work was supported by funding through the Biological Systems Science Division, Office of Biological and Environmental Research, Office of Science, U.S. Dept. of Energy, under Contract DE-AC02-06CH11357. The submitted manuscript has been created by UChicago Argonne, LLC, Operator of Argonne National Laboratory (’Argonne’). The U.S. Government retains for itself, and others acting on its behalf, a paid-up nonexclusive, irrevocable worldwide license in said article to reproduce, prepare derivative works, distribute copies to the public, and perform publicly and display publicly, by or on behalf of the Government. The Department of Energy will provide public access to these results of federally sponsored research in accordance with the DOE Public Access Plan. http://energy.gov/downloads/doe-public-access-plan.