Experimental tests of the chiral anomaly magnetoresistance in the Dirac-Weyl semimetals Na3Bi and GdPtBi
Abstract
In the Dirac/Weyl semimetal, the chiral anomaly appears as an “axial” current arising from charge-pumping between the lowest (chiral) Landau levels of the Weyl nodes, when an electric field is applied parallel to a magnetic field . Evidence for the chiral anomaly was obtained from the longitudinal magnetoresistance (LMR) in Na3Bi and GdPtBi. However, current jetting effects (focussing of the current density ) have raised general concerns about LMR experiments. Here we implement a litmus test that allows the intrinsic LMR in Na3Bi and GdPtBi to be sharply distinguished from pure current jetting effects (in pure Bi). Current jetting enhances along the mid-ridge (spine) of the sample while decreasing it at the edge. We measure the distortion by comparing the local voltage drop at the spine (expressed as the resistance ) with that at the edge (). In Bi, sharply increases with but decreases (jetting effects are dominant). However, in Na3Bi and GdPtBi, both and decrease (jetting effects are subdominant). A numerical simulation allows the jetting distortions to be removed entirely. We find that the intrinsic longitudinal resistivity in Na3Bi decreases by a factor of 10.9 between = 0 and 10 T. A second litmus test is obtained from the parametric plot of the planar angular magnetoresistance. These results strenghthen considerably the evidence for the intrinsic nature of the chiral-anomaly induced LMR. We briefly discuss how the squeeze test may be extended to test ZrTe5.
I Introduction
In the past 2 decades, research on the Dirac states in graphene and topological insulators has uncovered many novel properties arising from their linear Dirac dispersion. In these materials, the Dirac states are confined to the two-dimensional (2D) plane. Interest in three-dimensional (3D) Dirac states may be traced to the even earlier prediction of Nielsen and Ninomiya (1983) Nielsen that the chiral anomaly may be observable in crystals (the space-time dimension 3+1D needs to be even). The anomaly, which appears as a current in a longitudinal magnetic field , arises from the breaking of a fundamental, classical symmetry of massless fermions, the chiral symmetry. Recent progress in topological quantum matter has led to several systems that feature protected 3D Dirac and Weyl states in the bulk Kane ; Ashvin .
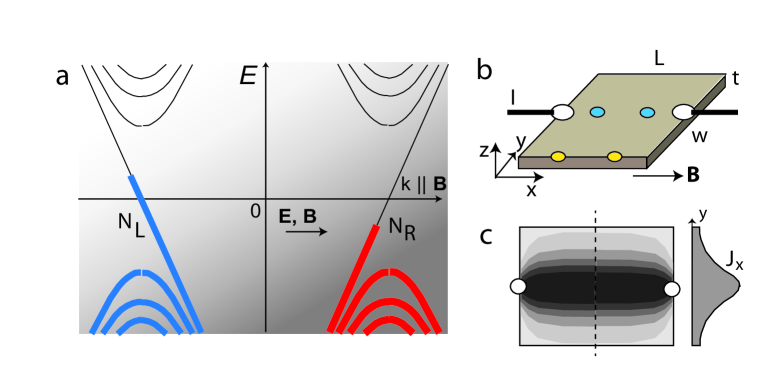
A crucial step in the search for 3D Dirac states was the realization that inclusion of point group symmetry (with time-reversal (TR) symmetry and inversion symmetry) allows Dirac nodes to be protected anywhere along symmetry axes, instead of being pinned to TR-invariant momenta on the Brillouin zone surface Bernevig ; Nagaosa . Relaxation of this constraint led to the discovery of Na3Bi Wang1 and Cd3As2, in which the 2 Dirac nodes are protected by and symmetry, respectively. In the absence of , each Dirac node is described by a Hamiltonian that can be block-diagonalized into two Weyl blocks with opposite chiralities (). The absence of mixing between the two Weyl fermions expresses the existence of chiral symmetry. In a strong the Weyl states are quantized into Landau levels. As shown in Fig. 1a, a distinguishing feature is that the lowest Landau level (LLL) in each Weyl node is chiral with a velocity strictly (or as dictated by ) Ashvin .
As a result, electrons occupying the LLL segregate into two massless groups – left- and right-movers with populations and , respectively. Independent conservation of and implies that the chiral charge density is conserved, just like the total charge density ( is the sample volume). However, application of an electric field breaks the chiral symmetry by inducing mixing between the left- and right-moving branches (Fig. 1a) (for a pedagogical discussion, see Ref. Rubakov ). A consequence is that conservation of is violated by a quantity called the anomaly term, viz. , where is the axial current density. (From the density of states in the LLL and the rate of change induced by , we obtain .) The presence of is detected as a large, negative, longitudinal magnetoresistance (LMR). This constitutes the chiral anomaly. [The anomaly first appeared in the theory of -meson decay Adler ; Bell . See Refs. Peskin ; Bertlmann .] The conditions for observing the anomaly in Dirac semimetals were discussed, for e.g., in Refs. Ashvin ; Ran ; Spivak ; Parameswaran ; Burkov15 .
In 2015, Xiong et al. reported the observation of a 5 to 6-fold suppression of the LMR in Na3Bi, identifed with the chiral anomaly Xiong . A year later, Hirschberger et al. Hirschberger reported observing the chiral anomaly including its thermoelectric signature in the half-Heusler GdPtBi. Although the low-lying states in GdPtBi are not Dirac-like in zero , the application of a Zeeman field splits both conduction and valence bands to produce protected crossings which define Weyl nodes. With , a 5-fold LMR was observed with a profile very similar to that in Na3Bi. In both Na3Bi and GdPtBi, the carrier mobility is relatively low (3,000 and 2,000 cm2/Vs at 2 K, respectively).
There have also been several reports of negative LMR observed in the Weyl semimetals TaAs, NbP and analogs XiDai ; Shuang ; Hassinger ; ZhuanXu . However, the weakness of their LMR signals (50-100 weaker than in Na3Bi) and their fragility with respect to placement of contacts, together with the high mobilities of the Weyl semimetals (150,000 to 200,000 cm2/Vs) have raised concerns about current jetting artifacts Hassinger ; ZhuanXu . As a consequence, there is considerable confusion and uncertainties about LMR experiments in general, and the LMR reported in the Weyl semimetals in particular. The concerns seem to have spread to Na3Bi and GdPtBi as well, notwithstanding their much larger LMR signal.
There is good reason for the uncertainties. Among the resistivity matrix elements, measurements of the longitudinal resistivity (for ) are the most vulnerable to inhomogeous flow caused by current jetting. Even when the LMR signal in a sample is mostly intrinsic, the chiral anomaly produces an intrinsic conductivity anisotropy which unavoidably produces inhomogeneous current distributions that distort the observed LMR profile. Given the prominent role of LMR in chiral-anomaly investigations, it is highly desirable to understand these effects at a quantitative level, and to develop a procedure that removes the distortions.
A major difference between the large LMR systems Na3Bi and GdPtBi on the one hand and the Weyl semimetals on the other is their carrier densities. Because the density is low in both Na3Bi ( cm-3) and in GdPtBi ( cm-3), the field required to force the chemical potential into the LLL is only 5-6 T. By contrast, is 7-40 T in the Weyl semimetals. As shown in Fig. 1a, the physics underlying the anomaly involves the occupation of chiral, massless states. Occupation of the higher LLs (when ) leads to strong suppression of the anomaly Hirschberger . Moreover, as discussed below, LMR measurements involve a competition between the anomaly mechanism (“the quantum effect”) and classical current jetting effects which onset at a second field scale . The relative magnitudes of these field scales dictate which effect dominates.
Here we report a series of experiments designed to separate intrinsic from extrinsic effects in LMR experiments. Focussing of the current density into a beam strongly reduces its value at the edges of a sample. As shown in Sec. II, the effects of current-jetting can be neatly factored into a quantity (line-integral of ) which can be measured by local voltage contact pairs. By comparing local voltage drops at the maximum and minimum of the profile of , we devise a litmus test that sharply distinguishes the two chiral-anomaly semimetals from the case of pure Bi (Sec. III). Adopting a quantitative treatment (Sec. IV) we show how the intrinsic can be derived from the local voltage results. Applying this technique to Na3Bi, we obtain the intrinsic profiles of and the anisotropy, with current jetting distortions removed. The degree of distortion at each value becomes plainly evident. The competition between the quantum and classical effects is described in Sec. V. To look beyond Na3Bi and GdPtBi, we discuss how the tests can be extended using focussed ion beam techniques to test ZrTe5, which grows as a narrow ribbon. The Weyl semimetals e.g. TaAs require availability of ultrathin films. The planar angular magnetoresistance (Sec. VI) provides a second litmus test – one that is visually direct when displayed as a parametric plot (Sec. VII). In Sec. VIII, we summarize our results.
II The squeeze test
Current jetting refers to the focussing of the current density into a narrow beam arising from the field-induced anisotropy of the conductivity (the drift of carriers transverse to is suppressed relative to the longitudinal drift). To maximize the gradient of along the -axis, we select plate-like samples with ,, where , and are the width, length and thickness, respectively (Fig. 1b). The - and -axes are aligned with the edges and . As sketched in Fig. 1c, the profile of vs. is strongly peaked at the center of the sample and suppressed towards the edges. In the squeeze test, we measure the voltage difference across a pair of contacts (blue dots) along the line joining the current contacts (which we call the spine) as well as that across a pair on the edge (yellow dots). To accentuate current jetting effects, we keep the current contact diameters small () and place them on the top face of the sample wherever possible. (The squeeze test cannot be applied to needle-like crystals).
Sample Preparation We provide details on the preparation of Na3Bi which is by far the most difficult of the 3 materials to work with. Na3Bi crystallizes to form hexagonal platelets with the broad face normal to (001). The crystals investigated here were grown under the same conditions as the samples used in Xiong et al. Xiong ; they have carrier densities cm-3 and in the range 5-6 T. These crystals should be distinguished from an earlier batch XiongEPL that have much higher carrier densities (3-6 cm-3) for which we estimate 100 T. No evidence for negative LMR was obtained in the highly-doped crystals XiongEPL .
Because of the high Na content, crystals exposed to ambient air undergo complete oxidation in 5 s. The stainless growth tubes containing the crystals were opened in an argon glove box equipped with a stereoscopic microscope, and all sample preparation and mounting were performed within the glove box. The crystals have the ductility of a soft metal. Using a sharp razor, we cleaved the bulk crystal into platelets mm2 on a side with thickness 100 m. Current and voltage contacts were painted on using silver paint (Dupont 4922N). A major difficulty was achieving low-resistance contacts on the top face (for measuring ). After much experimentation, we found it expedient to remove a thin layer of oxide by lightly sanding with fine emery paper (within the glove box). The sample was then placed inside a capsule made of G10 epoxy. After sealing the lid with stycast epoxy, the capsule was transferred to the cryostat.
We contrast two cases. In Case (1), the anisotropy increases in a longitudinal field because the transverse conductivity decreases steeply (as a result of cyclotronic motion) while is unchanged in . With , the two-band model gives the resistivity matrix
| (1) |
(we suppress the component for simplicity). The zero- conductivities of the electron and hole pockets are given by and , with and the electron and hole densities, respectively, and the elemental charge. and are the mobilities in the electron and hole pockets, respectively, and and . With , the off-diagonal elements vanish. In Case (1), we assume that and remain constant. Hence the observed resistivity is unchanged in . However, the transverse conductivity decreases (as in high ). The anisotropy arises solely from the suppression of the conduction transverse to by the cyclotron motion of both species of carriers.
Case (2) is the chiral anomaly regime in the Dirac semimetal. Charge pumping between Landau levels (LLs) of opposite chirality leads to an axial current which causes to increase with . Simultaneously, the 1D nature of the LL dispersion suppresses the transverse conductivity . Hence the increase in derives equally from the opposite trends in and .
Denoting field-induced changes by , we have
| (2) | |||||
| (3) |
In the test, the voltage drops and are given by
| (4) | |||||
| (5) |
where and are the line integrals of along the edge and spine, respectively ( is the spacing between voltage contacts). The intrinsic dependence (expressed in ) has been cleanly separated from the extrinsic dependences of and , which arise from current focussing effects.
The area under the curve of vs. is conserved, i.e.
| (6) |
with the applied current. At = 0, we may take to be uniform with the magnitude . The line integral reduces to . In finite , focussing of the current beam implies that the current density is maximum along the spine and minimum at the edge, i.e. . Moreover, Eq. 6 implies that . Hence the line integrals satisfy the inequalities
| (7) |
If both and are -independent, as in Case (1), we have from Eqs. 5, 4 and 8,
| (8) |
where is the voltage drops across both pairs at = 0. Clearly, increases monotonically with while decreases. Physically, focussing the current density along the spine increases the local -field there. Current conservation then requires to be proportionately suppressed along the edges. Measuring alone yields a negative LMR that is spurious.
In Case (2), however, decreases intrinsically with because of the chiral anomaly while increases. Competition between the 2 trends is explicitly seen in the profile of vs. . As shown below, in Na3Bi and GdPtBi, the intrinsic decrease in dominates so both and decrease with . We remark that, by Eq. 8, always lies above . Moreover, when the rate of increase in begins to exceed (in absolute sense) the rate of decrease in at sufficiently large , the curve of can display a broad minimum above which increases.
Hence, if both and are observed to decrease with increasing , the squeeze test provides positive confirmation that the observed LMR is intrinsic. Their field profiles bracket the intrinsic behavior of . Conversely, if intrinsic LMR is absent (i.e. is unchanged), and display opposite trends (the marginal case when the intrinsic LMR is weak is discussed in Sec. IV).
We remark that the current jetting effects cannot be eliminated by using very small samples (e.g. using nanolithography). As long as we remain in the classical transport regime, the equations determining the functional form of in strong are scale invariant. Because intrinsic length scales (e.g. the magnetic length or the skin depth ) are absent in classical dc transport, the same flow pattern is obtained on either mm or micron-length scales.
III Results of squeeze test
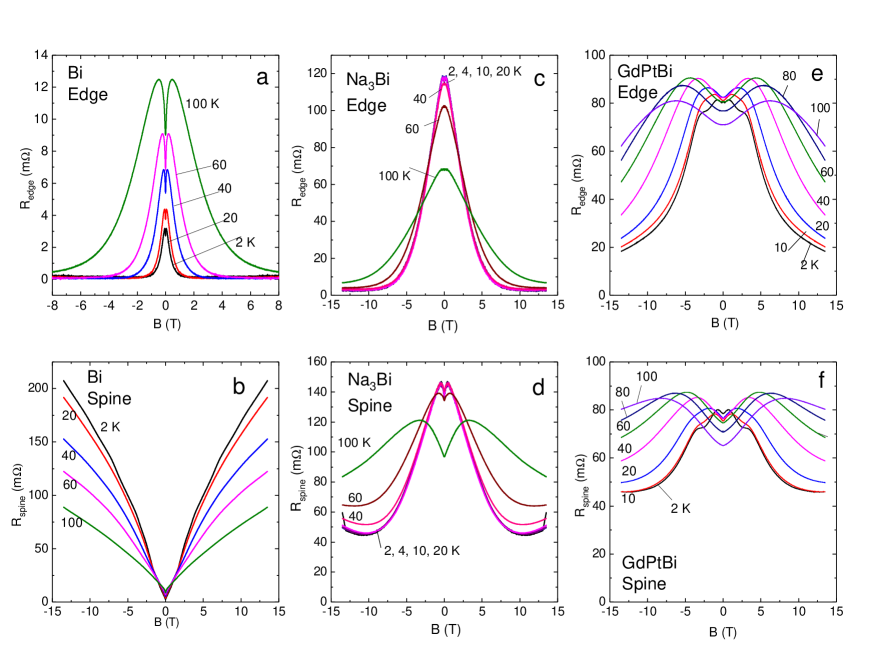
The results of applying the squeeze test on the 3 systems are summarized in Fig. 2. In Panels (a) and (b) we show the voltage drops and measured in pure bismuth (Sample B1). The signals are expressed as the effective resistances
| (9) | |||||
| (10) |
The steep decrease in (Panel (a)) illustrates how an apparent but spurious LMR can easily appear when the mobility is very high (in Bi, exceeds cm2/Vs at 4 K). Comparison of and measured simultaneously shows that they have opposite trends vs. . As and are obviously independent in Bi, is also independent. By Eqs. 9 and 10, the changes arise solely from and . Hence, Figs. 2a and 2b verify experimentally that and display the predicted large variations of opposite signs when current jetting is the sole mechanism present (see simulations in Sec. IV).
Next we consider Na3Bi. In this sample (N1), below 20 K decreases by a factor of 50 between = 0 and 10 T (Fig. 2c). This is an order of magnitude larger than observed in Ref. Xiong . The increase arises from enhanced current focussing effect in the present contact placement utilizing small current contacts attached to the broad face of the crystal, as well as a larger . In spite of the enhanced jetting, shows a pronounced decrease is contrast to the case for Bi. The intrinsic decrease in dominates the increase in throughout (see Eq. 10). Hence we conclude that there exists a large intrinsic, negative LMR that forces to decrease despite focussing of along the ridge. Further evidence for the competing scenario comes from the weak minimum at 10 T in the curves below 40 K in Fig. 2d. As anticipated above, in large , approaches a constant because of the saturation chiral-anomaly term. However, continues to increase because the transverse conductance worsens. Consequently, goes through a minimum before increasing. This is seen in , but absent in .
A feature that we currently do not understand is the large -shaped cusp in weak . At 100 K, the cusp is prominent in but absent in .
In Fig. 2(e) and (f), we show the field profiles of and measured in GdPtBi (Sample G1). Again, as in Na3Bi, the anomaly-induced decrease in dominates the increase in , and is observed to decrease in increasing . The relative decrease in is larger than that in . Further, below 10 K shows the onset of a broad minimum above 10 T (Fig. 2f), whereas continues to fall.
These features, in accord with the discussion above, are amenable to a quantitative analysis that yields the intrinsic field profiles of both and (next section).
IV The intrinsic LMR profile
The factorization expressed in Eqs. 9 and 10 allows us to obtain the intrinsic field profile of in the face of strong current-density inhomogeneity induced by jetting. To start, we note that, once the boundaries are fixed, the functional form of the inhomogeneous current density depends only on the conductivity anisotropy regardless of its microscopic origin. Assuming a constant (i.e. Case (1)), we first calculate by numerical simulation the effective resistances and over a broad range of . For simplicity, the simulation is performed for a sample in the 2D limit by solving the anisotropic Laplace equation
| (11) |
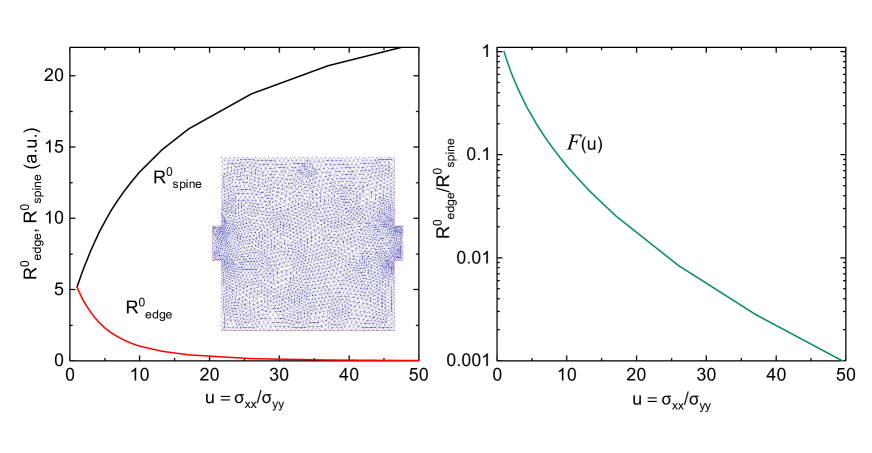
for the potential at selected values of . We used the relaxation method on a triangular mesh with Dirichlet boundary conditions at the current contacts (inset in Fig. 3a).
Figure 3a displays the calculated curves of and in a 2D sample with aspect ratio matched to that in the experiment on Na3Bi. As expected, with set to a constant, the two curves diverge. This reflects the simultaneous enhancement of the -field along the spine and its steep decrease at the edge caused by pure current jetting.
From the calculated resistances, we form the ratio
| (12) |
The template curve , which depends only on , is plotted in semilog scale in Fig. 3b.
Turning to the values of and measured in Na3Bi at the field , we form the ratio . Although is implicitly a function of , it is experimentally determined as a function of (how varies with is not yet known). We remark that and represent the same physical quantity expressed as functions of different variables. To find , we equate to in the template curve. This process leads to the equation
| (13) |
from which we determine given . Finally, because and are known from the simulation, we obtain the intrinsic profile of as a function of using the relations
| (14) |
The redundancy (either resistance may be used) provides a useful check for errors in the analysis.
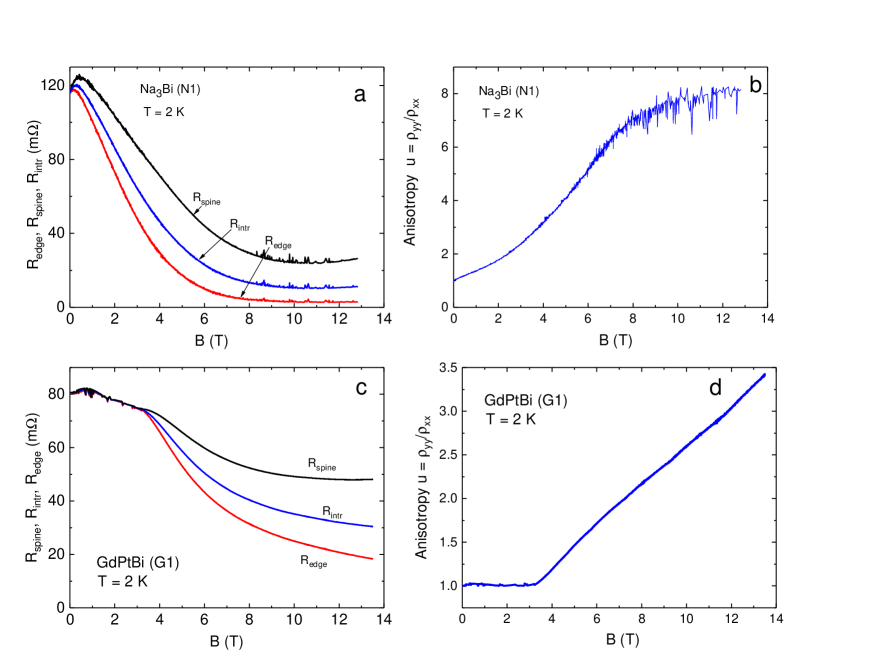
The results of the analysis are shown in Fig. 4 for both Na3Bi and GdPtBi. In Fig. 4a, we plot in Na3Bi (as the intrinsic curve , in blue). As expected, is sandwiched between the measured curves of and . The field profile of the intrinsic anisotropy is displayed in Fig. 3d). It is interesting to note that, in Na3Bi at 2 K, the intrinsic conductivity anisotropy increases to 8 as is increased to 14 T. This engenders significant distortion of away from uniform flow. The analysis provides a quantitative measure of how current jetting effects distort the measurements. At 10 T, is larger than by a factor of 2.3 whereas is 4.0 smaller than . The plots show explicitly how still decreases (by a factor of 5) between = 0 and 10 T, despite the enhancement in caused by current jetting. Here we see explicitly that this occurs because the intrinsic LMR is so large (decreasing by by a factor of 10.9 between 0 and 10 T) that the current squeezing factor is always sub-dominant. With the procedure described, this sub-dominant distortion can be removed entirely. The corresponding profiles of and in GdPtBi are shown in Fig. 4c and 4d, respectively. Unlike the case in Na3Bi, a finite is required to create the Weyl nodes. This occurs at 3.4 T in G1. Below this field, the system is isotropic ( close to 1).
V Quantum vs. classical effects
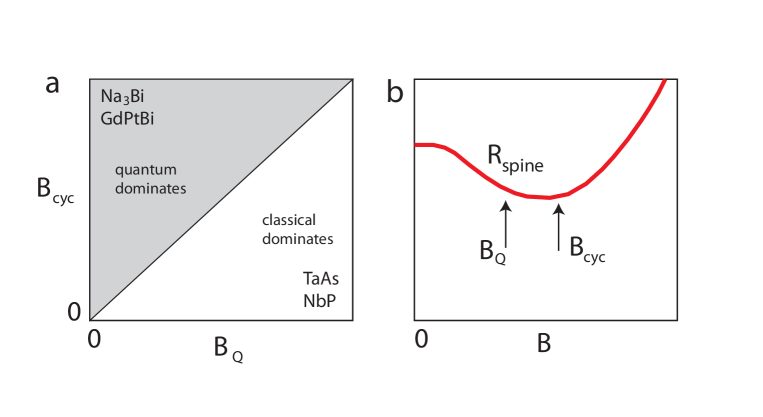
From the experimental viewpoint, it is helpful to view the LMR experiment as a competition between the intrinsic anomaly-induced decrease in (a quantum effect) and the distortions engendered by current jetting (classical effect). To observe a large, negative LMR induced by the chiral anomaly, it is imperative to have the chemical potential enter the lowest Landau level LLL. The field at which this occurs, which we call , sets the onset field for this quantum effect. By contrast, the distortions to caused by current jetting onsets at the field , which is set by the inverse mobility . We write where the dimensionless parameter , based on the numerical simulations (Eqs. 12 and 13).
If , the LLL is accessed before classical current distortion appears in increasing . This is the situation in the upper shaded region in the vs. space in Fig. 5a. The conditions are favorable for observing the chiral anomaly without worrying about classical current jetting. (To be sure, the chiral anomaly itself leads to a large anisotropy that can distort . However, this is a quantum effect that follows from the chiral anomaly and can be compensated for.) The measured curves of and bracket the intrinsic which allows the latter to be obtained, as explained in Eqs. 12, 13 and 14. In both Na3Bi and GdPtBi, 5-6 T whereas exceeds 30 T. They fall safely within the shaded area. As approaches (the diagonal boundary in Fig. 5a), classical current jetting becomes increasingly problematical. In Fig. 5b, the schematic curve illustrates the trend of how the quantum behavior can be swamped by the onset of current jetting.
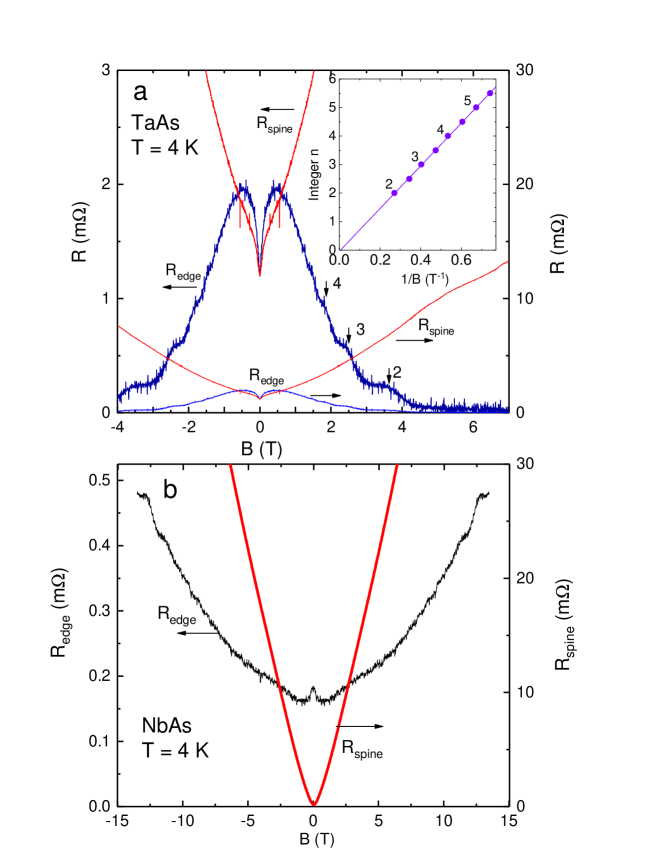
Finally, if , classical distortion effects onset long before the LLL is accessed. In this case, and display divergent trends vs. . Even if an intrinsic LMR exists, we are unable to observe it in the face of the dominant (artifactual) change in caused by classical current jetting. In the Weyl semimetals TaAs and NbAs, 7 and 40 T, respectively, whereas 0.4 T (because of their high mobilities). This makes LMR an unreliable tool for establishing the chiral anomaly in the Weyl semimetals. We illustrate the difficulties with and measured in TaAs (Fig. 6a) and in NbAs (Fig. 6b).
In the initial reports, a weak LMR feature (5-10 overall decrease) was observed in TaAs and identified with the chiral anomaly. Subsequently, several groups found that both the magnitude and sign of the LMR feature are highly sensitive to voltage contact placement. We can in fact amplify the negative LMR to nearly 100. To apply the squeeze test, we have polished a crystal of TaAs to the form of a thin square plate and mounted contacts in the configuration sketched in Fig. 1b, with small current contacts (m). As shown in Fig. 6a, at 4 K (thick blue curve) displays a steep decrease, falling to a value approaching our limit of resolution at 7 T. Simultaneously, however, (red) increases rapidly. The two profiles are categorically distinct from those in Na3Bi and GdPtBi (Fig. 2c-f), but closely similar to the curves for Bi (Fig. 2a,b). Moreover, the weak SdH oscillations fix the field needed to access the LLL at 7.04 T (inset in (a)). Since 0.06 T, we infer that the classical current-jetting effect onsets long before the quantum limit is accessed. Hence TaAs is deep in the right-bottom corner of the phase diagram in Fig. 5a. The current jetting effects appear well before TaAs attains the quantum limit at , and completely precludes the chiral anomaly from being observed by LMR.
Applying the squeeze test next to NbAs, we display the curves of (black curve) and (red) at 4 K in Fig. 6b. Here, both and increase with , but increases 100 faster (in the field interval 08.5 T, doubles but increases by a factor of 280). The vast difference in the rate of change is direct evidence for the squeezing of along the spine as depicted in Figs. 1c. Again, with 40 T, we infer that NbAs falls deep in the right-bottom corner of Fig. 5a. Classical current jetting dominates the LMR.
It is worth remarking that the squeeze test results do not invalidate the ARPES evidence showing that TaAs and NbAs are Weyl semimetals. Rather, they demonstrate that the negative LMR reported to date in the Weyl semimetals fall deep in the regime where classical current-jetting effects dominate.
Figure 5a suggests a way to avoid the screening effect of current jetting for the Weyl semimetals. By growing ultrathin films one may use gating to lower towards zero in the Weyl nodes. This allows the LLL to be accessed at a much lower . Simultaneously, the increased surface scattering of the carriers will reduce (hence increase ). In allowing the quantum effect to onset before the classical effect becomes dominant, both trends shift the “operating point” towards the shaded region . The ability to tune by gating will enable more tests for mapping out the current density distribution. The squeeze test is actually easier to implement using thin-film samples. Because several groups worldwide are attempting to grow thin-film TaAs and NbAs, the prospects for the Weyl semimetals seem quite encouraging.
A fourth candidate for the chiral anomaly is ZrTe5 QLi ; Liang , which displays a moderately large negative LMR signal ( decreases by 35). A very recent experiment Liang has detected a (true) planar Hall effect when the chiral anomaly appears. This implies the simultaneous appearance of a large Berry curvature in applied . However, currently available bulk crystals have a narrow ribbon-like morphology unsuited for the squeeze test (a platelike shape is optimal). However, using focussed ion beam (FIB) techniques, we may envisage sculpting the ribbons into thin plates. Microlithography techniques can then be harnessed to deposit voltage contacts for measuring and . We are not aware of any technical barrier that would preclude applying the squeeze test on plate-like crystals tens of m on a side. The field profiles of and may then be compared as reported here in both Na3Bi and GdPtBi. The FIB technique can be applied to future chiral-anomaly candidate materials that do not readily grow as large crystals.
VI Planar Angular Magnetoresistance
As shown in Eqs. 2 and 3, the growth of the anisotropy arises differently in Cases (1) and (2). The difference leaves a strong imprint on the planar angular magnetoresistance (AMR) which we describe here. In an AMR experiment, is rotated within the - plane while the longitudinal and transverse voltages are recorded. AMR experiments have been used to investigate the resistivity anisotropy produced by the magnetization in ferromagnetic thin films. Recently, Burkov Burkov17 has suggested that AMR measurements may be used to probe the chiral anomaly.
The sample geometry is as defined above, but now with broad current contacts and a pair of standard Hall contacts spaced along (see inset in Fig. 7b). The lab frame ( and axes) remain fixed to the sides of the sample. The in-plane determines the sample’s orthogonal frame , and ( is tilted at an angle relative to with ). The tilt produces potential drops and given by
| (15) | |||||
| (16) |
where and are the resistivities measured along axes and , respectively, and .
[By convention, the transverse voltage is dubbed the “planar Hall effect” even though it is strictly even in . As does not satisfy the Onsager relation for a true Hall response, this is a misnomer. (In topological matter, the Berry curvature can generate a true in-plane Hall signal that is odd in and distinct from in Eq. 16.) To avoid confusion, we call the off-diagonal AMR signal, and the longitudinal AMR signal.]
Generally, the AMR results are not very informative (the same angular pattern is obtained regardless of the microscopic origin of the anisotropy). However, for our problem, we find that the parametric plot of vs. provides a litmus test that distinguishes Case 1 from Case 2.
In Case (1), with (), detects ; its “spurious” decrease as increases arises entirely from . In the orthogonal situation , detects (i.e., beam focussing effects are absent). By juxtaposition, the two measurements reveal how behaves (see Eqs. 2). This is best shown by plotting against with as the running parameter at a fixed value of the magnitude . In weak , the contours describe small loops circling the zero- point. As increases, they expand dramatically away from the zero- point in the direction of increasing . This lop-sided expansion (resembling a shock-wave) reflects the sharp increase in the resistivity measured orthogonal to (while remains unchanged; see Eq. 1). Indeed, from Eq. 1, we have in the high- limit
| (17) |
increases as without saturation. Hence, in Case 1, we expect the caliper of the contours (given by ) to expand without limit as .
Case (2) yields a qualitatively different parametric plot. In the chiral anomaly regime, our measurements show that (captured by at ) decreases intrinsically with increasing , while (at ) increases by roughly the same fraction. The balanced changes lead to closed contours that expand roughly isotropically from the zero- point. Moreover, the contour calipers approach saturation at large .
VII Parametric plots
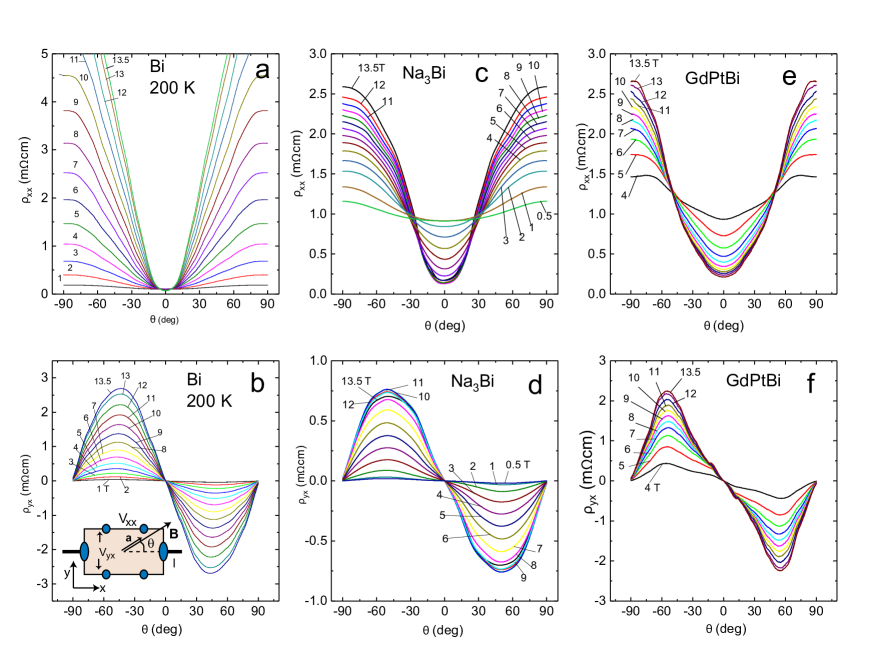
As in Sec. III, we compare the planar angular MR results in the 3 materials, pure Bi, Na3Bi and GdPtBi. Figure 7a displays the angular profiles vs. at selected field magnitudes measured in Bi at 200 K with . As is tilted away from alignment with (), increases very rapidly at a rate that varies nominally as . The overall behavior in is a very large increase with as soon as exceeds 10∘. However, at , a decrease in of roughly 50 can be resolved. This is the spurious LMR induced by pure current jetting. The off-diagonal signal shows the variation described in Eq. 16 ( is strictly even in ).
The corresponding traces of and measured in Na3Bi at 2 K are shown in Figs. 7c and 7d, respectively. Although the curves for are similar to those in Bi, a qualitatively different behavior in becomes apparent. At , is suppressed by a factor of (when the chiral anomaly appears). In the transverse direction (), the poor conductance transverse to in the LLL raises by a factor . In terms of absolute magnitudes, the changes to are comparable along the two orthogonal directions, in sharp contrast with the case in Bi. This “balanced” growth leaves a clear imprint in the parametric plots. The off-diagonal signal displays the same variation as in Bi.
The plots of and for GdPtBi in Figs. 7e and 7f also show a concentric pattern. A complication in GdPtBi is that the nature of the Weyl node creation in field (by Zeeman shift of parabolic touching bands) is anisotropic (dependent on the direction of ). The existence of low- oscillations adds a modulation to the off-diagonal curves, which distorts the variation from the form. Nonetheless, a balanced growth in is also observed (Fig. 7e).
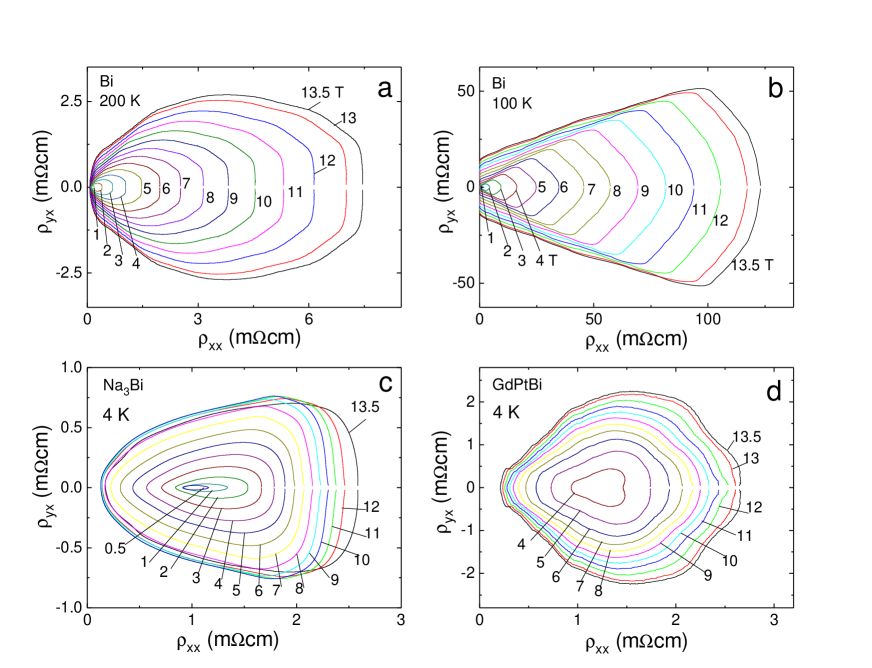
Figure 8 compares the parametric plots in Bi at = 200 K (Panel a) and 100 K (b). In each orbit ( set at indicated value), starts at 0∘ on the left limb and ends at on the right. In Fig. 8a, the steep increase on the right limb causes the orbits to expand strongly to the right. At 100 K (Panel b), the higher mobility creates exaggerated skewing of the rightward expansion leading to the emergence of a “shock-wave” pattern. By contrast, the parametric plots in both Na3Bi (Fig. 8c and GdPtBi (Panel d) show concentric orbits that expand in a balanced pattern as anticipated above. The contrast between Case (1) [Panels (a) and (b)] and Case (2) reflects directly the distinct nature of mechanisms that increase the anisotropy (see Eqs. 2 and 3).
VIII Concluding remarks
As mentioned in Sec. I, the existence of a negative LMR (longitudinal magnetoresistance) that is intrinsic is relatively rare. However, the observation of an artifactual decrease in the LMR geometry is a common experience in high mobility semimetals. To assist in the task of disentangling the rare intrinsic cases from extrinsic cases (mostly caused by current jetting), we described a test that determines the current-jetting distortions and a procedure for removing them. The squeeze test consists of comparing the effective resistance measured along the spine (line joining current contacts) with that along an edge . In pure Bi, increases dramatically with , while decreases. However, in both Na3Bi and GdPtBi, both and decrease. Hence an inspection of the trend in allows Case (1) (here Bi) to be distinguished from Case (2), the two chiral-anomaly semimetals. From the factorization implicit in Eqs. 9 and 10, we relate the experimental ratio to the curve obtained by numerical simulation. This enables the intrinsic profiles of both and to be obtained from measurements of and . After removal of the distortions, is seen to decrease by a large factor (10.9) between = 0 and 10 T, while increases by 8. (For simplicity, the numerical simulation was done in the 2D limit which we judge is adequate for flake-like samples. Obviously, this can be improved by adopting a fully 3D simulation.) The yes/no nature of the test based on inspection of , bolstered by the quantitative analysis which removes the sub-dominant corrections, adds considerable confidence that the chiral-anomaly LMR profiles in Na3Bi and GdPtBi are intrinsic. Moreover, the subdominant distortion factors arising from current jetting can be effectively removed.
In Sec. V, we described LMR experiments as a competition between the intrinsic quantum effect arising from the chiral anomaly and the classical effects of current jetting. The former describes a phenomenon intrinsic to massless chiral fermions. To see it in full force, the applied should exceed , the field needed to move into the LLL. This point seems worth emphasizing because in many reports the claimed anomaly seems to appear in weak fields . The experimental concern is that once current jetting appears (at the field scale ) it inevitably engenders a dominant, negative LMR profile that is extrinsic in origin. The divergent field profiles of and provide a strong warning that the LMR profile is then highly unlikely to be intrinsic.
Looking ahead, we discussed in Sec. V how the classical screening effect from current jetting may be avoided by using ultrathin, gateable films of the Weyl semimetals which may become available in the near future. For the fourth class of chiral anomaly semimetal ZrTe5 QLi ; Liang , we propose using a focussed ion beam to sculpt platelike, samples 10 m on a side, and applying microlithography to attach contacts for the squeeze test.
References
- (1) H. B. Nielsen and M. Ninomiya, “The Adler-Bell-Jackiw Anomaly and Weyl Fermions in a Crystal,” Phys Lett B 130, 389-396 (1983).
- (2) S. M. Young, S. Zaheer, J. C. Y. Teo, C. L. Kane, E. J. Mele and A. M. Rappe, “Dirac Semimetal in Three Dimensions,” Phys Rev Lett 108, 140405 (2012).
- (3) X. G. Wan, A. M. Turner, A. Vishwanath and S. Y. Savrasov, “Topological semimetal and Fermi-arc surface states in the electronic structure of pyrochlore iridates,” Phys Rev B 83, 205101 (2011).
- (4) Chen Fang, Matthew J. Gilbert, Xi Dai, and B. Andrei Bernevig, “Multi-Weyl Topological Semimetals Stabilized by Point Group Symmetry,” Phys Rev Lett 108, 266802 (2012).
- (5) Bohm-Jung Yang and Naoto Nagaosa, “Classification of stable three-dimensional Dirac semimetals with nontrivial topology,” Nat. Commun. 5, 4898 (2014). Medline doi:10.1038/ncomms5898
- (6) Z. J. Wang, Y. Sun, X. Q. Chen, C. Franchini, G. Xu, H. M. Weng, X. Dai and Z. Fang, “Dirac semimetal and topological phase transitions in Bi ( = Na, K, Rb),” Phys Rev B 85, 195320 (2012).
- (7) Classical Theory of Gauge Fields, Valery Rubakov (Princeton University Press, 2002), Ch. 15 and 17.
- (8) Stephen L. Adler, “Axial-Vector Vertex in Spinor Electrodynamics,” Phys. Rev. 177, 2426 (1969).
- (9) J.S. Bell and R. Jackiw, Nuovo Cimento 60A, 4 (1969).
- (10) Introduction to Quantum Field Theory, Michael E. Peskin and Dan V. Schroeder, (Westview Press, 1995), Ch. 19.
- (11) Anomalies in Quantum Field Theory, Reinhold A. Bertlmann (Clarendon Press, 2011).
- (12) Kai-Yu Yang, Yuan-Ming Lu, and Ying Ran, “Quantum Hall effects in a Weyl semimetal: Possible application in pyrochlore iridates,” Phys Rev B 84, 075129 (2011).
- (13) D. T. Son and B. Z. Spivak, “Chiral anomaly and classical negative magnetoresistance of Weyl metals,” Phys Rev B 88, 104412 (2013).
- (14) S.A. Parameswaran, T. Grover, D. A. Abanin, D. A. Pesin, A. Vishwanath, ”Probing the Chiral Anomaly with Nonlocal Transport in Three-Dimensional Topological Semimetals”, Phys. Rev. X 4, 031035 (2014).
- (15) A. A. Burkov, “Negative longitudinal magnetoresistance in Dirac and Weyl metals” Phys. Rev. B 91, 245157 (2015). DOI: 10.1103/PhysRevB.91.245157
- (16) Jun Xiong, Satya K. Kushwaha, Tian Liang, Jason W. Krizan, Max Hirschberger, Wudi Wang, R. J. Cava, N. P. Ong, “Evidence for the chiral anomaly in the Dirac semimetal Na3Bi,” Science 350, 413 (2015). DOI: 10.1126/science.1259440
- (17) Max Hirschberger, Satya Kushwaha, ZhijunWang, Quinn Gibson, Sihang Liang, Carina A. Belvin, B. A. Bernevig, R. J. Cava and N. P. Ong, “The chiral anomaly and thermopower of Weyl fermions in the half-Heusler GdPtBi,” Nature Materials 15, 1161 (2016). DOI: 10.1038/NMAT4684
- (18) Xiaochun Huang, Lingxiao Zhao, Yujia Long, Peipei Wang, Dong Chen, Zhanhai Yang, Hui Liang, Mianqi Xue, Hongming Weng, Zhong Fang, Xi Dai, and Genfu Chen, “Observation of the Chiral-Anomaly-Induced Negative Magnetoresistance in 3D Weyl Semimetal TaAs,” Phys. Rev. X 5, 031023 (2015).
- (19) Cheng-Long Zhang et al., “Signatures of the Adler–Bell–Jackiw chiral anomaly in a Weyl fermion semimetal,” Nat. Commun. 7:10735 doi: 10.1038/ncomms10735 (2016).
- (20) R. D. dos Reis, M.O. Ajeesh, N. Kumar, F. Arnold, C. Shekhar, M. Naumann, M. Schmidt, M. Nicklas and E. Hassinger, “On the search for the chiral anomaly in Weyl semimetals: the negative longitudinal magnetoresistance,” New J. Phys. 18 (2016) 085006, doi:10.1088/1367-2630/18/8/085006
- (21) Yupeng Li et al., “Negative magnetoresistance in Weyl semimetals NbAs and NbP: Intrinsic chiral anomaly and extrinsic effects,” Front. Phys. 12(3), 127205 (2017) DOI 10.1007/s11467-016-0636-8
- (22) Jun Xiong, Satya Kushwaha, Jason Krizan, Tian Liang, R. J. Cava and N. P. Ong, “Anomalous conductivity tensor in the Dirac semimetal Na3Bi,” EPL 114, 27002 (2016); doi: 10.1209/0295-5075/114/27002
- (23) A. A. Burkov, “Giant planar Hall effect in topological metals,” Phys. Rev. B 96, 041110 (2017) DOI: 10.1103/PhysRevB.96.041110
- (24) Li, Q. et al., Chiral magnetic effect in ZrTe5. Nat Phys 12, 550–554 (2016).
- (25) Tian Liang et al., “Anomalous Hall Effect in ZrTe5,” Nat. Phys., in press.
†Corresponding author’s email: npo@princeton.edu
Acknowledgements The research was supported by the U.S. Army Research Office (W911NF-16-1-0116) and a MURI award for topological insulators (ARO W911NF-12-1-0461). NPO acknowledges support from the Gordon and Betty Moore Foundation’s Emergent Phenomena in Quantum Systems Initiative through Grant GBMF4539. The growth and characterization of crystals were performed by S.K. and R.J.C., with support from the National Science Foundation (NSF MRSEC grant DMR 1420541). Work at UCLA was supported by the U.S. Department of Energy (DOE), Office of Basic Energy Sciences, Award DE-SC0011978.