Smart Contracts Software Metrics: a First Study
Abstract
Smart contracts (SC) are software codes which reside and run over a blockchain. The code can be written in different languages with the common purpose of implementing various kinds of transactions onto the hosting blockchain, They are ruled by the blockchain infrastructure and work in order to satisfy conditions typical of traditional contracts. The software code must satisfy constrains strongly context dependent which are quite different from traditional software code. In particular, since the bytecode is uploaded in the hosting blockchain, size, computational resources, interaction between different parts of sofware are all limited and even if the specific software languages implement more or less the same constructs of traditional languages there is not the same freedom as in normal software development. SC software is expected to reflect these constrains on SC software metrics which should display metric values characteristic of the domain and different from more traditional software metrics. We tested this hypotesis on the code of more than twelve thousands SC written in Solidity and uploaded on the Ethereum blockchain. We downloaded the SC from a public repository and computed the statistics of a set of software metrics related to SC and compared them to the metrics extracted from more traditional software projects. Our results show that generally Smart Contracts metrics have ranges more restricted than the corresponding metrics in traditional software systems. Some of the stylized facts, like power law in the tail of the distribution of some metrics, are only approximate but the lines of code follow a log normal distribution which reminds of the same behavior already found in traditional software systems.
keywords:
Power laws , Software Metrics , Smart Contracts , Software engineering , Blockchain , EthereumPACS:
89.20.Ff , 89.75.-k , 89.75.DaSP 2008/0/3/01
1 Introduction
Smart Contracts have gained tremendous popularity in the past few years, to the point that billions of US Dollars are currently exchanged every day through such technology. However, since the release of the Frontier network of Ethereum in 2015, there have been many cases in which the execution of Smart Contracts managing Ether coins lead to problems or conflicts. Smart Contracts rely on a non-standard software life-cycle, according to which, for instance, delivered applications can hardly be updated or bugs resolved by releasing a new version of the software. Furthermore their code must satisfy to constraints typical of the domain, like the following: they must be light, the deployment on the blockchain must take into account the cost in terms of some criptovalue, their operational cost, againg in terms of criptovalue, must be limited, they are immutable, since the bytecode is inserted into a blockchain block once and forever.
The idea of Sc was originally described by cryptographer Nick Szabo in 1997, as a kind of digital vending machine. In his paper [27], he imagined how users could input data or value, and receive a finite item from a machine.
More in general, smart contracts are self-enforcing agreements, i.e. contracts, implemended through a computer program whose execution enforces the terms of the contract. The idea is to get rid of a central control authority, entity or organization which both parties must trust and delegate such role to the correct execution of a computer program. Such scheme can thus rely on a decentralized system automatically managed by machines. The Blockchain technology is the instrument for delivering the trust model envisaged by smart contracts.
Since smart contracts are stored on a blockchain, they are public and transparent, immutable and decentralised, and since blockchain resources are costly, their code size cannot exceed domain specific constrains. Immutability means that when a smart contract is created, it cannot be changed again.
Smart contracts can be applied to many different scenarios: banks could use them to issue loans or to offer automatic payments; insurance companies could use them to automatically process claims according to agreed terms; postal companies for payments on delivery.
A Smart Contract (SC) is a full-fledged program stored in a blockchain by a contract-creation transaction. A SC is identified by a contract address generated upon a success creation transaction. A blockchain state is therefore a mapping from addresses to accounts. Each SC account holds an amount of virtual coins (Ether in our case), and has its own private state and storage.
The up-to-date SC progrmmaing language is Solidity which runs on the Ethereum Virtual Machine (EVM) on the Ethereum blockchain. Since this is currently the most popular paradigm, we focus our attention on Solidity. An Ethereum SC account hence typically holds its executable code and a state consisting of:
-
1.
a private storage
-
2.
the amount of virtual coins (Ether) it holds, i.e. the contract balance.
Users can transfer Ether coins using transactions, like in Bitcoin, and additionally can invoke contracts using contract-invoking transactions. Conceptually, Ethereum can be viewed as a huge transaction-based state machine, where its state is updated after every transaction and stored in the blockchain.
Smart Contracts source code manipulate variables in the same way as traditional imperative programs. At the lowest level the code of an Ethereum SC is a stack-based bytecode language run by an Ethereum virtual machine (EVM) in each node. SC developers define contracts using high-level programming languages. One such language for Ethereum is Solidity [40] (a JavaScript-like language), which is compiled into EVM bytecode. Once a SC is created at an address X, it is possible to invoke it by sending a contract-invoking transaction to the address X. A contract-invoking transaction typically includes:
-
1.
payment (to the contract) for the execution (in Ether).
-
2.
input data for the invocation.
1.0.1 Working Example
Figure 1 shows a simple example of SC reported in [30], which rewards anyone who solves a problem and submit the solution to the SC.
A contract-creation transaction containing the EVM bytecode for the contract in Figure 1 is sent to miners. Eventually, the transaction will be accepted in a block, and all miners will update their local copy of the blockchain: first a unique address for the contract is generated in the block, then each miner executes locally the constructor of the Puzzle contract, and a local storage is allocated in the blockchain. Finally the EVM bytecode of the anonymous function of Puzzle (Lines 16+) is added to the storage.
When a contract-invoking transaction is sent to the address of Puzzle, the function defined at Line 16 is executed by default. All information about the sender, the amount of Ether sent to the contract, and the input data of the invoking transaction are stored in a default input variable called msg. In this example, the owner (namely the user that created the contract) can update the reward (Line 21) by sending Ether coins stored in msg.value (if statement at Line 17), after sending back the current reward to the owner (Line 20).
In the same way, any other user can submit a solution to Puzzle by a contract-invoking transaction with a payload (i.e., msg.data) to claim the reward (Lines 22-29). When a correct solution is submitted, the contract sends the reward to the sender (Line 26).
1.0.2 Gas system
It is worth remarking that a SC is run on the blockchain by each miner deterministically replicating the execution of the SC bytecode on the local copy of the blockchain. This, for instance, implies that in order to guarantee coherence across the copies of the blockchain, code must be executed in a strictly deterministic way (and therefore, for instance, the generation of random numbers may be problematic).
Solidity, and in general high-level SC languages, are Turing complete in Ethereum. In a decentralised blockchain architecture Turing completeness may be problematic, e.g. the replicated execution of infinite loops may potentially freeze the whole network.
To ensure fair compensation for expended computation efforts and limit the use of resources, Ethereum pays miners some fees, proportionally to the required computation. Specifically, each instruction in the Ethereum bytecode requires a pre-specified amount of gas (paid in Ether coins). When users send a contract-invoking transaction, they must specify the amount of gas provided for the execution, called gasLimit, as well as the price for each gas unit called gasPrice. A miner who includes the transaction in his proposed block receives the transaction fee corresponding to the amount of gas that the execution has actually burned, multiplied by gasPrice. If some execution requires more gas than gasLimit, the execution terminates with an exception, and the state is rolled back to the initial state of the execution. In this case the user pays all the gasLimit to the miner as a counter-measure against resource-exhausting attacks [28].
The code in Fig. 1 displays typical features of the Solidity SCs code: the Contract declaration, addresses declarations and mapping, owner data managing and the functions with the specific code for implementing the contract and transactions between blockchain addresses. Most of the control structures from JavaScript are available in Solidity except for switch and goto. So there is: if, else, while, do, for, break, continue, return, ? :, with the usual semantics known from C or JavaScript.
Functions of the current contract can be called directly (Internal Function Calls), also recursively. These function calls are translated into simple jumps inside the EVM. This has the effect that the current memory is not cleared, i.e. passing memory references to internally-called functions is very efficient. Only functions of the same contract can be called internally. The expressions this.g(); and c.g(); (where c is a contract instance) are also valid function calls, but this time, the function will be called as External Function Call, via a message call and not directly via jumps. Functions of other contracts have to be called externally. For an external call, all function arguments have to be copied to memory. When calling functions of other contracts, the amount of criptocurrency (Wei) sent with the call and the gas can be specified with special options .value() and .gas(), respectively. Inheritance between contracts is also supported. Being the format inspired to classes of object oriented programming languages, it is straighforward to define and compute some of the software metrics typically encountered in object oriented software systems, like number of lines of code, comments, number of methods or functions, cyclomatic complexity and so on, while it is somehow more difficult to recognize software metrics related to communication between smart contracts, since these can be ruled by blockchain transactions among contracts, which can act somehow as code libraries.
On the other hand smart contracts are deployed and work on the blockchain infrastructure and it is thus likely that typical value of the same metrics can differ from the typical values of the same metrics in traditional software systems.
It became thus interesting, even from a software engineering point of view, to perform a statistical analisys of SCs software metrics and to compare the data with those diplayed by traditional software systems. It is also of primary interest to examine the connnection between software metrics and software quality, a field of research well established in traditional software, in the specific domain of smart conracts given that it is well known that SCs code vulnerability have been exploited to stole value in criptocurrencies from smart contratcs.
In this paper we perform the analysis on a data set of 12094 smart contracts downloaded from etherscan.io, a platform allowing enhanced browsing of ethereum blockchain and smart contracts, up to the January 24 2018. We collected the blockchain addresses, the Solidity source code, the ABI and the bytecode of each contract and extracted a set of standard and SC-specific software metrics such as number of lines of smart contract code (LOCSC), line of comments, blank lines, number of functions, cyclomatic complexity, number of events calls, number of mappings to addresses, number of payable, number of modifiable and so on. We analyzed the statistical distributions underlying such metrics to discover if they exhibit the same statistical properties typical of standard software systems or if the SM costraints act so that a sensible variation in these distribution can be detected. Furhtermore we devise a path to the analysis of which and to what extent the SC metrics influence samrt contract performance, usage in the blockchain, vulnerabilities, and possible other factors related to the specific contracts which can be reflected on the domain of application for which the smart contract has been deployed, like, for example, to implement and rule an initial coin offer (ICO), to control a chain of certification like in medical applications and so on.
2 Related works
Blockchain technology and Smart Contracts rised an exponentially increasing interest in the last years in different fields of research. Organizations such as banking and financial institutions, and public and regulatory bodies, started to explicitly talk of the importance of these new technologies.Software Engineering specific for blockchain applications and Smart Contract is still in its infancy [50] and in particular the investigation of the relationships among Smart Contracts Software Metrics (SCSM) and code quality, SC performaces, vulnerability, maintainability and other software features is completely lacking. Smart Contracts and blockchain have been discussed in many textbooks [51] and documents over the internet, where white papers usually cover the specific topic of interest [3, 4, 5].
Ethereum defines a smart contract as a transaction protocol that executes the terms of a contract or group of contracts on a cryptographic blockchain [2]. SC operate autonomously with no entity controlling the majority of its tokens, and its data and records of operation must be cryptographically stored in a public, decentralized blockchain [51].
Smart Contract vulnerabilities have been analyzed in [29], [31], [32]. A taxonomy of Smart Contract is performed in [33], where Smart Contracts are classified according to their purpose. These are divided into wallets, financial, notary, game and library.
Authors in [30] investigate the security of running smart contracts based on Ethereum in an open distributed network like those of cryptocurrencies and introduce several new security problems in which an adversary can manipulate smart contract execution to gain profit.
Obviously Smart Contract scientific literature is quite limited due to their recent creation. On the other hand there is a pletora of results and information to rely on produced in the last decades for what concernes the relationship among software metrics and software quality, maintainability, reliability, performance defectiveness and so on. Measuring software to get information about its properties and quality is one of the main issues in modern software engineering. Limiting ourselves to object-oriented (OO) software, one of the first works dealing with this problem is the one by Chidamber and Kemerer (CK) [58], who introduced the popular CK metrics suite for OO software systems [44]. In fact, different empirical studies showed significant correlations between some of CK metrics and bug-proneness [43] [48] [41] [45], [59]. Metrics have been defined also on software graphs and were found most correlated to software quality [52] [53]. Tosun et al. applied Social Networks Aanalysis to OO software metrics source code to assess defect prediction performance of these metrics [42]
Product metrics, extracted by analyzing static code of software, have been used to build models that relate these metrics to failure-proneness
[49] [41] [43] [48] [45].
Among these, the CK suite is historically the most adopted and validated to analyze bug-proneness of software systems
[41] [43] [48] [45].
CK suite was adopted by practitioners [43] and is also incorporated into several industrial software development tools.
Based on the study of eight medium-sized systems developed by students, Basili et al. [48] were among the first to find that OO metrics
are correlated to defect density.
Considering industry data from software developed in C++ and Java, Subramanyam and Krishnan [41]
showed that CK metrics are significantly associated with defects.
Among others, Gimothy et al. [45], studying a Open Source system, validated the usefulness of these metrics for fault-proneness prediction.
CK metrics are intended to measure the degree of coupling and cohesion of classes in OO software contexts.
Statistical analysis has also been used in literature to detect tipical features of complex software and to relate
the statistical properties to software quality.
Recently, some researchers have started to study the field of software, in the perspective of finding and studying the associated power-law distributions. In fact, many software systems have reached such a huge dimension that it looks sensible to treat them using the stochastic random graph approach [15].
Examples of these properties are the lines of code of a class, a function or a method; the number of times a function or a method is called in the system; the number of time a given name is given to a method or a variable, and so on.
Some authors already found significant power-laws in software systems. Cai and Yin [18] found that the degree distribution of software execution processes may follow a power-law or display small-world effects. Potanin et al. [34] showed that the graphs formed by run-time objects, and by the references between them in object-oriented applications, are characterized by a power-law tail in the distribution of node degrees. Valverde et al. [36][37] found similar properties studying the graph formed by the classes and their relationships in large object-oriented projects. They found that software systems are highly heterogeneous small world networks with scale-free distributions of the connection degree. Wheeldon and Counsell [38] identified twelve power laws in object-oriented class relationships of Java programs. In particular, they analyzed the distribution of class references, methods, contructors, field and interfaces in classes, and the distribution of method parameters and return types. Myers [21] found analogue results on large C and C++ open source systems, considering the collaborative diagrams of the modules within procedural projects and of the classes within the OO projects. He also computed the correlation between some metrics concerning software size and graph topological measures, revealing that nodes with large output degree tend to evolve more rapidly than nodes with large input degree. Other authors found power-laws studying C/C++ source code files, where graph edges are the files, while the ”include” relationships between them are the links [16], [13]. Tamai and Nakatani [35], proposed a statistical model to analyze and explain the distributions found for the number of methods per class, and for the lines of code per method, in a large object-oriented system.
While most of these studies are based on static languages, such like C++ and Java, Marchesi et al.[20] provide evidence that a similar behavior is displayed also by dynamic languages such as Smalltalk. Concas et al. found power-law and log-normal distributions in some properties of Smalltalk and Java software systems – the number of times a name is given to a variable or a method, the number of calls to methods with the same name, the number of immediate subclasses of a given class in five large object-oriented software system [11], [12]. The Pareto principle is used to describe how faults in large software systems are distributed over modules [14], [22], [23], [6], [39]. Baxter et al. [9] found power-law and lognormal distributions in the class relationship in Java programs. They proposed a simple generative model that reproduces the features observed in real software graph degree distributions. Ichii et al. [17] investigated software component graphs composed of Java classes finding that in-degree distribution follows the power law distribution and the out-degree distribution does not follow the power-law. Louridas et al. [19], in a recent work, show that incoming and outgoing links distributions have in common long, fat tails at different levels of abstraction, in diverse systems and languages (C, Java, Perl and Ruby). They report the impact of their findings on several aspects of software engineering: reuse, quality assurance and optimization.
We choose to investigate these properties not only because they show a patent power-law behaviour, but also because the former two are related to design and coding guidelines, while the last one is Chidamber and Kemerer (CK) NOC metrics [10].
Wheeldon and Counsell [38], as well as other researchers, found power-laws in the distributions of many software properties, such as the number of fields, methods and constructors of classes, the number of interfaces implemented by classes, the number of subclasses of each class, as well as the number of classes referenced as field variables and the number of classes which contain references to classes as field variables. Thus, there is much evidence that power-laws are a general feature of software systems. Concas et al. [11, 64] explained the underlying mechanism through a model based on a single Yule process in place during the software creation and evolution [56]. Micro patterns represent design at class level and has been studied in software engineering [62, 75, 65, 66] and are promising for Smart contract as well, they could catch design decisions that could be associated to good or bad programming practices.
More recently affect metrics have been investigated revealing how during software development productivity and software quality can be highly influenced by developers moods [24, 25, 26, 74, 73], analyzing in deep details the properties of affect data in software development [63, 76, 68, 70, 69] and building tool for recognize emotions in software developers’ text [75, 72, 71, 67].
3 Experimental Set-Up
Etherscan [1] is a web based platform which allows for Ethereum blockchain exploration of all blockcahin addresses. It allows to recover Smart Contracts bytecode, ABI, and it collects also Smart Contract source codes in Solidity, for more than 12000 contracts at time of writing. We parsed blockchain addresses related to Smart Contracts available source code and systematically downloaded Solidity contracts code as well as the bytecode and the infos associated to the ABI.
After collected and locally stored Solidity code, bytecode and ABI infos we built a code parser in order to extract the software metrics of our interest for each smart contract. We also manually explored the code to get insights into the more relevant informations to eventually extract from the data and to get a flavour of the main features of the overall dataset. This exlploratory analysis allowed us to note how the same conract code is often replicated and deployed to different blockcahin addresses or deployed with very little changes. This pattern reveals how many contracts are simply experiments or are deployed to the blockcahin for testing and then modified according to test’s results. These usually appear in a series of neighbour blockchain blocks. The dataset has thus a little bias but the overall effect is negligible in our analysis since there are very few cases of replicated Solidity code.
The dataset source code has been then parsed for computing total lines of code in the associated to a specific blockchain address, the number of smart contracts inside a single address code (the analogous of classes into java files, eg. compilation units), blank lines, comment lines, number of static calls to events, number of modifiers, number of functions, number of payable functions, cyclomatic complexity as the simplest McCabe definition [49], number of mappings to addresses. We also computed the size of the associated bytecode and of the vector of contract’s ABIs. These are the Application Binary Interfaces, defining the interface definition of any smart contract, known at compilation time and static. All contracts will have the interface definitions of any contracts they call available at compile-time [8]. This specification does not address contracts whose interface is dynamic or otherwise known only at run-time.
The data set is structured in order to keep track of the specific Smart Contract address so that any blockchain address related Smart Contract metrics (SCEM: smart contract external metrics) can be fully analyzed in relationship with the software metrics self contained into the Smart Contract Solidity code (SCIM: smart contract internal metrics). For example it is possible to investigate Smart Contracts calls to or from other addresses, Intra-Smart Contract calls, gas consumption, cryptocurrencies exchanges and the similar can be related to the SCIM or are independent from them, included bytecode metrics or ABI metrics. ABI metrics in particular are the Smart Contract interface and reflect the external exposure of the Smart Contract towards blockchain calls from other addresses, which can be interaction with other Smart Contracts as well.
It is worth noting that not all the measures related to addresses stay constant but many of them depend on the time of analysis and cannot be defined among the SC metrics, and others can simply be contract variables, like the amount of ether stored into the contract, the amount of gas, the number of owners in a multiowned contract, the contract performance or popularity in terms of calls to the contract and so on. In such cases much care is needed in order to evaluate a relationship among Smart Contract software metrics and other measures blockchain related, not only because they may be time varying, but also because other external factors can be in place. For example, the success of a contract could be defined in terms of calls to that contract, but if the contract implements an Initial Coin Offer, then most likely the contract in itself, tought as software code, has probably little to do with it.
For each software metric we computed standard statistics like average, median, maxima and minima values and standard deviation. Furthermore we verified what kind of statistical distribution these metrics belong to. This is particularly important when comparing Smart Contract’s source code with other source code metrics, eg. Java source code, for standard software projects. In fact the literature on software metrics demonstrates that there exist statistical distributions which are typical of specific metrics regardless the programming language used for software development.
In particular LOC, coupling metrics, like fan-in and fan-out, and other software metrics are known to display a fat tail in their statistical distribution [19], [12] regardless the programming language, the platform or the software paradigm adopted for a software project.
Due to the domain specific constraints the Smart Contract software must satisfy to, in particular limited size resources, it is not granted that such software metrics does respect the canonical statistical distributions found in general purpose software projects. It is one of the aims of this reserch to verify and eventually discuss such conjecture.
4 results
With start analyzing centrality and dispersion measures for all the computed metrics, like mean, average, median, and standard deviation, interquartile range, total variation range. These statistics provide a summary of the overall behavior for the metrics values. In particular for asymetric distributions centrality measures differs from one another, and in the case of power laws distributions the largest values of the metrics cam be order of magnitude larger than central and low values.
coomenti su power laws
| Metric | Mean | Median | Std | Max | Min | Iqr | 10th - 90th Prc |
|---|---|---|---|---|---|---|---|
| Total Lines | 316.5 | 201 | 326.9 | 4241 | 2 | 265 | 52-720 |
| Blanks | 55.0 | 32 | 61.4 | 692 | 0 | 49 | 9-138 |
| Function | 25.9 | 18 | 24.2 | 232 | 0 | 20 | 4-58 |
| Payable | 1.2 | 0 | 2 | 15 | 0 | 2 | 0-3 |
| Events | 4.6 | 3 | 4.4 | 42 | 0 | 4 | 0-10 |
| Mapping | 2.5 | 2 | 2.3 | 31 | 0 | 1 | 0-5 |
| Modifier | 2.3 | 1 | 3.2 | 26 | 0 | 3 | 0-7 |
| Contract | 9.2 | 7 | 8.8 | 93 | 1 | 8 | 2-20 |
| Address | 24.8 | 22 | 19.7 | 176 | 0 | 23 | 3-50 |
| Cyclomatic | 12.7 | 5 | 21.4 | 537 | 1 | 12 | 1-33 |
| Comments | 77.6 | 42 | 106.5 | 1285 | 0 | 85 | 0-209 |
| ABI | 3411.4 | 2864 | 2218.5 | 19207 | 0 | 2340 | 917-6332 |
| Bytecode | 9617.9 | 8273 | 6944.3 | 50607 | 15 | 7204 | 2693-18808 |
| LOC | 183.8 | 121 | 190.2 | 2318 | 2 | 167 | 34-389 |
Many minima values reult set to zero, since there are a few contracts with almost no code. The results on central tendency measures in Tab. 1 show that the mean is constantly larger than the median, (almost always of about two third) which is a feature typical of right skewed distributions. One simple reason explaining this fact is the lower bound posed to all the metrics by the fact that they are defined null or positive, while, in principle, large valus are not bounded. A little exception is represented by the Bytecode metric which features values for mean and median very close to each other, suggesting a distribution shape which may be not really skewed. Standard deviations are all comparable with the mean, meaning a large dispersion of values around the last, but there are not cases where it is much large than the mean or the media. Values of standard deviation much larger than the mean might be instead the case for power laws ditributions and such behavior has already been observed in software metrics for typical software systems [38], [11].
The maxima are all much larger than the corresponding means and medians, but rarely reach one order of magnitude larger and never two orders of magnitude. Finally the 90th percentiles are comparable with a displacement of some standard deviation from the mean. All these results suggest that the selected Smart Contracts metrics might not display a fat tail or power law distributions which are instead found in the literature for corresponding metrics of standard software systems.
 |
 |
 |
 |
Nevertheless outlyers values appear for all the metrics and the values in Tab 1 are not exahustive for explaining completely their statistical properties. In order to performe a complete analysis we proceed in two steps. We perform a first qualitative investigation analysing the histgrams for all the metrics, then we use more complex statistical models for best fitting the Empirical Complementary Cumulative Distribution Function in order to extract quantitative informations on Smart Contracts software metrics. The histogram patterns are well known to depend on the bin size and number, as well as on the local density of points into the various ranges. Nevertheless they can be an helpful instrument to get insight into the distribution shape general features, namely if there may be fat tails, bulk initial distribution values and so on. On the contrary the best fittings functions with statistical models provide precise values of core parameters and can be compared with those reported in literature for standard software metrics.
 |
 |
 |
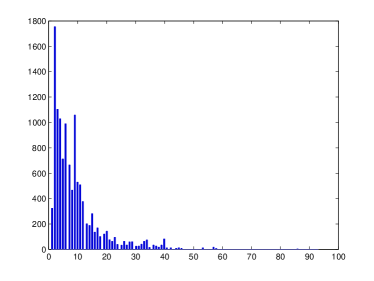 |
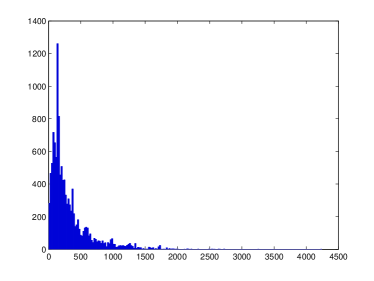
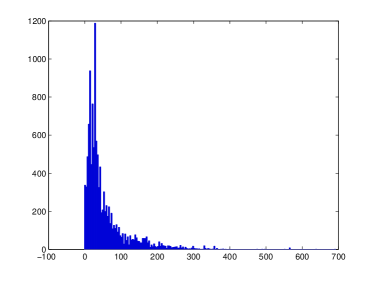
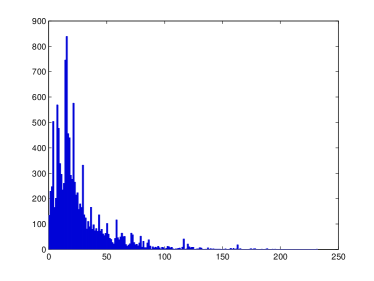
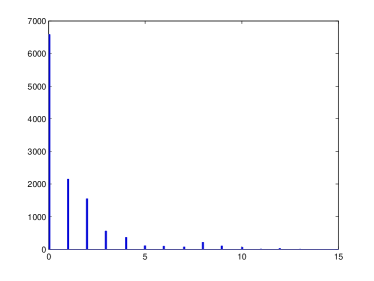
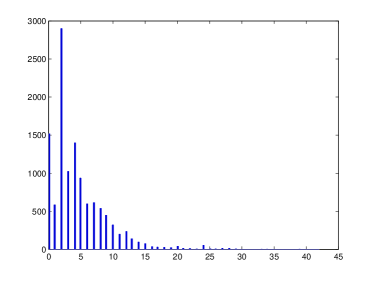
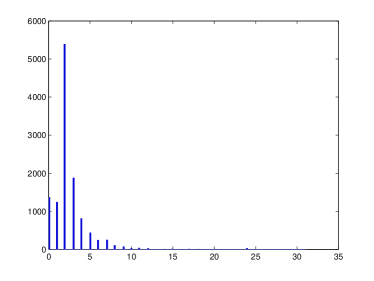
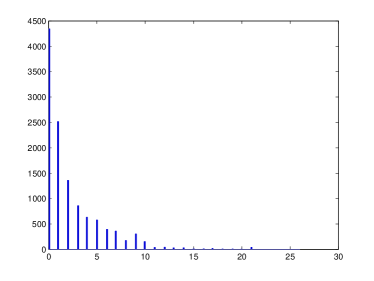
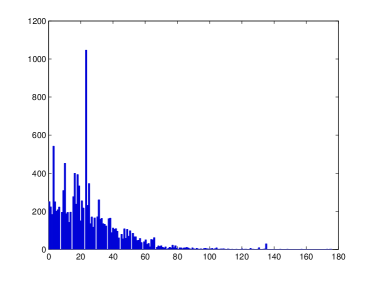
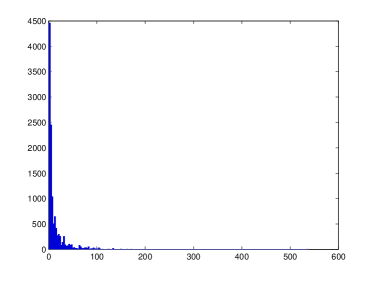
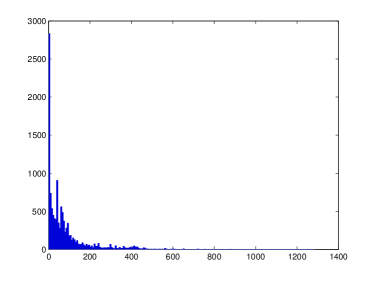
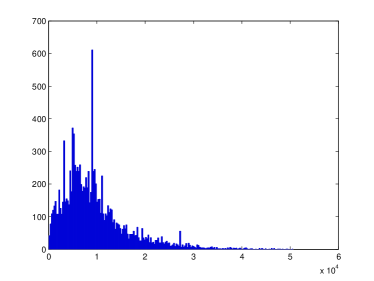
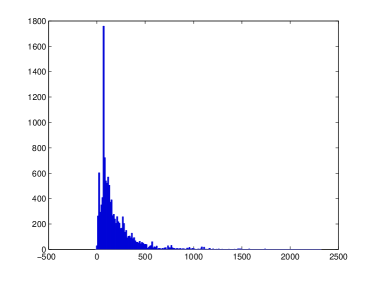
In Figs. 2, 3 and 4 we report the histograms for all the Smart Contracts software metrics in the same order they are reported in Tab. 1. The general shape can be distinguished into two categories. From one side there are those metrics whose ranges of variations are quite limited and maximum values are below 50, like Payable, Events, Mapping, Modifiable. For such metrics histograms contain too few different values which does not allow to display a power law behavior. In particular Payable and Modifiable appear also to have a bell shape which allows to exclude a general power law distribution. For Events and Mapping the shape may suggest a power law behavior which is limited by the upper bounds reached by the maximum metric values. This deserves to be better investigated using statistical distribution modeling.
From the other side the metrics which reach values large enough (whose maxima are over 80) contain enough points to well populate the histograms. Also in this case many metrics have bell shaped distributions with limited asymmetry and skewness. This feature can be ascribed to the limited range of values these metrics can reach. In fact, in cases where the metrics can assume virtually arbitrary large values, many orders of magnitude larger that their mean values, the bell shape disappear and the shape presents a strong asymmetry with a high skewness. This is the behavior observed in literature for metrics in common software systems. The only cases where a full power law distribution may approximately hold are those related to the lines of code, like total lines of code, blank lines, comments and LOC. But also in these cases the upper bound of the values of the metrics does not allow to fully aknoweldge for the power law. This seems to be a structural difference with respect to standard software systems where the number of lines of code for a class, for example in Java systems, may easily reach tens of thousands. In fact such systems rely on service classes containing many methods and code lines, whilst Smart Contracts code relies basically on the self contained code.
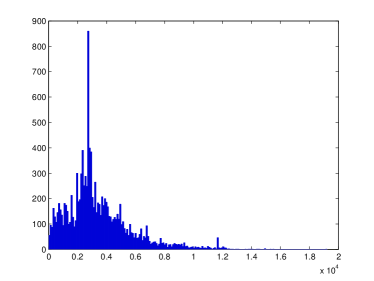
It is interesting to note the bell shaped behavior of the ABI metrics and of the Bytecode metric, which strongly differ from the shapes associated to lines of code or in general to other metrics. In the case of ABI this means that the amount of exposure of Smart Contracts to external interactions has a typical scale, provided by clear central values, even if the variance may be quite large. In other words Smart Contract exposure to the blockchain is very similar for most of the contracts, with no significative outlyers, regardelss the contract size in terms of LOC or other metrics. Bytecode display a rather similar but less symmetrics bell shape. In this case the behavior is clearly governed by the size contraints imposed by the costs of uploading very large Smart Contracts on the blockchain.
 |
 |
 |
 |
 |
 |
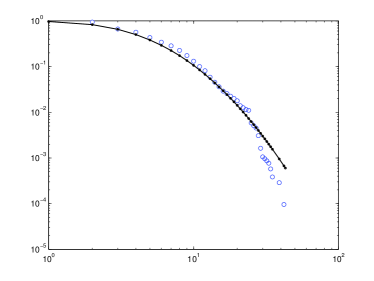
5 Statistical Modeling
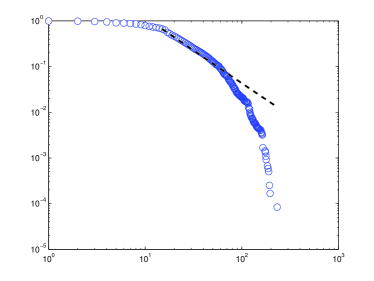
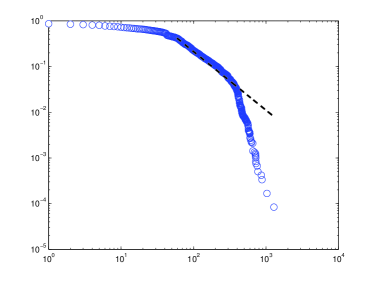
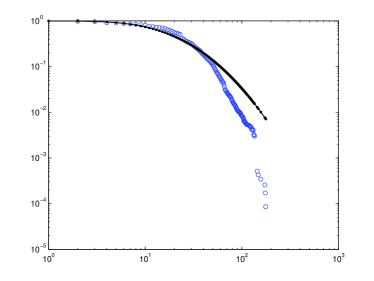
In order to get insights on the behavior of the statistical distributions underlying Smart Contracts software metrics we perform a best fitting analysis using a power law statistical distribution for best fitting the tails of the empirical distributions. Furthermore we performed a second analysis making use of the Lognormal statistical model. In fact, even when the power law model well represent the data in the tail it usually is unable to best fit the complete range of values in the statistical distributions.
To show the results of such analysis we don’t use histograms anymore, which are a rough approximation of a Probability Density Function (PDF). The histogram representation in fact carries many drowbacks, in particular when data are power-law distributed in the tail. The problems with representing the empirical PDF are that it is sensitive to the binning of the histogram used to calculate the frequencies of occurrence, and that bins with very few elements are very sensitive to statistical noise. This causes a noisy spread of the points in the tail of the distribution, where the most interesting data lie. Furthermore, because of the binning, the information relative to each single data is lost. All these aspects make difficult to verify the power-law behavior in the tail. To overcome these problems from now on we systematically report the experimental CCDF (Complementary Cumulative Distribution Function) in log-log scale, as well as the best-fitting curves in many cases. This is convenient because, if the PDF (probability distribution function) has a power-law in the tail, the log-log plot displays a straight line for the raw data. This is a necessary but by no means a sufficient condition for power-law behavior. Thus we used log-log plots only for convenience of graphical representation, but all our calculations (CDF, CCDF, best fit procedures and the same analytical distribution functions we use) are always in normal scale. With this representation, there is no dependence on the binning, nor artificial statistical noise added to the tail of the data. If the PDF exhibits a power-law, so does the CCDF, with an exponent increased by one. Fitting the tail of the CCDF, or even the entire distribution, results in a major improvement in the quality of fit. An exhaustive discussion of all these issues may be found in [54]. This approach has already been proposed in literature to explain the power-law in the tail of various software properties [12] [19], [55].
The CCDF is defined as , where the CDF (Cumulative Distribution Function) is the integral of the PDF. Denoting by the probability distribution function, by the CDF, and by the CCDF, we have:
| (1) | |||
| (2) | |||
| (3) |
The first distribution we describe is the well-known log-normal distribution. If we model a stochastic process in which new elements are introduced into the system units in amounts proportional to the actual number of the elements they contain, then the resulting element distribution is log-normal. All the units should have the same constant chance for being selected for the introduction of new elements [54]. This general scheme has been demonstrated to suit large software systems where, during software development, new classes are introduced into the system, and new dependencies –links– among them are created [19], [46]. The log-normal has also been used to analyze the distribution of Lines of Code [57]. The log-normal distribution has been also proposed in literature to explain different software properties ([61], [11], [19]). Mathematically it is expressed by:
| (4) |
It exhibits a quasi-power-law behavior for a range of values, and provides high quality fits for data with power-law distribution with a final cut-off. Since in real data largest values are always limited and cannot actually tend to infinity, the log-normal is a very good candidate for fitting power-laws distributed data with a finite-size effect. Furthermore, it does not diverge for small values of the variable, and thus may also fit well the bulk of the distribution in the small values range.
The power-law is mathematically formulated as:
| (5) |
where is the power-law exponent, the only parameter which characterizes the distribution, besides a normalization factor. Since for the function diverges in the origin, it cannot represent real data for its entire range of values. A lower cut-off, generally indicated , has to be introduced, and the power-law holds above . Thus, when fitting real data, this cut-off acts as a second parameter to be adjusted for best fitting purposes. Consequently, the data distribution is said to have a power-law in the tail, namely above .
 |
 |
 |
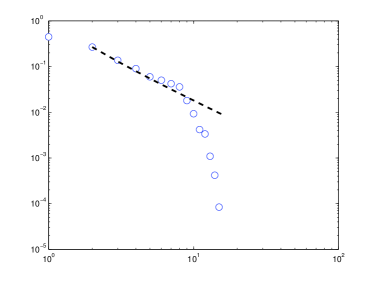 |
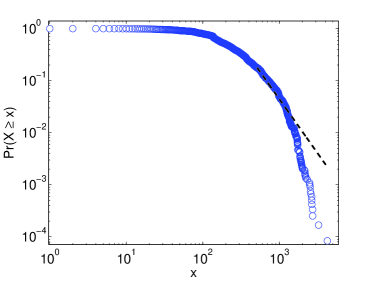
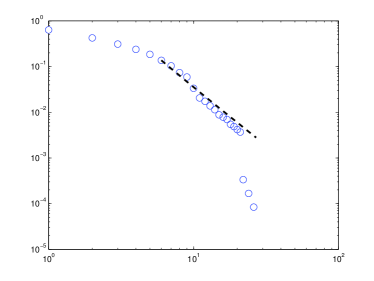
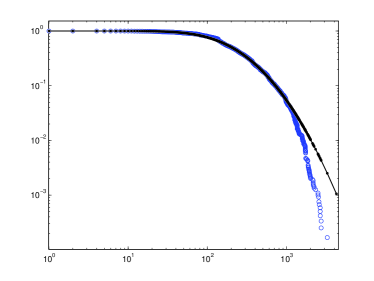
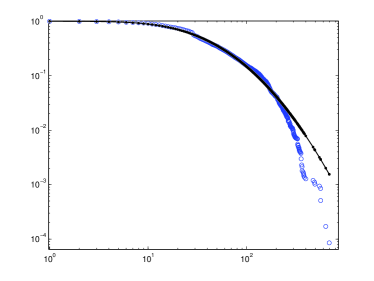
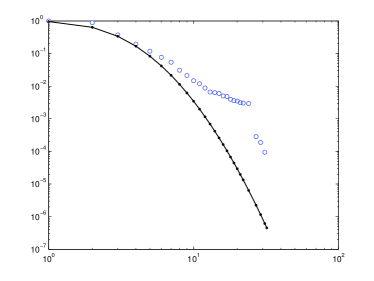
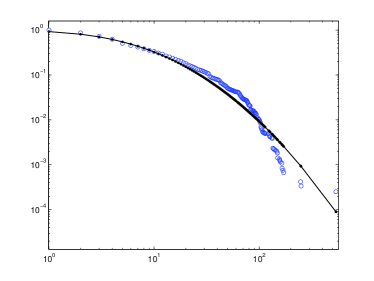
In Fig. 5 we show the best fitting plot for the power law model for the metrics Total lines, Blanks, Function and Payable. The power law in the tail is clearly failed by all metrics. In Fig. 6 Mapping and Modifier seems to follow a power law, confirmed also by the low values (D 0.05) of the Kolmogorof-Smirnov significance test value, but the range where the metrics behave according to a power law regime is too small.
 |
 |
 |
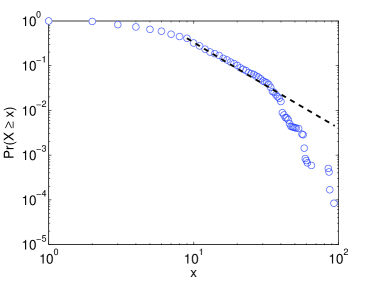 |
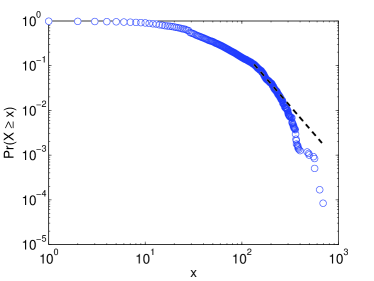
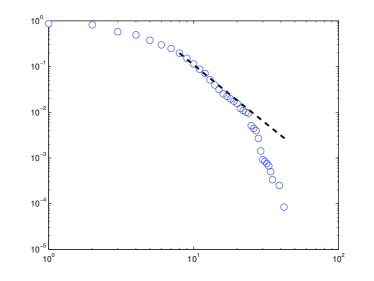
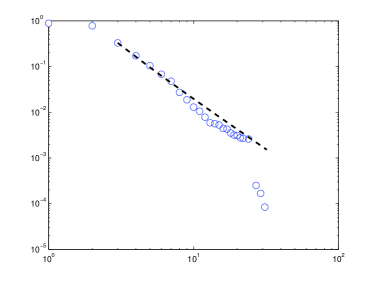
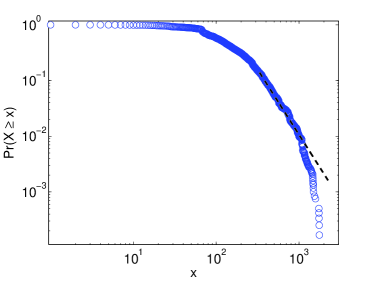
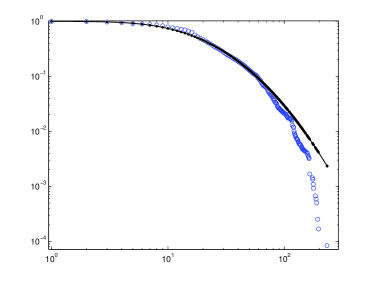
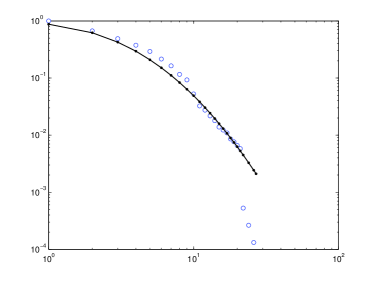
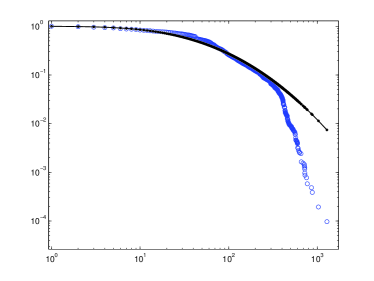
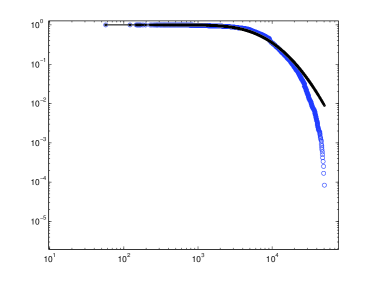
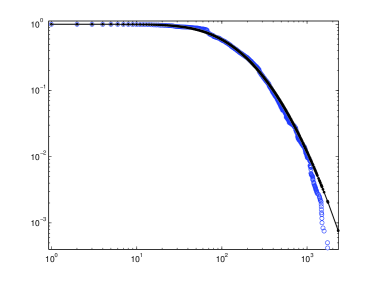
Fig. 7 finally shows that a good candidate for a power law in the tail is the LOC metric, supported by a KS coefficient of significance of about 0.039. This suggests that also for the Smart Contract code the main size metric in software, the lines of code, shows properties similar to those of standard software systems. Also the Address metric displays a reasonable power law regime for a range of its values, showing a behaviour similar to that found for the metric “Name of Variables” in Java software [12]. Thus the usage of the keyword “Address” in Smart Contracts occurs in quantities which remind the usage of variable names in Java.
 |
 |
 |
 |
 |
 |
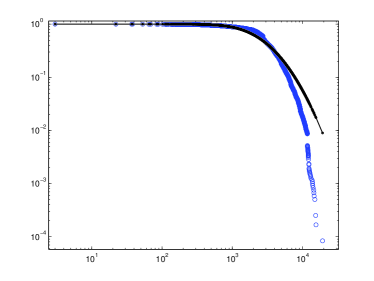
Finally we analyzed all the statistical distributions using a log-normal best fitting model.
 |
 |
 |
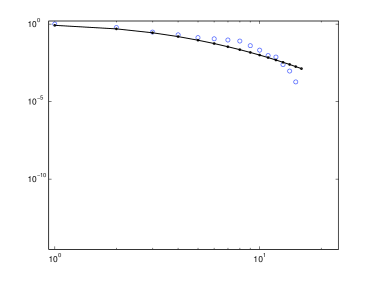 |
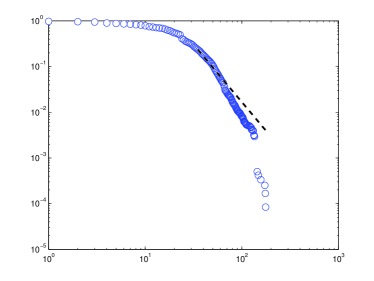
In Fig. 8 we show the Lognormal best fitting curves together with the empirical cumulative distribution functions for the Smart Contracts metrics Total lines, Blanks, Function and Payable. The first three metrics are nicely fitted by the Lognormal statistical distribution in the bulk, for low values of the metrics, but not in the tail, even if the is quite close to one for each case (). Such result confirms the previouos one obtained for the power law model [60]. The best fitting lacks mainly in the tail of the distribution, as expected. In fact the empirical distribution drops more rapidly than the best fitting curve because of the cut-off for large values of the metrics. This may be explained by the hypothesis that Smart Contract size metrics, like Total Lines of code, Functions and Blanks are upper bounded according to the size costraints associated to the deployment of Smart Contracts into the blockchain. The Payable metric results in a too poor statistic to be well fitted by a Lognormal distribution.
 |
 |
 |
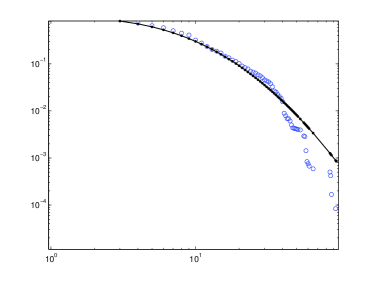 |
Fig. 9 show the metrics Events, Mapping, Modifier and Contract. Mapping cannot be well fitted by a Lognormal, as it was vety well explained by a power law in the range corresponding to the bulk of the distribution rather than in the tail. Also Events and Modifier do not suite a Lognormal distribution and their values are lower than 0.95. Finally Contract is quite well approximated in the bulk, but not in the tail, confirming once again the power law best fitting results.
 |
 |
 |
 |
 |
 |
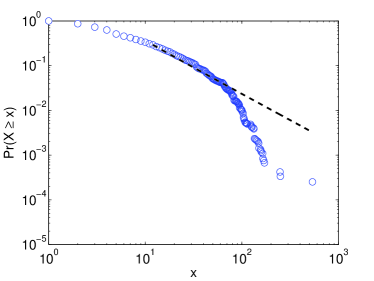
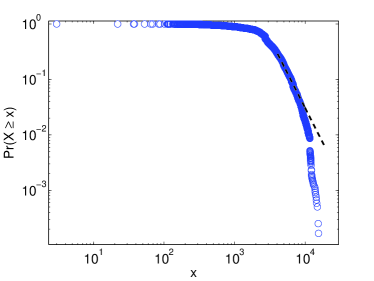
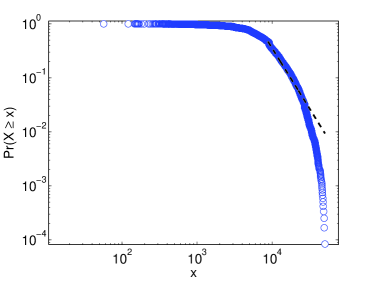
Finally Fig. 10 shows that the initial parts of Bytecode and ABI metrics well overlap with the Lognormal but as soon as the values crosses the central ones observed in the corresponding histograms the Lognormal curves tend to miss the empirical ones which drops quickly and do not display power law in the tail.
Address, Cyclomatic ad Comments rapidly drop with respect to the Lognormal model, even if the initial part presents some overlap with it. Again this may be ascribed to the upper bounds which limit the range of values reachable by these metrics. In particular Comments are less, on average, than in traditional software development. This is maybe due to the fact that Smart Contrac software code is written with specific purpose and contraints, so that the same patterns are most likely found and do not need comment lines.
Finally the LOC metric is quite well represented by the Lognormal distribution both on the bulk and in the tail, and presents an value larger than 0.98. This is quite in agreement with the results found in literature for the LOC metric in traditional software systems [11]. In some sense this result is different from the others since it seems that this metric is not influenced by the peculiarity that can belong to Smart Contract software and tends to preserve the same statistical features found in traditional software systems.
6 Conclusions
In this paper we studied Smart Contracts software metrics extracted from a data set of more than 12000 Smart Contracts deployed on the Ethereum blockchain. We were interested in determining if, given the peculiarity related Smart Contract software development, the corresponding software metrics display differences in their statistical properties with respect to metrics extracted from traditional software systems and already largely studied in literature.
The assumptions are that resources are limited on the blockchain and such limitations may influence the way Smart Contracts are written. Our analisys dealt with source code metrics as well as with ABI and bytecode of Smart Contracts.
Our main results show that, overall, the exposure of Smart Contracts to the interaction with the blockchain as qualitatively measured in terms of ABI size are quite similar to each other and there are not outlyers Contracts. The distribution is compatible with a bell shaped statistical distribution where most of values tend to lie around a central value with some dispersion around it.
In general Smart Contracts metrics tend to suffer from blockchain limited resources constraints, since they tend to assume limited upper values. There is not the ubiquitous presence of fat tail distributions where there are values very far from the mean, even order of magnitude larger, as typical in traditional software. In Smart Contract software metrics large variations from the mean are substantially unknown and all the values are generally inta a range of few standard deviations from the mean.
Fianally the Smart Contract lines of code is the metric which more closely follow the statistical ditribution of the corresponding metric in traditional software system and shows a truncated power law in the tail and an overall distribution which is well explained by a Lognormal distribution.
References
- [1] https://etherscan.io/
- [2] “DEV PLAN,” Ethereum, accessed 2014, https://www.ethereum.org/pdfs/Ethereum- Dev-Plan-preview.pdf.
- [3] Johnston, D. et al. “The General Theory of Decentralized Applications, DApps.” GitHub, June 9, 2014. https://github.com/DavidJohnstonCEO/DecentralizedApplications.
- [4] Bitcoin: A Peer-to-Peer Electronic Cash System. https://bitcoin.org/bitcoin.pdf.
- [5] A Next-Generation Smart Contract and Decentralized Application Platform https://github.com/ethereum/wiki/wiki/White-Paper
- [6] Andersson and P. Runeson. A Replicated Quantitative Analysis of Fault Distributions in Complex Software Systems. IEEE Trans. Software Eng. 33 (2007) 273-286.
- [7] H. Bauke. Parameter estimation for power-law tail distributions by maximum likelihood methods. European Physical Journal B 44 (2007) 167-173.
- [8] https://github.com/ethereum/wiki
- [9] G.J. Baxter and M.R. Frean Software graphs and programmer awareness. arXiv:0802.2306v1 (2008)
- [10] S.R. Chidamber and C.F. Kemerer A metric suite for object-oriented design IEEE Trans. Software Eng., 20 (1994) 476-493.
- [11] G. Concas, M. Marchesi, S. Pinna, and N. Serra. On the suitability of yule process to stochastically model some properties of object-oriented systems. Physica A 370 (2006) 817-831.
- [12] G. Concas, M. Marchesi, S. Pinna, and N. Serra. Power-laws in a large object-oriented software system. IEEE Trans. Software Eng. 33 (2007) 687-708.
- [13] A. de Moura, Y. Lai, and A. Motter. Signatures of small-world and scale-free properties in large computer programs. Physical Review E 68 (2003) 017102.
- [14] N. Fenton and N. Ohlsson. Quantitative Analysis of Faults and Failures in a Complex Software System. IEEE Trans. Software Eng. 26 (2000) 797-814.
- [15] S. Focardi, M. Marchesi, and G. Succi. A stochastic model of software maintenance and its implications on extreme programming processes, In: G. Succi, M. Marchesi (Eds.). Extreme Programming Examined, The XP Series, Addison-Wesley, 2000, pp. 191-206.
- [16] A. Gorshenev and Y. Pis’mak. Punctuated equilibrium in software evolution. Physical Review E 70 (2004).
- [17] M. Ichii, M. Matsushita, K. Inoue. An Exploration of Power-Law in Use-Relation of Java Software Systems. Software Engineering, 2008. ASWEC 2008. 19th Australian Conference on (2008) 422-431.
- [18] C. Kai-Yuan, Y. Bei-Bei. Software execution processes as an evolving complex network. Information Sciences 179 (2009) 1903–1928.
- [19] Louridas, P., Spinellis, D., and Vlachos, V. Power laws in software. ACM Trans. Softw. Engin. Method. 18, 1, Article 2 (September 2008), 26 pages.
- [20] M. Marchesi, S. Pinna, N. Serra, S. Tuveri. Power laws in smalltalk. In: ESUG. Conference 2004 Research Track (2004).
- [21] C. Myers. Software systems as complex networks: structure, function, and evolvability of software collaboration graphs. Physical Review E 68 (2003).
- [22] T.J. Ostrand and E.J. Weyuker. The Distribution of Faults in a Large Industrial Software System. Proc. ACM SIGSOFT Int’l Symp. Software Testing and Analysis (ISSTA ’02), 27, 2002, pp. 55-65.
- [23] T.J. Ostrand, E.J. Weyuker, and R.M. Bell. Predicting the Location and Number of Faults in Large Software Systems. IEEE Trans.Software Eng. 31 (2005) 340-355.
- [24] A Murgia, P Tourani, B Adams, M Ortu Do developers feel emotions? an exploratory analysis of emotions in software artifacts Proceedings of the 11th working conference on mining software repositories
- [25] M Mäntylä, B Adams, G Destefanis, D Graziotin, M Ortu Mining valence, arousal, and dominance: possibilities for detecting burnout and productivity? Proceedings of the 13th International Conference on Mining Software Repositories
- [26] M Ortu, G Destefanis, M Kassab, M Marchesi Measuring and understanding the effectiveness of JIRA developers communities Proceedings of the Sixth International Workshop on Emerging Trends in Software Metrics
- [27] Nick Szabo Formalizing and Securing Relationships on Public Networks First Monday, Volume 2, Number 9 - 1 September 1997
- [28] Raghav Kulkarni, Loi Luu, Jason Teutsch, Prateek Saxena Demystifying Incentives in the Consensus Computer CCS ’15 Proceedings of the 22nd ACM SIGSAC Conference on Computer and Communications Security Pages 706-719
- [29] Thinking about smart contract security, https://blog.ethereum.org/2016/06/19/thinking-smart-contract-Last accessed 2017/01/14
- [30] Making Smart Contracts Smarter Luu Loi, Duc-Hiep Chu, Hrishi Olickel, Prateek Saxena, Aquinas Hobor CCS ’16 Proceedings of the 2016 ACM SIGSAC Conference on Computer and Communications Security Pages 254-269 Vienna, Austria — October 24 - 28, 2016
- [31] … you can win with an unlimited high bid without paying for it (2017), https://www.reddit.com/r/ethereum/comments/5zctus/a nother bug in the ens you can win with an/
- [32] Atzei, N., Bartoletti, M., Cimoli, T.: A survey of attacks on Ethereum smart contracts. Cryptology ePrint Archive, Report 2016/1007 (2016), http://eprint.iacr.org/2016/1007
- [33] Bartoletti M. Pompianu L arXiv:1703.06322v1 [cs.CR] 18 Mar 2017
- [34] A. Potanin, J. Noble, M. Frean, and R. Biddle. Scale-free geometry in object-oriented programs. Communications of the ACM 48 (2005) 99-103.
- [35] T. Tamai and T. Nakatani. Analysis of software evolution processes using statistical distribution models. Proc. of the International Workshop on Principles of Software Evolution, IWPSE ’02, Orlando, Florida, 2002, pp. 120-123.
- [36] S. Valverde, R. Ferrer-Cancho, and R. Solé. Scale-free networks from optimal design. Europhysics Letters 60 (2002) 512-517.
- [37] S. Valverde and R. Solé. Hierarchical small worlds in software architecture. Working Paper 03-07-044, Santa Fe Institute, Santa Fe, NM (2003) .
- [38] R. Wheeldon and S. Counsell. Power law distributions in class relationships. Proc. 3rd IEEE Int. Workshop on Source Code Analysis and Manipulation (SCAM03) (2003) pp. 45-57.
- [39] H. Zhang. On the Distribution of Software Faults. IEEE Trans.on Software Eng. 34 (2008).
- [40] https://solidity.readthedocs.io/
- [41] R. Subramanyam, and M. Krishan Empirical analysis of CK metrics for object-oriented design complexity: Implications for software defects IEEE Trans.Software Eng. 29 (2003) 297-310.
- [42] A. Tosun, B. Turhan and A. Bener. Validation of Network Measures as Indicators of Defective Modules in Software Systems. Proceedings of the 1st International Conference on Predictor Models (PROMISE), 2009.
- [43] S.R. Chidamber and C.F. Kemerer. A metric suite for object-oriented design. IEEE Trans. Software Eng., 20 (1994) 476-493.
- [44] S.R. Chidamber and C.F. Kemerer. A metric suite for object-oriented design. IEEE Trans. Software Eng., 20 (1994) 476-493.
- [45] T Gyimothy, R Ferenc, I Siket Empirical validation of object-oriented metrics on open source software for fault prediction IEEE Transactions on Software Engineering, 2005
- [46] G Concas, M Marchesi, A Murgia, R Tonelli, I Turnu On the distribution of bugs in the eclipse system IEEE Transactions on Software Engineering 37 (6), 872-877
- [47] I Turnu, G Concas, M Marchesi, S Pinna, R Tonelli A modified Yule process to model the evolution of some object-oriented system properties Information Sciences 181 (4), 883-902
- [48] V.R. Basili, L.C. Briand, and W.L. Melo, A Validation of Object Oriented Design Metrics as Quality Indicators. IEEE Transactions on Software Engineering, vol. 22(10), pp.267- 271, 1996.
- [49] T. McCabe A Complexity Measure. IEEE Transactions on Software Engineering, Vol.2, No.4, 308-320. 1976
- [50] S Porru, A Pinna, M Marchesi, R Tonelli Blockchain-oriented software engineering: challenges and new directions Proceedings of the 39th International Conference on Software Engineering
- [51] M Swan Blockchain: Blueprint for a new economy O’Reilly Media, Inc.
- [52] T. Zimmermann and N. Nagappan. Predicting defects using network analysis on dependency graphs. Proceedings of the 30th international conference on Software engineering, May 10-18, 2008, Leipzig, Germany.
- [53] G. Concas, M. Marchesi, A. Murgia, S. Pinna, and R. Tonelli Assessing Traditional and New Metrics for Object-Oriented Systems. In Proc. Workshop on Emerging Trends in Software Metrics - WETSoM, ICSE 2010, 4 May 2010, Capetown (SA) (2010).
- [54] M. Newman. Power laws, pareto distributions and zipf’s law. Contemporary Physics 46 (2005) 323-351.
- [55] L. Hatton, “Power-law distributions of component size in general software systems”. IEEE Transactions on Software Engineering, 35(4) IEEE, July, pp. 566-572 (2009).
- [56] G. U. Yule, “A mathematical theory of evolution based on the conclusions of dr. J. C. Willis” Philos. Trans. R. Soc. London B 213 (1925) 21-87.
- [57] H. Zhang and H. B. K. Tan, “An Empirical Study of Class Sizes for Large Java Systems”, Proc. of 14th Asia-Pacific Software Engineering Conference (APSEC 2007), Nagoya, Japan, December 2007. IEEE Press, pp. 230-237.
- [58] S.R. Chidamber and C.F. Kemerer Towards a Metrics Suite for Object Oriented Design Proc. Conf. Object Oriented Programming Systems, Languages, and Applications (OOPSLA 91), vol. 26, no. 11, pp. 197-211, 1991.
- [59] F. Brito e Abreu The MOOD Metrics Set In Proc. ECOOP’95 Workshop on Metrics (1995)
- [60] A. Clauset, C. R. Shalizi and M. Newman. Power-Law Distributions in Empirical Data SIAM Review, v.51 n.4, p.661-703, November 2009
- [61] G. Baxter, M. Frean, J. Noble, M. Rickerby, H. Smith, M. Visser, H. Melton, and E. Tempero Understanding the shape of Java software. In Proc. of the 21st ACM SIGPLAN conference Object-oriented programming languages, systems, and applications(OOPSLA), Oct. 2006, Portland, USA.
- [62] Giulio Concas, Giuseppe Destefanis, Michele Marchesi, Marco Ortu, and Roberto Tonelli. Micro patterns in agile software. In International Conference on Agile Software Development, pages 210–222. Springer, Berlin, Heidelberg, 2013.
- [63] Giuseppe Destefanis, Marco Ortu, Steve Counsell, Stephen Swift, Roberto Tonelli, and Michele Marchesi. On the randomness and seasonality of affective metrics for software development. In Proceedings of the Symposium on Applied Computing, pages 1266–1271. ACM, 2017.
- [64] Giuseppe Destefanis, Marco Ortu, Simone Porru, Stephen Swift, and Michele Marchesi. A statistical comparison of java and python software metric properties. In Proceedings of the 7th International Workshop on Emerging Trends in Software Metrics, pages 22–28. ACM, 2016.
- [65] Giuseppe Destefanis, Roberto Tonelli, Ewan Tempero, Giulio Concas, and Michele Marchesi. Micro pattern fault-proneness. In Software engineering and advanced applications (SEAA), 2012 38th EUROMICRO conference on, pages 302–306. IEEE, 2012.
- [66] Alessandro Murgia, Giulio Concas, Roberto Tonelli, Marco Ortu, Serge Demeyer, and Michele Marchesi. On the influence of maintenance activity types on the issue resolution time. In Proceedings of the 10th international conference on predictive models in software engineering, pages 12–21. ACM, 2014.
- [67] Alessandro Murgia, Marco Ortu, Parastou Tourani, Bram Adams, and Serge Demeyer. An exploratory qualitative and quantitative analysis of emotions in issue report comments of open source systems. Empirical Software Engineering, pages 1–44, 2017.
- [68] M Ortu, G Destefanis, S Counsell, S Swift, R Tonelli, and M Marchesi. Arsonists or firefighters? affectiveness in agile software development. 2016.
- [69] Marco Ortu. Mining software repositories: measuring effectiveness and affectiveness in software systems. PhD thesis, Universita’degli Studi di Cagliari, 2015.
- [70] Marco Ortu, Giuseppe Destefanis, Bram Adams, Alessandro Murgia, Michele Marchesi, and Roberto Tonelli. The jira repository dataset: Understanding social aspects of software development. In Proceedings of the 11th international conference on predictive models and data analytics in software engineering, page 1. ACM, 2015.
- [71] Marco Ortu, Giuseppe Destefanis, Steve Counsell, Michele Marchesi, and Roberto Tonelli. Connecting the dots: measuring effectiveness and affectiveness in software systems. In Emotion Awareness in Software Engineering (SEmotion), 2017 IEEE/ACM 2nd International Workshop on, pages 52–53. IEEE, 2017.
- [72] Marco Ortu, Giuseppe Destefanis, Steve Counsell, Stephen Swift, Michele Marchesi, and Roberto Tonelli. How diverse is your team? investigating gender and nationality diversity in github teams. Peerj Preprints, 2016.
- [73] Marco Ortu, Giuseppe Destefanis, Steve Counsell, Stephen Swift, Roberto Tonelli, and Michele Marchesi. How diverse is your team? investigating gender and nationality diversity in github teams. Journal of Software Engineering Research and Development, 5(1):9, 2017.
- [74] Destefanis, Giuseppe and Ortu, Marco and Counsell, Steve and Swift, Stephen and Marchesi, Michele and Tonelli, Roberto Software development: do good manners matter? PeerJ Computer Science, volume 2 page e73, 2016.
- [75] Marco Ortu, Giuseppe Destefanis, Matteo Orru, Roberto Tonelli, and Michele L Marchesi. Could micro patterns be used as software stability indicator? In Patterns Promotion and Anti-patterns Prevention (PPAP), 2015 IEEE 2nd Workshop on, pages 11–12. IEEE, 2015.
- [76] Marco Ortu, Alessandro Murgia, Giuseppe Destefanis, Parastou Tourani, Roberto Tonelli, Michele Marchesi, and Bram Adams. The emotional side of software developers in jira. In Mining Software Repositories (MSR), 2016 IEEE/ACM 13th Working Conference on, pages 480–483. IEEE, 2016.