Plasma evolution within an erupting coronal cavity
Abstract
Coronal cavities have previously been observed associated with long-lived quiescent filaments and are thought to correspond to the associated magnetic flux rope. Although the standard flare model predicts a coronal cavity corresponding to the erupting flux rope, these have only been observed using broadband imaging data, restricting analysis to the plane-of-sky. We present a unique set of spectroscopic observations of an active region filament seen erupting at the solar limb in the extreme ultraviolet (EUV). The cavity erupted and expanded rapidly, with the change in rise phase contemporaneous with an increase in non-thermal electron energy flux of the associated flare. Hot and cool filamentary material was observed to rise with the erupting flux rope, disappearing suddenly as the cavity appeared. Although strongly blue-shifted plasma continued to be observed flowing from the apex of the erupting flux rope, this outflow soon ceased. These results indicate that the sudden injection of energy from the flare beneath forced the rapid eruption and expansion of the flux rope, driving strong plasma flows which resulted in the eruption of an under-dense filamentary flux rope.
1 Introduction
Solar eruptions are the most energetic and spectacular events that occur in the solar system. However, the processes leading to their initiation and how they subsequently evolve remain areas of interest to the solar physics community. The currently accepted model of a solar eruption (commonly called the ‘standard flare model’) was originally proposed by Carmichael (1964); Sturrock (1966); Hirayama (1974) and Kopp & Pneuman (1976). This model describes a solar flare as a brightening driven by magnetic reconnection of coronal loops during the eruption of a magnetic flux rope which is subsequently observed in the corona as a coronal mass ejection (CME). While this model has begun to be supplanted by more physically realistic, 3-dimensional interpretations (e.g. Janvier et al., 2014), the basic configuration remains the same. The origin of erupting magnetic flux ropes also continues to be a source of investigation, with a debate as whether they are pre-existing magnetic structures or are formed “on-the-fly” during an eruption (see, e.g. the papers by Forbes, 2000; Chen, 2011; Patsourakos et al., 2013).
As magnetic structures in the solar corona, flux ropes are difficult to observe directly. Their involvement in eruptions is typically inferred by either extrapolating the pre-eruption photospheric magnetic field or via direct measurement of the magnetic field of the associated CME in-situ following eruption. However, the existence of a pre-eruptive flux rope configuration can also be inferred through the observations of dark cavities in white light, extreme ultraviolet (EUV) and X-ray observations when located at or near the solar limb (cf. Gibson et al., 2006; Habbal et al., 2010; Kucera et al., 2012; Reeves et al., 2012; Karna et al., 2015). These cavities are generally associated with quiescent prominences at the limb, leading to the conclusion that the cavity is a magnetic flux rope supporting cool filamentary material in the lower apex (cf. Régnier et al., 2011; Berger et al., 2012; Forland et al., 2013). Although long-lived, these cavity structures can ultimately become unstable and erupt, producing CMEs observable in white-light coronagraph data (e.g. Sterling & Moore, 2004; Gibson et al., 2006).
While numerous observations exist of coronal cavities associated with quiescent filaments, coronal cavities associated with eruptive events are much rarer (although some observations have been presented by, e.g. Kleint et al., 2015; McCauley et al., 2015). Limb observations of eruptive events, particularly using emission measure analysis techniques, have revealed magnetic flux ropes with a hot, bright sheath surrounding a cool, dark cavity which contains a hot, bright core (cf. Hannah & Kontar, 2013; Kumar & Cho, 2014; Lee et al., 2017). These observations have also been used to try and probe the characteristics of the erupting plasma, allowing the density and plane-of-sky velocity of the plasma to be estimated. Hannah & Kontar (2013) also found that the kinetic energy of the core and current sheet continued to grow during the eruption, indicating that there was a continuous input of energy. However, spectroscopic observations of erupting coronal cavities, which provide valuable information on how the plasma contained within these cavities is moving in 3-dimensions, remain frustratingly rare. This is primarily due to the very small field-of-view of the available instruments and the long time-scales required to obtain the observations, both of which require precise advance knowledge of the location of the eruption.
In this paper, we report on a unique set of spectroscopic observations of a large eruptive event with an associated coronal cavity across a broad temperature range. This is the first time that such a cavity eruption has been observed spectroscopically erupting from an active region, with the observations providing a unique physical insight into this phenomenon.
2 Observations and Data Analysis
The event studied here erupted from the west limb of the Sun on 2017 September 10 and was associated with a GOES X8.2 class flare which began at 15:35 UT and peaked at 16:06 UT. The eruption came from NOAA active region AR 12673, and was one of a series of major flares produced by the active region following emergence. The evolution of the active region and the eruption discussed here were well observed by the Atmospheric Imaging Assembly (AIA; Lemen et al., 2012) onboard the Solar Dynamics Observatory (SDO; Pesnell et al., 2012) spacecraft. However, AR 12673 was a highly energetic active region and as a result was also well observed by multiple space-based and ground-based instruments as it evolved and transited the solar limb.
Following a series of major flares, the active region became the focus of a major flare watch campaign, with regular observations from the Extreme ultraviolet Imaging Spectrometer (EIS; Culhane et al., 2007) onboard the Hinode spacecraft (Kosugi et al., 2007). The primary observing plan involved a scanning raster campaign designed to study post-eruption supra-arcade plasma (Hinode Observing Plan 244). This campaign, which used EIS study FlareResponse01, rastered the 2″ slit from right to left across a field of view of , observing a range of emission lines from He \@slowromancapii@ (at log T=4.7) to Fe \@slowromancapxxiv@ (at log T=7.2). As the active region transited the west limb, the campaign was designed to begin off-limb and raster towards the solar disk, taking 8 minutes 52 seconds to complete each raster. As a result, the erupting cavity described here was only observed by the rasters which began at 15:42:26 UT and 15:51:18 UT respectively, with both rasters used in this analysis. Before analysis, the EIS data in each case were first aligned to the SDO/AIA field-of-view to allow a direct comparison between the data-sets used.
These narrowband spectroscopic observations from Hinode/EIS were complemented using the broadband full-Sun observations from SDO/AIA. This allowed the erupting feature to be tracked at high cadence using multiple passbands at multiple temperatures, with the 131 Å, 171 Å, 193 Å and 211 Å passbands providing the clearest observations of the erupting cavity feature. The data were processed using the standard aia_prep.pro routine in SolarSoftWare, with the data also deconvolved with the relevant point spread functions using the aia_deconvolve_richardsonlucy.pro routine for the differential emission measure analysis outlined in Section 4.
3 Results
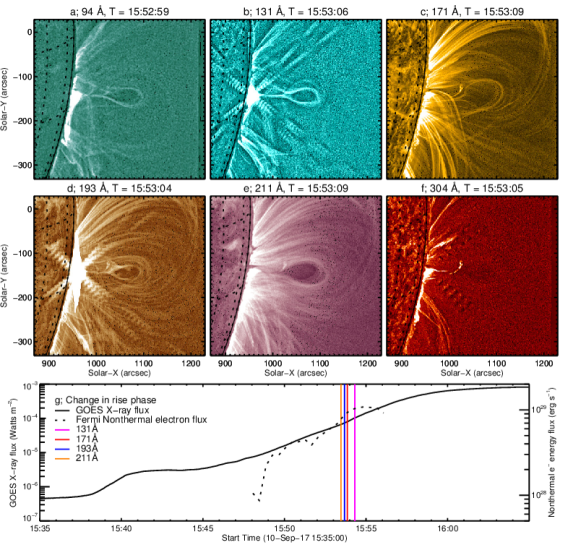
A snapshot of the erupting cavity as observed by the six EUV passbands onboard SDO/AIA at T15:53:06 UT is shown in Figure 1. It is clear (particularly from the 94 Å, 131 Å, 171 Å, 193 Å and 211 Å passbands in panels a–e respectively) that the eruption appears to be a textbook example of the “standard flare model”, with a thin bright feature (consistent with a current sheet) connecting the bright flare loops below to the dim cavity above. Note that these images have been processed using the Multiscale Gaussian Normalisation (MGN) technique of Morgan & Druckmüller (2014) to highlight the fine structure of the erupting cavity and the associated current sheet. Although both features were observed by Hinode/EIS, only the cavity is discussed here, with the evolution of the current sheet discussed by Warren et al. (2017). While the cavity is less clear in the 304 Å passband image shown in panel f, a thin bright curved structure corresponding to the filamentary plasma is visible at the lower apex of the teardrop-shaped cavity. The evolution of this material is clear in the movie attached to Figure 1; as the cavity forms and rises, bright material can be seen rising with it at the lower apex of the teardrop. This material then disappears in all passbands almost simultaneously at 15:51:30 UT.
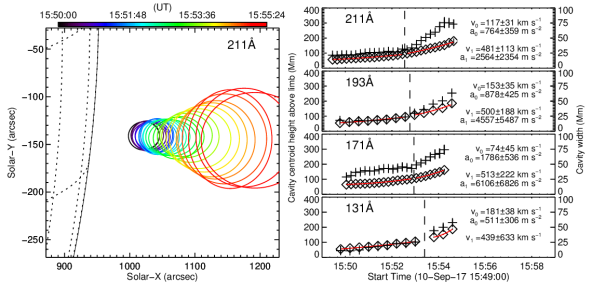
The temporal evolution of the cavity was tracked using the 131 Å, 171 Å, 193 Å and 211 Å passbands by fitting an ellipse to the bright edge of the cavity at each time step in each passband. Although this is shown in Figure 2a solely for the 211 Å passband, the evolution of the cavity was comparable in each passband studied. In each case the data were processed using the MGN technique, with the edge of the cavity then manually identified and fitted using a ellipse. The temporal evolution of both the centroid (denoted by the diamonds) and width (denoted by the cross) of the fitted ellipses are shown in the right column of Figure 2 for each passband. A similar evolution was observed in each passband, with the cavity found to exhibit two distinct rise phases, particularly when considering the evolution of cavity width. The vertical dashed lines in each of the panels on the right-hand column of Figure 2 indicate the point at which the change in rise phase occurs in each passband. The data were best fitted using two independent quadratic functions, with the resulting fit parameters given in the right-hand side of each panel. These measurements indicate that the cavity initially rose slowly then more rapidly; an observation consistent with previous analyses of the initial stages of solar eruptive events (cf. Régnier et al., 2011; Byrne et al., 2014).
The points at which the rise phase changed in each passband are also shown in panel g of Figure 1, which shows the evolution of the soft X-ray flux from the GOES spacecraft and the non-thermal electron energy flux derived from the Fermi large-area telescope (LAT; Atwood et al., 2009). Although the flare was seen by all of the Fermi/LAT detectors as a result of its whole Sun field-of-view, only the NAL04 detector was used here as it showed the least saturation at the lower energies. The Fermi spectra were accumulated over 24 s (since NAL04 was not the most sunward facing detector) and fitted with a combination of a thermal + thick target function over the energy range 10–100 kev. The nonthermal energy was then calculated at that cadence. It is clear from both Figure 1g and the right-hand column of Figure 2 that the increased upward acceleration of the cavity occurred during the rise phase of the X-ray flare and as the nonthermal electron energy flux measured by Fermi approached its peak. This indicates that the upwards acceleration of the cavity was driven by the erupting flare below (consistent with the “standard” flare model) and suggests that the observed cavity was an erupting flux rope.
Although the cavity was best observed using the images from SDO/AIA, it was first observed by Hinode/EIS. Due to its west-to-east rastering approach, EIS first observed the cavity between 15:48:00 and 15:49:20 UT (i.e. during the raster which began at 15:42 UT) as it was first developing, and again at 15:53:20-15:54:40 UT as it erupted (during the raster which began at 15:51 UT). The cavity is most clearly seen in the Fe \@slowromancapxv@ emission line shown in Figure 3 for the raster beginning at 15:42 UT and the Fe \@slowromancapxxiv@ emission line shown in Figure 4 for the raster beginning at 15:51 UT. By comparison, SDO/AIA first observed the cavity at 15:50:00 UT (see Figure 2). Although the emission lines observed by EIS are also observed by SDO/AIA (cf. O’Dwyer et al., 2010), we believe that the SDO/AIA observations of the cavity were masked by the broadband nature of the passbands, with the result that it was not observed until the drop in intensity was sufficiently strong across the wavelength range of the given passband.
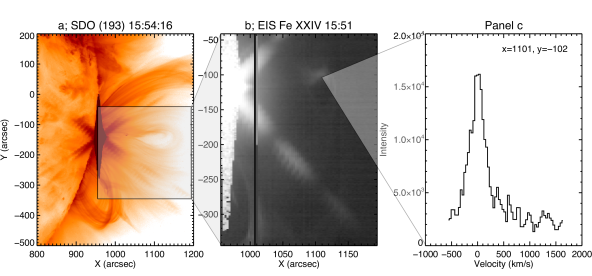
While no clear filamentary material can be observed in the Fe \@slowromancapxv@ image at 15:42 UT shown in panel b of Figure 3, strongly blue-shifted emission was observed in the region enclosed by the blue contours, corresponding to the bright filament emission observed in He \@slowromancapii@ shown in Figure 3c. The line spectra observed were incredibly complex, with an example of the blue-shifted emission shown in Figure 3d. While the Fe \@slowromancapxv@ emission line is the dominant emission line in this portion of the spectrum under normal circumstances, the anomalous nature of the line spectrum shown in panel d may suggest that this is not the case here. Other nearby lines which could be contributing include the nearby Al \@slowromancapix@ emission line at 284.03 Å corresponding to a log T=6.1, and a Fe \@slowromancapxvii@ emission line at 283.9 Å corresponding to a log T=6.9 (cf. Brown et al., 2008; Landi et al., 2013). However, a comparable blue-shift to that seen in the Fe \@slowromancapxv@ emission line was also observed in the Fe \@slowromancapxvi@ emission line, indicating that the blue-shift is indeed due to plasma motion rather than a contribution from the nearby Al \@slowromancapix@ and Fe \@slowromancapxvii@ emission lines.
As noted above (and seen in the online movie associated with Figure 1), the filamentary material associated with the erupting cavity can be observed rising at the lower apex of the teardrop-shaped cavity in each SDO/AIA passband. It was also clearly observed in the EIS He \@slowromancapii@ data as a bright, very strongly blue-shifted blob (see Figure 3c and the spectrum in panel e). In fact, the spectra in Figure 3d show that some of the spectra were nearly blue-shifted out of the spectral window, suggesting Doppler velocities greater than 200 km s-1 (consistent with the velocity of 214 km s-1 shown by the blue contours in panels b and c). As a cross-section of the cavity is observed here, this indicates that as the cavity expands and erupts, the plasma contained within it is flowing rapidly towards the observer, and most likely draining down the legs of the flux rope defined by the cavity. There is also some diffuse Fe \@slowromancapxxiv@ emission around and across the cavity, consistent with hot, low density plasma in the core of the cavity.
The subsequent EIS raster began at 15:51:18 UT, with the corresponding Fe \@slowromancapxv@ image shown in Figure 4b. At this time the cavity was observable in all AIA passbands, indicating a significant drop in density and/or temperature compared to the observations at the time of the earlier EIS raster shown in Figure 3. Although the intensity of the Fe \@slowromancapxv@ emission line had dropped too much by this time to provide any usable observations, the Fe \@slowromancapxxiv@ emission line (at Log T=7.1) shows a bright edge around the cavity (shown in Figure 4b). However the corresponding spectra show that the strong plasma flow had mainly stopped by this time, with the spectra shown in Figure 4c showing a plasma velocity peaking at 0 km s-1, with some slight broadening of the profile. This indicates that while the significant downward plasma flow associated with the eruption of the flux rope had mostly ceased by this time, there continued to be some draining of hot material from the cavity.
4 Differential Emission Measure Analysis
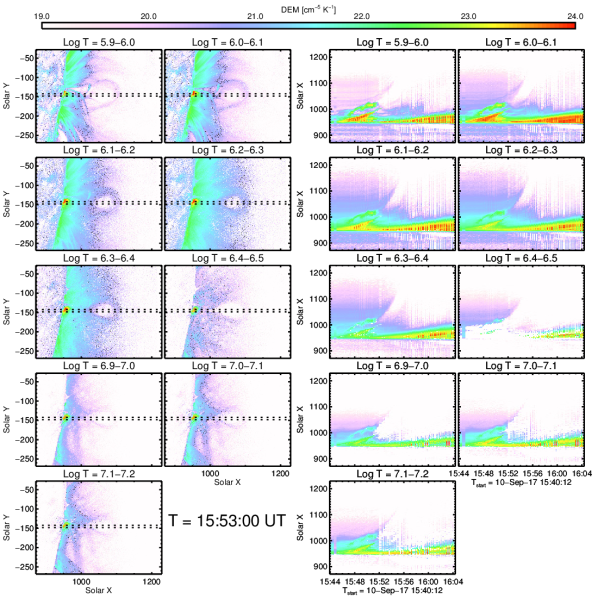
While Hinode/EIS gives a unique insight into the evolution and properties of the plasma during the eruption of the cavity, the very low temporal resolution complicates a complete analysis. The high temporal and spatial resolution data provided by SDO/AIA was therefore processed using the regularised inversion technique of Hannah & Kontar (2013) to determine the differential emission measure (DEM) of the plasma within and surrounding the erupting cavity. This offers a complementary dataset which can be used to explore the properties and behaviour of the plasma at a much higher cadence. Although the Hannah & Kontar technique was used to produce a DEM with 20 temperature bins of width Log T=0.1 from Log T=5.7–7.7, the cavity was best observed using the temperature bins from Log T=5.9–6.5 and Log T=6.9–7.2 (shown in the left two columns of Figure 5). The clear observations of the erupting cavity in the range Log T=5.9–6.5 match the cavity seen in the Fe \@slowromancapxv@ emission line in Figure 3, while the edge of the cavity observed at Log T=6.9–7.2 is consistent with the hot diffuse emission around the cavity observed in the Fe \@slowromancapxxiv@ emission line at Log T=7.1.
To investigate the temporal evolution of the filament plasma and the erupting cavity, a cut was taken along the black dashed line shown in each panel of the left two columns of Figure 5 and used to produce stack plots showing the temporal variation in DEM shown in the right two columns of Figure 5. These stack plots show the gradual increase in the height of the filamentary material before it suddenly disappears in all temperature bins at 15:50:00 UT. At this point a cavity appears in most of the temperature bins before rising out of the field of view by 15:58:00 UT (consistent with the cavity evolution shown in the left-hand panel of Figure 2). These stack plots of differential emission measure also indicate that both the disappearing filamentary material and the surrounding envelope had a combination of cool and hot components.
5 Discussion and Conclusions
The combination of spectroscopic EIS and broadband AIA observations presented here describe the very fast eruption of a coronal cavity with a mixed temperature outer sheath and containing a combination of hot and cool plasma that exhibited very strong blue-shifts. This is a unique set of observations and as such requires some examination to determine the physical processes at work.
The temporal evolution of the coronal cavity obtained using the images from SDO/AIA indicates that the cavity initially began to rise slowly (with a velocity v74–181 km s-1). However, it then began to rise much more rapidly (at a velocity of v439–513 km s-1), with the Fermi non-thermal electron energy flux indicating that this was driven by continuous energy input from the flare below. The strongly blue-shifted plasma observed by Hinode/EIS suggests that the rapid increase in height of the flux rope driven by the flare forced the plasma from the apex of the flux rope towards the legs, decreasing the density at the apex of the flux rope. As the flux rope initially rose gradually, this drop in plasma density would have been matched by a rise in plasma temperature, giving the observed combination of hot and cool plasma in the core of the flux rope. However, the subsequent rapid rise of the flux rope and drop in its density also forced the expansion of the flux rope volume, producing the sudden appearance of the cavity in all wavelengths. As the cavity erupted and increased in height, the drop in pressure would have stopped the flow of plasma towards the legs of the flux rope, consistent with the lack of any clear Doppler motion in the Fe \@slowromancapxxv@ emission line.
While the sudden off-loading of material from an erupting filament or flux rope has been previously observed (e.g. Jenkins et al., 2017), this is the first time it has been observed spectroscopically for an eruption associated with an active region. These observations indicate that the eruption of the cavity was initially driven by the impulsive phase of the solar flare, with the increases in non-thermal electron energy matching the changing rise phase of the cavity. This rapid injection of a significant amount of energy forced a dramatic downflow of plasma from the apex of the erupting flux rope and meant that the erupting flux rope was much less dense and exhibited a different structure to other flux rope observations (cf. Hannah & Kontar, 2013). These observations are consistent with the “standard flare model”, and highlight the vital insight provided by spectrometers such as Hinode/EIS.
References
- Atwood et al. (2009) Atwood, W. B., Abdo, A. A., Ackermann, M., et al. 2009, ApJ, 697, 1071
- Berger et al. (2012) Berger, T. E., Liu, W., & Low, B. C. 2012, ApJ, 758, L37
- Brown et al. (2008) Brown, C. M., Feldman, U., Seely, J. F., Korendyke, C. M., & Hara, H. 2008, ApJS, 176, 511-535
- Byrne et al. (2014) Byrne, J. P., Morgan, H., Seaton, D. B., Bain, H. M., & Habbal, S. R. 2014, Sol. Phys., 289, 4545
- Carmichael (1964) Carmichael, H. 1964, NASA Special Publication, 50, 451
- Chen (2011) Chen, P. F. 2011, Living Reviews in Solar Physics, 8, 1
- Culhane et al. (2007) Culhane, J. L., Harra, L. K., James, A. M., et al. 2007, Sol. Phys., 243, 19
- Forbes (2000) Forbes, T. G. 2000, J. Geophys. Res., 105, 23153
- Forland et al. (2013) Forland, B. C., Gibson, S. E., Dove, J. B., Rachmeler, L. A., & Fan, Y. 2013, Sol. Phys., 288, 603
- Habbal et al. (2010) Habbal, S. R., Druckmüller, M., Morgan, H., et al. 2010, ApJ, 719, 1362
- Hannah & Kontar (2013) Hannah, I. G., & Kontar, E. P. 2013, A&A, 553, A10
- Hirayama (1974) Hirayama, T. 1974, Sol. Phys., 34, 323
- Gibson et al. (2006) Gibson, S. E., Foster, D., Burkepile, J., de Toma, G., & Stanger, A. 2006, ApJ, 641, 590
- Janvier et al. (2014) Janvier, M., Aulanier, G., Bommier, V., et al. 2014, ApJ, 788, 60
- Jenkins et al. (2017) Jenkins, J., Long, D. M, van Driel-Gesztelyi, L., Carlyle, J. 2017, arXiv:1711.02565
- Karna et al. (2015) Karna, N., Pesnell, W. D., & Zhang, J. 2015, ApJ, 810, 123
- Kleint et al. (2015) Kleint, L., Battaglia, M., Reardon, K., et al. 2015, ApJ, 806, 9
- Kopp & Pneuman (1976) Kopp, R. A., & Pneuman, G. W. 1976, Sol. Phys., 50, 85
- Kosugi et al. (2007) Kosugi, T., Matsuzaki, K., Sakao, T., et al. 2007, Sol. Phys., 243, 3
- Kucera et al. (2012) Kucera, T. A., Gibson, S. E., Schmit, D. J., Landi, E., & Tripathi, D. 2012, ApJ, 757, 73
- Kumar & Cho (2014) Kumar, P., & Cho, K.-S. 2014, A&A, 572, A83
- Landi et al. (2013) Landi, E., Young, P. R., Dere, K. P., Del Zanna, G., & Mason, H. E. 2013, ApJ, 763, 86
- Lee et al. (2017) Lee, J.-Y., Raymond, J. C., Reeves, K. K., Moon, Y.-J., & Kim, K.-S. 2017, ApJ, 844, 3
- Lemen et al. (2012) Lemen, J. R., Title, A. M., Akin, D. J., et al. 2012, Sol. Phys., 275, 17
- McCauley et al. (2015) McCauley, P. I., Su, Y. N., Schanche, N., et al. 2015, Sol. Phys., 290, 1703
- Morgan & Druckmüller (2014) Morgan, H., & Druckmüller, M. 2014, Sol. Phys., 289, 2945
- O’Dwyer et al. (2010) O’Dwyer, B., Del Zanna, G., Mason, H. E., Weber, M. A., & Tripathi, D. 2010, A&A, 521, A21
- Patsourakos et al. (2013) Patsourakos, S., Vourlidas, A., & Stenborg, G. 2013, ApJ, 764, 125
- Pesnell et al. (2012) Pesnell, W. D., Thompson, B. J., & Chamberlin, P. C. 2012, Sol. Phys., 275, 3
- Reeves et al. (2012) Reeves, K. K., Gibson, S. E., Kucera, T. A., Hudson, H. S., & Kano, R. 2012, ApJ, 746, 146
- Régnier et al. (2011) Régnier, S., Walsh, R. W., & Alexander, C. E. 2011, A&A, 533, L1
- Sterling & Moore (2004) Sterling, A. C., & Moore, R. L. 2004, ApJ, 613, 1221
- Sturrock (1966) Sturrock, P. A. 1966, Nature, 211
- Vourlidas et al. (2013) Vourlidas, A., Lynch, B. J., Howard, R. A., & Li, Y. 2013, Sol. Phys., 284, 179
- Warren et al. (2017) Warren, H. P., Brooks, D. H., Ugarte-Urra, I., et al. 2017, arXiv:1711.10826