Chemical analysis of three barium stars: HD 51959, HD 88035, HD 121447
Chemical analysis of three barium stars: HD 51959, HD 88035, HD 121447
Abstract
We present elemental abundance results from high resolution spectral analysis of three nitrogen-enhanced barium stars. The analysis is based on spectra obtained with the FEROS attached to 1.52m telescope at ESO, Chile. The spectral resolution is R48000 and the spectral coverage spans from 3500-9000Å . For the objects HD51959 and HD88035, we present the first time abundance analyses results. Although a few studies are available in literature on the object HD121447, the results are significantly different from each other. We have therefore carried out a detailed chemical composition study for this object based on a high resolution spectrum with high S/N ratio, for a better understanding of the origin of the abundance patterns observed in this star. Stellar atmospheric parameters, the effective temperature, surface gravity, microturbulence and metallicity of the stars are determined from the LTE analysis using model atmospheres. The metallicity of HD51959 and HD88035 are found to be near-solar; they exhibit enhanced abundances of neutron-capture elements. HD121447 is found to be moderately metal-poor with [Fe/H]=0.65. While carbon is near-solar in the other two objects, HD121447 shows carbon enhancement at a level, [C/Fe]=0.82. Neutron-capture elements are highly enhanced with [X/Fe]2 (X: Ba, La, Pr, Nd, Sm) in this object. The - and iron-peak elements show abundances very similar to field giants with the same metallicity. From kinematic analysis all the three objects are found to be members of thin disk population with a high probability of 0.99, 0.99 and 0.92 for HD51959, HD88035 and HD121447 respectively.
keywords:
stars: Abundances - stars: Carbon - stars: Late-type - stars: Population II.1 Introduction
The chemically peculiar stars such as CH stars and barium stars that exhibit enhancement of slow neutron-capture elements in their surface chemical composition can provide observational constraints for models of neutron-capture nucleosynthesis that occur during the AGB phase of evolution of low and intermediate mass stars. Both the CH stars and barium stars are known to be binary systems (McClure 1983, 1984) with a now invisible white dwarf companion. The companions produced the neutron-capture elements during their AGB phase of evolution and transferred these materials to the CH and barium stars through mass transfer mechanisms while evolving through the AGB phase. The mass transfer mechanisms are however not clearly understood. Although CH stars and barium stars show enhancement of slow neutron-capture elements and very similar in this respect, there are a few properties that make them distinct from each other. From kinematics, barium stars are known to be disk objects while CH stars belong to the halo of our Galaxy (Gomez et al. 1997, Mennessier et al. 1997). CH stars have high radial velocities and also they are metal-deficient (Hartwick and Cowley 1985). Also barium stars have longer orbital period and greater eccentricities compared to the CH stars (Vanture 1992a, Jorissen et al. 2016). Another distinguishing feature is the C/O ratio which is less than unity in case of barium stars (Barbuy et al. 1992, Allen and Barbuy 2006, Drake and Pereira 2008, Pereira and Drake 2009) and greater than unity in case of CH stars (Vanture 1992b, Pereira and Drake 2009). Luck and Bond (1991) analyzed a few barium stars that show strong CH band but weak C2 band and weak metallic lines. With the absence of strong C2 band in their spectra as they can not be placed in the group of CH stars, the authors categorized them as ‘metal-deficient-barium stars’, and referred them as population II analogs of classical barium stars. This thin line of difference raises questions concerning the evolutionary connection, and the exact relationship between ‘metal-deficient barium stars’ and the CH stars.
The three chemically peculiar stars that are the subject of this present study are listed in the CH star catalogue of Bartkevicius (1996). However, as can be seen later our abundance analysis results indicate these objects to be more likely barium stars. So far, no previous studies on chemical composition of the stars HD 51959 and HD 88035 exist in literature. In section 2, we describe the source of the spectra of the programme stars and in section 3 we provide photometric temperatures of the stars. In section 4, we discuss abundance analysis and present the abundance results. In section 5 we have discussed briefly the kinematic analysis of the stars. Some discussions and conclusions are presented in section 6.
2 High resolution spectra of the programme stars
High resolution spectra for the programme stars are obtained from the FEROS (Fiber-fed Extended Range Optical Spectrograph) connected to the 1.52 m telescope at ESO, Chile. It covers the complete optical spectral range from 3500 - 9000 Å in a single exposure. The spectral resolution is R = 48000. FEROS is equipped with a 2K x 4K, 15m pixel CCD. An image slicer (Kaufer 1998) is used to achieve the high spectral resolution. The basic data for the programme stars are listed in Table 1. A few sample spectra of the programme stars are shown in figure 1.

Table 1: Basic data for the programme stars
Star Name.
RA(2000)
DEC(2000)
(mas)
BC
B
V
J
H
K
Date of obs
HD 51959
06 59 10.09
-07 06 31.95
8.05 [1.04]
0.25
10.05
8.92
7.18
6.74
6.55
11-11-1999
HD 88035
10 08 41.97
-20 18 49.64
2.78 [0.219]
0.18
10.24
9.14
7.39
6.89
6.77
07-01-2000
HD 121447
13 55 46.96
-18 14 56.48
2.93 [0.80]
0.49
9.61
7.80
5.12
4.33
4.15
07-01-2000
The numbers within square brackets indicate errors in .
Table 2: Temperatures from photometry
Star Name
Spectroscopic
(-0.05)
(-0.5)
(-0.05)
(-0.5)
(-1.0)
(-1.0)
(-0.05)
(-0.5)
(-1.0)
estimates
(J-K) K
(J-H) K
(J-H) K
(V-K) K
(V-K) K
(J-H) K
(V-K) K
(B-V) K
(B-V) K
(B-V) K
K
HD 51959
4564
4925
4968
4721
4720
4994
4714
4551
4467
4403
5020
HD 88035
4616
4673
4711
4726
4725
4732
4719
4604
4515
4446
5300
HD 121447
3784
3775
3796
3905
3903
3806
3888
3616
3604
3607
4500
The numbers in the paranthesis indicate the metallicity values at which the
temperatures are calculated.
3 Temperatures from photometric data
The photometric temperatures of the programme stars are calculated as described in Mahanta et al. (2016) by using the calibration equations for giants offered by Alonso et al. (1999, 2001). The temperature estimates span a wide range. The photometric temperatures are used as initial values in an iterative process to obtain the spectroscopic temperature estimates. While the spectroscopic temperature estimate for HD 51959 matches closely with the temperature estimate from (J-H) colour calibration, the spectroscopic temperatures are much higher than those obtained from (J-H) and (J-K) calibrations in the case of other two objects. We note however that (J-H) and (J-K) calibrations give similar results in general as in the case of HD 88035 and HD 121447 but these two temperature estimates differ by about 400 K in case of HD 51959. The reason for such a large difference is difficult to understand if the 2MASS J, H, K values for this object are considered to be as accurate as for the other two stars. As strong CH molecular absorption affects the B band, we have not considered the empirical Teff scale for the B-V colour. The JHK photometric temperature estimates were made to have a first hand temperature estimate for the stars. For our analysis we relied on spectroscopic temperature estimates derived using large numbers of clean Fe I and Fe II lines. The estimated values along with the spectroscopic temperatures are listed in Table 2.
4 Spectral analysis
We have derived the atmospheric parameters for the programme stars by measuring the equivalent widths of clean unblended Fe I and Fe II lines. For this purpose we have considered only those lines that have excitation potential in the range 0.0 eV to 5.0 eV and equivalent width between 20 mÅ to 160 mÅ . For the object HD 51959 we could get 56 Fe I and 8 Fe II lines, for HD 88035 69 Fe I and 7 Fe II lines, and, for HD 121447 28 Fe I and 2 Fe II lines, that are usable for abundance calculation. Due to severe line blending and distortion in the spectrum of HD 121447 we could not get sufficient number of weak Fe lines within the above ranges of exitation potential and equivalent widths. We could notice a large broadening of spectral features throughout the spectrum of HD 121447. Hence, for this object we have also considered a few strong unblended lines for deriving the atmospheric parameters. We have used the latest version of MOOG (Sneden 1973) along with the Kurucz grid of model atmospheres with no convective overshooting (http: //cfaku5.cfa.harvard.edu/) for the calculations. We have assumed Local Thermodynamic Equilibrium (LTE) for the analysis. Fe lines used for the analysis along with the measured equivalent widths are presented in Table 3. The references for the adopted log gf values are also listed in this table. The method of excitation equilibrium is used for deriving the effective temperature Teff, fixing at a value that makes the slope of the abundance versus excitation potential of Fe I lines nearly zero (Figure 2). The microturbulent velocity at this temperature is fixed by demanding that there be no dependence of the derived Fe I abundances on the equivalent width of the corresponding lines (Figure 3). The surface gravity is fixed at a value which makes the abundance of Fe from the Fe I and Fe II lines equal. Derived atmospheric parameters are presented in Table 4.
We have also determined the surface gravity (log g) using the parallaxes () from Van Leeuwen (2007) for HD 51959 and HD 121447. For the object HD 88035 we have adopted parallax value from GAIA (http://archives.esac.esa.int/gaia). This method is precise when parallaxes have small measurement uncertainty. The following relation is used
| (1) |
where
| (2) |
The bolometric corrections are determined using the empirical calibration of Alonso et al. (1999) with its erratum Alonso et al. (2001) (Table 1). We have adopted solar values log = 4.44, T = 5770 K and M = 4.75 mag. The masses of the programme stars are derived from their locations in the Hertzsprung-Russell (HR) diagram using spectroscopic log Teff along the x-axis and photometric log () along y-axis, where evolutionary tracks (Girardy et al. 2000) are plotted for different masses (Figure 4). The estimated log () values of our stars are in good agreement with estimates obtained for Barium giants by de Castro et al. (2016).
Errors in the mass estimates have maximum contribution coming from the errors in parallaxes. Error in parallaxes are 1.04, 0.219 and 0.8 mas for HD 51959, HD 88035 and HD121447 respectively. We have considered an error of 0.3 instead of 0.219 for HD 88035 since it is mentioned in the GAIA website that errors below 0.3 are very optimistic. The errors in the log (L/L⊙) estimates due to the errors in parallax values are 0.11, 0.09 and 0.24 for HD 51959, HD 88035 and HD121447 respectively.
Since our objects are of near solar metallicities, we have utilized the evolutionary tracks for the initial composition Z = 0.0198 and Y = 0.273. The estimated masses 1.3 0.1, 2.2 0.1 and 2.0 0.4 M⊙ for HD 51959, HD 88035 and HD 121447 respectively are presented in Table 5. The mass estimates are well within the range of model predictions by Han et al. (1995) who found that the masses of Ba stars range between 1.0 and 3.0 M⊙.
The estimated log g from this method are 3.7 0.09 (HD 51959), 3.2 0.03 (HD 88035) and 2.01 0.05 (HD 121447). The uncertainty in log g estimates are mostly due to uncertainty in the parallax estimates that amounts to about 12.9% (HD 51959), 7.9% (HD 88035) and 27.3% (HD 121447). Although we have estimated log g values using parallax method for a first check, we have used spectroscopic estimates of log g for our calculations.


Table 3: Fe lines used for deriving atmospheric parameters
Wavelength
Element
Elow
log gf
HD 51959
HD 88035
HD 121447
Ref
Å
id
ev
mÅ(dex)
mÅ(dex)
mÅ(dex)
4109.060
Fe I
3.290
1.56
-
107(7.53)
-
1
4446.833
3.687
1.33
-
99(7.47)
-
1
4447.129
2.198
2.59
-
107(7.35)
-
1
4447.720
2.220
1.34
-
-
236(6.69)
1
4476.019
2.845
0.57
-
-
241(6.98)
2
4485.971
3.654
2.35
41(7.41)
-
1
4489.739
0.121
3.97
-
157(7.40)
1
4566.514
3.301
2.25
-
60(7.29)
68(6.60)
1
4614.192
3.301
2.62
50(7.49)
-
1
4619.287
3.602
1.12
-
106(7.27)
-
1
The numbers in the paranthesis in columns 5 - 7 give the derived
abundances from the respective line.
References : 1. Führ et al. (1988) 2. Bridges Kornblith (1974)
Note. This table is available in its entirety in online only.
A portion is shown here for guidance regarding its form and content.
Table 4: Derived atmospheric parameters for the programme stars
Star Name.
HJD
Vr
log g
[Fe I/H]
[Fe II/H]
km s-1
K
km s-1
HD 51959
2451493.837
38.5
5020
3.65
1.31
0.03
0.01
HD 88035
2451550.715
2.5
5300
3.9
1.88
0.05
0.01
HD 121447
2451550.805
2.3
4500
2.2
3.02
0.65
0.65
Table 5: Stellar masses
Star Name
log )
Mass ()
HD 51959
3.19
0.26
0.62
0.11
1.3
0.10
HD 88035
1.19
0.20
1.43
0.09
2.2
0.10
HD 121447
-0.35
0.52
2.04
0.24
2.0
0.40
4.1 Elemental abundances
For most of the cases the elemental abundances are derived by the standard method using the measured equivalent widths. For a few elements which are known to be affected by the hyperfine splitting, we have used the spectral synthesis calculation to derive the abundances. The elemental abundances along with the abundance ratios are presented in Tables 6 - 8. We have also calculated the [ls/Fe], [hs/Fe] and [hs/ls] values (Table 9), where ls represents light s-process elements Sr, Y and Zr and hs represents heavy s-process elements Ba, La, Ce, Nd and Sm whenever available. The lines used along with the abundances derived from the individual lines and the references for the log gf values adopted for our calculations are presented in Table 10.
4.2 Uncertainties in metallicity and elemental abundances
We have derived the uncertinities in elemental abundances by varying the stellar atmospheric parameters Teff, log g and microturbulence in the model atmosphere. The uncertainty due to temperature is determined by varying the temperatures by 100 K and recalculating the Fe abundance. Similarly by varying the log g value by 0.1 and microturbulent velocity by 0.1 km s-1, we have calculated the corresponding uncertainties in abundances due to these changes. The total uncertainty is calculated using the standard equation of error calculations. We have assumed these values as the minimum error in the derived abundances. The uncertainty in log is the standard error when they are derived from more than one line; when abundances are derived using spectral synthesis calculations the uncertainty values are taken as 0.2 dex which gives a clear separation from adopted abundance value on either side of the observed spectrum. The uncertainty in [X/H] can be considered same as that for log since the adopted solar abundances are known to be precise and errors in the solar abundances can be neglected. In the case of [X/Fe], the source of uncertainty includes those from the measurement of [Fe/H] which adds up a minimum error of 0.10 dex.
4.3 Elemental abundance ratios: analysis and interpretation
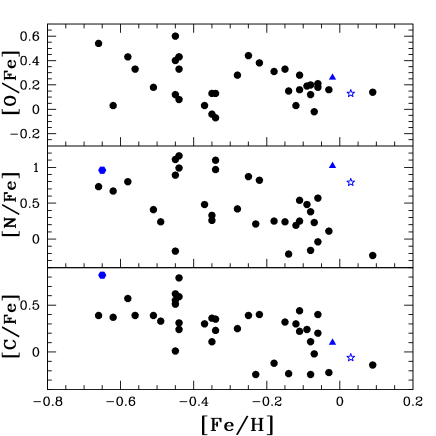
The estimated carbon in HD 121447 is found to be enhanced and near solar in the other two objects (Tables 6, 7, 8). The carbon abundances are measured using spectrum synthesis calculations of the weak C2 band at 5165 Å (figure 5). Using this carbon abundance, the abundance of nitrogen is obtained from spectrum synthesis calculations of the CN bands at 4215 Å (figure 6) and 8005 Å .
Nitrogen abundance derived from the CN red region (8005 Å ) is marginally higher by 0.15 dex in HD 88035 and HD 121447. For HD 51959, N abundance derived from 4215 Å band is 0.06 dex lower than that obtained from 8005 Å region. The abundances quoted in the tables 6, 7 and 8 are averages of these two values. Nitrogen is found to be enhanced in all the three objects. For the linelists of C2 and CN bands, we have consulted Brooke et al. (2013), Sneden et al. (2014) and Ram et al. (2014) and used the most updated log gf values for the C2 lines in these regions.
The abundances of oxygen in HD 51959 and HD 88035 are estimated from spectrum synthesis calculation of the oxygen triplet lines around 7774 Å (figure 7). Although O I triplet is known to be affected by non-LTE conditions, the effect decreases in objects with higher gravities. These effects are also found to disappear for lines with equivalent widths below about 45 mÅ ; a discussion on these effects for K giants is available in Eriksson & Toft (1979).
Estimated C/O for HD 51959 and HD 88035 are 0.35 and 0.43 respectively are consistent with barium stars. The estimated [ΣCNO/Fe] for HD 51959 and HD 88035 are found to be 0.20 and 0.39 respectively. From estimates of CNO abundances Tomkin and Lambert (1979) have demonstrated in a sample of barium stars that carbon shows near solar values, oxygen is mildly deficient ( 0.1 dex), and, nitrogen is mildly enhanced with 0.3 dex. However, Barbuy et al. (1992) have found carbon abundances in the range 0.25 [C/Fe] 0.3 for a sample of barium stars; they noted that the less evolved Ba stars show high N abundances (Barbuy et al. 1992, Allen and Barbuy 2006).
Estimated 12C/13C ratios obtained using spectrum synthesis calculations of the CN band at 8005 Å (figure 8) are found to be small with values 10.1 and 7.3 for HD 88035 and HD 121447 respectively. The 12C/13C ratios are derived using the set of 12CN lines at 8003.553, 8003.910 Å and 13CN features at 8004.554, 8004.728, 8004.781 Å which are considered to be more reliable for this calculation.


The near solar Na abundances (Tables 6 & 7) derived using the Na I lines at 5682.65 and 5688.22 Å for HD 51959 and HD 88035 are as normally seen in field giants. The sample of barium stars studied by de Castro et al. (2016) show [Na/Fe] ratios in the range 0.3 to 0.6.
A single Al I line at 6783.68 Å gives [Al/Fe] 0.49 dex for HD 51959, a value not so uncommon to barium stars; de Castro et al. (2016) found [Al/Fe] 0.43 for HD 43389, which is a metal-poor star with [Fe/H] 0.52.
Except for Mg that shows mild underabundance, the abundance ratios of - elements in HD 51959 and HD 88035 are very similar to those normally seen in giants and barium stars. Mg is also found to be underabundant in case of HD 49641 and HD 58368, two strong barium stars analyzed by Mahanta et al. (2016). The lowest [Mg/Fe] found in the sample of de Castro et al. (2016) is [Mg/Fe] 0.13 for HD 142751 ([Fe/H] = 0.1). Our estimate of [Mg/Fe] for HD 121447 is near solar with value of 0.04.
Silicon and calcium show near solar values for HD 51959 and HD 88035 (Tables 6 & 7), these values in HD 121447 are marginally higher than that normally seen in barium stars.
The abundance of Ti in case of HD 51959 is near solar (Table 6), and marginally higher in HD 88035 and HD 121447. These values are consistent with those of de Castro’s sample.
Abundance of Scandium is derived for HD 51959 and HD 88035 using spectrum synthesis calculation of Sc II line at 6245.63 Å considering hyperfine structure from Prochaska McWilliam (2000). [Sc/Fe] is near solar in HD 51959 and mildly enhanced in HD 88035 (Tables 6, 7). The abundance of Sc could not be measured in HD 121447.
Abundance of V is estimated using spectrum synthesis calculation of V I line at 5727.028 Å taking into account the hyperfine components from Kurucz data base (Table 6). Yang et al. (2016) finds a similar value of [V/Fe] = 0.2 for HD 81797. Their sample shows [Sc/Fe] in the range 0.07 to 0.17. Vanadium is mildly enhanced in HD 88035 and HD 121447 with [V/Fe] = 0.42 (Tables 6 and 7) Abundances of Sc and V are not reported in de Castro et al. (2016).
Abundance ratios of iron peak elements in HD 51959 and HD 88035 exhibit similar values as seen in normal giants and barium stars. Cr shows near solar values in all the three objects (Tables 6, 7, 8).
The abundance of manganese is derived using spectrum synthesis calculation of 6013.51 Å line taking into account the hyperfine structures from Prochaska McWilliam (2000). Considering the uncertainty limits, Mn is found to be near solar in HD 51959 and mildly underabundant in HD 88035 (Tables 6 & 7). This ratio is +0.51 for HD 121447 which is marginally above the values normally seen in barium stars. The abundance of Mn in Yang et al. (2016) ranges from 0.27 (HD 58121) to 0.3 (HD 43232) in their sample.
While Co shows a mild enhancement in HD 51959 and HD 88035, the abundances of Ni are near solar (Tables 6 & 7). A mild enhancement is noticed in HD 121447 with a value of 0.37.
Abundance of Zn derived using a single line at 4810.528 Å gives [Zn/Fe] 0.21 for HD 88035. Abundances of Mn, Co and Zn in de Castro et al. (2016) and Co and Zn in Yang et al. (2016) are not reported.
Abundance of Sr is measured for HD 51959 and HD 88035 using both the equivalent width measurements as well as spectrum synthesis calculation of the Sr I line at 4607.7 Å and found to be enhanced. Abundances of Sr are not reported for their sample in de Castro et al. (2016) and Yang et al. (2016).
Abundance of Y derived from the Y II lines indicates enhancement in all the three stars. Spectrum synthesis calculation fits for Y II line at 5289.81 Å is shown in figure 9. For HD 121447, the Y abundance is derived using two Y II lines at 5119.11 and 5544.61 Å.
Zirconium abundance derived from Zr I lines in HD 88035 and HD 121447 and Zr II lines at 4414.54 and 4613.97 Å for HD 51959 show large enhancement. Enhancement of Y and Zr abundances are noticed in the sample of Yang et al. (2016) and also in the sample of four barium stars studied by Mahanta et al. (2016). The sample of de Castro et al. (2016) shows a wide range in abundance ratios from near solar to [X/Fe] 1.0 for both Y and Zr.

We have used Ba II lines at 4934, 5853, 6141 and 6496 Å whenever available to derive the barium sbunadnce. Spectrum synthesis calculation of Ba II line at 5853 Å (figure 10, left panels) considering the hyperfine splitting contributions from Mc William (1998) is also performed to estimate barium abundance. Reported [Ba/Fe] values in Tables 6-8 are those obtained from spectrum synthesis calculations of Ba II feature at 5853.66 Å. While de Castro et al. (2016) have not reported abundances of Ba for their sample, [Ba/Fe] ranges from 0.17 (HD 11658) to 1.13 (HD 49641) in the sample of Yang et al. (2016).
Abundance of lanthanum is derived from the spectrum synthesis calculation of La II line at 4921.77 Å (figure 10, right panels) considering hyperfine components from Jonsell et al. (2006). The derived values of La indicate large enhancements (Tables 6, 7, 8). Estimates of [La/Fe] range from 0.26 (HD 11658) to 1.38 (HD 49641) in the sample of Yang et al. (2016); these estimates have a wider range for the sample of de Castro et al. (2016) from 0 (BD01302) to 2.7 (HD 24035).

Ce, Pr, Nd and Sm abundances are also found to be enhanced in all the three stars (Tables 6, 7, 8). In the sample of de Castro et al. the estimates of [Ce/Fe] range from 0.08 (HD 212484) to 1.87 (HD 107541) and [Nd/Fe] from 0.0 (HD 51315) to 1.83 (HD 107541).
A spectrum synthesis calculation of Eu II line at 6645.130 Å by considering the hyperfine components from Worley et al. (2013) shows enhancement of Eu in HD 121447. Since this line is found to be slightly distorted, our estimate may be regarded as an upper limit. For HD 88035, the Eu abundance derived from the spectrum synthesis calculation of Eu II line at 6437.64 Å shows an enhancement with [Eu/Fe] 0.96.
Abundance of dysprosium is derived using Dy II lines at 4103.310 and 4923.167 Å for HD 51959. For HD 88035 and HD 121447, Dy abundance was derived from a single line at 4923.17 Å.
Estimated [hs/ls] 0 for HD 88035 and HD 121447 (where hs refers to the second peak s-process elements and ls refers to the first peak s-process elements) is an indication that the neutron exposures experienced in their AGB progenitor companions are sufficiently strong for the production of the more abundant ‘hs’ elements than the ‘ls’ elements.
Table 6 : Elemental abundances in HD 51959
Z
solar
[X/H]
[X/Fe]
dex
C i
6
8.43
8.400.20(syn)
-0.03
-0.06
N i
7
7.83
8.680.20(syn)
0.85
0.82
O i
8
8.69
8.850.20(syn)
0.16
0.13
Na i
11
6.24
6.290.17(6)
0.05
0.02
Mg i
12
7.60
7.210.16(2)
-0.39
-0.42
Al i
13
6.45
6.970.20(1)
0.52
0.49
Si i
14
7.51
7.670.21(4)
0.16
0.13
Ca i
20
6.34
6.110.16(5)
-0.23
-0.26
Sc ii*
21
3.15
3.30.20(1,syn)
0.15
0.14
Ti i
22
4.95
4.890.15(13)
-0.06
-0.09
Ti ii
22
4.95
4.930.20(1)
-0.02
-0.03
V i*
23
3.93
4.100.20(1,syn)
0.17
0.14
Cr i
24
5.64
5.540.18(10)
-0.10
-0.13
Mn i*
25
5.43
5.200.20(1,syn)
-0.23
-0.26
Fe i
26
7.50
7.530.12(56)
0.03
-
Fe ii
26
7.50
7.510.20(8)
0.01
-
Co i
27
4.99
5.200.13(6)
0.21
0.24
Ni i
28
6.22
6.190.12(14)
-0.03
-0.07
Sr i*
38
2.87
4.180.20(1,syn)
1.31
1.28
Y ii*
39
2.21
3.200.18(5)
0.99
0.98
Zr ii
40
2.58
3.86 0.24(2)
1.28
1.25
Ba ii*
56
2.18
3.000.20(1,syn)
0.82
0.81
La ii*
57
1.10
2.050.20(1,syn)
0.95
0.94
Ce ii
58
1.58
2.610.21(12)
1.03
1.02
Pr ii
59
0.72
1.910.17(3)
1.19
1.18
Nd ii
60
1.42
2.590.20(9)
1.17
1.16
Sm ii
62
0.96
1.990.13(5)
1.03
1.02
Dy ii
66
1.10
2.710.22(2)
1.61
1.60
a Asplund et al. (2009)
∗ abundances are derived using spectral synthesis of respective lines.
Table 7 : Elemental abundances in HD 88035
Z
solar
[X/H]
[X/Fe]
dex
C i
6
8.43
8.530.20(syn)
0.10
0.1
N i
7
7.83
8.870.20(syn)
1.04
1.09
O i
8
8.69
8.900.20(syn)
0.21
0.26
Na i
11
6.24
6.360.13(4)
0.12
0.17
Mg i
12
7.60
7.230.03(2)
-0.37
-0.32
Si i
14
7.51
7.690.13(2)
0.18
0.13
Ca i
20
6.34
6.240.16(8)
-0.10
-0.05
Sc ii*
21
3.15
3.500.20(1,syn)
0.35
0.34
Ti i
22
4.95
5.060.16(13)
0.11
0.16
Ti ii
22
4.95
5.220.18(8)
0.27
0.26
V i*
23
3.93
4.300.20(1,syn)
0.37
0.42
Cr i
24
5.64
5.560.19(6)
-0.08
-0.03
Mn i*
25
5.43
4.950.20(1,syn)
-0.48
-0.43
Fe i
26
7.50
7.450.11(69)
-0.05
-
Fe ii
26
7.50
7.510.10(7)
0.01
-
Co i
27
4.99
5.360.20(5)
0.37
0.42
Ni i
28
6.22
6.240.18(20)
0.02
0.07
Zn i
30
4.56
4.300.20(1)
0.26
0.21
Sr i*
38
2.87
4.270.20(1,syn)
1.40
1.45
Y ii*
39
2.21
3.420.14(5)
1.21
1.20
Zr i
40
2.58
3.830.11(4)
1.25
1.30
Ba ii*
56
2.18
3.700.20(1,syn)
1.52
1.51
La ii*
57
1.10
2.800.20(1,syn)
1.70
1.69
Ce ii
58
1.58
3.360.19(10)
1.78
1.76
Pr ii
59
0.72
2.700.05(3)
1.98
1.97
Nd ii
60
1.42
3.170.16(11)
1.75
1.74
Sm ii
62
0.96
2.900.13(5)
1.94
1.93
Eu ii*
63
0.52
1.490.19(1,syn)
0.97
0.96
Dy ii
66
1.10
2.560.20(1)
1.46
1.45
a Asplund et al. (2009)
∗ abundances are derived using spectral synthesis of respective lines.
Table 8 : Elemental abundances in HD 121447
Z
solar
[X/H]
[X/Fe]
dex
C i
6
8.43
8.600.20(syn)
0.17
0.82
N i
7
7.83
8.260.20(syn)
0.43
1.08
Mg i
12
7.60
6.990.20(1)
-0.61
0.04
Si i
14
7.51
7.730.20(1)
-0.04
0.61
Ca i
20
6.34
6.300.18(4)
-0.04
0.61
Ti i
22
4.95
4.590.02(3)
-0.36
0.29
V i*
23
3.93
4.300.20(1,syn)
0.37
0.42
Cr i
24
5.64
5.150.05(2)
-0.49
0.16
Mn i*
25
5.43
5.290.20(1,syn)
-0.14
0.51
Fe i
26
7.50
6.850.15(28)
-0.65
-
Fe ii
26
7.50
6.850.06(2)
-0.65
-
Ni i
28
6.22
5.940.18(6)
-0.28
0.37
Y ii*
39
2.21
3.170.26(2)
0.96
1.61
Zr i
40
2.58
3.620.12(2)
1.04
1.69
Ba ii*
56
2.18
4.200.20(1,syn)
2.02
2.67
La ii*
57
1.10
2.400.20(1,syn)
1.67
2.32
Ce ii
58
1.58
2.600.16(4)
1.02
+1.67
Pr ii
59
0.72
2.620.06(5)
1.90
2.55
Nd ii
60
1.42
2.890.16(5)
1.47
2.12
Sm ii
62
0.96
2.480.15(3)
1.52
2.17
Eu ii*
63
0.52
1.300.20(1,syn)
0.78
1.43
Dy ii
66
1.10
2.960.20(1)
1.86
2.51
a Asplund et al. (2009)
∗ abundances are derived using spectral synthesis of respective lines.
Table 9: Observed values for [Fe/H], [ls/Fe], [hs/Fe] and [hs/ls]
Star Name
[Fe/H]
[ls/Fe]
[hs/Fe]
[hs/ls]
HD 51959
0.03
1.18
1.00
-0.18
HD 88035
-0.05
1.29
1.67
0.14
HD 121447
-0.65
1.63
2.39
0.76
Table 10: lines used for deriving elemental abundances
Wavelength
Element
Elow
log gf
HD 51959
HD 88035
HD 121447
Ref
Å
id
ev
mÅ(dex)
mÅ(dex)
mÅ(dex)
5682.650
Na I
2.100
-0.70
140(6.52)
136(6.46)
-
1
5688.220
2.100
-0.40
139(6.21)
146(6.27)
-
1
6160.747
2.105
-1.26
85(6.31)
-
-
1
8194.824
2.105
0.49
258(6.12)
-
-
1
5889.950
0.000
0.10
545(5.55)
626(5.87)
-
2
5895.920
0.000
-0.20
601(5.95)
471(5.87)
-
2
4702.990
Mg I
4.350
-0.67
229(7.37)
214(7.26)
-
3
5528.400
4.350
-0.49
224(7.22)
227(7.20)
265.9(6.98)
3
6783.680
Al I
4.021
-1.44
45(6.98)
-
-
4
4782.990
Si I
4.954
-2.47
-
38(7.85)
-
1
The numbers in the paranthesis in columns 5 - 7 give the derived
abundances from the respective line.
References: 1. Kurucz & Peytremann (1975), 2. Wiese et al. (1966),
3. Lincke & Ziegenbein (1971), 4. Kurucz (1975)
Note. This table is available in its entirety in online only.
A portion is shown here for guidance regarding its form and content.
Table 11: Abundance Uncertainities
Star
Standard
log g
Total
error
100K
0.1 dex
0.3 km s-1
Uncertainity
HD 51959
0.12
0.06
0.04
0.03
0.14
HD 88035
0.11
0.03
0.02
0.03
0.12
HD 121447
0.15
0.04
0.02
0.01
0.16
Table 12: Atmospheric parameters of HD 121447
Star Name.
log g
[Fe /H]
Ref
K
km s-1
HD 121447
4500
2.2
3.02
-0.65
1
4000
1.0
2.0
-0.25
2
3900
1.0
2.0
-0.50
3
4200
0.8
2.5
0.05
4
1. Our work, 2. Abia et al. (1998), 3. Merle et al. (2016), 4. Smith (1984)
5 Kinematic analysis
We have calculated the space velocity for the stars with respect to
the Sun using the method of Johnson & Soderblom (1987). The space
velocity with respect to the Local Standard of Rest (LSR) is given by
km/s.
where, km/s (Schonrich et al., 2010) is the solar motion with respect to LSR and
where, , T is the transformation matrix connecting the Galactic coordinate system and equatorial coordinate system, k = 4.74057 km s-1 equivalent of 1 AU in one year and and are proper motions in RA and Dec.
The estimates of the components of spatial velocity, , and measured along axes pointing towards the Galactic center, the direction of Galactic rotation and the North Galactic Pole respectively are with respect to the Local Standard of Rest (LSR). We have used the radial velocity estimate and the corresponding error estimate as measured by us. The estimates for proper motion are taken from SIMBAD. Distances are measured taking parallax values from SIMBAD and GAIA whenever available.
The total spatial velocity of a star is given by,
The estimated components of spatial velocity and the total spatial velocity are presented in Table 13. According to Chen et al. (2004) Vspa 85 km s-1 for a thin disk star. The total spatial velocities for all the three stars are found to be below this value.
We have also calculated the probability for the stars to be a member of thin disk, the thick disk or the halo population following the procedures of Reddy et al.(2006), Bensby et al. (2003, 2004) and Mishenina et al. (2004).
The estimated metallicities and low spatial velocities indicate the stars to be thin disk objects. The probability estimates for them being members of the thin disk population are 0.99, 0.99 and 0.92 for HD 51959, HD 88035 and HD 121447 respectively (Table 13).
Table 13: Spatial velocity and probability estimates for the program stars. Star name (km/s) (km/s) (km/s) (km/s) HD 51959 0.99 0.009 0.00019 HD 88035 0.988 0.01079 0.0002 HD 121447 0.922 0.0755 0.0023
Table 14: Abundance ratios of carbon and neutron-capture elements in
HD 121447
Star Name.
[C/Fe]
[N/Fe]
[Sr/Fe]
[Y/Fe]
[Zr/Fe]
[Ba/Fe]
[La/Fe]
[Ce/Fe]
[Nd/Fe]
[Sm/Fe]
[Eu/Fe]
Ref
HD 121447
0.82
0.96
-
1.61
1.64
2.67
2.33
1.67
2.12
2.17
1.43
1
-
-
1.2
1.5
1.15
1.3
2.0
1.5
1.3
-
0.95
2
0.55
-
0.97
0.94
1.86
2.33
1.74
1.27
-
-
-
3
0.22
0.52
1.22
0.76
0.66
0.57
0.70
0.73
0.65
-
0.39
4
1. Our work, 2. Abia et al. (1998), 3. Merle et al. (2016), 4. Smith (1984)
6 Discussions and conclusions
Chemical analysis of three stars from the Bartkevicius (1996) catalogue of CH stars clearly shows spectral properties that are characteristics of barium stars. In particular, with [Ba/Fe] 0.81, the object HD 51959 seems to be a mild barium star, as assigned by Udry et al. (1998a, 1998b) and Jorissen et al. (1998), HD 88035 a potential member of strong barium stars, and HD 121447 a metal-poor barium star.
CH stars are known to be high velocity objects with Vrr 100 km s-1 . None of the three objects is found to be a high velocity object (Table 4). From kinematic analysis all the three stars are found to be members of thin disk population with high probability. From radial velocity variations Jorissen et al. (1998, 2016) have measured a period of 185.7 days and eccentricity 0.01 for the object HD 121447. These values are in consistence with the majority of barium and CH stars. They have suggested this object to be an ellipsoidal variable. The orbital information for HD 88035 is not available in literature. HD 51959 is believed to be a long period (9488 days) object with an eccentricity of 0.58 (Jorissen et al. in preparation). This is not surprising as barium stars are known to have longer orbital periods and greater eccentricities than their population II analogs, the CH stars.
All the three objects in our sample show enhancement in Nitrogen with [N/Fe] in the range 0.6 to 1.0 (figure 11). An insightful discussion on C, N, O abundances of barium stars can be found in Smith (1984). For the object HD 121447, that is common in his sample, the best values for C and O were found to be logN(C) = 8.7 and logN(O) = 8.8. Using these abundances of C and O he had derived Nitrogen abundance to be logN(N) = 8.4 for HD 121447. Our C and N abundance values are slightly lower with log N(C) = 8.6 and log N(N) = 8.14 for this object. We note however, that our stellar parameters for this object differ considerably with those of Smith (1984) (Table 12). As discussed by many authors (Smith (1984), Luck and Lambert (1985), Barbuy et al. (1992), Smiljanic et al. (2006), Merle et al. (2016)), higher N abundances with low C abundances observed in some Ba stars indicate CN processing. Increase in [N/C] ratio as the star ascends the giant branch is attributed to the mixing process like first dredge up (FDU). Smiljanic et al. (2006) explains about a more complex kind of rotational mixing which can cause the increase in [N/C] ratio. From the HR diagram, our objects are in the first ascend of the giant branch, which clearly supports increase in N abundance over Carbon’s. Light elements abundance in Ba stars are expected to scale with the metallicity values. From figure 12, it is clear that our results are consistent with those for other objects with similar metallicity values.
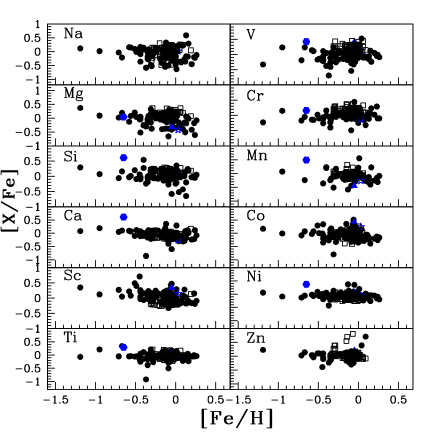
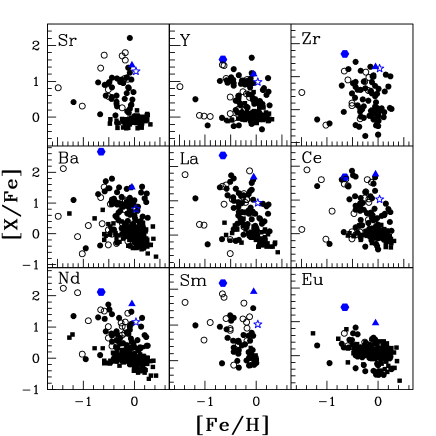
The heavy elements abundance ratios observed in the three stars match closely with majority of barium stars in literature. This is clearly evident from a comparison of the estimates of the abundance ratios with those of de Castro et al. (2016) and Yang et al. (2016) (figure 13).
The objects HD 88035 and HD 121447 are peculiar with very high N abundance along with large enhancement of heavy-s process elements. This could possibly be due to the presence high mass companions to these objects where the neutron densities are expected to be high. The large N enhancement in these objects could be due to HBB operating in the higher mass AGB companions of these objects. Moreover, higher enhancement of r-process elements Sm, Eu and Dy in these objects could also indicate the presence of higher neutron densities in their AGB companions (Cowan and Rose 1977). But the derived low masses for these objects which represents a lower limit to the companion mass does not support the presence of higher mass companion.
Acknowledgement
This work made use of the
SIMBAD astronomical database, operated at CDS, Strasbourg, France, and the
NASA ADS, USA. M. P. is a JRF in the
DST project SB/S2/HEP-010/2013; funding from this project
is gratefully acknowledged. N Sridhar, a student of integrated BS-MS
course of IISER, Bhopal, gratefully acknowledges the summer internship
at IIA, under IIA’s Visiting Student Program - 2015.
References
- [1] Abia, C., Wallerstein, G., 1998, MNRAS, 293, 89
- [2] Ake, T. B., 1979, ApJ, 234, 538
- [3] Allen D.M. & Barbuy B., 2006, A&A, 454, 895
- [4] Alonso A., Arribas S. & Martinez-Roger C., 1999, A&AS, 140, 261
- [5] Alonso A., Arribas S. & Martinez-Roger C., 2001, A&A, 376, 1039
- [6] Andersen, T., Poulsen, O., Ramanujam, P. S., Petkov, A. P., 1975, SoPh, 44, 257
- [7] Arnesen A., Bengtsson A., Hallin R., Lindskog J., Nordling C., and Noreland T., 1977, Phys.Scripta 16, 31-34.
- [8] Asplund M., Grevesse N., Sauval A. J., 2009, Ann. Rev. Astron. Astrophy., 47:481
- [9] Barbuy B., Jorissen A., Rossi S. C. F., Arnould M., 1992, A&A, 262, 216
- [10] Bartkevicius A., 1996, BaltA, 5, 217
- [11] Bensby T., Feltzing S. and Lundstrom I., 2003, A&A, 410, 527
- [12] Bensby T., Feltzing S. and Lundstrom I., 2004, A&A, 415, 155
- [13] Biemont E., Grevesse N., Hannaford p., Lowe R. M., 1981, ApJ, 248, 867
- [14] Biemont E., Karner C., Meyer G., Traeger F., and zu Putlitz G., 1982, A&A 107, 166-171.
- [15] Bridges, J.M. & Kornblith, R.L. 1974, 192, 793
- [16] Brooke, J. S. A., Bernath, P. F., Schmidt, T. W., and Bacskay, G. B., 2013, JQSRT, 124, 11
- [17] Chen Y. Q., Nissen P. E., Zhao G., 2004, A&A, 425, 697
- [18] Corliss C.H. and Bozman W.R., 1962a, NBS Monograph 53
- [19] Corliss C.H. and Bozman W.R., 1962b, NBS Monograph 53, adjusted
- [20] Cowan, J.J. & Rose, W.K., 1977, ApJ, 212, 149
- [21] Cowley C.R. & Corliss C.H., 1983, MNRAS 203, 651
- [22] Drake N. A. & Pereira C. B., 2008, AJ, 135, 1070
- [23] de Castro D. B., Pereira C. B., Roig F., Jilinski E., Drake N. A., Chavero, C., Sales Silva J. V., 2016, MNRAS, 459, 4299
- [24] Eriksson, K. & Toft, S. C., 1979, A&A,71,178
- [25] Führ J. R., Martin G. A., Wiese W. L., 1988, J. Phys. Chem. Ref. Data, 17, 4
- [26] Garz, T., 1973, A&A, 26,471
- [27] Girardi L., Bressan A., Bertelli G., Chiosi C., 2000, A&AS 141, 371
- [28] Gomez A. E., Grenier S., Udry S., Haywood M., Meillon L., Sabas V., Sellier A., Morin D., 1997, ESASP, 402, 621
- [29] Hartwick F. D. A. & Cowley A. P., 1985, AJ, 90, 2244
- [30] Han, Z., Eggleton P. P., Podsiadlowsky P., & Tout C. A., 1995, MNRAS, 277, 1443
- [31] Hannaford P., Lowe R. M., Grevesse N., Biemont E., & Whaling W, 1982, ApJ 261, 736.
- [32] Izzard, R. G., Dermine, T. & Church, R. P., 2010, A&A, 523, 10
- [33] Johnson, D. R. H. & Soderblom, D. R., 1987, AJ, 93, 864
- [34] Jonsell K., Barklem P. S., Gustafsson B., Christlieb N., Hill V., Beers T. C., & Holmberg J., 2006, A&A, 451, 651
- [35] Jorissen, A., Van Eck S., Mayor M., Udry S., et al., 1998, A&A, 332, 877
- [36] Jorissen, A., et al. 2016, A&A, 586, A158
- [37] Karinkuzhi D. & Goswami A., 2014, MNRAS, 400, 1095
- [38] Karinkuzhi D. & Goswami A., 2015, MNRAS, 446, 2348
- [39] Kaufer A., & Pasquini L., 1998, SPIE, 3355, 844
- [40] Kurucz, R. L., 1975, mpth.conf, 271
- [41] Kurucz, R. L., 1988, ASSL, 138, 41
- [42] Kurucz, R. L.; Peytremann, E., 1975, SAOSR, 362
- [43] Lambert, D.L. & Warner, B., 1968, MNRAS 138, 181
- [44] Lawler J. E., BonVallet G., Sneden C., 2001, ApJ, 556, 452
- [45] Liang, Y. C., Zhao, G., Chen, Y. Q., Qiu, H. M., & Zhang, B., 2003, A&A, 397, 257
- [46] Lincke, R., Ziegenbein, B., 1971, ZPhy, 241, 369
- [47] Luck, R.E., Bond H.E., 1991, ApJS, 77, 515
- [48] Luck R. E., Heiter U., 2007, AJ, 133, 2464
- [49] Luck, R. E. & Lambert, D. L., 1985, ApJ, 298, 782
- [50] Martin, G. A., Führ J. R., Wiess, W. L., 1988a, J. Phys. Chem. Ref. data, 17, Suppl. 3 (modified)
- [51] McClure, R. D., 1983, ApJ, 268, 264
- [52] McClure, R. D., 1984, PASP, 96, 117
- [53] McEachran R.P., and Cohen M. 1971, JQSRT, 11, 1819
- [54] Mahanta, U., Karinkuzhi, D., Goswami, A., Duorah, K., 2016, MNRAS, 463, 1213
- [55] McWilliam A., 1998, AJ, 115, 1640
- [56] Meggers W.F, Corliss C.H. and Scribner B.F. 1975, NBS Monograph 145. estimated from intensity
- [57] Mennessier M. O., Luri X., Figueras F., Gomez A. E., Grenier S., Torra J., & North P., 1997, A&A, 326, 722
- [58] Merle, T., Jorissen, A., Van Eck, S., Masseron, T., Van Winckel, H., 2016, A&A, 586, 151
- [59] Mishenina T. V., BienaymÃf© O., Gorbaneva T. I., Charbonnel C., Soubiran C., Korotin S. A., Kovtyukh, V. V., 2006, A&A, 456, 1109
- [60] Mishenina T. V. Soubiran C., Kovtyukh V. V. & Korotin S. A., 2004, A&A, 418, 551
- [61] Prochaska, J. X., & McWilliam A., 2000, ApJ, 537, L57
- [62] Pereira C. B. & Drake N. A., 2009, A&A, 496, 791
- [63] Ram, R. S., Brooke James, S. A., Bernath, P. F., Sneden, C., Lucatello, S., 2014, ApJS, 211, 5
- [64] Reddy, B. E., Lambert, D. L., Allende Prieto, C., 2006, MNRAS, 367, 1327
- [65] Schonrich, R., Binney, J., & Dehnen, W., 2010, MNRAS, 403, 1829
- [66] Smiljanic, R., Porto de Mello, G. F., & da Silva, L., 2007, A&A, 468, 679
- [67] Smiljanic, R., Barbuy, B., de Medeiros, J. R. , Maeder, A., 2006, RMxAC, 26, 45
- [68] Smith, V. V., 1984, A&A, 132, 326
- [69] Smith, V V. & Lambert, D L., 1986 ApJ, 311,843
- [70] Sneden, C., 1973, PhD thesis, Univ. Texas at Austin
- [71] Sneden, C., Lucatello, S., Ram, R. S., Brooke, J. S. A., and Bernath, P. F., 2014, ApJS, 214, 26
- [72] Stuck, D. & Wende B., 1974, Phys. Rev. A 9, 1-8.
- [73] Tautvaisiene G., Edvardsson, B., Tuominen, I., Ilyin, I., 2000, A&A, 460, 399
- [74] Tomkin, J. & Lambert, D. L., 1979, ApJ, 227, 209
- [75] Udry S., Jorissen A., Mayor M., & Van Eck S., 1998a, A&AS, 131, 25
- [76] Udry S., Mayor M., Van Eck S., et al. 1998b, A&AS, 131, 43
- [77] Van der Swaelmen, M., Barbuy, B., Hill, V., Zoccali M., Minniti, D., Ortolani, S., and Gömez, A., 2016, A&A, 586, 1
- [78] Van Leeuwen F., 2007, A&A, 474, 653
- [79] Vanture A. D., 1992a, AJ, 103, 2035
- [80] Vanture A. D., 1992b, AJ, 104, 1986
- [81] Ward L., Vogel O., Arnesen A., Hallin R., and Wannstrom A. 1985a, Phys. Scripta 31, 162
- [82] Ward, L., Vogel, O., Arnesen, A., Hallin, R., and Wannstrom, A. 1985b, Phys. Scripta 31, 162, modified
- [83] Warner, B. 1968, MNRAS 140, 53
- [84] Wiese W.L., Smith M.W., and Glennon B.M. 1966, NSRDS-NBS 4.
- [85] Worley C. C, Hill V., J. Sobeck J., Carretta E., A&A, 2013, 553, A47
- [86] Yang, Guo-Chao, Liang Yan-Chun, Spite M., Chen Yu-Qin, Zhao, G., Zhang Bo, Liu Guo-Qing, Liu Yu-Juan, Liu N., Deng Li- Cai, Spite F., Hill V., Zhang Cai-Xia, 2016, RAA, 16, No.1
- [87] Zacs, L. 1994, A&A, 283, 937