Promoting cooperation by punishing minority
Abstract
Punishment is an effective way to sustain cooperation among selfish individuals. In most of previous studies, objects of punishment are set to be defectors. In this paper, we propose a mechanism of punishment, in which individuals with the majority strategy will punish those with the minority strategy in a public goods game group. Both theoretical analysis and simulation show that the cooperation level can be greatly enhanced by punishing minority. For no punishment or small values of punishment fine, the fraction of cooperators continuously increases with the multiplication factor. However, for large values of punishment fine, there exists a critical value of multiplication factor, at which the fraction of cooperators suddenly jumps from 0 to 1. The density of different types of groups is also studied.
PACS: 02.50.Le, 87.23.Kg, 87.23.Ge
Keywords: public goods game; cooperation; punishment; majority
I Introduction
To understand the emergence of cooperative behavior among selfish individuals, researchers have considered various mechanisms rev1 ; rev2 ; rev3 , such as network reciprocity 1 ; 2 ; 2.1 , voluntary participation 3 ; 4 , teaching activity 5 ; 7 ; 8 , social diversity 9 , migration 11 ; 13 , chaotic payoff variations 14 , extortion 15 ; 16 ; 17 , reputation 18 , memory 19 ; 20 , diverse activity patterns 21 , the coevolution setup 22 , onymity 23 and so on.
So far, punishment has been proved to be an effective way to enforce cooperative behavior and various mechanisms of punishment have been proposed the1 ; the3 ; the4 ; the5 ; the6 ; the7 ; the8 . Szolnoki found that the impact of pool punishment on the evolution of cooperation in structured populations is significantly different from that reported previously for peer punishment Szolnoki . Perc and Szolnoki proposed an adaptive punishment that can promote public cooperation through the invigoration of spatial reciprocity, the prevention of the emergence of cyclic dominance, or the provision of competitive advantages to those that sanction antisocial behavior Perc . Chen showed that sharing the responsibility to sanction defectors rather than relying on certain individuals to do so permanently can solve the problem of costly punishment Chen . Cui and Wu demonstrated that the presence of selfish punishment with avoiding mechanism can help individuals out of both first-order and second-order social dilemma Wu .
In previous studies, objects of punishment are individuals who hold a specific strategy (usually is deemed to be defection). However, the punished strategy may not be fixed but depends on the surrounding environment, e.g., on neighbors’ strategies. Psychological experiments have demonstrated that, an individual tends to follow the majority in behavior or opinion. There exist some psychological or financial punishments of being minority dissent1 ; dissent2 . Based on the above consideration, we propose a mechanism of punishment in which individuals with the majority strategy will punish those with the minority strategy in a group. Utilizing the public goods game (PGG) as a prototypical model of group interaction, we find that cooperation can be greatly promoted by punishing minority.
II Model
Our model is described as follows.
Individuals are located on a square lattice with periodic boundary conditions. Every individual occupies a lattice point and has four neighboring points. A PGG group is composed of a sponsor and its four neighbors. Thus the size of each PGG group is 5. Each individual participates in five different PGG groups organized by and its four neighbors respectively.
At each time step, every cooperator contributes a unit cost to each involved PGG group. Defectors invest nothing. The total cost of a group is multiplied by a factor , and is then redistributed uniformly to all the five players in this group. In every PGG group, individuals with the majority strategy will punish those with the minority strategy. Each minority in the group is punished with a fine . Following the previous study Chen , we assume that punishers equally share the associated costs. If cooperators are majority and defectors are minority in the group, then each cooperator pays a cost , where is the number of cooperators in the group. Oppositely, if defectors are majority and cooperators are minority in the group, then each defector pays a cost .
We denote ’s strategy as for cooperation and for defection. The payoff that player gains from the group organized by player is calculated by the following equations:
| (1) |
| (2) |
| (3) |
| (4) |
| (5) |
Equation (1) means that there is no punishment when the group is occupied by full cooperators or full defectors. For equations (2) and (3), cooperators punish defectors in the group. While for equations (4) and (5), defectors punish cooperators in the group. The total payoff of the player is calculated by
| (6) |
where denotes the community of neighbors of and itself.
Initially, cooperators and defectors are randomly distributed with the equal probability 0.5. Individuals asynchronously update their strategies in a random sequential order random1 ; random2 ; random3 . Firstly, an individual is randomly selected who obtains the payoff according to the above equations. Next, individual chooses one of its nearest neighbors at random, and the chosen neighbor also acquires its payoff . Finally, individual adopts the neighbor ’s strategy with the probability update0 :
| (7) |
where characterizes the noise introduced to permit irrational choices. Following the previous studies noise1 ; noise2 , we set the noise level to be .
The key quantity for characterizing the cooperative behavior of the system is the fraction of cooperators in the steady state. In our simulation, is obtained by averaging over the last Monte Carlo steps (MCS) of the entire MCS. Each MCS consists of on average one strategy-updating event for all individuals. Each data is obtained by averaging over 20 different realizations.
III Results
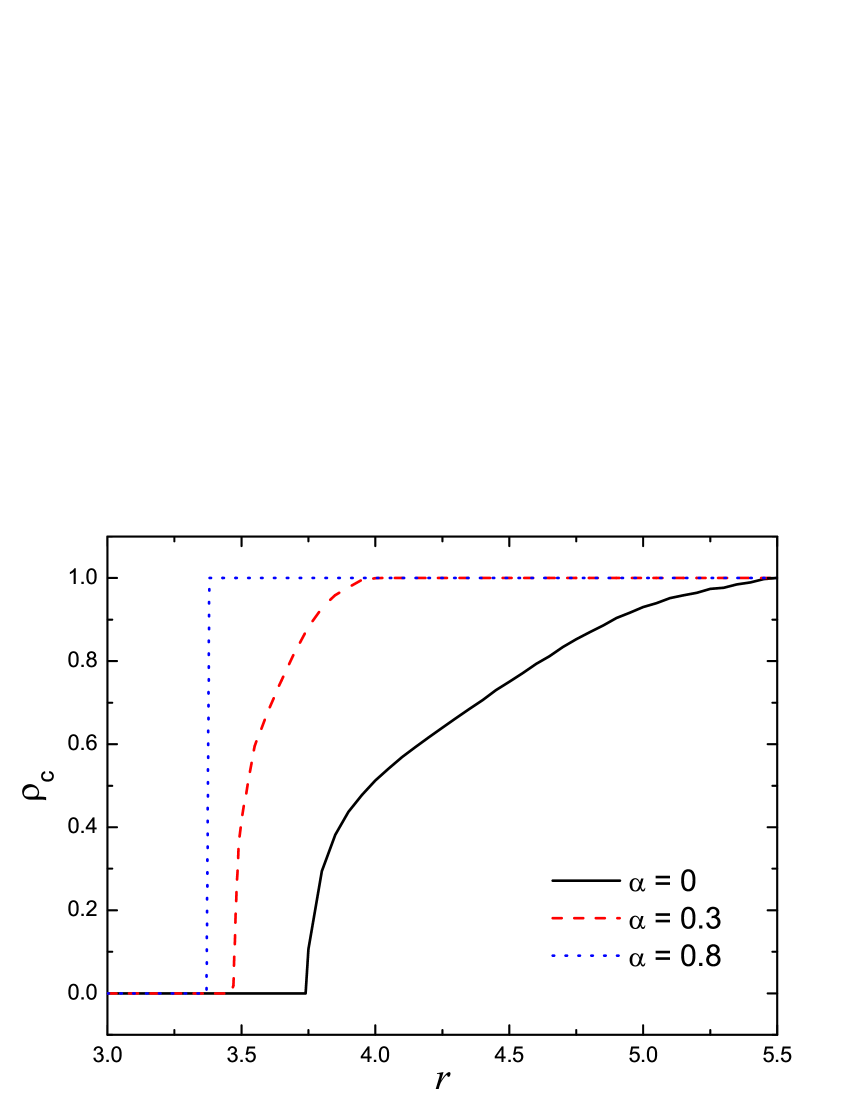

Figure 1 shows the fraction of cooperators as a function of the multiplication factor for different values of the punishment fine . From Fig. 1, one can see that, for no punishment () or a light punishment (e.g., ), continuously increases from 0 to 1 as increases. However, for a severe punishment (e.g., ), there exists an abrupt transition point ( for ), at which suddenly jumps from 0 to 1. For a fixed value of , the payoff difference between the two neighboring nodes is limited when the punishment is light, thus individuals with the minority strategy can survive in the system if their payoffs are larger than that of neighbors with the majority strategy. However, for a severe punishment, the payoff difference between the two different strategies is large, individuals with the local majority strategy gain much more than those with the local minority strategy. In this case, the coexistence of the two different strategies becomes extremely difficult. Once a strategy becomes dominated in the late stage of evolution, it will determinately take over the whole system.
In Fig. 2, we plot the full phase diagram, which can be divided into three regions: full cooperators (), full defectors (), and the coexistence of cooperators and defectors (). Different regions are separated by solid lines. One can see that, the critical value of the multiplication factor below which cooperators die out and the critical value of the multiplication factor above which defectors disappear decrease as the punishment fine increases. At the same time, the region of becomes narrower as the punishment fine increases. Particulary, the region of disappears when , indicating that cooperators and defectors cannot coexist in the case of severe punishment.
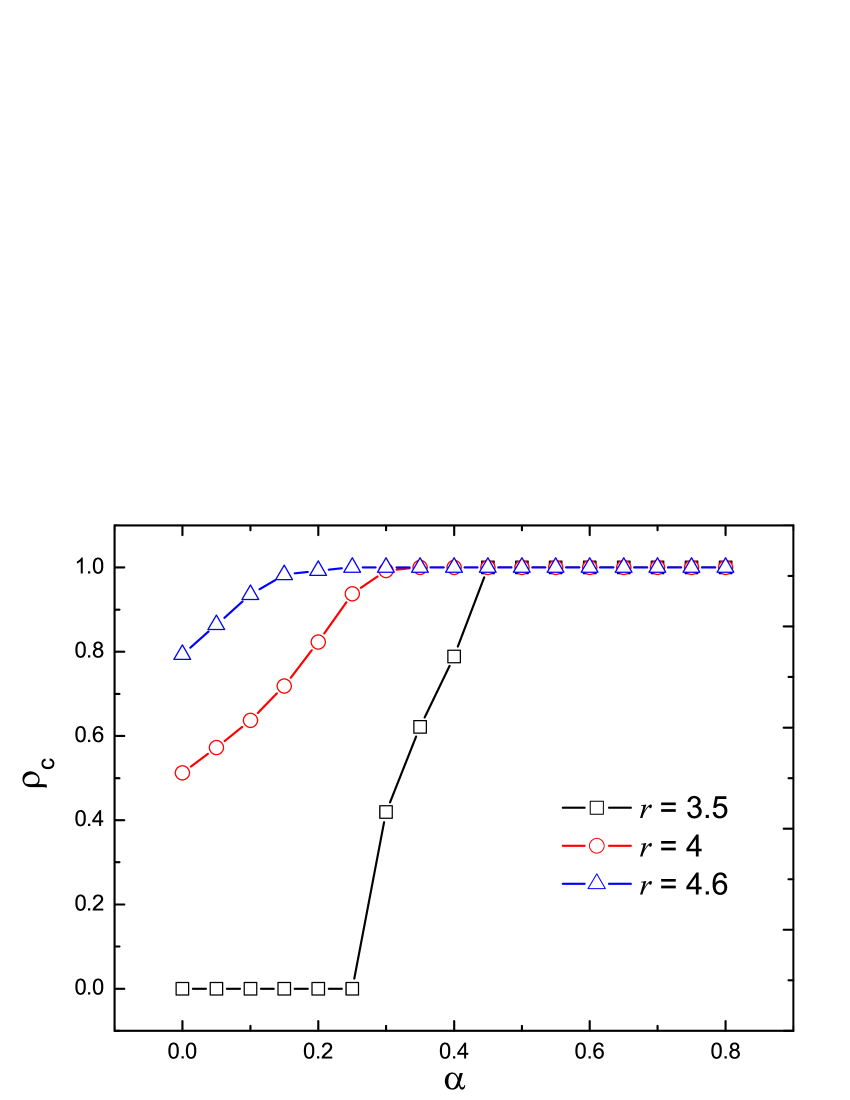
Next, we study how the punishment fine affects the cooperation level. From Fig. 3, one can observe that for a fixed value of the multiplication factor , the fraction of cooperators increases with the punishment fine , manifesting that more severe punishment can better promote cooperation.
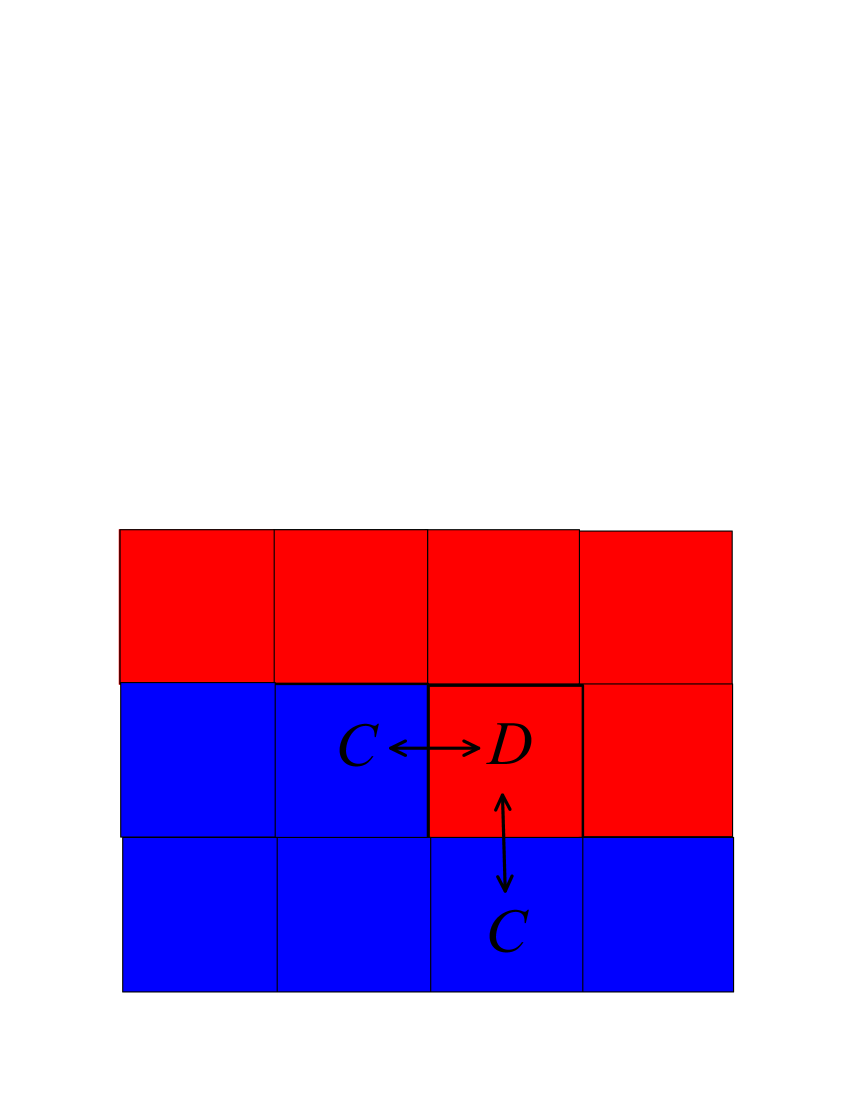
It has been known that the coevolution of cooperator clusters and defector clusters plays an important role in spatial games cluster1 ; cluster2 . In Fig. 4, we plot a typical interface that separate clusters of the two competing strategies. According to the analysis in Ref. Chen , the leading invasions thereby are those which are marked with arrows. The likelihood of other elementary processes is much smaller, and hence their contribution to the evolution of clusters is negligible. According to Fig. 4, the average payoff difference between the two strategies can be calculated as
| (8) |
From Eq. (8), one can find that the value of increases as increases, implying that the cooperator clusters can more effectively invade the defector clusters when punishment is more severe.
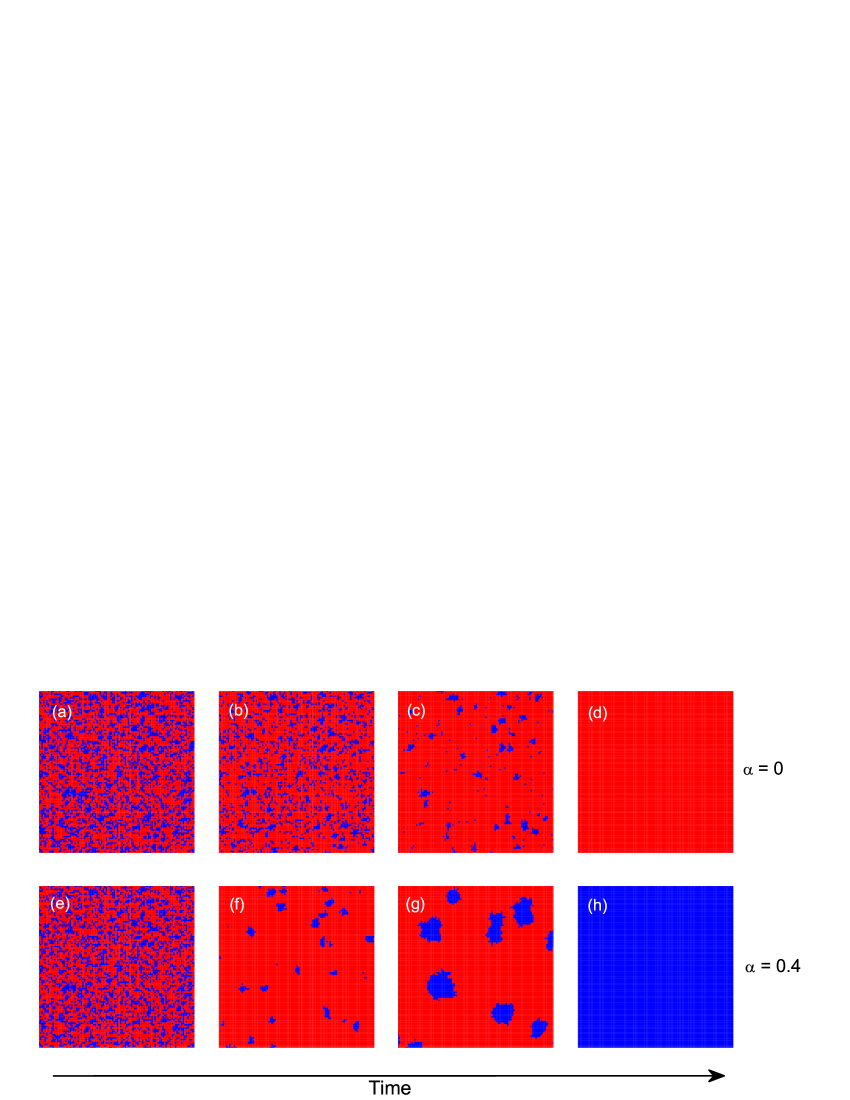
To confirm the above analysis, we plot spatial strategy distributions at different time steps. For , one can observe that cooperators gradually die out, as shown in Figs. 5(a)-(d). For , initially the density cooperators decreases [see Fig. 5(e) and Fig. 5(f)]. With time the cooperator clusters continue to expand [see Fig. 5(g)] and finally occupy the whole system [see Fig. 5(h)]. To more intuitively understand how the punishment fine affects the evolution of clusters, we set initially a giant cooperator (defector) cluster in the left (right) half of square lattices. The multiplication factor is set to be . From Figs. 16(a)-(d), one can see that for the small value of (e.g., ), the defector cluster gradually invades the cooperator cluster and the original one big cooperator cluster is divided into some small clusters. For the large value of (e.g., ), the cooperator cluster continually expands while the defector cluster gradually shrinks [see Fig. 5(e)-(h)]. Note that for , the interfaces separating domains of cooperators and defectors become littery. However, for , the boundary between the two competing clusters remains smooth during the whole evolution. As pointed out in Ref. Perc , noisy borders are beneficial for defectors, while straight domain walls help cooperators to spread. From Figs. 4-5, we can understand why cooperation can be enhanced by enforcing more severe punishment.
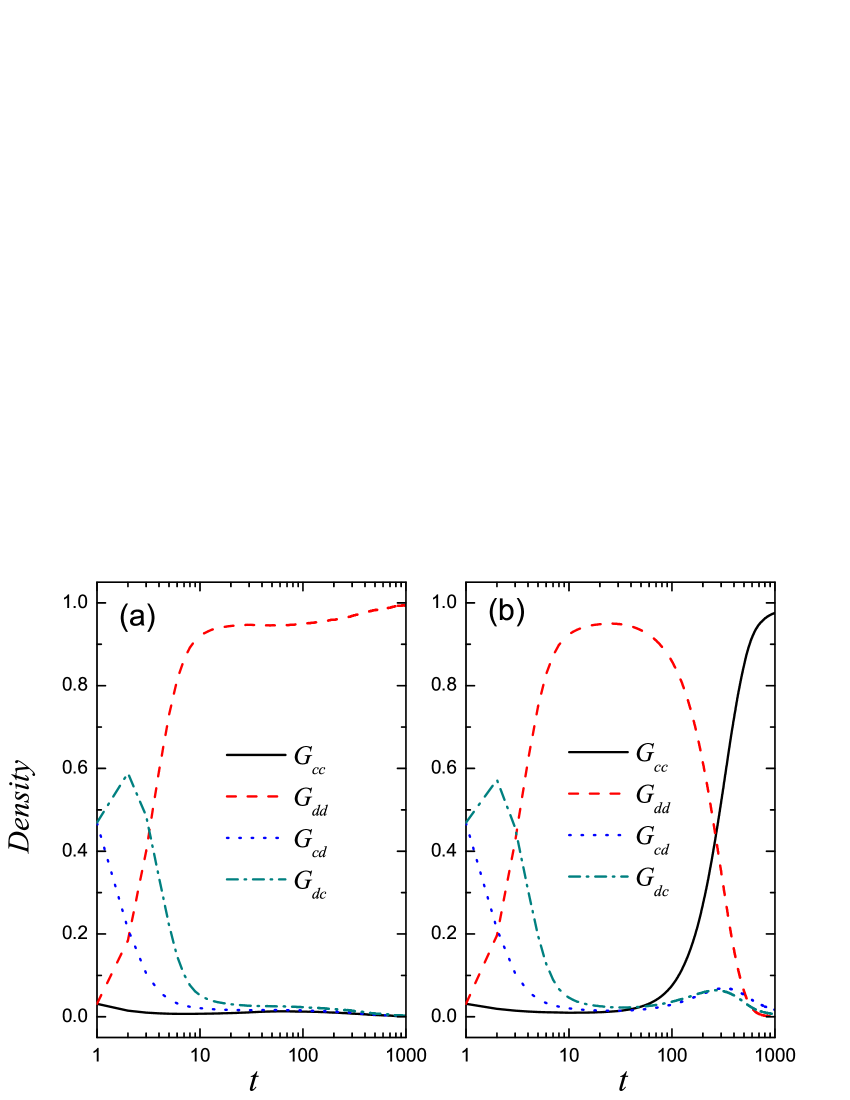
We divide PGG groups into four types: () denotes the group which is fully occupied by cooperators (defectors), and () denotes the group in which cooperators (defectors) punish defectors (cooperators). Figure 6 shows the density of the four types of groups as a function of the time step when the multiplication factor . From Fig. 6(a), one can see that the density of decreases to 0 as time evolves when the punishment fine . However, for [see Fig. 6(b)], the density of firstly decreases and then increases to 1 as time evolves. With time the density of groups increases to 1 for . However, for , the density of groups firstly increases to be close to 1, and then decreases to 0. For both of and , the density of gradually decreases to 0 as time increases. The density of firstly increases and then decreases to 0 as time evolves. During the early evolution (i. e., ), the density of groups is lower than that of groups, indicating that cooperators are more likely to be punished. We need to point out that, although the larger value of is more disadvantageous for cooperators in the initial stage, it can help the surviving cooperator clusters more effectively expand and finally take over the whole system.
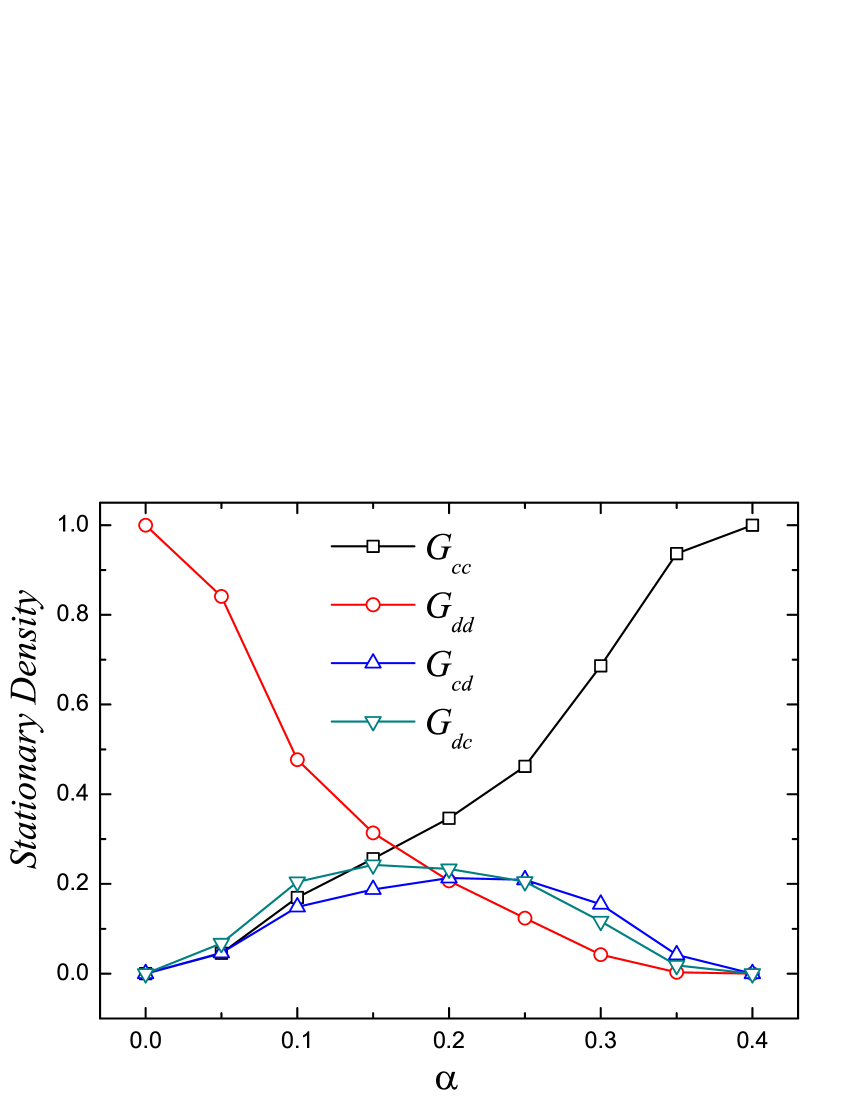
Figure 7 shows the stationary density of the four types of groups as a function of the punishment fine when the multiplication factor . One can see that the density of groups increases with while the stationary density of groups decreases as increases. The stationary density of or groups peaks at the moderate value of . It is interesting to note that, for small values of (), the stationary density of groups is lower than that of groups. On the contrary, for larger values of (), the stationary density of groups is higher than that of groups, indicating that defectors become more likely to be punished.
IV Conclusions and discussions
To summarize, we have proposed a new mechanism of punishment in which individuals with the majority strategy will punish those with the minority strategy in a public goods game group. Note that in our mechanism, an individual can play a dual role. He/She can be a punisher in one group but meanwhile be punished in another group. We find that the cooperation level increases with the punishment fine. Compared to a light punishment, a severe punishment widens the payoff gap between cooperators and defectors along the interface that separates the two competing strategies, thus promotes the expansion of cooperator clusters.
The interplay between opinion dynamics and evolutionary games has received increasing attention. Szolnoki and Perc have found that, suitably follow the majority strategy among neighbors can enhance the cooperation level inter1 ; inter2 . In our work, we propose the punishment rule in which individuals with the majority strategy are able to punish those with minority strategy. Thus, cooperators and defectors could be punished by each other, depending on the compositions in the groups. And then the pro-social and anti-social punishments are both possible in our study. It is thus not intuitive to predict whether cooperation can be promoted in the punishment rule, especially when the complex structured interactions are considered. Interestingly, we find that using the strategy of punishing minority can increase the final cooperation level. In particular, when the punishment fine is high, cooperators can suddenly thrive and thus dominate the population from the outcome of full defection. Together inter1 ; inter2 and our work can provide a deeper understanding of the impact of opinion dynamics on the evolution of cooperation.
Acknowledgements.
This work was supported by the National Natural Science Foundation of China under Grants No. 61403083 and No. 61503062, and the Fundamental Research Funds of the Central Universities of China.References
- (1) Z. Wang, S. Kokubo, M. Jusup, J. Tanimoto, Phys. Life Rev. 14 (2015) 1.
- (2) Z. Wang, C. T. Bauch, S. Bhattacharyya, A. d’Onofrio, P. Manfredi, M. Perc, N. Perra, M. Salathé, D. Zhao, Phys. Rep. 664 (2016) 1.
- (3) M. Perc, J. J. Jordan, D. G. Rand, Z. Wang, S. Boccaletti, A. Szolnoki, Phys. Rep. 687 (2017) 1.
- (4) M. Perc, J. Gómez-Gardeñes, A. Szolnoki, L. M. Floría, Y. Moreno, J R Soc. Interface 10 (2013) 20120997.
- (5) Z. Wang, S. Kokubo, J. Tanimoto, E. Fukuda, K. Shigaki, Phys. Rev. E 88 (2013) 042145.
- (6) Z. Wang, L. Wang, A. Szolnoki, M. Perc, Eur. Phys. J. B 88 (2015) 124.
- (7) G. Szabó, C. Hauert, Phys. Rev. Lett. 89 (2002) 118101.
- (8) Z.-X. Wu, X.-J. Xu, Y. Chen, Y.-H. Wang, Phys. Rev. E 71 (2005) 037103.
- (9) A. Szolnoki, M. Perc, EPL 77 (2007) 30004.
- (10) A. Szolnoki, M. Perc, Phys. Rev. E 77 (2008) 011904.
- (11) Z.-X. Wu, Z. Rong, M. Z. Q. Chen, EPL 110 (2015) 30002.
- (12) M. Perc, A. Szolnoki, New J Phys. 10 (2008) 043036.
- (13) D. Helbing, W. Yu, Proc. Natl. Acad. Sci. USA 106 (2008) 3680.
- (14) X. Chen, A. Szolnoki, M. Perc. Phys. Rev. E 86 (2012) 036101.
- (15) M. Perc, EPL 75 (2006) 841.
- (16) A. Szolnoki, M. Perc, Phys. Rev. E 89 (2014) 022804.
- (17) D. Hao, Z. Rong, T. Zhou. Phys. Rev. E 91 (2015) 052803.
- (18) Z. Rong, Z.-X. Wu, D. Hao, M. Z. Q. Chen, T. Zhou, New J Phys. 17 (2015) 033032.
- (19) C. Wang, L. Wang, J. Wang, S. Sun, C. Xia, Appl. Math. Comput. 293 (2017) 18.
- (20) W.-X. Wang, J. Ren, G. Chen, B.-H. Wang, Phys. Rev. E 74 (2006) 056113.
- (21) W. Ye, W. Feng, C. Lü, S. Fan, Appl. Math. Comput. 307 (2017) 31.
- (22) C.-Y. Xia, S. Meloni, M. Perc, Y. Moreno, EPL 109 (2015) 58002.
- (23) C. Shen, J.Lu, L. Shi, Appl. Math. Comput. 290 (2016) 201.
- (24) Z. Wang, M. Jusup, R.-W. Wang, L. Shi, Y. Iwasa, Y. Moreno, J. Kurths, Sci. Adv. 3 (2017) e1601444.
- (25) C. Hauert, S. De Monte, J. Hofbauer, K. Sigmund, Science 296 (2002) 1129.
- (26) D. Helbing, A. Szolnoki, M. Perc, G. Szabó, New J Phys. 12 (2010) 083005.
- (27) D. Helbing, A. Szolnoki, M. Perc, G. Szabó, Phys. Rev. E 81 (2010) 057104.
- (28) A. Szolnoki, G. Szabo, L. Czako, Phys. Rev. E 84 (2011) 046106.
- (29) A. Szolnoki, M. Perc, J Theor. Biol. 325 (2013) 34.
- (30) A. Szolnoki, M. Perc, Phys. Rev. X 3 (2013) 041021.
- (31) X. Chen, A. Szolnoki, M. Perc, Phys. Rev. E 92 (2015) 012819.
- (32) H.-X. Yang, Z. Rong, Chaos Soliton Fractals 77 (2015) 230.
- (33) A. Szolnoki, G. Szabó, M. Perc, Phys. Rev. E 83 (2011) 036101.
- (34) M. Perc, A. Szolnoki, New J Phys. 14 (2012) 043013.
- (35) X. Chen, A. Szolnoki, M. Perc, New J Phys. 16 (2014) 083016.
- (36) P. Cui, Z.-X. Wu, J Theor. Biol. 361 (2014) 111.
- (37) N. Eisenberger, M. Lieberman, K. Williams, Science 290 (2003) 290.
- (38) L. Somerville, T. Heatherton, W. Kelley, Nat. Neurosci. 9 (2006) 1007.
- (39) Z. Wang, A. Szolnoki, M. Perc, Sci. Rep. 3 (2013) 2470.
- (40) Z. Wang, A. Szolnoki, M. Perc, J Theor. Biol. 349 (2014) 50.
- (41) Z. Wang, L. Wang, M. Perc, Phys. Rev. E 89 (2014) 052813.
- (42) G. Szabó, C. Tőke. Phys. Rev. E 58 (1998) 69.
- (43) A. Szolnoki, M. Perc, Phys. Rev. E 81 (2010) 057101.
- (44) A. Szolnoki, X. Chen, Phys. Rev. E 94 (2016) 042311.
- (45) M. A. Nowak, R. M. May, Nature 359 (1992) 826.
- (46) J. Gómez-Gardeñes, M. Campillo, L. M. Floría, Y. Moreno, Phys. Rev. Lett. 98 (2007) 108103.
- (47) A. Szolnoki, M. Perc, J R Soc. Interface 12 (2015) 20141299.
- (48) A. Szolnoki, M. Perc, Sci. Rep. 6 (2016) 23633.