From identical S- and P-wave spectra
to maximally distinct polarizations:
probing NRQCD with states
Abstract
A global analysis of ATLAS and CMS measurements reveals that, at mid-rapidity, the directly-produced , and J/ mesons have differential cross sections of seemingly identical shapes, when presented as a function of the mass-rescaled transverse momentum, . This identity of kinematic behaviours among S- and P-wave quarkonia is certainly not a natural expectation of non-relativistic QCD (NRQCD), where each quarkonium state is supposed to reflect a specific family of elementary production processes, of significantly different -differential cross sections. Remarkably, accurate kinematic cancellations among the variegated NRQCD terms (colour singlets and octets) of its factorization expansion can lead to a surprisingly good description of the data. This peculiar tuning of the NRQCD mixtures leads to a clear prediction regarding the and polarizations, the only observables not yet measured: they should be almost maximally different from one another, and from the J/ polarization, a striking exception in the global panorama of quarkonium production. Measurements of the difference between the , and J/ polarizations, complementing the observed identity of momentum dependences, represent a decisive probe of NRQCD.
pacs:
11.80.CrKinematical properties (helicity and invariant amplitudes, kinematic singularities, etc.) and 12.38.QkExperimental tests of QCD and 13.20.GdDecays of , , and other quarkonia1 Introduction
The mechanisms behind hadron production continue to challenge our understanding: analytical perturbative QCD calculations are insufficient to tackle all the aspects of the strong interactions driving the binding of quarks into observable particles. Studies of quarkonium production can provide crucial progress towards solving this problem bib:Brambilla:2010cs . According to non-relativistic QCD (NRQCD) bib:NRQCD , one of the theory approaches in this area of QCD phenomenology, S- and P-wave quarkonia are produced from the binding of quark-antiquark pairs created with a variety of quantum numbers, in color singlet or octet configurations. These terms are characterized by significantly different kinematic dependences and polarizations, determined by the short-distance cross sections (SDCs), presently calculated at next-to-leading order (NLO) bib:BKNPB ; bib:BKMPLA ; bib:Chao:2012iv ; bib:Gong:2012ug . They contribute with probabilities proportional to long distance matrix elements (LDMEs), extracted from fits to experimental data. While conceptually appealing and successful in several respects, it has been confusing to see that different groups performing global fits to experimental data extract significantly different matrix elements, despite using identical theory calculations, as a result of using different data fitting strategies bib:BKNPB ; bib:BKMPLA ; bib:Chao:2012iv ; bib:Gong:2012ug . These puzzles and a potential solution were discussed in Ref. bib:FaccioliPLB736 , mostly devoted to the quarkonia least affected by feed-down contributions, the and (3S) states. A detailed data-driven analysis of the cross sections and polarizations of five S-wave and two P-wave states, complemented by an original comparison with theory calculations, was presented in Ref. bib:FaccioliPLB773 . That analysis is extended in this paper to address two main questions: how different and experimentally recognizable are the production mechanisms with respect to those of the and mesons; and how important will be, for the understanding of quarkonium production, new or improved measurements.
2 Data-driven considerations
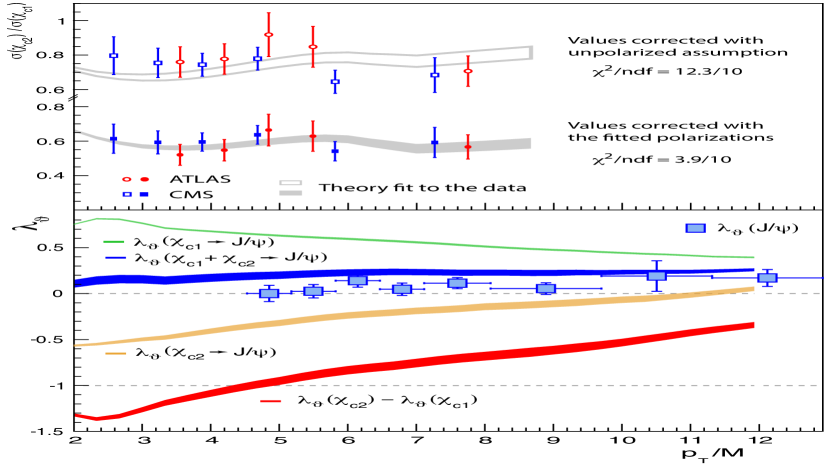
As shown in the top panel of Fig. 1, the and charmonium and bottomonium cross sections measured at the LHC at mid-rapidity show a remarkably uniform pattern as a function of , the ratio between the quarkonium transverse momentum and its mass (Fig. 1 of Ref. bib:FaccioliPLB773 shows the seven independent distributions). Moreover, the corresponding measurements of the quarkonium decay distributions indicate similar polarizations for all S-wave states, independently of their different P-wave feed-down contributions, as expressed by their polar anisotropy parameters, in the helicity frame, shown in the bottom panel.
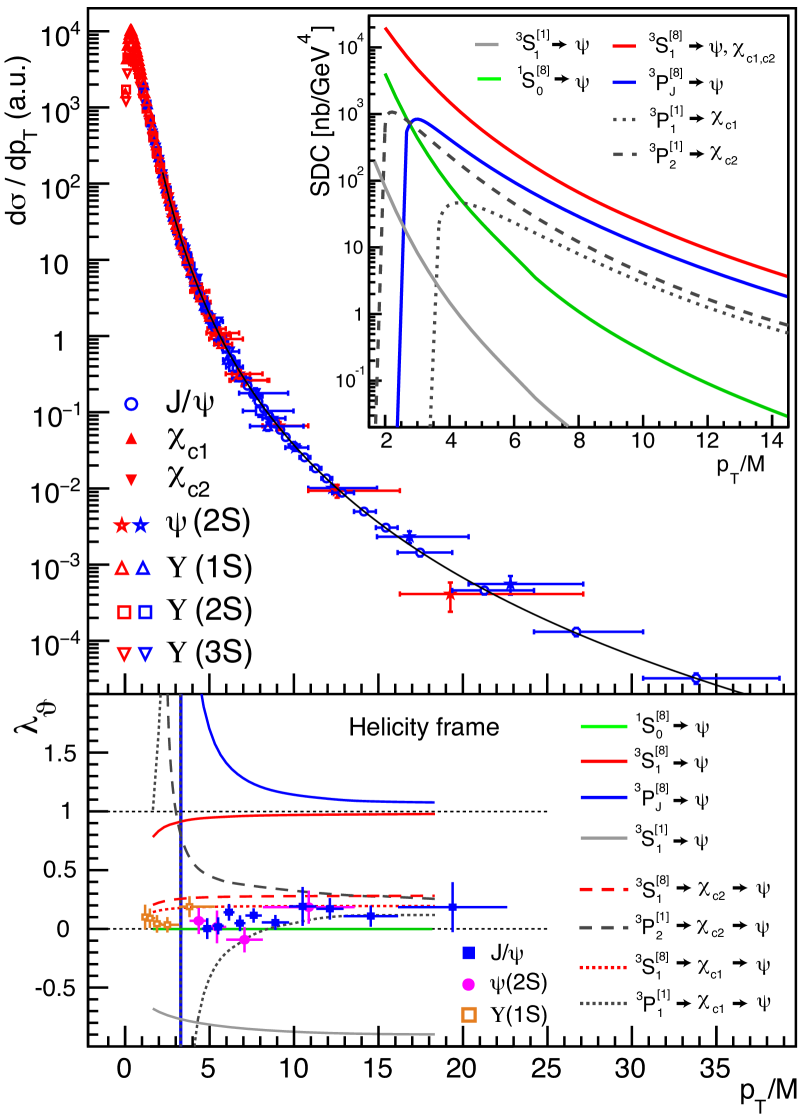
This seemingly “universal” picture of quarkonium production is an unexpected result, when compared to the wide variety of kinematic shapes of the differential cross sections (NLO SDCs) contributing to the observable patterns within the NRQCD framework, as shown in the inset of Fig. 1. The most surprising aspect is that the and P-wave states have, at least at mid-rapidity, distribution shapes indistinguishable from those of the S-wave states. According to the SDCs calculated at NLO, on the other hand, the singlet and octet P-wave terms of the NRQCD expansion, which contribute differently to (), and production, have rather peculiar and differentiated kinematic behaviours, with cross section terms becoming negative above characteristic thresholds and having unphysical polarization parameters (). In advance of any detailed numerical analysis, the qualitative comparison between data and theory illustrated in Fig. 1 indicates that the theory requires precise and seemingly unnatural cancellations between terms of the expansion, in order to reproduce observable cross sections and polarizations that are not only physical but also identical for states of different quantum numbers.
It should be noted that comparing the shapes of seven different quarkonium states, including five S-wave states affected by very different fractions of P-wave feed-down contributions, provides a stronger (more precise) statement regarding the overall equality between S- and P-wave quarkonium production than one might initially expect, given the uncertainties of the and measurements on their own. We will quantify this observation when presenting the results of the charmonium fit.
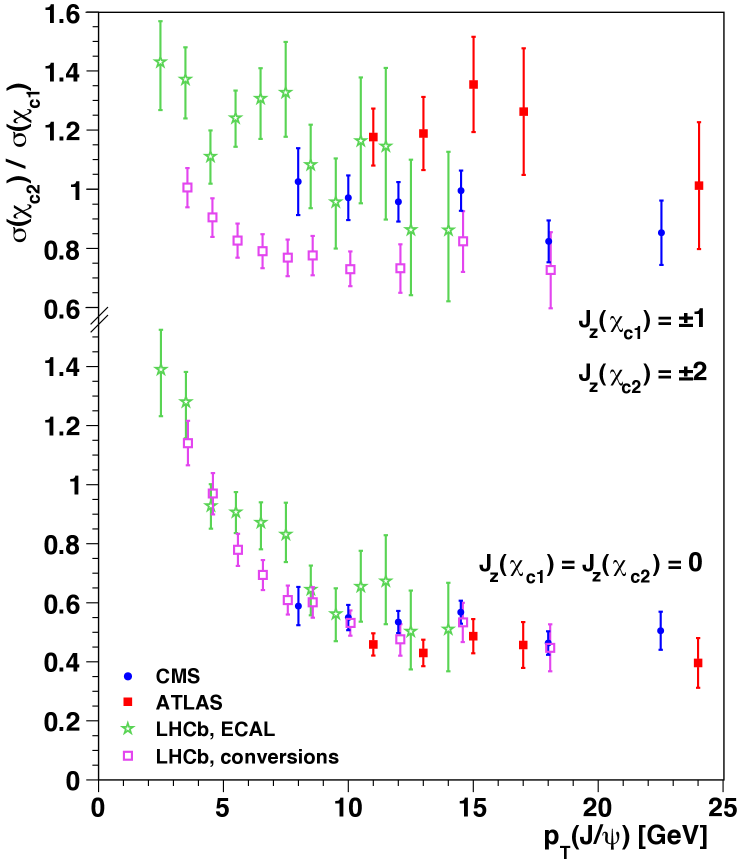
The and polarizations are the main missing element in the current experimental landscape, but two data-driven observations provide indirect indications. First, the , and polarizations are very similar (Fig. 1-bottom), despite the diversity of feed-down fractions (0, 25% bib:ATLASchic ; bib:FLSW_feedown and 40% bib:LHCbChibFeedown , respectively). Assuming that the directly-produced S-wave mesons have very similar production mechanisms, as indicated by the seemingly identical shapes of the -differential cross sections (Fig. 1-top), the plus summed feed-down contributions cannot have a large impact in the observed polarization. The second observation derives from comparing cross-section ratios measured in different experimental acceptances, profiting from their strong sensitivity to the polarization hypothesis used in the acceptance corrections. Interestingly, as seen in Fig. 2, the alignment hypothesis gives the best mutual agreement between the ratios reported by ATLAS and CMS, as well as between the LHCb values obtained using photons detected in the calorimeter or with conversions to pairs. When both are polarized in the limit, the and decays produce strongly polarized mesons, with, respectively, and , leading to a weighted when the feed-down fractions and the cross-section ratio itself are taken into account. These observations suggest that the and polarizations might be a striking exception in the global panorama of high-energy quarkonium production, at least at mid rapidity.
3 Analysis method
To quantify our previous data-driven considerations and compare the results with theory, we perform a simultaneous fit of the mid-rapidity differential cross sections and polarizations, including a detailed account of how the mother’s momentum and polarization are transferred to the daughter in the relevant feed-down decays: ; ; . The analysis is restricted to the charmonium family, given the lack of experimental information on bottomonium feed-down fractions. The rule for the momentum propagation from mother to daughter is, approximately, , where () and () are, respectively, the mass and laboratory transverse momentum of the mother (daughter) particle bib:FaccioliPLB773 . The polarization transfer rules were calculated in the electric dipole approximation and precisely account for the observable dilepton distribution with no need of higher-order terms bib:chiPol . The fit is exclusively based on empirical parametrizations. Perturbative calculations of the production kinematics are not used as ingredients anywhere in our analysis, the outcome of the fit being exclusively determined by the measurements and, therefore, only affected by statistical and systematic experimental uncertainties.
Inspired by the pattern of slightly transverse polarizations seen in Fig. 1, we parametrize the directly-produced and cross section shapes as a superposition of unpolarized () and transversely polarized () processes, being the polar anisotropy parameter of the dilepton decay in the helicity frame bib:EPJC69 : , where , identical for the two charmonia, is the fractional contribution of the polarized process considered at an arbitrary reference point . The shape functions and describe the dependences of, respectively, the unpolarized and polarized yields. Both are normalized to unity at the chosen : , with
| (1) |
The parameter (having the meaning of the average squared) defines the function in the low- turn-on region and is only mildly sensitive to the data we are considering here; hence, in the fit we consider as a common free parameter. The power-law exponent, instead, characterizes the high- shape: for . Therefore, we distinguish the unpolarized and polarized cross sections with two different powers, and , respectively, identical for the and . The relative contributions and shapes of the and functions are constrained by the polarization data. In fact, the polarized yield fraction, equal to at , can be expressed as a function of as .
For the and direct cross sections we use the same general shape parametrization, but without discriminating between polarized and unpolarized contributions, which, in the absence of polarization data, would not be individually constrained by the fit. In short, we consider four contributions to direct quarkonium production, the unpolarized and polarized terms plus the and cross sections, altogether characterized by one and four parameters, , , and . Their theoretical counterparts are, respectively, , , and (where each term indicates the SDC function times the LDME constant), the four leading cross section components foreseen by NRQCD hierarchies for and quarkonium production. However, this parallelism is only a guidance in the parametrization of the fit, not a theoretical input. As discussed in more detail in Ref. bib:FaccioliPLB773 , our approach is very different with respect to fits using the calculated SDC shapes, where the fit results are mostly determined by the -differential cross sections; the less precise polarization data are not included in the fits or have a negligible effect. In our fit, the polarization data, versus , have the exclusive role of constraining both the relative normalizations and the differences in momentum dependence of the polarized and unpolarized contributions. The precision of these data-driven results will evolve as new measurements become available, remaining insensitive to specific theoretical calculations and uncertainties.
Without polarization measurements, the and cross sections cannot help, today, discriminating the and contributions to production and, therefore, relate the parametrized direct- polarization to the measured prompt one. However, the two data-driven observations mentioned above allow us to implement such a relation by adopting an approximate constraint on the total polarization contribution to production. Given that, on average, , we can infer that should be positive, under the assumption that the direct and polarizations are equal. On the other hand, the extreme hypothesis, discussed above, according to which both and are polarized in the limit leads to (which, when weighted by the 25% feed-down fraction of from , is comparable to the average difference ). We can thus be confident that is positive and not larger than 0.3. The results of the fit, and ensuing considerations, are insensitive to variations of (assumed to be -independent) within this range.
The ATLAS and CMS integrated-luminosity uncertainties are (independently) varied as nuisance parameters, following Gaussian functions centred at unity and of widths equal to the relative uncertainties of the published luminosities. These two nuisance parameters multiply all the data points (cross sections) of the respective experiment, thereby correlating the several datasets within each experiment. Moreover, the experiments measured products of cross sections times branching ratios, so that the uncertainties of the branching ratios have also been treated as nuisance parameters (with central values and uncertainties taken from Ref. bib:PDG ), multiplying all relevant data points and representing correlations between ATLAS and CMS.
Another source of correlation between all the points being fitted is the dependence of the detection acceptances on the polarization. For each set of parameter values considered in the fit scan, the expected values of the polarizations and cross sections are calculated, for all states, as functions of , using the shape-parametrization functions described above. The expected values can be immediately compared to the measured ones, for the determination of the corresponding terms, while for the calculation of the cross-section terms we first scale the measured cross sections by acceptance-correction factors calculated for the value under consideration. These correction factors are computed, for each data point, using the tables published by the experiments (for exactly this purpose) for the cross sections of particles produced with fully transverse or fully longitudinal polarization.
The fit has 100 experimental constraints and 20 parameters: 5 shape parameters, 4 normalizations and the fraction , plus 2 luminosity and 8 branching-ratio nuisance parameters.
4 Analysis results
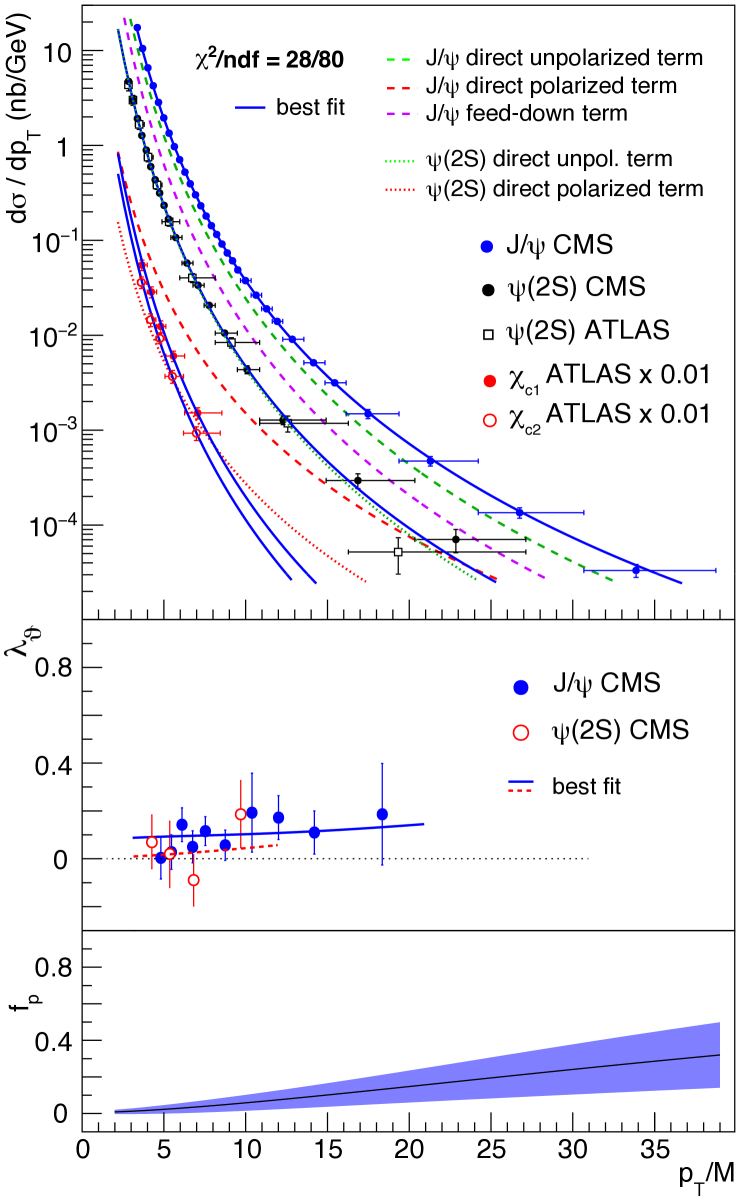
As shown in Fig. 3, the charmonium cross sections and polarizations are described by the fit just presented, with a per degree of freedom of 28/80.
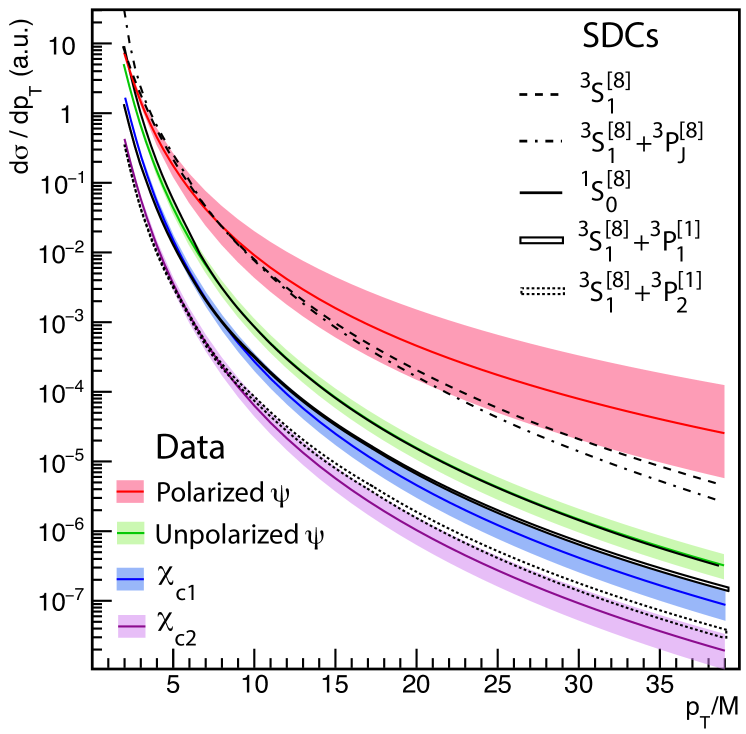
Figure 4 shows the fitted cross section terms as bands of widths reflecting the experimental uncertainties.
A very interesting and non-trivial indication of this purely data-driven fit is that the and distributions are very similar to the unpolarized term dominating production, as quantified by the compatibility of the parameters: , and . This very clear experimental observation is predominantly the result of the perfect compatibility of the (high precision) and shapes, even in ranges beyond those covered by the existing data, reflecting the fact that the prompt mesons are fully directly produced while bib:ATLASchic of the yield comes from decays. In fact, the cross sections are measured at relatively low and with comparatively poor precision. To verify this conclusion, we repeated the fit keeping only one experimental point for each of the two cross sections (chosen in the middle of the measured range), so that these measurements constrain the feed-down fractions at that point but not the shapes. As expected, the fit results for the cross section shapes do not change significantly, with shape parameters remaining the same within the one-sigma range.
The experimental bands for the four observable cross sections are compared with the corresponding NRQCD terms, the dashed/dotted lines corresponding to (combinations of) SDCs calculated at NLO. We emphasize that the two terms of comparison are completely independent, the first being the result of a model-independent fit of experimental data and the second a pure theoretical calculation. The unpolarized and polarized bands are compared with, respectively, the and SDC shapes, calculated at NLO and also including fragmentation corrections representing a partial account of next-to-next-to-leading order processes bib:BodwinCorrections ; bib:Bodwin:2015iua . As illustrated by the dot-dashed line, corresponding to , adding a term leads to steeper shapes, departing from the polarized band more than the term alone. The SDC shape is in remarkable agreement with the experimental “unpolarized” band. Moreover, adding the negative SDCs to the term results in shapes approximating the term, reproducing relatively well the observed similarity between the unpolarized- and patterns.
Before discussing in more detail this data-theory comparison, we will now describe the derivation of the NRQCD curves for the distributions and corresponding polarization predictions. In NRQCD the polarizations and cross sections are functions of one common parameter, equal for all states,
| (2) |
with denoting the LDME. The production cross sections and the spin-density matrix elements have the general form
| (3) |
where denotes the SDC or its spin projection. The are calculated as and , where the depend on through Eq. 3. The parameters refer to the corresponding dilepton decay distributions, which are the ones directly measured and fully reflect the polarization state, while being insensitive to the uncertain contributions of higher-order photon multipoles bib:chiPol .
We determine from the measured ratio, taking into account that the published values strongly depend on the and polarizations assumed for the corrections of the detector’s acceptance. For each considered, we calculate the and polarizations using NLO SDCs and correct the published ratio by the corresponding acceptance ratio. The fit is then calculated comparing the corrected measurement (with statistical and systematic uncertainties, but no “polarization uncertainties”) with the prediction for that value.
Figure 5-top shows how the ratio changes, and the theoretical fit improves, when we use the NRQCD polarization conjecture instead of the unpolarized scenario that the experiments assume to report the measurements. The result of our fit is , much more precise than the value , derived bib:Shao:2014fca using the unpolarized ratios and including the entire spectrum of polarization hypotheses in the experimental uncertainty. The corresponding polarization predictions are shown in Fig. 5-bottom. Interestingly, as decreases, tends to the extreme physical values () and (), in agreement with the alignment scenario suggested by the measured cross-section ratios (Fig. 2): these limit values correspond to two very different decay distribution shapes, but to the same pure angular momentum configuration of the . The from the weighted and feed-downs (blue band) is close to the values measured by CMS (squares) for the prompt sample, implying that the direct and feed-down terms have similar polarizations.
It is quite remarkable to observe that the difference is predicted with a rather high precision and, furthermore, reaches extreme values (around ). In particular, in the GeV region, where experimental measurements will be provided in the near future, the prediction is , implying a strong deviation from the mild polarizations shown in Fig. 1-bottom. Comparing the discriminating power of this result to the corresponding predictions of Ref. bib:Shao:2014fca (Fig. 4), and , one can see the crucial importance of a proper treatment of the uncertainties and correlations affecting the experimental data. It is also relevant to note that, thanks to the cancellation of most experimental systematic uncertainties, the difference can be measured with maximal significance and accuracy.
We will now discuss in more detail the theory-data comparison. To discern shape differences more easily than in the logarithmic-scale plots of Fig. 4, we present in Fig. 6 some of the results in the form of ratios, in a linear scale.
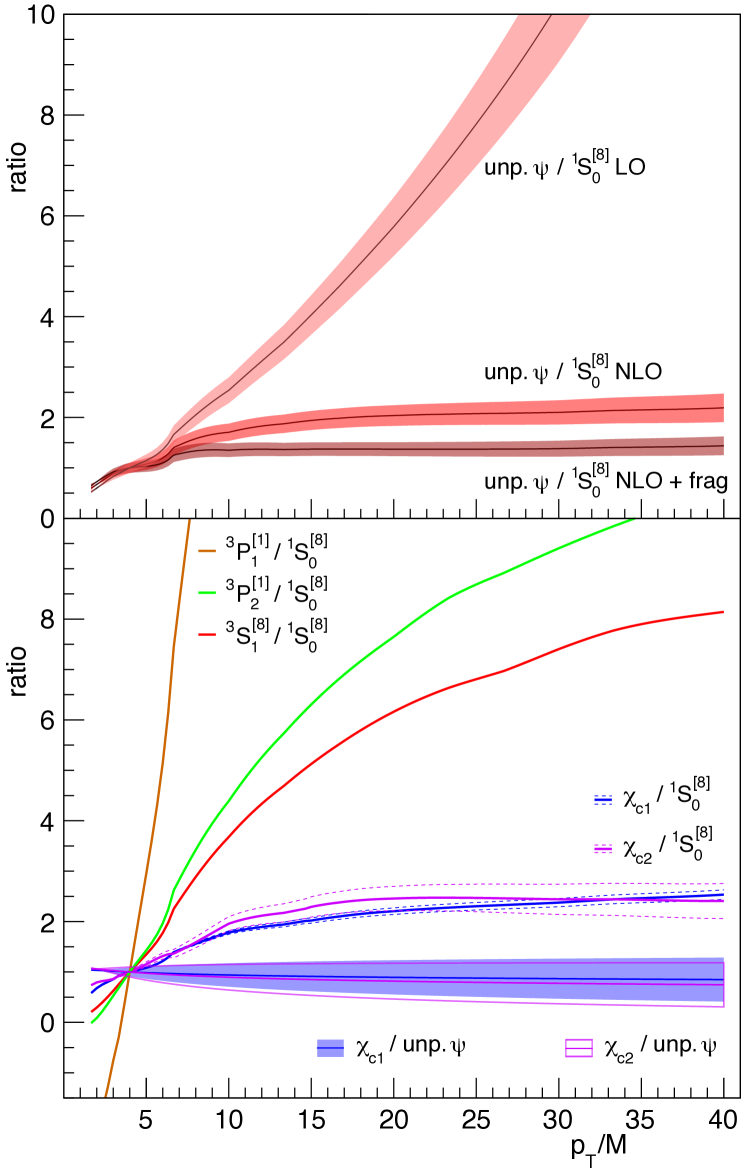
In the top panel, we can see that the ratio between the experimental “unpolarized” band and the state-of-the-art SDC curve (“NLO + frag.” band) only deviates from a perfectly flat function in the low- region (). This effect might represent a residual limitation of current finite-order perturbative calculations, as suggested by the observation that the ratio shows a more pronounced non-flatness when the SDC is calculated at NLO without fragmentation contributions (“NLO” band), and is not flat at all when we use the LO SDC as reference (“LO” band). The differences between these three ratios provide a pedagogical illustration of the improvements made in the successive evolutions of the calculations. The bottom panel shows that the ratios between the measured (blue filled band) or (pink open band) -differential cross sections and the corresponding unpolarized- cross section are practically identical to each other, and essentially flat, offering an effective representation of the strong experimental observation mentioned above. It is interesting to compare these two bands, exclusively determined by the measurements, with the two corresponding (and completely independent) theory ratios, here represented by the (blue and pink) solid lines, calculated as the ratios between suitable combinations of the and SDCs (analogous to the or ) and the SDC (analogous to the unpolarized-). The dashed curves surrounding the solid ones reflect the 1.3% uncertainty on , already shown in Fig. 4. Also this ratio deviates from a flat function in the lower part of the range, but this deviation is a relatively small effect, as can be judged by comparing it with the corresponding rate of increase of the individual components, (red curve) and (brown and green curves). It is actually quite remarkable to see how effective is the mutual cancellation of the individual (steep) variations, in the combinations pertinent to the and states. Also taking into consideration that the P-wave SDCs seem to be affected by a slower convergence of the perturbative series than the S-wave SDCs bib:Bodwin:2015iua , the present level of agreement between the shapes of the -to- predicted ratios and the corresponding -to-unpolarized- measured bands can be considered very promising. As a matter of fact, and despite the initial impression of unnecessary complexity expressed by Fig. 1, we see that NRQCD provides predictions that are, already today, very close to reproducing the uniformity of the observed trends, as well as the small measured S-wave polarizations. This unexpected agreement is the result of a series of cancellations, which, given their fragile and unstable nature, must be tested with precise ingredients. Further improvements in the perturbative calculations, especially for the P-wave SDCs, are needed for more conclusive statements.
5 Summary
The and states have, both, distributions well compatible with being identical to the one of the mesons. This conclusion results from the study of the full set of charmonium data and has a much higher significance than one would obtain if only considering the cross section measurements, given their limited precision and coverage in comparison to the and measurements. This is a very specific and non-trivial experimental observation, seemingly in contradiction, at least a priori, with the expectations of NRQCD, given the significantly different shapes of the relevant SDCs. For example, the ratios between the and SDCs, dominant terms of the factorization expansion for production, to the SDC, very well describing and production, have an order-of-magnitude increase from low to high . Therefore, within NRQCD, one would a priori expect different dependences for the , and states. Remarkably, thanks to mutual cancellations of the steep SDC shapes differences, NLO NRQCD calculations approximately reproduce the similarity betwen the , and cross setions shapes, giving a satisfactory description of charmonium production as measured at mid-rapidity by the ATLAS and CMS experiments.
On the other hand, at the present state of the SDC calculations and within the limits of the currently adopted expansion, this agreement comes with a definite prediction of strong and opposite and polarizations. It is worth restating this conclusion with different words. The and differential cross sections have dependences compatible with being identical to the distribution, an experimental observation that NRQCD (given the presently available NLO SDCs) can only reproduce in a very specific and non-trivial configuration, leading to a remarkable prediction: the and polarizations are as different from each other as physically possible.
If confirmed experimentally, through an accurate measurement of the variable , the existence of strong and polarizations (an exception among all quarkonia observed by high- experiments) would be a big step forward to confirm the existence of the diversified and polarized processes that are at the heart of NRQCD. If, instead, similar and weak and polarizations will be measured, it will be crucial to investigate if the predicted strong and opposite polarizations, experimentally falsified, are caused by approximations and inaccuracies of the presently available fixed-order perturbative calculations or from problems in the conceptual foundations of the theory. In that case, NRQCD would be facing a big challenge: even if future improvements of the P-wave SDC calculations would eventually make the and polarization predictions compatible with the measurements (e.g., building upon the recent progress on fragmentation corrections bib:Bodwin:2015iua ) one would still think that the homogeneity of the observed kinematic patterns deserves a more natural theoretical explanation than a series of “coincidences” cancelling out the variegated complexity of NRQCD. In either case, accurate measurements of the and polarizations constitute a decisive test of NRQCD.
Acknowledgements.
H.-S. Shao kindly provided the NLO SDC calculations. The work of I.K. is supported by FWF, Austria, through the grant P 28411-N36.References
- (1) N. Brambilla et al. Eur. Phys. J. C71 (2011) 1534, arXiv:1010.5827, and references therein.
- (2) G.T. Bodwin, E. Braaten, and P. Lepage Phys. Rev. D51 (1995) 1125, arXiv:hep-ph/9407339. [Erratum: Phys. Rev. D55, 5853 (1997)].
- (3) M. Butenschön and B. Kniehl Nucl. Phys. Proc. Suppl. 222 (2012) 151, arXiv:1201.3862.
- (4) M. Butenschön and B. Kniehl Mod. Phys. Lett. A28 (2013) 1350027, arXiv:1212.2037.
- (5) K.-T. Chao et al. Phys. Rev. Lett. 108 (2012) 242004, arXiv:1201.2675.
- (6) B. Gong, L.-P. Wan, J.-X. Wang, and H.-F. Zhang Phys. Rev. Lett. 110 (2013) 042002, arXiv:1205.6682.
- (7) P. Faccioli et al. Phys. Lett. B736 (2014) 98, arXiv:1403.3970.
- (8) P. Faccioli et al. Phys. Lett. B773 (2017) 476, arXiv:1702.04208.
- (9) ATLAS Coll. JHEP 09 (2014) 079, arXiv:1407.5532.
- (10) ATLAS Coll. Phys. Rev. D87 (2013) 052004, arXiv:1211.7255.
- (11) ATLAS Coll. JHEP 07 (2014) 154, arXiv:1404.7035.
- (12) CMS Coll. Phys. Rev. Lett. 114 (2015) 191802, arXiv:1502.04155.
- (13) CMS Coll. Phys. Lett. B749 (2015) 14, arXiv:1501.07750.
- (14) H.-S. Shao, Y.-Q. Ma, K. Wang, and K.-T. Chao Phys. Rev. Lett. 112 (2014) 182003, arXiv:1402.2913.
- (15) H.-S. Shao Comput. Phys. Commun. 198 (2016) 238, arXiv:1507.03435.
- (16) CMS Coll. Phys. Lett. B727 (2013) 381, arXiv:1307.6070.
- (17) CMS Coll. Phys. Rev. Lett. 110 (2013) 081802, arXiv:1209.2922.
- (18) P. Faccioli, C. Lourenço, J. Seixas, and H. Wöhri JHEP 10 (2008) 004, arXiv:0809.2153.
- (19) LHCb Coll. Eur. Phys. J. C74 (2014) 3092, arXiv:1407.7734.
- (20) CMS Coll. Eur. Phys. J. C72 (2012) 2251, arXiv:1210.0875.
- (21) LHCb Coll. Phys. Lett. B714 (2012) 215, arXiv:1202.1080.
- (22) LHCb Coll. JHEP 10 (2013) 115, arXiv:1307.4285.
- (23) P. Faccioli, C. Lourenço, J. Seixas, and H. Wöhri Phys. Rev. D83 (2011) 096001, arXiv:1103.4882.
- (24) P. Faccioli, C. Lourenço, J. Seixas, and H. Wöhri Eur. Phys. J. C69 (2010) 657, arXiv:1006.2738.
- (25) Particle Data Group Chin. Phys. C40 (2016) 100001.
- (26) G.T. Bodwin, H.S. Chung, U.-R. Kim, and J. Lee Phys. Rev. Lett. 113 (2014) 022001, arXiv:1403.3612.
- (27) G.T. Bodwin et al. Phys. Rev. D93 (2016) 034041, arXiv:1509.07904.