Data Dwarfs:
A Lens Towards Fully Understanding
Big Data and AI Workloads
Edited By
Wanling Gao
Jianfeng Zhan
Lei Wang
Chunjie Luo
Daoyi Zheng
Fei Tang
Biwei Xie
Chen Zheng
Qiang Yang
Software Systems Laboratory (SSL), ACS
ICT, Chinese Academy of Sciences
Beijing, China
http://prof.ict.ac.cn/ssl
Technical Report No. ACS/SSL-2017-3
May 3, 2018
Abstract
The complexity and diversity of big data and AI workloads make understanding them difficult and challenging. This paper proposes a new approach to characterizing big data and AI workloads. We consider each big data and AI workload as a pipeline of one or more classes of unit of computations performed on different initial or intermediate data inputs. Each class of unit of computation captures the common requirements while being reasonably divorced from individual implementations, and hence we call it a data dwarf. For the first time, among a wide variety of big data and AI workloads, we identify eight data dwarfs that takes up most of run time, including Matrix, Sampling, Logic, Transform, Set, Graph, Sort and Statistic. We implement the eight data dwarfs on different software stacks as the micro benchmarks of an open-source big data and AI benchmark suite, and perform comprehensive characterization of those data dwarfs from perspective of data sizes, types, sources, and patterns as a lens towards fully understanding big data and AI workloads.
1 Introduction
The complexity and diversity of big data and AI workloads make understanding them difficult and challenging. First, modern big data and AI workloads expand and change very fast, and it is impossible to create a new benchmark or proxy for every possible workload. Second, whatever early in the architecture design process or later in the system evaluation, it is time-consuming to run a comprehensive benchmark suite. The complex software stacks of the modern workloads aggravate this issue. The big data benchmark suites like BigDataBench [1] or CloudSuite [2] are too huge to run on simulators and hence challenge time-constrained simulation and even make it impossible. Third, too complex workloads are not helpful for both reproducibility and interpretability of performance data in benchmarking systems.
Identifying abstractions of time-consuming units of computation is an important step toward fully understanding complex workloads. Much previous work [3, 4, 5, 6, 7] has illustrated the importance of abstracting workloads in corresponding domains. TPC-C [4] is a successful benchmark built on the basis of frequently-appearing operations in the OLTP domain. HPCC [8] adopts a similar method to design a benchmark suite for high performance computing. Unfortunately, to the best of our knowledge, none of previous work has identified time-consuming classes of unit of computation in big data and AI workloads. National Research Council proposed seven major tasks in massive data analysis [9], while they are macroscopical definition of problems from the perspective of mathematics. , rather than identifying time-consuming classes of unit of computation in Big Data and AI workloads .
In this paper, we propose a new approach to characterize big data and AI workloads. We consider each big data and AI workload as a pipeline of one or more classes of unit of computation on different initial or intermediate data inputs, each of which captures the common requirements while being reasonably divorced from individual implementations. We call this abstraction a data dwarf. Significantly different from the traditional kernels, a data dwarf’s behaviors are affected by the sizes, patterns, types, and sources of different data inputs; moreover it reflects not only computation patterns, memory access patterns, but also disk and network I/O patterns.
After thoroughly analyzing a majority of workloads in five
typical big data application domains (search engine, social network, e-commerce, multimedia and bioinformatics), we identify eight data dwarfs that takes up most of run time,
including Matrix, Sampling, Logic, Transform,
Set, Graph, Sort and Statistic, the combinations of which describe most of big
data and AI workloads we investigated.
Considering various data inputs—text, sequence, graph, matrix and image data—with different data types and distributions, we implement eight dwarfs on different software stacks, including Hadoop [10], Spark
[11], TensorFlow [12] and POSIX-thread (Pthread) [13]. For big data, the implemented data dwarfs include sort (Sort), wordcount (Statistics), grep (Set), MD5 hash (Logic), matrix multiplication (Matrix), random sampling (Sampling), graph traversal (Graph) and FFT transformation (Transform), while for AI, we implement 2-dimensional convolution (Transform), max pooling (Sampling), average pooling (Sampling), ReLU activation (Logic), sigmoid activation (Matrix), tanh activation (Matrix), fully connected (Matrix), and element-wise multiplication (Matrix), which are frequently-used computation in neural network modelling. We release the implemented data dwarfs as the micro benchmarks of an open-source big data benchmark suite. In the rest of paper, we use the big data dwarfs to indicate the dwarf implementations for big data, and use the AI dwarfs to indicate the dwarf implementations for AI.
Just like relation algebra in database, the data dwarfs are promising fundamental concepts and tools for benchmarking, designing, measuring, and optimizing big data and AI systems. In this paper, we call attention to performing comprehensive characterization of those data dwarfs from perspective of data sizes, types, sources, and patterns as a lens towards fully understanding big data and AI workloads. On a typical state-of-practice processor: Intel Xeon E5-2620 V3, we comprehensively characterize all data dwarf implementations and identify their bottlenecks.
Our contributions are five-fold as follows:
-
•
We identify eight data dwarfs through profiling a wide variety of big data and AI workloads.
-
•
We provide diverse data dwarf implementations on the software stacks of Hadoop, Spark, TensorFlow, Pthread.
-
•
From the system and micro-architecture perspectives, we comprehensively characterize the behaviors of data dwarfs and identify their bottlenecks. We find that these data dwarfs cover a wide variety of performance space, from the perspectives of system and micro-architecture behaviors. Moreover, the behavior of each dwarf is not only influenced by its algorithm, but also largely affected by the type, source, size, and pattern of input data.
-
•
From the system aspect, we find that some AI dwarfs like convolution, fully-connected are CPU-intensive, while the other AI dwarfs are not CPU-intensive, such as Relu, Sigmoid used as activation layer. Further, the AI dwarfs have little pressure on disk I/O, since they load a batch (e.g. 128 images) from disk every iteration.
-
•
From the micro-architecture aspect, we find that these dwarfs show various computation and memory access patterns, exploiting different parallelism degrees of ILP and MLP. With the data size expands, the percentage of frontend bound decreases while the backend bound increases.
The rest of the paper is organized as follows. Section 2 illustrates the motivation of identifying data dwarfs. Section 3 introduces data dwarf identification methodology. Section 4 performs system and micro-architecture evaluations on the data dwarf implementations. In Section 5, we report the data impact on the data dwarfs’ behaviors from perspectives of data size, data pattern, data type and data source. Section 6 introduces the related work. Finally, we draw a conclusion in Section 7.
2 Motivation
We take two examples to explain why we should call attention to performing comprehensive characterization of those data dwarfs.
2.1 SIFT Workload in Computer Vision
SIFT [14] is a typical workload for feature extraction, and widely used to detect local features of input images.
Fig. 1 shows the computation dependency graph and run time breakdown of SIFT workload. In total, SIFT involves five data dwarfs. Gaussian filters with different space scale factors are used to generate a group of image scale spaces, through the convolution with the input image. Image pyramid is to downsample these image scale spaces. DOG image means difference-of-Gaussian image, which is produced by matrix subtraction of adjacent image scale spaces in image pyramid. After that, every point in one DOG scale space would sort with eight adjacent points in the same scale space and points in adjacent two scale spaces, to find the key points in the image. Through profiling, we find that computes descirptors, finds keypoints and builds gaussian pyramid are three main time-consuming parts of the SIFT workload. Furthermore, we analyze those three parts and find they are consist of several classes of unit of computation, like Matrix, Sampling, Transform, Sort and Statistics, summing up to 83.23% of the total SIFT run time.
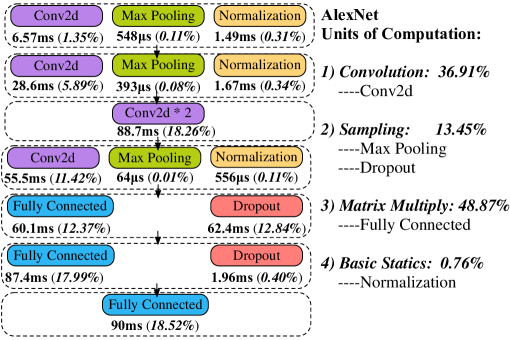
2.2 AlexNet in AI
AlexNet [15] is a representative and widely-used convolutional neural network in deep learning. In total, it has eight layers, including five convolutional layers and three fully connected layers.
We profile one iteration of the AlexNet workload (implemented with TensorFlow) using TensorBoard toolkit and report its computation dependency graph and run time breakdown, as shown in Fig. 2. For each operator, we report its run time and its percentage of the total run time, such as 6.57 ms and 1.35% for the first convolution operator. We find that each iteration involves Transform (conv2d), Sampling (max pooling, dropout), Statistics (normalization), and Matrix (fully connected). Among them, matrix and transform computations occupy a large proportion—48.87% and 36.91%, respectively.
Through the analysis above, we have the following observation. Though big data and AI workloads are very complex and fast-changing, we can consider them as a pipeline of one or more fundamental classes of unit of computation performed on different initial or intermediate data inputs. Those classes of unit of computation, which we call data dwarfs, occupy most of the run time of the workloads, so we should pay more attention to them. In the next section, we will investigate more extensive big data and AI workloads, and elaborate the design of data dwarfs.
3 Methodology
Data dwarfs are frequently-appearing classes of unit of computation handling different data inputs. In this section, we illustrate how to identify data dwarfs from big data and AI workloads, and illustrate our data dwarf implementations.
3.1 Dwarf Identification Methodology
Fig. 3 overviews the methodology of dwarf identification. We first single out a broad spectrum of big data and AI workloads through investigating five typical application domains (search engine, social network, e-commerce, multimedia, and bioinformatics) and representative algorithms in four processing techniques (machine learning, data mining, computer vision and natural language processing). Then we analyze and profile these workloads. On one hand, we decompose the algorithm into a pipeline of units of computations and focus on the input/intermediate data as well. On the other hand, we profile the workload to analyze the computation dependency graph and run time breakdown.
According to the units of computation pipeline and run time breakdown, we finalize eight big data and AI dwarfs, which are essential computations that take up most of run time. Table 1 shows the importance of eight data dwarfs in a majority of big data and AI workloads. Note that previous work [16] has identified four basic units of computation in online service, including get, put, post, delete. We don’t include those four in our dwarf set.
| Catergory | Application Domain | Workload | Unit of Computation |
| Deep Learning | Image Recognition Speech Recognition | Convolutional neural network(CNN) | Matrix, Sampling, Transform |
| Deep belief network(DBN) | Matrix, Sampling | ||
| Graph Mining | Search Engine Community Detection | PageRank | Matrix, Graph, Sort |
| BFS, Connected component(CC) | Graph | ||
| Dimension Reduction | Image Processing Text Processing | Principal components analysis(PCA) | Matrix |
| Latent dirichlet allocation(LDA) | Statistics, Sampling | ||
| Recommendation | Association Rules Mining Electronic Commerce | Aporiori | Statistics, Set |
| FP-Growth | Graph, Set, Statistics | ||
| Collaborative filtering(CF) | Graph, Matrix | ||
| Classification | Image Recognition Speech Recognition Text Recognition | Support vector machine(SVM) | Matrix |
| K-nearest neighbors(KNN) | Matrix, Sort, Statistics | ||
| Naive bayes | Statistic | ||
| Random forest | Graph, Statistics | ||
| Decision tree(C4.5/CART/ID3) | Graph, Statistics | ||
| Clustering | Data Mining | K-means | Matrix, Sort |
| Feature Preprocess | Image Processing Signal Processing Text Processing | Image segmentation(GrabCut) | Matrix, Graph |
| Scale-invariant feature transform(SIFT) | Matrix, Transform, Sampling, Sort, Statistics | ||
| Image Transform | Matrix, Transform | ||
| Term Frequency-inverse document frequency (TF-IDF) | Statistics | ||
| Sequence Tagging | Bioinformatics Language Processing | Hidden Markov Model(HMM) | Matrix |
| Conditional random fields(CRF) | Matrix, Sampling | ||
| Indexing | Search Engine | Inverted index, Forward index | Statistics, Logic, Set, Sort |
| Encoding/Decoding | Multimedia Processing Security Cryptography Digital Signature | MPEG-2 | Matrix, Transform |
| Encryption | Matrix, Logic | ||
| SimHash, MinHash | Set, Logic | ||
| Locality-sensitive hashing(LSH) | Set, Logic | ||
| Data Warehouse | Business intelligence | Project, Filter, OrderBy, Union | Set, Sort |
3.2 Eight Data Dwarfs
In this subsection, we summarize eight data dwarfs frequently appearing in big data and AI workloads.
Matrix In big data and AI workloads, many problems involve matrix computations, such as matrix multiplication and matrix transposition.
Sampling Sampling plays an essential role in big data and AI processing, which obtain an approximate solution when one problem cannot be solved by using analytical method.
Logic We name computations performing bit manipulation as logic computations, such as hash, data compression and encryption.
Transform The transform computations here mean the conversion from the original domain (such as time) to another domain (such as frequency). Common transform computations include discrete fourier transform (DFT), discrete cosine transform (DCT) and wavelet transform.
Set In mathematics, set means a collection of distinct objects. Likewise, the concept of set is also widely used in computer science. For example, similarity analysis of two data sets involves set computations, such as Jaccard similarity. Furthermore, fuzzy set and rough set play very important roles in computer science.
Graph A lot of applications involve graphs, with nodes representing entities and edges representing dependencies. Graph computation is notorious for having irregular memory access patterns.
Sort Sort is widely used in many areas. Jim Gray thought sort is the core of modern databases [6], which shows its fundamentality.
Statistics Statistic computations are used to obtain the summary information through statistical computations, such as counting and probability statistics.
3.3 Data Dwarf Implementations
Data dwarfs are the fundamental components of big data and AI workloads, which is of great significance for evaluation, considering the complexity and diversity of big data and AI workloads. We provide the data dwarf implementations for big data and AI separately, according to their computation specialties. For the big data dwarf implementations, we provide Hadoop [10], Spark [11], and Pthreads [13] implementations. These data dwarfs include sort, wordcount, grep, MD5 hash, matrix multiplication, random sampling, graph traversal and FFT transformation. For the AI dwarfs, we provide TensorFlow [12] and Pthread implementations, including 2-dimensional convolution, max pooling, average pooling, relu activation, sigmoid activation, tanh activation, fully connected (matmul), and element-wise multiply. We consider the impact of data input from the perspectives of type, source, size, and pattern. Among them, data type includes structure, un-structured, and semi-structured data. Data source indicates the data storage format, including text, sequence, graph, matrix, and image data. Data pattern includes the data distribution, data sparsity. As for data size, we provide big data generators for text, sequence, graph and matrix data to fulfill different size requirements.
4 Characterization
In this section, we evaluate data dwarfs with various software stacks from the perspectives of both system and architecture behaviors.
4.1 Experiment Setups
We deploy a three-node cluster, with one master node and two slave nodes. They are connected using 1Gb Ethernet network. Each node is equipped with two Intel Xeon E5-2620 V3 (Haswell) processors, and each processor has six physical out-of-order cores. The memory of each node is 64 GB. The operating system, software stacks and gcc versions are as follows: CentOS 7.2 (with kernel 4.1.13); JDK 1.8.0_65; Hadoop 2.7.1; Spark 1.5.2; tensorFlow 1.0; GCC 4.8.5. The data dwarfs implemented with Pthread are compiled using ”-O2” option for optimization. The hardware and software details are listed in Table 2. Since Pthread is a multi-thread programming model, we evaluate both the TensorFlow and Pthread implementations of AI dwarfs on one node for apple-to-apple comparison.
| Hardware Configurations | |||
|---|---|---|---|
| CPU Type | Intel CPU Core | ||
| Intel ®Xeon E5-2620 V3 | 12 cores@2.40G | ||
| L1 DCache | L1 ICache | L2 Cache | L3 Cache |
| 12 32 KB | 12 32 KB | 12 256 KB | 15MB |
| Memory | 64GB,DDR4 | ||
| Disk | SATA@7200RPM | ||
| Ethernet | 1Gb | ||
| Hyper-Threading | Disabled | ||
4.2 Experiment Methodology
We evaluate eight big data dwarfs implemented with Hadoop, Spark, and eight AI data dwarfs implemented with TensorFlow and Pthread. Note that we use the optimal configurations for each software stack, according to the cluster scale and memory size. The data configuration and selected metrics are listed as follows.
Data Configuration To evaluate the impacts of data input comprehensively, we evaluate the data dwarfs with three data sizes: Small, Medium, and Large. For the graph dwarf, Small, Medium, Large is , and -vertex, respectively. For the matrix dwarf, we use 100, 1K and 10K two-dimensional matrix data with the same distribution and sparsity. For the transform dwarf, we use 16384, 32768 and 65536 two-dimension matrix data. For the other big data dwarfs, we use 1, 10 and 100 GB wikipedia text data, respectively. For the AI dwarfs, we use three configurations in terms of input tensor sizes and channels. They are (224*224,64), (112*112,128) and (56*56,256). Among them, the first value indicates the dimension of input tensor, the second value indicates the channels, and all of them use 128 as batch size. We choose these three configurations because they are widely used in neural network models [17]. Note that the dimension for all input tensors is 224 for Large configuration, 112 for Medium configuration and 56 for Small configuration. For the Pthread-version AI dwarfs, we use 1K, 10K, 100K images from ImageNet [18]. In the following sections, we characterize the system and micro-architectural behaviours of data dwarfs with the Large data size. In Section 5, we will analyze the impact of data input on characteristics with all data sizes.
System and Micro-architecture Metrics We characterize the system and micro-architectural behaviors [19] of the data dwarfs, which is significant for design and optimization [20]. For system evaluation, we report the metrics of CPU utilization, I/O Wait, disk I/O bandwidth and, network I/O bandwidth. The system metrics are collected through the proc file system.
For micro-architecture evaluation, we use the Top-Down method [21], which categorizes the pipeline slots into four categories, including retiring, bad speculation, frontend bound and backend bound. Among them, retiring represents the useful work, which means the issued micro operations (uops) eventually get retired. Bad speculation represents the pipeline is blocked due to incorrect speculations. Frontend bound represents the stalls due to frontend, which undersupplies uops to the backend. Backend bound represents the stalls due to backend, which is a lack of required resources for new uops [22]. We use Perf [23], a Linux profiling tool, to collect the hardware events referring to the Intel Developerś Manual [24] and pmu-tools [22].
4.3 System Evaluation
Fig. 4 presents the CPU utilization and I/O Wait of all data dwarfs. We find that Hadoop dwarfs have higher CPU utilization than Spark dwarfs, and suffers less I/O Wait than Spark dwarfs do. Particularly, Hadoop dwarfs take 80 percent CPU time. The I/O Waits of AI data dwarfs are extremely lower than that of big data dwarfs. For deep neural networks, even the total input data is large, the input layer loads a batch from disk every iteration, so data loading size from disk by the input layer occupies a very small proportion comparing to intermediate data, and thus introduce little disk I/O requests. Pthread dwarfs has less CPU utilization and I/O Wait in general, because Pthreads dwarfs have less memory allocation and relocation operations than counterparts using other stacks. Moreover, the data loading time overlaps the processing time since computation is simple, except that Pthread Matmul has almost 100% CPU utilization because it is very CPU-intensive. Tensorflow dwarfs, such as AvgPool, Conv, Matmul, Maxpool, and Multiply, have taken most of CPU time, because these five dwarfs are CPU-intensive. Nevertheless, we also find that the other AI dwarfs are not that CPU-intensive, such as Relu, Sigmoid, and Tanh.
Fig 5 presents the network bandwidth and disk I/O bandwidth. For AI dwarfs, most of them (e.g. matmul, relu, pooling, activation) are executed in the hidden layers, and the intermediate states of hidden layers are stored in the memory. That is to say, the hidden layers consume the most resources of computation and memory storage, while the disk I/O for input layer is relatively minor. Our evaluation confirms this observation. Meanwhile, we mentioned in Section 4.1, we evaluate both the TensorFlow and Pthread implementations of AI dwarfs on one node for apple-to-apple comparison. So we do not report the I/O behaviors of AI dwarfs. We find that for all big data dwarfs, Spark stack has much larger network I/O pressure than that of Hadoop stack, because Spark stack has more data shuffles, so it needs transferring data from one node to another one frequently. Five of the eight Spark implementations have smaller disk I/O pressure than that of Hadoop, because Spark targets in-memory computing. Except Spark Matmul, Spark MD5 and WordCount have larger disk I/O pressure than that of Hadoop counterparts. The disk I/O read sector numbers are nearly equal, while the write sector numbers are much larger.
4.4 Micro-architecture Evaluation
To better understand the data dwarfs, we analyze their performance and micro-architectural characteristics.
Execution Performance The execution performance indicates the overall running efficiency of the workloads [25]. We use the instruction level parallelism (ILP) and memory level parallelism (MLP) to reflect the execution performance. Among them, ILP measures the number of instructions that can be executed simultaneously. Here we use the retired instructions per cycle (IPC) to measure ILP. MLP indicates the parallelism degree that memory accesses can be generated and executed [26]. Fig. 6 presents the ILP and MLP of all data dwarfs. We find that these dwarfs cover a wide range of ILP and MLP behaviors, reflecting distinct computation and memory access patterns. For example, TensorFlow Multiply does element-wise multiplications and has high MLP (5.27) but extremely low ILP (0.15). This is because that its computation is simple and has little data dependencies, so it generates a large amount of memory access requests while has no enough independent instructions to execute, thus incurs severe backend stalls and results in low ILP. Also, max pooling and average pooling have high MLP. The MLP of average pooling is lower than max pooling, because average computation involves many divide operations, and thus suffers more stalls due to the delay of divider unit. The software stack changes workload’s computation and memory access patterns, which is also found in previous work [27]. For example, both Hadoop FFT and Spark FFT are based on cooley-tukey algorithm [28], while they have different parallelism degrees. Spark FFT is more memory-intensive and has higher MLP.
The Uppermost Level Breakdown Fig. 7 shows the uppermost level breakdown of all data dwarfs we evaluated. We find that these dwarfs have different pipeline bottlenecks. For Hadoop dwarfs, they suffer from notable stalls due to frontend bound and bad speculation. Moreover, Hadoop dwarfs reflect nearly consistent bottlenecks, indicating the Hadoop stack impacts workload behaviors more than other stacks like Spark and TensorFlow. For Spark dwarfs, which mainly compute in memory, they suffer from a higher percentage of backend bound than that of Hadoop counterparts. Spark Grep, Sample and Sort suffer from more frontend bound and their percentages of backend bound are smaller than the others. The AI data dwarfs face different bottlenecks both on TensorFlow and Pthreads. Conv and Matmul have the highest IPC (about 2.3) and retiring percentages (about 60% on TensorFlow). Max pooling, average pooling, and multiplication have extremely low retiring percentages, which has been illustrated in above. However, activation operation like ReLU, sigmoid and tanh suffer from more frontend bound. For AI data dwarfs implemented with Pthread, their main bottleneck is backend bound. They suffer little frontend and bad speculation stalls.
Frontend Bound Frontend bound can be split into frontend latency bound and frontend bandwidth bound. Among them, latency bound means the frontend delivers no uops to the backend, while bandwidth bound means delivering insufficient uops comparing to the theoretical value. Fig. 8 presents the frontend breakdown of the data dwarfs. We find that the main reason that incurs the frontend stalls is latency bound for almost all dwarfs that suffer severe frontend bound.
We further investigate the reasons for the frontend latency bound and frontend bandwidth bound, respectively. Generally, the frontend latency bound are incurred by six reasons, including icache miss, itlb miss, branch resteers, DSB switches, LCP, and microcode sequencer (MS) switches. Among them, icache miss and itlb miss are instruction cache miss and instruction tlb miss. Branch resteers means the delays to obtain the correct instructions, such as the delays due to branch misprediction. LCP measures the stalls when decoding the instructions with a length changing prefix. Generally, uops comes from three places, including the decoded uops cache (DSB), legacy decode pipeline (MITE) and microcode sequencer (MS). DSB switches record the stalls caused by switching from the DSB to MITE. MS switches measure the penalty of switching to MS unit. As for latency bandwidth bound, there are mainly two reasons: the inefficiency of MITE pipeline and the inefficient utilization of DSB cache. Additionally, LSD represents the stalls due to waiting the uops from the loop stream detector [29]. Fig. 9 lists the latency and bandwidth bound breakdown of all data dwarfs. For all data dwarfs except Spark Matmul, we find that branch resteers are the main reason of the high percentage of frontend bound. Instruction cache miss is more severe on Hadoop and Spark stacks than that on TensorFlow and Pthread stacks, because of the large binary code size. Moreover, MS switch is another significant factor that incurs frontend latency bound. Because big data and AI systems use many CISC instructions that cannot be decoded by default decoder, so they must be decoded by MS unit, and results in performance penalties. Big data dwarfs implemented with Hadoop and Spark suffer more icache misses than AI data dwarfs.
Backend Bound Fig 10 presents the backend bound breakdown of data dwarfs, which are split into backend memory bound and backend core bound. Backend memory bound is mainly caused by the data movement delays among different memory hierarchies. Backend core bound is mainly caused by the lackness of hardware resources (e.g. divider unit) or port under-utilization because of instruction dependencies and execution unit overloading. We find that more than half of these data dwarfs suffer from more backend memory bound than core bound. For each software stack, there is at least one data dwarf that suffer from equal percentages of core bound or even more percentages of core bound than memory bound, such as Hadoop WordCount, Spark MD5, TensorFlow Conv and Pthread Avgpool. Fig. 11 shows the core bound breakdown. We find that TensorFlow Conv and Hadoop WordCount suffer from significantly long latency of divider unit. While for Spark MD5, which has the highest percentage of backend core bound, mainly suffer from the stalls due to port under-utilization. As for backend memory bound, we find that external memory bound is much severe than level 1, 2, and 3 cache bound for almost all big data and AI dwarfs, indicating that the memory wall [30] still exists and need to be optimized.
5 Impact of Data Input
In this section, we evaluate the impact of data input on system and micro-architecture behaviors from the perspectives of size, source, type, and pattern. For type and pattern evaluation, we use Sort and FFT as an example, respectively.
5.1 Impact of Data Size
Based on all sixty metrics spanning system and micro-architecture we evaluated in Section 4, we conduct a coarse-grained similarity analysis using PCA [31] and hierarchical clustering [32] methods on three data size configurations. Fig. 12 presents the linkage distance of all data dwarfs, which indicates the similarity of system and micro-architecture behaviors. Note that the smaller the linkage distance, the more similar the behaviors. We find that data dwarfs with small data size are more likely to be clustered together. A small data size will not fully utilize the system and hardware resources, hence that they tend to reflect similar behaviors. However, for the dwarf that is computation intensive and has high computation complexity, even with the large data set, it will be clustered together with small data set. For example, FFTs with three data size configurations are clustered together for both Hadoop and Spark version. AI Dwarfs with TensorFlow implementations are also greatly affected by the input data size. However, they reflect distinct behaviors with big data dwarfs implemented with Hadoop and Spark, with the least linkage distance of 5.09.
Impact of Data Size on I/O Behaviors We evaluate the impact of data size on I/O behaviors using the fully distributed Hadoop and Spark dwarf implementations, as illustrated in Fig. 13. Here we do not report the performance data of the AI dwarfs because the disk I/O behavior is little in neural network modeling, which we have illustrated in Subsection 4.3. We use the small data input as the baseline, and report the ratio of the number of the medium or large input divided by that of the small input. The bold black horizontal line in Fig. 13 shows the equal line with the small input. That is to say, the value higher than the line means larger I/O bandwidth than the value of the small input. We find that almost for all data dwarfs, their I/O behaviors are sensitive to the data size. When the data size large enough, the whole data can not be stored in memory, then the data have to be swapped in and swapped out frequently, and hence put great pressure on disk I/O access. Modern big data and AI systems adopt an distributed manner, with the data storing on an distributed file system, such as HDFS [33], the data shuffling or data unbalance will generate a large amount of network I/O.
Impact of Data Size on Pipeline Efficiency We further measure the impact of data size on pipeline efficiency. As shown in Fig. 14, we find that with the data size increases, the percentage of frontend bound decrease, while the percentage of backend bound increase. For example, Spark Matmul with large input size decrease nearly 20% of frontend bound and increase more than 30% of backend bound. As the data size increase, the high-speed cache and even memory are unable to hold all of them, and further incur many data cache misses, resulting in large penalties due to memory hierarchy.
5.2 Impact of Data Pattern
Data pattern and data distribution impact the workload performance [34, 35] significantly. To evaluate the impact of data pattern on the dwarfs, we use two different patterns of dense matrix and sparse matrix, to run FFT dwarf as an example. The matrix sparsity indicates the ratio of zero value among all matrix elements. With different sparsity, the data access patterns vary, and thus reflect different behaviors.
We use two 1638416384 matrixes as the input for the FFT dwarf, with the one having 10% sparsity and the other one 90% sparsity. Fig. 15 shows the impact of data pattern on the data dwarfs from system (Fig. 15(a)) and micro-architecture perspectives(Fig. 15(b)). We find that using the matrix with high sparsity, the network I/O and disk I/O are nearly half of the values using the dense matrix, and the major page fault per second is almost the same. Spark dwarfs suffer from more I/O pressure than Hadoop dwarfs. As for pipeline bottlenecks, sparse data input incurs more frontend stalls while less backend stalls.
5.3 Impact of Data Type and Source
Data types and sources are of great significance for read and write efficiency [36], considering their storage format and targeted scenarios, such as the supports for splitable files and compression level. To evaluate the impact of the data type and source on system and micro-architecture behaviors, we use two different data types for Sort dwarf, with the same data size of 10 GB. two types are un-structured wikipedia text data and semi-structured sequence data. Wikipedia text file is laid out in lines and each line records an article content. Sequence files are flat files that consist of key and value pairs, stored in binary format. Fig. 16 lists the impact of data type on data dwarfs from the system (Fig. 16(a)) and micro-architecture aspects (Fig. 16(b)). We find that the difference between using text type and sequence type ranges from 1.12 times to 7.29 times from the system aspects. Using text data type, the CPU utilization is lower than using sequence data, which indicates that using sequence data has better performance. Both Hadoop Sort and Spark Sort suffer more major page faults and further impact the execution performance, because of page loads from disk. Note that we use the major page fault number per second in Fig. 16 and the total number during the running process is about 100 to 200. Even with the same amount of data size, their network I/O and disk I/O bandwidth still have a great difference. We find that the sequence format have larger requirements for I/O bandwidth than the text format. From the micro-architecture aspect (Fig. 16(b)), Sort with different data types reflect different percentages of pipeline bottlenecks. With the text format, backend bound bottleneck is more severe, especially backend memory bound, which indicates that they waste more cycles to wait for the data from cache or memory.
6 Related Work
Our big data and AI dwarfs are inspired by previous successful abstractions in other application scenarios. The set concept in relational algebra [3] abstracted five primitive and fundamental operators, setting off a wave of relational database research. The set abstraction is the basis of relational algebra and theoretical foundation of database. Phil Colella [5] identified seven dwarfs of numerical methods which he thought would be important for the next decade. Based on that, a multidisciplinary group of Berkeley researchers proposed 13 dwarfs which were highly abstractions of parallel computing, capturing the computation and communication patterns of a great mass of applications [6]. National Research Council proposed seven major tasks in massive data analysis [9], which they called giants. These seven giants are macroscopical definition of problems in massive data analysis from the perspective of mathematics, while our eight classes of dwarfs are main time-consuming units of computation in the Big Data and AI workloads.
Application kernels [37, 38] also aim at scaling down the run time of the real applications, while preserving the main characteristics of the workload. Consisting of the major function of the application, Kernel tries to cover the bottleneck of the real application. But kernel is still hard to understand the complex and diversity big data and AI workloads [37, 39]. Other than that, kernel mainly focuses on the CPU and memory behaviors, and pays little attention to the I/O, which is also important for many real applications, especially in an era of data explosion.
7 Conclusions
In this paper, we answer what are abstractions of time-consuming units of computation in big data and AI workloads. We identify eight data dwarfs among a wide variety of big data and AI workloads, as a pipeline of units of computation performed on initial and intermediate data, including Matrix, Sampling, Logic, Transform, Set, Graph, Sort and Statistic computation. We implement the data dwarfs for big data and AI separately, including the big data dwarf implementations using Hadoop, Spark, Pthreads, and the AI data dwarf implementations using TensorFlow, Pthreads, considering the impact of data type, data source, data size, and data pattern. From the system and micro-architecture perspectives, we comprehensively characterize the behaviors of data dwarfs and identify their bottlenecks. Moreover, we measure the impact of data type, data source, data pattern and data size on their behaviors.
References
- [1] L. Wang, J. Zhan, C. Luo, Y. Zhu, Q. Yang, Y. He, W. Gao, Z. Jia, Y. Shi, S. Zhang, C. Zheng, G. Lu, K. Zhan, X. Li, and B. Qiu, “Bigdatabench: A big data benchmark suite from internet services,” in IEEE International Symposium On High Performance Computer Architecture (HPCA), 2014.
- [2] M. Ferdman, A. Adileh, O. Kocberber, S. Volos, M. Alisafaee, D. Jevdjic, C. Kaynak, A. D. Popescu, A. Ailamaki, and B. Falsafi, “Clearing the clouds: A study of emerging workloads on modern hardware,” in ACM International Conference on Architectural Support for Programming Languages and Operating Systems (ASPLOS), 2012.
- [3] E. F. Codd, “A relational model of data for large shared data banks,” Communications of the ACM, vol. 13, no. 6, pp. 377–387, 1970.
- [4] Y. Chen, F. Raab, and R. Katz, “From tpc-c to big data benchmarks: A functional workload model,” in Specifying Big Data Benchmarks, pp. 28–43, Springer, 2014.
- [5] P. Colella, “Defining software requirements for scientific computing,” 2004.
- [6] K. Asanovic, R. Bodik, B. C. Catanzaro, J. J. Gebis, P. Husbands, K. Keutzer, D. A. Patterson, W. L. Plishker, J. Shalf, S. W. Williams, and Y. Katherine, “The landscape of parallel computing research: A view from berkeley,” tech. rep., Technical Report UCB/EECS-2006-183, EECS Department, University of California, Berkeley, 2006.
- [7] M. Shah, P. Ranganathan, J. Chang, N. Tolia, D. Roberts, and T. Mudge, “Data dwarfs: Motivating a coverage set for future large data center workloads,” in Proc. Workshop Architectural Concerns in Large Datacenters, 2010.
- [8] P. R. Luszczek, D. H. Bailey, J. J. Dongarra, J. Kepner, R. F. Lucas, R. Rabenseifner, and D. Takahashi, “The hpc challenge (hpcc) benchmark suite,” in Proceedings of the 2006 ACM/IEEE conference on Supercomputing, p. 213, Citeseer, 2006.
- [9] N. Council, “Frontiers in massive data analysis,” The National Academies Press Washington, DC, 2013.
- [10] “Hadoop.” http://hadoop.apache.org/.
- [11] M. Zaharia, M. Chowdhury, M. J. Franklin, S. Shenker, and I. Stoica, “Spark: cluster computing with working sets,” in Proceedings of the 2nd USENIX conference on Hot topics in cloud computing, pp. 10–10, 2010.
- [12] M. Abadi, P. Barham, J. Chen, Z. Chen, A. Davis, J. Dean, M. Devin, S. Ghemawat, G. Irving, M. Isard, et al., “Tensorflow: A system for large-scale machine learning.,” in OSDI, vol. 16, pp. 265–283, 2016.
- [13] B. Barney, “Posix threads programming,” National Laboratory. Disponível em:¡ https://computing. llnl. gov/tutorials/pthreads/¿ Acesso em, vol. 5, p. 46, 2009.
- [14] D. G. Lowe, “Distinctive image features from scale-invariant keypoints,” International journal of computer vision, vol. 60, no. 2, pp. 91–110, 2004.
- [15] A. Krizhevsky, I. Sutskever, and G. E. Hinton, “Imagenet classification with deep convolutional neural networks,” in Advances in neural information processing systems, pp. 1097–1105, 2012.
- [16] D. Guinard, V. Trifa, and E. Wilde, “A resource oriented architecture for the web of things,” in Internet of Things (IOT), 2010, pp. 1–8, IEEE, 2010.
- [17] K. Simonyan and A. Zisserman, “Very deep convolutional networks for large-scale image recognition,” arXiv preprint arXiv:1409.1556, 2014.
- [18] J. Deng, W. Dong, R. Socher, L.-J. Li, K. Li, and L. Fei-Fei, “Imagenet: A large-scale hierarchical image database,” in Computer Vision and Pattern Recognition, 2009. CVPR 2009. IEEE Conference on, pp. 248–255, IEEE, 2009.
- [19] S. Van den Steen, S. Eyerman, S. De Pestel, M. Mechri, T. E. Carlson, D. Black-Schaffer, E. Hagersten, and L. Eeckhout, “Analytical processor performance and power modeling using micro-architecture independent characteristics,” IEEE Transactions on Computers, vol. 65, no. 12, pp. 3537–3551, 2016.
- [20] H. Quinn, W. H. Robinson, P. Rech, M. Aguirre, A. Barnard, M. Desogus, L. Entrena, M. Garcia-Valderas, S. M. Guertin, D. Kaeli, et al., “Using benchmarks for radiation testing of microprocessors and fpgas,” IEEE Transactions on Nuclear Science, vol. 62, no. 6, pp. 2547–2554, 2015.
- [21] A. Yasin, “A top-down method for performance analysis and counters architecture,” in Performance Analysis of Systems and Software (ISPASS), 2014 IEEE International Symposium on, pp. 35–44, IEEE, 2014.
- [22] “Pmu tools.” https://github.com/andikleen/pmu-tools.
- [23] “Perf tool.” https://perf.wiki.kernel.org/index.php/Main_Page.
- [24] P. Guide, “Intel® 64 and ia-32 architectures software developer’s manual,” Volume 3B: System programming Guide, Part, vol. 2, 2011.
- [25] G. Kim, J. Jeong, J. Kim, and M. Stephenson, “Automatically exploiting implicit pipeline parallelism from multiple dependent kernels for gpus,” in Parallel Architecture and Compilation Techniques (PACT), 2016 International Conference on, pp. 339–350, IEEE, 2016.
- [26] A. Glew, “Mlp yes! ilp no,” ASPLOS Wild and Crazy Idea Session’98, 1998.
- [27] Z. Jia, J. Zhan, L. Wang, R. Han, S. A. McKee, Q. Yang, C. Luo, and J. Li, “Characterizing and subsetting big data workloads,” in IEEE International Symposium on Workload Characterization (IISWC), 2014.
- [28] J. W. Cooley and J. W. Tukey, “An algorithm for the machine calculation of complex fourier series,” Mathematics of computation, vol. 19, no. 90, pp. 297–301, 1965.
- [29] “Lsd.” https://software.intel.com/en-us/vtune-amplifier-help-front-end-bandwidth-lsd.
- [30] W. A. Wulf and S. A. McKee, “Hitting the memory wall: implications of the obvious,” ACM SIGARCH computer architecture news, vol. 23, no. 1, pp. 20–24, 1995.
- [31] I. T. Jolliffe, “Principal component analysis and factor analysis,” in Principal component analysis, pp. 115–128, Springer, 1986.
- [32] S. C. Johnson, “Hierarchical clustering schemes,” Psychometrika, vol. 32, no. 3, pp. 241–254, 1967.
- [33] K. Shvachko, H. Kuang, S. Radia, and R. Chansler, “The hadoop distributed file system,” in Mass storage systems and technologies (MSST), 2010 IEEE 26th symposium on, pp. 1–10, Ieee, 2010.
- [34] B. Xie, J. Zhan, X. Liu, W. Gao, Z. Jia, X. He, and L. Zhang, “Cvr: Efficient vectorization of spmv on x86 processors,” in 2018 IEEE/ACM International Symposium on Code Generation and Optimization (CGO), 2018.
- [35] B. Yilmaz, B. Aktemur, M. J. Garzarán, S. Kamin, and F. Kiraç, “Autotuning runtime specialization for sparse matrix-vector multiplication,” ACM Transactions on Architecture and Code Optimization (TACO), vol. 13, no. 1, p. 5, 2016.
- [36] L. Eeckhout, H. Vandierendonck, and K. De Bosschere, “Quantifying the impact of input data sets on program behavior and its applications,” Journal of Instruction-Level Parallelism, vol. 5, no. 1, pp. 1–33, 2003.
- [37] D. H. Bailey, E. Barszcz, J. T. Barton, D. S. Browning, R. L. Carter, L. Dagum, R. A. Fatoohi, P. O. Frederickson, T. A. Lasinski, R. S. Schreiber, H. D. Simon, V. Venkatakrishnan, and S. K. Weeratunga, “The nas parallel benchmarks,” The International Journal of Supercomputing Applications, vol. 5, no. 3, pp. 63–73, 1991.
- [38] J. J. Dongarra, P. Luszczek, and A. Petitet, “The linpack benchmark: past, present and future,” Concurrency and Computation: practice and experience, vol. 15, no. 9, pp. 803–820, 2003.
- [39] D. J. Lilja, Measuring computer performance: a practitioner’s guide. Cambridge university press, 2005.