On the origin of phosphorus nitride in star-forming regions
Abstract
We present multi-transition observations of PN towards a sample of nine massive dense cores in different evolutionary stages. Using transitions with different excitation conditions, we have found for the first time that the excitation temperatures of PN are in the range 5–30 K. To investigate the main chemical route for the PN formation (surface-chemistry vs. gas-phase chemistry), and the dominant desorption mechanism (thermal vs. shock), we have compared our results with those obtained from molecules tracing different chemical and physical conditions (SiO, SO, CH3OH, and N2H+). We have found that the PN line profiles are very well correlated with those of SiO and SO in six out of the nine targets, which indicates that PN may be released by sputtering of dust grains due to shocks. This finding is corroborated by a faint but statistically significant positive trend between the PN abundance and those of SiO and SO. However, in three objects the PN lines have no hints of high velocity wings, which indicates an alternative origin of PN. Overall, our results indicate that the origin of PN is not unique, as it can be formed in protostellar shocks, but also in colder and more quiescent gas through alternative pathways.
keywords:
– Galaxy: Centre – ISM: molecules – ISM: abundances – ISM: clouds1 Introduction
Phosphorus (P) is one of the most important element for (pre)biotic chemistry, because it is crucial to the formation of nucleic acids, cellular membranes, and adenosine triphosphate (ATP), the key molecule for the energy transfers in cells (see e.g. Pasek & Lauretta 2005, Pasek et al. 2017). Phosphorus-bearing molecules are found in pristine solar system material such as asteroids (Macía 2005) and comets (Altwegg et al. 2015), whose impact (and release of their content) on the primordial Earth could have had a key role in the emergence of life as we know it. However, the interstellar chemistry of P is far less understood than that of other elements. Phosphorus is thought to be synthesized in massive stars and injected into the interstellar medium via supernova explosions (Koo et al. 2013, Roederer et al. 2014). It has a relatively low cosmic abundance (P/H 2.810-7; Grevesse & Sauval 1998), and it is thought to be depleted in the dense and cold interstellar medium by a factor of 600 (e.g., Wakelam & Herbst 2008). Because P is essentially undepleted in diffuse clouds (Lebouteiller et al. 2006), depletion of P should be due to freeze-out onto the icy mantles of dust grains, and its desorption mechanisms should be similar to those of all the other icy mantle components. Among the phosphorus-bearing molecules, the phosphorus nitride (PN) is the first one detected in the interstellar medium toward three high-mass star-forming regions: Orion KL, Sgr B2, and W51, in which the measured abundances are (1–4) 10-10, larger than theoretically expected from a pure low-temperature ion-molecule chemical network (Turner & Bally 1987, Ziurys 1987). Since then, it has been detected in high-mass dense cores (Turner et al. 1990, Fontani et al. 2016), as well as in the circumstellar material of carbon- and oxygen-rich stars (e.g., Milam et al. 2008, De Beck et al. 2013) and in protostellar shocks (Lefloch et al. 2016). Other phosphorus-bearing molecules (e.g., CP, HCP, PH3) have been detected in evolved stars (Tenenbaum et al. 2007, De Beck et al. 2013, Agúndez et al. 2014), but never in dense star-forming cores. Due to this lack of observational constraints, the chemistry of P in the interstellar medium in general, and in star-forming regions in particular, has remained substantially unknown.
A considerable step forward was made in the last years thanks to the recent detection of PO in two high-mass (Rivilla et al. 2016) and a low-mass (Lefloch et al. 2016) star-forming regions. Moreover, with the IRAM-30m Telescope, Fontani et al. (2016) detected PN (2–1) in 8 additional high-mass star-forming cores in different evolutionary stages: 2 starless cores (HMSC), 3 protostellar objects (HMPO), and 3 ultracompact HII regions (UCHII). One of the main findings of Fontani et al. (2016) is that all detected PN line widths are smaller than 5 km s-1, and arise from regions associated with kinetic temperatures smaller than 100 K. Although the few detections reported in the literature are associated with warmer and turbulent sources, or even shocked material (Lefloch et al. 2016), the results of Fontani et al. (2016) indicate that PN can arise also from relatively quiescent and cold gas. This information challenges theoretical models that invoke either high desorption temperatures or grain sputtering from shocks to release phosphorus into the gas phase (e.g. Turner et al. 1990). In this Letter, we present multi-transition observations of PN (2–1, 3–2, and 6–5) carried out with the IRAM 30m telescope towards our sample of massive dense cores. The main finding of this work firmly confirms our previous conclusion, i.e. that the origin of PN is not unique, because it may form in shocks but also in quiescent material.
| Molecule | Transition | Frecuency (GHz) | Eup (K) | Aul (s-1) | (cm-3) |
|---|---|---|---|---|---|
| PN | 2–1 | 93.97977 | 6.8 | 2.910-5 | (6.5-9.7)(a) |
| PN | 3–2 | 140.96769 | 13.5 | 1.110-4 | (2.3-3.1)(a) |
| PN | 6–5 | 281.91420 | 47.4 | 9.110-4 | (2.4-1.5)(a) |
| SiO | 2–1 | 86.84696 | 6.3 | 2.910-5 | (3.6-5.9)(b) |
| SiO | 5–4 | 217.10498 | 31.3 | 5.210-4 | (4.3-4.7)(b) |
| SO | 2(2)–1(1) | 86.09395 | 19.3 | 5.310-6 | (1.8-3.8)(b) |
(a) derived from the collisional rate coefficients in Tobola et al. (2007) calculated in the range 10–80 K;
(b) derived from the collisional rate coefficients in the LAMBDA111http://home.strw.leidenuniv.nl/ moldata/
database calculated in the range 10–150 K;
| PN | SiO | SO | |||||||||||||
| R.A.(J2000) | Dec.(J2000) | (3–2) | T\pedex | N\pedtot | |||||||||||
| [h:m:s] | [] | [km s-1] | [K km/s] | [K km/s] | [K] | [10\ap12cm\ap-2] | [K km/s] | [K km/s] | [K] | [10\ap14cm\ap-2] | [K km/s] | [10\ap14cm\ap-2] | |||
| HMSC | |||||||||||||||
| AFGL5142-EC | 05:30:48.7 | +33:47:53 | 4.51.0 | 0.200.03 | <0.24 | 8.980.08\apng | 14.180.09\apng | 3.880.06\apng | 27.50.4 | ||||||
| 05358-mm3 | 05:39:12.5 | +35:45:55 | 5.21.1 | 0.140.02 | <0.16 | 4.810.06\apng | 3.320.06\apng | 1.680.05\apng | 13.00.4 | ||||||
| HMPO | |||||||||||||||
| AFGL5142-MM | 05:30:48.0 | +33:47:54 | 2.90.8 | 0.2800.015\apng | <0.23 | 12.24(0.08)\apng | 13.620.10\apng | 4.730.05\apng | 39.30.4 | ||||||
| 18089-1732 | 18:11:51.4 | 17:31:28 | 5.01.7 | 0.370.03\apng | <0.22 | 3.4\apd | 2.650.05\apng | 5.960.07\apng | 2.230.04\apng | 19.80.3 | |||||
| 18517+0437a) | 18:54:14.2 | +04:41:41 | 1.90.3 | 0.0910.013 | 0.0630.013 | 10.41.2 | 0.70.2 | 2.100.03\apng | 4.670.05\apng | 1.750.03 | 1.70.2\ape | ||||
| G75-coreb) | 20:21:44.0 | +37:26:38 | 5.71.4 | 0.0880.018 | <0.14 | - | 0.600.12 | 3.560.04\apng | 7.710.08\apng | 4.120.03\apng | 74.70.6 | ||||
| UCHII | |||||||||||||||
| G5.89-0.39a) | 18:00:30.5 | 24:04:01 | 173 | 0.970.08\apng | 0.510.05 | 9.80.2 | 7.42.0 | 31.090.10\apng | 90.650.13\apng | 15.300.08\apng | 121.60.6\ape | ||||
| 19410+2336 | 19:43:11.4 | +23:44:06 | 1.50.2 | 0.0800.010 | <0.15 | 0.760.04\apng | 1.18(0.04)\apng | 1.530.03\apng | 10.110.18 | ||||||
| ON1a) | 20:10:09.1 | +31:31:36 | 5.50.8 | 0.190.02 | 0.120.03 | 9.10.8 | 2.20.4 | 4.930.05\apng | 5.710.05\apng | 1.840.03\apng | 13.30.2 | ||||
a sources with PN (2-1), (3-2) and (6-5) rotational lines all detected;
\apb sources with only one PN line detected. It is not possible to derive . is calculated trough Eq. (A4) of Caselli et al. (2002), assuming equal to the mean of the temperature derived for the other sources in the same class;
\apc upper limit not defined, because the maximum slope line provides a non physical value of ;
\apd lower limit not defined, because the maximum slope lines is not physically acceptable, while the upper limit value falls below the best fit, due to the difference in temperature between the minimum slope line and the best fit. For this source we calculated the total column density in a second way, using Eq. (A4) of Caselli et al. (2002) with the value of the PN (3-2) area and with the temperature derived from the Boltzmann plot (T\pedex=32.1 K). The result is ;
\ape for NH\ped3 is not available for these sources. The temperature used to derive the total column density is the mean of the , calculated separately in each evolutionary group;
\apng lines with non gaussian profile, for which the integrated area has been derived by summing the intensities of the channels with signal.
2 Observations
We have observed with the IRAM-30m Telescope the (3–2) and (6–5) rotational transitions of PN towards 12 sources of the Fontani et al. (2011) sample (the 8 objects detected in 2–1 in Fontani et al. 2016 and four additional non-detections) from the 6th to the 11th of December, 2016, using simultaneously the 2 and 0.8 mm bands of the EMIR receiver of the IRAM-30m telescope (IRAM-30m project n. 119-16). Table 1 presents some main technical observational parameters, while the sources are listed in Table 2. The observations were made in wobbler-switching mode with a wobbler throw of 240″. The data were calibrated with the chopper wheel technique (see Kutner & Ulich 1981), with a calibration uncertainty of about . The spectra were obtained with the fast Fourier transform spectrometers with the finest spectral resolution (FTS50), providing a channel width of 50 kHz. All calibrated spectra were analysed using the GILDAS software developed at the IRAM and the Observatoire de Grenoble. The spectroscopic parameters used in the derivation of the column densities (Table 1) have been taken from the Cologne Molecular Database for Spectroscopy (CDMS; Müller et al. 2001, 2005). Further details on the observations will be given in a forthcoming paper that presents an extended analysis of this dataset (Mininni et al. in prep.).
3 Analysis
The new observations show that PN(3–2) is detected in 9 sources: 8 previously detected in PN(2–1), and a new one (G75-core). The 3–2 transition is in all cases more intense than the 2–1, with a ratio of line intensities I3-2/ I2-1 between 1.5 and 3. The high-energy 6–5 transition is detected only towards 3 sources: 18517+0437, G5.89-0.39 and ON1. Although the lines have hyperfine structure, the faintest components were either below the 3 level, or blended among them, so that a fit simultaneous to all the hyperfine components could not be performed. Therefore, we have fitted the lines with single gaussians, and used the integrated areas obtained to construct the rotational diagrams. For non-gaussian profiles, the integrated areas have been derived by summing the intensities of the channels above the 3 rms level. The rotational diagrams have provided us with the PN excitation temperature, , and the PN total column densities, . The method assumes that the molecular levels are populated with a single excitation temperature. This is certainly a good approximation for the sources in which only the (2–1) and (3–2) lines, which have similar energy of the upper level, are detected. However, even in the three sources in which the (6–5) is included, the points in the rotational diagram are well distributed on a straight line, so that we are confident that the approximation is reliable. The source angular size, needed to compare transitions observed with different beam sizes, is unknown so far. Therefore, we have assumed that the PN emission in all the lines fills the smallest beam size, i.e. 9′′. The integrated line intensities have then been corrected for beam dilution to determine . The and derived from the rotational diagrams, and the integrated areas used to make them, are shown in Table 2. The spectra of all detected sources and the rotational diagrams are included in an Appendix available on-line only. The measured are in the range to 30 K (see Table 2) which is lower (in some cases much lower) than the gas kinetic temperatures given in Fontani et al. (2011). These latters are in the range K, and were derived from ammonia rotation temperatures. which indicates that the PN lines are sub-thermally excited. This is consistent with the high critical density of the PN transitions ( cm-3, Table 1), which is higher than the average H2 volume density expected at the angular resolution of our observations (cm-3). The method assumes also optically thin transitions. Given the low PN abundance, we are confident that this assumption is satisfied as well. The derived total column densities are in the range =cm-2. We have checked if our and those computed by Fontani et al. (2016) are consistent. For this purpose, we have rescaled the values computed by Fontani et al. (2016), averaged within a beam of ′′, to 9′′. The two estimates are consistent within a factor 2. The discrepancy might be due to the fact that the temperature we used in Fontani et al. (2016), i.e. the kinetic temperature obtained from ammonia, was too high ( K) for PN. Details on the calculation of the column densities source by source are also given in the caption of Table 2. We have also evaluated how our results could change in case of higher opacities of the lines: we have taken the three sources in which we have detected the three transitions, and assumed for the (2–1) line: the total column densities can change by a factor 2, while the rotation temperatures of a factor 1.25. Therefore, even in the unfavourable, and unlikely, event of a higher opacity of the lower excitation lines, the column densities should vary at most by a factor 2. Finally, the PN line widths at half maximum (Col. 4 in Table 2) are generally around 5 km s-1 or larger, i.e. much larger than the thermal broadening (expected to be of a few 0.1 km s-1) and thus associated with high-velocity or shocked gas, but not everywhere. In fact, the (3–2) transitions of AFGL5142-MM, 18517+0437, and 19410+2336 have , and km s-1, respectively. These values are lower than what is usually expected for shocked or very turbulent material. We will discuss better this relevant point in the next Section.
4 Discussion and conclusions
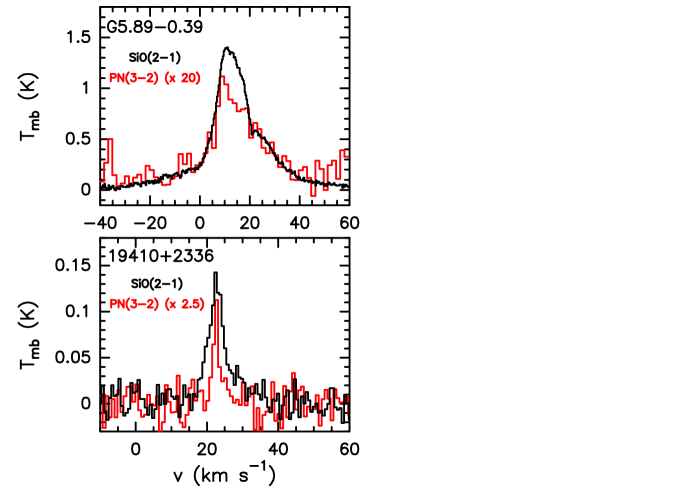
In Rivilla et al. (2016), based on the models of Vasyunin & Herbst (2013) and on the detections of PN and PO in the two high-mass star-forming regions W51 and W3(OH), we have concluded that the two molecules are formed during the cold pre–stellar phase, and then released in hot gas in the warm-up phase (after K), i.e. they should be a product of grain mantle evaporation. This interpretation was consistent with the broad lines and the high gas turbulence found in these two objects, but it is not appropriate to explain the results of Fontani et al. (2016), in which some PN lines are too narrow ( km s-1) to be produced in warm/hot gas. In order to better interpret the origin of PN, in this study we have analysed also the molecular species SiO and SO (shock tracers), which were observed simultaneously to the lines published by Colzi et al. (2017) and Fontani et al. (2015a). The spectroscopic parameters of the detected lines are listed in Table 1. The analysis of the SiO transitions is similar to that performed for PN, while for SO, for which we have only one line, the total column densities have been derived by assuming as excitation temperature the kinetic gas temperature given in Fontani et al. (2011). First of all, we have compared the line profiles, and found that in some sources SiO and PN are very similar, while in others the PN lines are clearly much narrower. Fig. 1 show the comparison of the PN(3–2) and the SiO(2–1) line profiles towards the UCHII regions G5.89–0.39 and 19410+2336, which are the two objects in which this dichotomy is most apparent. The PN profile follows nicely the SiO profile in G5.89–0.39, in particular in the high velocity wings, suggesting a similar origin from shocked gas. This close relation between these two species was recently also seen in the protostellar shock L1157-B1 (Lefloch et al. 2016). On the other hand, in 19410+2336, the PN profile is much narrower than that of SiO (1.5 km s-1 against km s-1), suggesting that at least in this source, and the others in which this difference is apparent, the PN emission must arise from more quiescent material. To better quantify this result, we have calculated the ratio between the of SiO (2–1) and PN (3–2), and found that three sources, AFGL5142-MM, 18517+0437, and 19410+2336, have (SiO)/(PN), 2.2, and 4.1, respectively. The others have (SiO)/(PN). Based on this threshold, we distinguish between sources with "Narrow" (N) and "Broad" (B) PN lines. The three N objects are HMPOs or UCHIIs, and although high-velocity gas is present in the sources (as demonstrated by the broad SiO lines), PN certainly does not arise from this gas. We also note that the two HMSCs detected in PN are both B sources, despite the lower turbulence and the absence of shocked material expected in starless cores. However, we know that the outer envelope of both sources is perturbed by external nearby sources (see Fontani et al. 2011 for details), and our data encompasses a region with an angular size that includes this envelope. Therefore, we think that the broad PN emission likely arises from the perturbed envelope, but only higher angular resolution observations can conclusively confirm this.
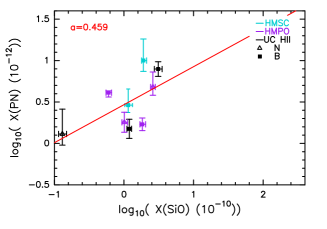
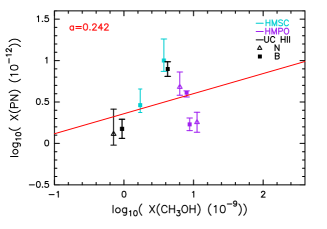
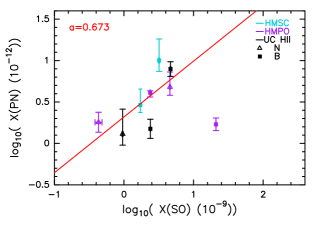
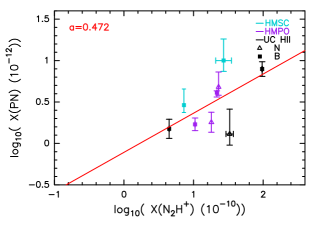
We have also derived the molecular abundance of PN relative to H2, and compared it with that of SiO and SO (shock tracers), CH3OH (product of surface chemistry, enhanced presence in HMPO and UCHII regions), and N2H+ (produced by gas-phase chemistry). The CH3OH total column densities have been taken from Fontani et al. (2015a), and those of N2H+ from Fontani et al. (2015b, from the 1–0 line). The derivation of the H2 column densities, used to compute the molecular abundances, is described in Appendix A. The comparison among the different abundances is shown in Fig. 2. In order to estimate a possible relation between the various species, we have performed a linear fit to the data. Although the statistics is low, we have found a positive trend with SiO, SO (only if we exclude from the statistical analysis the outlier G75-core), and N2H+, while with CH3OH a correlation is tentative at best. The slope of the linear fits are given in Fig. 2. The trend does not improve considering only the B sources, as can be noted from Fig. 2. In summary, the similar SiO and PN line profiles in six targets (see Fig. 1), corroborated by a faint but positive trend between their abundances, indicate that a source of PN is certainly in shocked gas. However, the different (narrower) PN profiles found in three objects where shocks are at work rule out the possibility that this is the unique origin, and indicate alternative formation routes in more quiescent material. These conclusions need to be supported by a better statistics and, above all, higher angular resolution observations, without which the nature of the PN emission cannot be conclusively established.
We have presented multi-transitions observations of PN (2–1, 3–2 and 6–5) carried out with the IRAM 30m telescope towards our sample of massive dense cores in different evolutionary stages. We found that the excitation temperatures of PN are low (5–30 K) even in HMPOs and UCHIIs. This suggests that PN is sub-thermally excited because the average density of the regions (typically 104-5 cm-2) is lower than the critical density of PN ( 105-6 cm-2). We have found a good agreement between the line profiles of PN and those of the well known shock-tracer SiO in six sources, which suggests that in these objects PN is likely sputtered from dust grain mantles through shock waves. This conclusion is in good agreement with the recent results found in a survey of Galactic centre clouds (Rivilla et al 2018). However, in three objects the PN lines are at least 1.8 times narrower than those of SiO, suggesting that the emission must arise from more quiescent gas. Our study, based on single-dish observations, will be implemented by on-going higher-angular resolution observations that will reveal the spatial distribution of PN, necessary to support our conclusions and evaluate the "fraction" of PN produced in the two ways.
Acknowledgements
We thank the anonymous referee for his/her constructive comments. We thank the IRAM-30m staff for the support during the observations. V.M.R. acknowledges the financial support received from the European Union’s Horizon 2020 research and innovation programme under the Marie Sklodowska-Curie grant agreement No 664931, and from the Italian Ministero dell’Istruzione, Università e Ricerca through the grant Progetti Premiali 2012 - iALMA (CUP C52I13000140001). P.C. and A.V. acknowledge support from the European Research Council (ERC project PALs 320620)
References
- Agúndez et al. (2014) Agúndez M., Cernicharo J., Decin L., Encrenaz P., Teyssier D., 2014, ApJ, 790, L27
- Burns et al. (2017) Burns, R.A., Handa, T., Imai, H., Nagayama, T., Omodaka, T. et al. 2017, MNRAS, 468, 2367
- Altwegg et al. (2015) Altwegg, K., Balsiger, H., Bar-Nun, A., et al. 2015, Science, 347, 6220, id.1261952
- Caselli et al. (2002) Caselli, P., Walmsley, C.M., Zucconi, A., Tafalla, M., Dore, L., Myers, P.C. 2002, ApJ, 565, 344
- Charnley & Millar (1994) Charnley S. B., & Millar T. J., 1994, MNRAS, 270, 570
- Colzi et al. (2017) Colzi, L., Fontani, F., Caselli, P., Ceccarelli, C., Hily-Blant, P., Bizzocchi, L. 2017, arXiv170904237
- De Beck et al. (2013) De Beck E., Kaminski T., Patel N. A., Young K. H., Gottlieb C. A., Menten K. M., Decin L., 2013, A&A, 558, 132
- Fontani et al. (2016) Fontani, F., Rivilla, V.M., Caselli, P., Vasyunin, A., Palau, A. 2016, ApJ, 822, L30
- Fontani et al. (2015a) Fontani, F., Busquet, G., Palau, A., Caselli, P., Sánchez-Monge, Á., Tan, J.C., Audard, M. 2015a, A&A, 575, 87
- Fontani et al. (2015b) Fontani, F., Caselli, P., Palau, A., Bizzocchi, L., Ceccarelli, C. 2015b, ApJ, 808, L46
- Fontani et al. (2011) Fontani, F., Palau, A., Caselli, P., Sánchez-Monge, Á., Butler, M.J., et al. 2011, A&A, 529, L7
- Fuente et al. (1995) Fuente, A., Martin-Pintado, J., Gaume, R. 1995, ApJ, 442, L33
- Garrod & Herbst (2006) Garrod, & Herbst, E. 2006, A&A, 457, 927
- Grevesse & Sauval (1998) Grevesse, N., & Sauval, A. J. 1998, Space Sci. Rev., 85, 161
- Hunter et al. (2000) Hunter, T.R., Churchwell, E., Watson, C., Cox, P., Benford, D.J., Roelfsema, P.R. 2000, AJ, 119, 2711
- Koo et al. (2013) Koo B.-C., Lee Y.-H., Moon D.-S., Yoon S.-C., Raymond J. C., 2013, Sci, 342, 1346
- Kutner & Ulich (1981) Kutner, M.L. & Ulich, B.L. 1981, ApJ, 250, 341
- Lebouteiller et al. (2006) Lebouteiller, V., Kuassivi, Ferlet, R. 2006, ASPC, 348, 480
- Lefloch et al. (2016) Lefloch, B., Vastel, C., Viti, S., Jiménez-Serra, I., Codella, C. et al. 2016, MNRAS 462, 3937
- Macía (2005) Maciá, E., 2005, Chem. Soc. Rev., 34, 691
- Milam et al. (2008) Milam, S.N., Halfen, D.T., Tenenbaum, E.D., Apponi, A.J., Woolf, N.J., Ziurys, L.M. 2008, ApJ, 684, 618
- Müller et al. (2005) Müller, H. S. P., Schlöder, F., Stutzki, J., & Winnewisser, G. 2005, J. Mol. Struct. 742, 215
- Ossenkopf & Henning (1994) Ossenkopf, V., & Henning, Th. 1994, A&A, 291, 943
- Pasek & Lauretta (2005) Pasek, M.A., & Lauretta, D.S. 2005, Astrobiology, 5, 515
- Pasek et al. (2017) Pasek, M.A., Gull, M. Herschy, B. 2017, Chemical Geology, 475, 149
- Rivilla et al. (2016) Rivilla, V.M., Fontani, F., Beltrán, M.T., Vasyunin, A., Caselli, P., Martín-Pintado, J., Cesaroni, R. 2016, ApJ, 826, 2
- Rivilla et al. (2018) Rivilla, V.M., Jiménez-Serra, I., Zeng, S.; Martín, S., Mart n-Pintado, J., Armijos-Abendano, J., Viti, S., et al. 2018, arXiv:171207006
- Roederer et al. (2014) Roederer I. U., Jacobson H. R., Thanathibodee T., Frebel A., Toller E., 2014, ApJ, 797, 69
- Tenenbaum et al. (2007) Tenenbaum E. D., Woolf N. J. & Ziurys L. M., 2007, ApJ, 666, L29
- Tobola et al. (2007) Tobola, K., Klos, J., Lique, F., Chalasinski, G., Alexander, M.H. 2007, A&A, 468, 1123
- Turner & Bally (1987) Turner, B.E. & Bally, J. 1987, ApJ, 321, L75
- Turner et al. (1990) Turner, B.E., Tsuji, T., Bally, J., Guelin, M., Cernicharo, J. 1990, ApJ, 365, 569
- Vasyunin & Herbst (2013) Vasyunin, A.I. & Herbst, E. 2013, ApJ, 769, 34
- Ziurys (1987) Ziurys, L.M. 1987, ApJ, 321, L81
Appendix A Derivation of H2 column densities and molecular abundances
| Source | (H2) | |||
| [Jy] | [1023 cm-2] | [kpc] | [K] | |
| HMSC | ||||
| AFGL5142-EC | 4.0(0.4) | 3.55 | 2.14(a) | 25 |
| 05358-mm3 | 4.5(0.2) | 3.13 | 1.8 | 30 |
| HMPO | ||||
| AFGL5142-MM | 6.0(0.2) | 3.55 | 2.14(a) | 34 |
| 18089–1732 | 6.7(0.3) | 3.44 | 3.6 | 38 |
| 18517+0437 | 3.4(0.2)(b) | 0.85(b) | 2.9 | 44 |
| G75-core | 8.3(0.2) | 1.47 | 3.8 | 96 |
| UCHII | ||||
| G5.89-0.39 | 17.3(0.7) | 21.1 | 1.3 | 20 |
| 19410+2336 | 3.85(0.05) | 4.38 | 2.1 | 21 |
| ON1 | 28(c) | 23.6(c) | 2.5 | 26 |
We have computed the H2 total column densities of the sources of our sample from the maps of Di Francesco et al. (2008), who have measured the dust emission at m (or GHz) with SCUBA at the JCMT, with an angular resolution of ′′. For 18517+0437 and ON1, absent in Di Francesco et al. (2008), we have used the images at m of the APEX ATLASGAL survey (http://www3.mpifr-bonn.mpg.de/div/atlasgal/index.html), and those otained with the CSO at m by Hunter et al. (2000). N(H2) was derived at all wavelengths from the equation: where is the total integrated flux density at frequency , is the source distance, is the dust mass opacity coefficient, extrapolated from the value of 1 cm2 gr-1 at 250 GHz (Ossenkopf & Henning 1994, assuming a dust opacity index , i.e. a spectral index ), and is the Planck function at dust temperature . The equation is valid for optically thin dust emission. Then, we have computed the H2 mass by multiplying for a mass gas-to-dust ratio of 100, from which we have computed the average H2 volume density assuming a spherical source, and finally computed by multiplying the volume density for the average diameter of the sources (assumed to be equal to the beam size). We used as dust temperatures the kinetic temperatures given in Fontani et al. (2011). The derived values of the hydrogen column densities, averaged within the beam sizes, are shown in Table 3. Finally, the molecular abundances shown in Fig. 2 have been then computed from the ratio between the molecular and (H2), after rescaling to 14′′ (19.2′′ for 18517+0437, 11′′ for ON1).