K2 photometry and HERMES spectroscopy of the blue supergiant Leo: rotational wind modulation and low-frequency waves††thanks: Based on the data gathered with NASA’s Discovery mission Kepler and with the HERMES spectrograph, installed at the Mercator Telescope, operated on the island of La Palma by the Flemish Community, at the Spanish Observatorio del Roque de los Muchachos of the Instituto de Astrofísica de Canarias and supported by the Fund for Scientific Research of Flanders (FWO), Belgium, the Research Council of KU Leuven, Belgium, the Fonds National de la Recherche Scientific (F.R.S.–FNRS), Belgium, the Royal Observatory of Belgium, the Observatoire de Genève, Switzerland and the Thüringer Landessternwarte Tautenburg, Germany.
Abstract
We present an 80-d long uninterrupted high-cadence K2 light curve of the B1Iab supergiant Leo (HD 91316), deduced with the method of halo photometry. This light curve reveals a dominant frequency of d-1 and its harmonics. This dominant frequency corresponds with a rotation period of 26.8 d and is subject to amplitude and phase modulation. The K2 photometry additionally reveals multiperiodic low-frequency variability (d-1) and is in full agreement with low-cadence high-resolution spectroscopy assembled during 1800 days. The spectroscopy reveals rotational modulation by a dynamic aspherical wind with an amplitude of about 20 km s-1 in the H line, as well as photospheric velocity variations of a few km s-1 at frequencies in the range 0.2 to 0.6 d-1 in the Si III 4567Å line. Given the large macroturbulence needed to explain the spectral line broadening of the star, we interpret the detected photospheric velocity as due to travelling super-inertial low-degree large-scale gravity waves with dominant tangential amplitudes and discuss why Leo is an excellent target to study how the observed photospheric variability propagates into the wind.
keywords:
Asteroseismology – Stars: massive – Stars: rotation – Stars: oscillations (including pulsations) – Techniques: photometry – Techniques: spectroscopy1 Introduction
Blue supergiants are in the least understood stage of the evolution of massive stars. Lack of understanding of this stage is unfortunate, since the successors of these stars play a key role in the chemical evolution of their host galaxy. The nucleosynthetic yields after the blue supergiant stage are strongly dependent on the helium core mass at the onset of hydrogen shell burning and how the material gets mixed in the stellar interior during the pre-supernova evolution (e.g., Heger et al., 2000; Langer, 2012). It would thus be highly beneficial if blue supergiant variability could be monitored and exploited in terms of the interior physical properties, just as it has recently become possible for evolved low- and intermediate-mass stars from asteroseismology (Bedding et al., 2011; Mosser et al., 2014; Aerts et al., 2017b). For blue supergiants, this requires uninterrupted high-precision space photometry covering months to years, but such data sets are scarce.
Long-term ground-based photometry of mmag-level precision (e.g., van Genderen, 1989; Lamers et al., 1998, and references therein) and spectroscopy of km s-1 precision (e.g., Markova et al., 2005; Simón-Díaz et al., 2010; Martins et al., 2015; Kraus et al., 2015) devoted to blue supergiants typically had sparse sampling and led to aliasing and high noise levels in the Fourier spectra. As a result, the interpretation of blue supergiant variability from ground-based data remained limited. Ultra-violet space spectroscopy was found to be more useful in this respect. Indeed, time-series spectroscopy from the International Ultraviolet Explorer revealed narrow and discrete absorption components due to rotational modulation and wind variability in the line profiles of blue supergiants (Prinja & Howarth, 1986; Massa et al., 1995). Moreover, the low-cadence mmag-precision Hipparcos photometry led to the detection of coherent gravity-mode oscillations in some blue supergiants (Lefever et al., 2007).
With the availability of high-cadence mag-level precision space photometry, a new era has begun for the detection and interpretation of blue supergiant variability. The few earliest data sets revealed large diversity in behaviour and periodicities, making it clear that the search for optimal asteroseismology targets among blue supergiants is challenging (Lefèvre et al., 2005; Saio et al., 2006; Moffat et al., 2008; Aerts et al., 2010; Moravveji et al., 2012; Aerts et al., 2013). A step forward was achieved from combined Kepler photometry and long-term high-resolution spectroscopy of the O9.5Iab star HD 188209 (Aerts et al., 2017a). These data revealed low-frequency photospheric variability due to travelling gravity waves, propagating into the wind. A similar study for the more evolved B1Ia supergiant HD 2905 had to rely on low-cadence Hipparcos photometry and ground-based spectroscopy and revealed similar variability (Simón-Díaz et al., 2018), although the wind behaviour is more dominant for that star.
In this paper, we report the detection of low-frequency variability in K2 halo photometry of the bright blue supergiant Leo (HD 91316, B1Iab, V=3.87). We also performed HERMES spectroscopy of the star with the aim to assess its asteroseismic potential. We present the target in Section 2, each of the two new data sets in Sections 3 and 4, and discuss our interpretation of Leo’s variability in Section 5.
2 The target Leo
In their sample study of blue supergiants, Crowther et al. (2006) obtained the following stellar parameters of Leo: K, , , , yr-1. Recently, Kholtygin & Sudnik (2016) concluded from a 3.5 h high-cadence time series of high-precision high-resolution spectroscopy that the star reveals non-radial oscillations. Moreover, these authors deduced that the variability signatures due to these oscillations propagate into the wind of the star.
In their extensive spectroscopy study of OB stars, Simón-Díaz & Herrero (2014) found Leo to have km s-1 and a large macroturbulent line-broadening of 72 km s-1. Such large macroturbulence is naturally explained by multiperiodic large-scale tangential velocity fields in the photosphere (Aerts et al., 2009). The star was included in the MiMeS survey to search for a surface magnetic field (Wade et al., 2016), but these data led to a null detection at the level of a few Gauss (Neiner, private communication) and exclude surface magnetism as an explanation of the macroturbulence.
3 K2 Halo Photometry
Following the idea of scattered-light Kepler photometry of the blue supergiant HD 188209 in the nominal Field-of-View of the mission (Aerts et al., 2017a), the technique of halo photometry was developed and is meanwhile well established for the follow-up K2 mission (Pope et al., 2016; White et al., 2017). We hence proposed Leo for K2 halo photometry during Campaign 14 of the mission. The K2 data set of Leo consists of long-cadence (29.4 min) data covering 79.64 d.
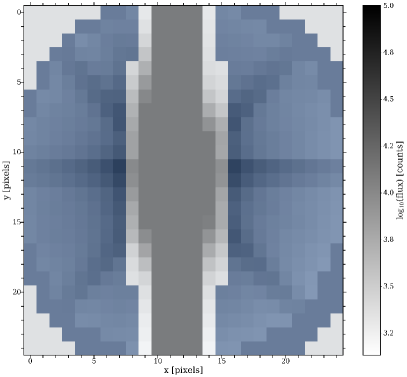
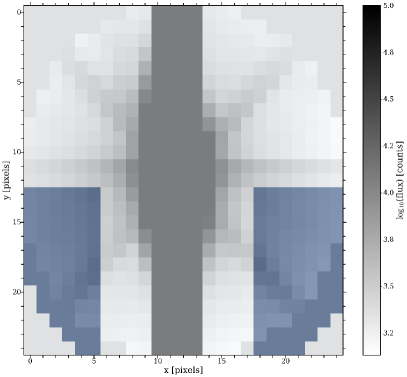
We used the K2 pixel data as provided in MAST111archive.stsci.edu/kepler/data-search/search.php and deduced halo photometric light curves by adopting four different masks. The four custom halo aperture masks were constructed from the stacked images, where the saturated pixels centered on the star, as well as the very outer regions, were avoided. We considered the four masks shown in Fig. 10 in Appendix A. Each of the four customised apertures was kept fixed to deduce four versions of the light curve. This photometry was subsequently passed through the k2sc software package (Aigrain et al., 2015; Aigrain et al., 2016; Aigrain et al., 2017) to correct for the pixel drifts and their related instrumental effects. An outlier rejection was applied to this photometry and we finally corrected for a long-term (instrumental) trend by means of a linear polynomial. The four versions of the light curve, with the K2 flux transformed to brightness expressed in mmag, are overplotted in Fig. 1. They are almost indistinguishable from each other. Given the very different masks, we are confident that the halo photometry reveals the variability of Leo itself and is not contaminated by any other source. The K2 data set has a time base of 79.64 d, leading to a frequency resolution (Rayleigh limit) of 0.0126 d-1.
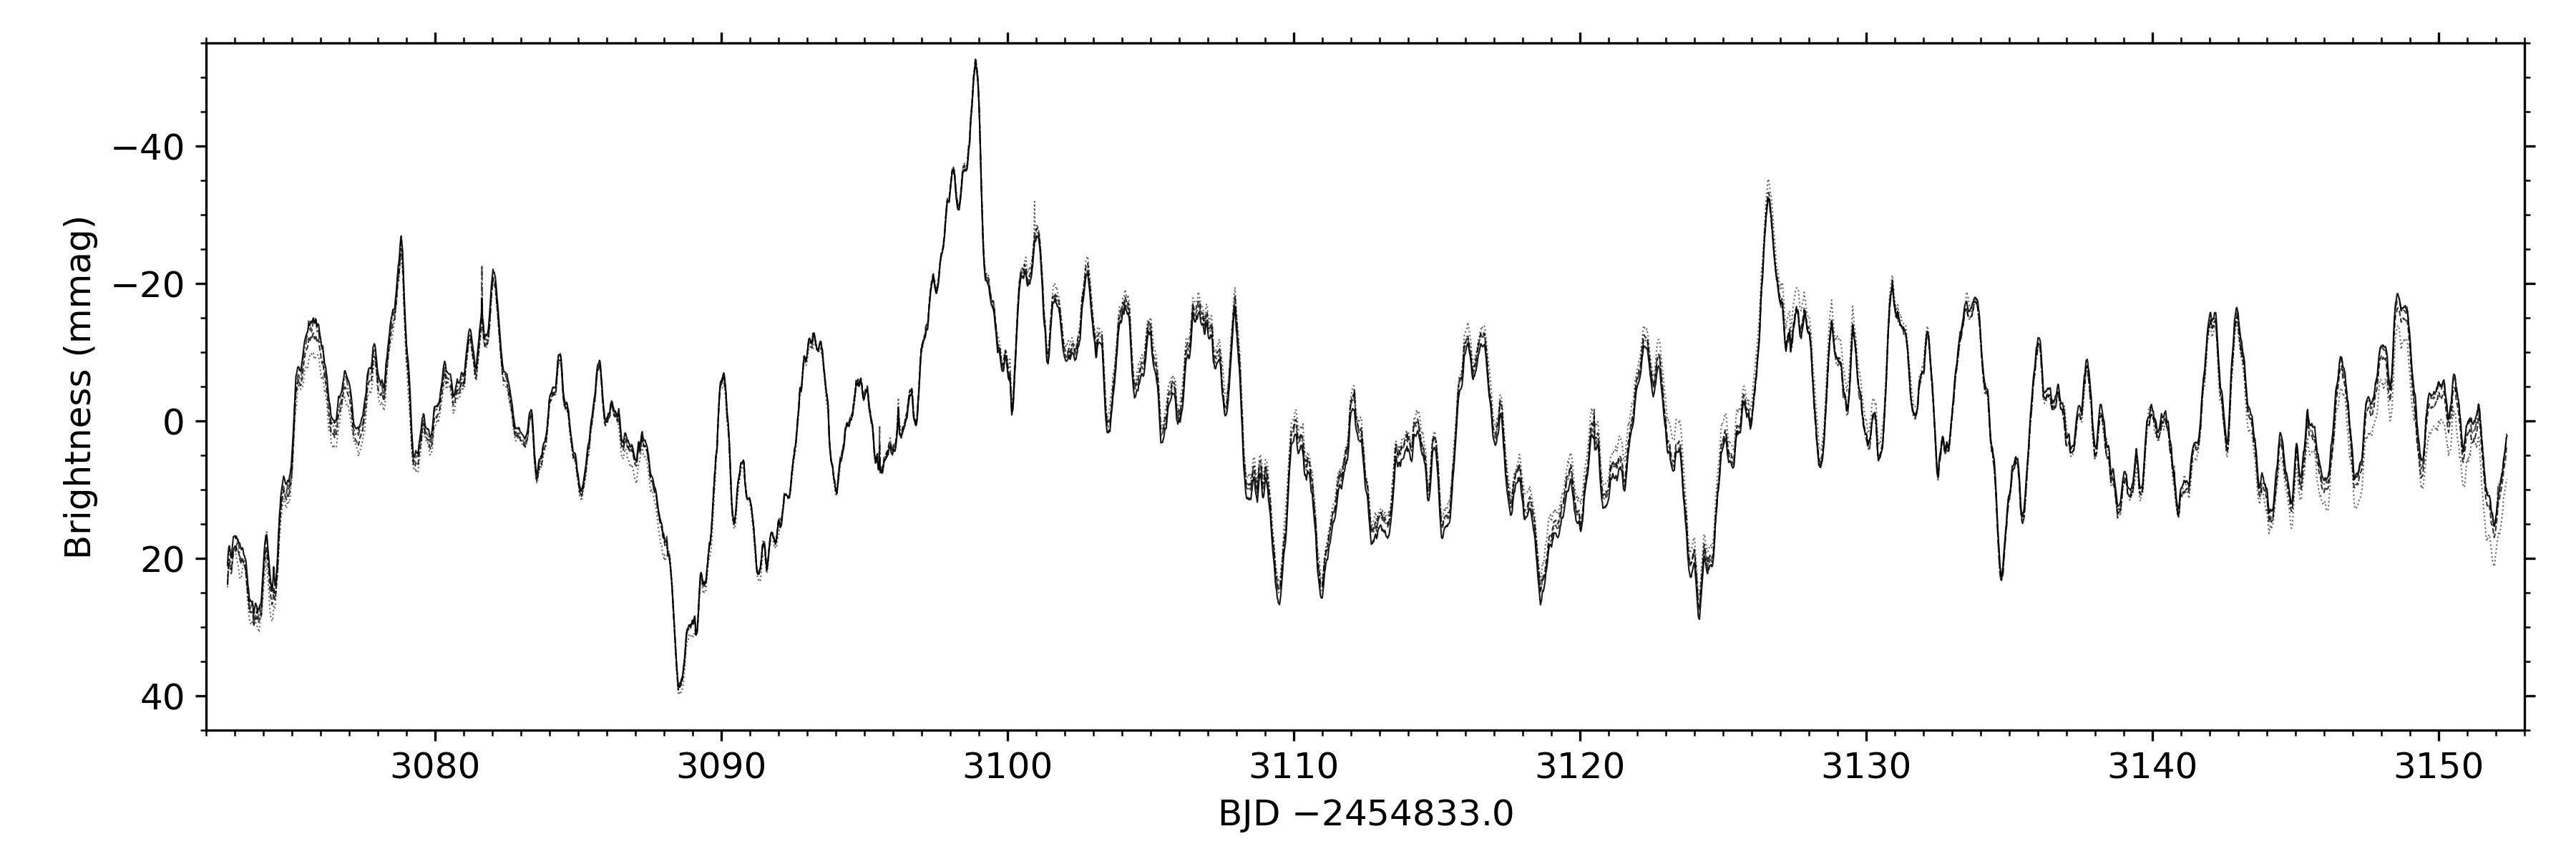
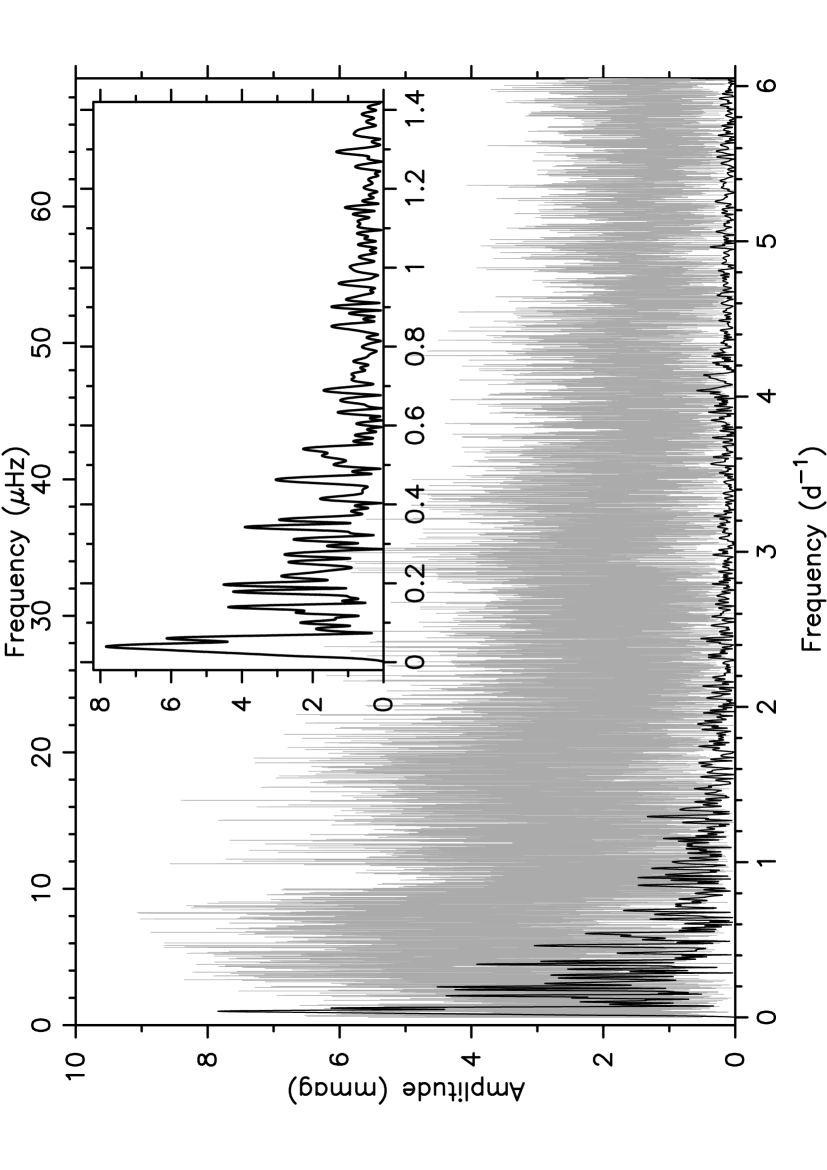
All frequency analyses of the four light curves shown in Fig. 1 give the same conclusions; in the rest of the paper we show the results for the full line in Fig. 1 based on the mask in the upper left panel of Fig. 10. Scargle amplitude spectra of the K2 and Hipparcos photometry are shown in Fig. 2. No significant variability due to the star is detected above 6 d-1. It can be seen that the Hipparcos data were of insufficient quality to detect Leo’s photometric variability, but that the K2 data reveals periodic signal. The dominant frequency occurs at d-1 with an amplitude of mmag. The statistical frequency error is far below the uncertainty due to the low resolving power of 0.0126 d-1. An unresolved secondary frequency peak closer than the Rayleigh limit to occurs, in addition to numerous unresolved low-amplitude frequencies.
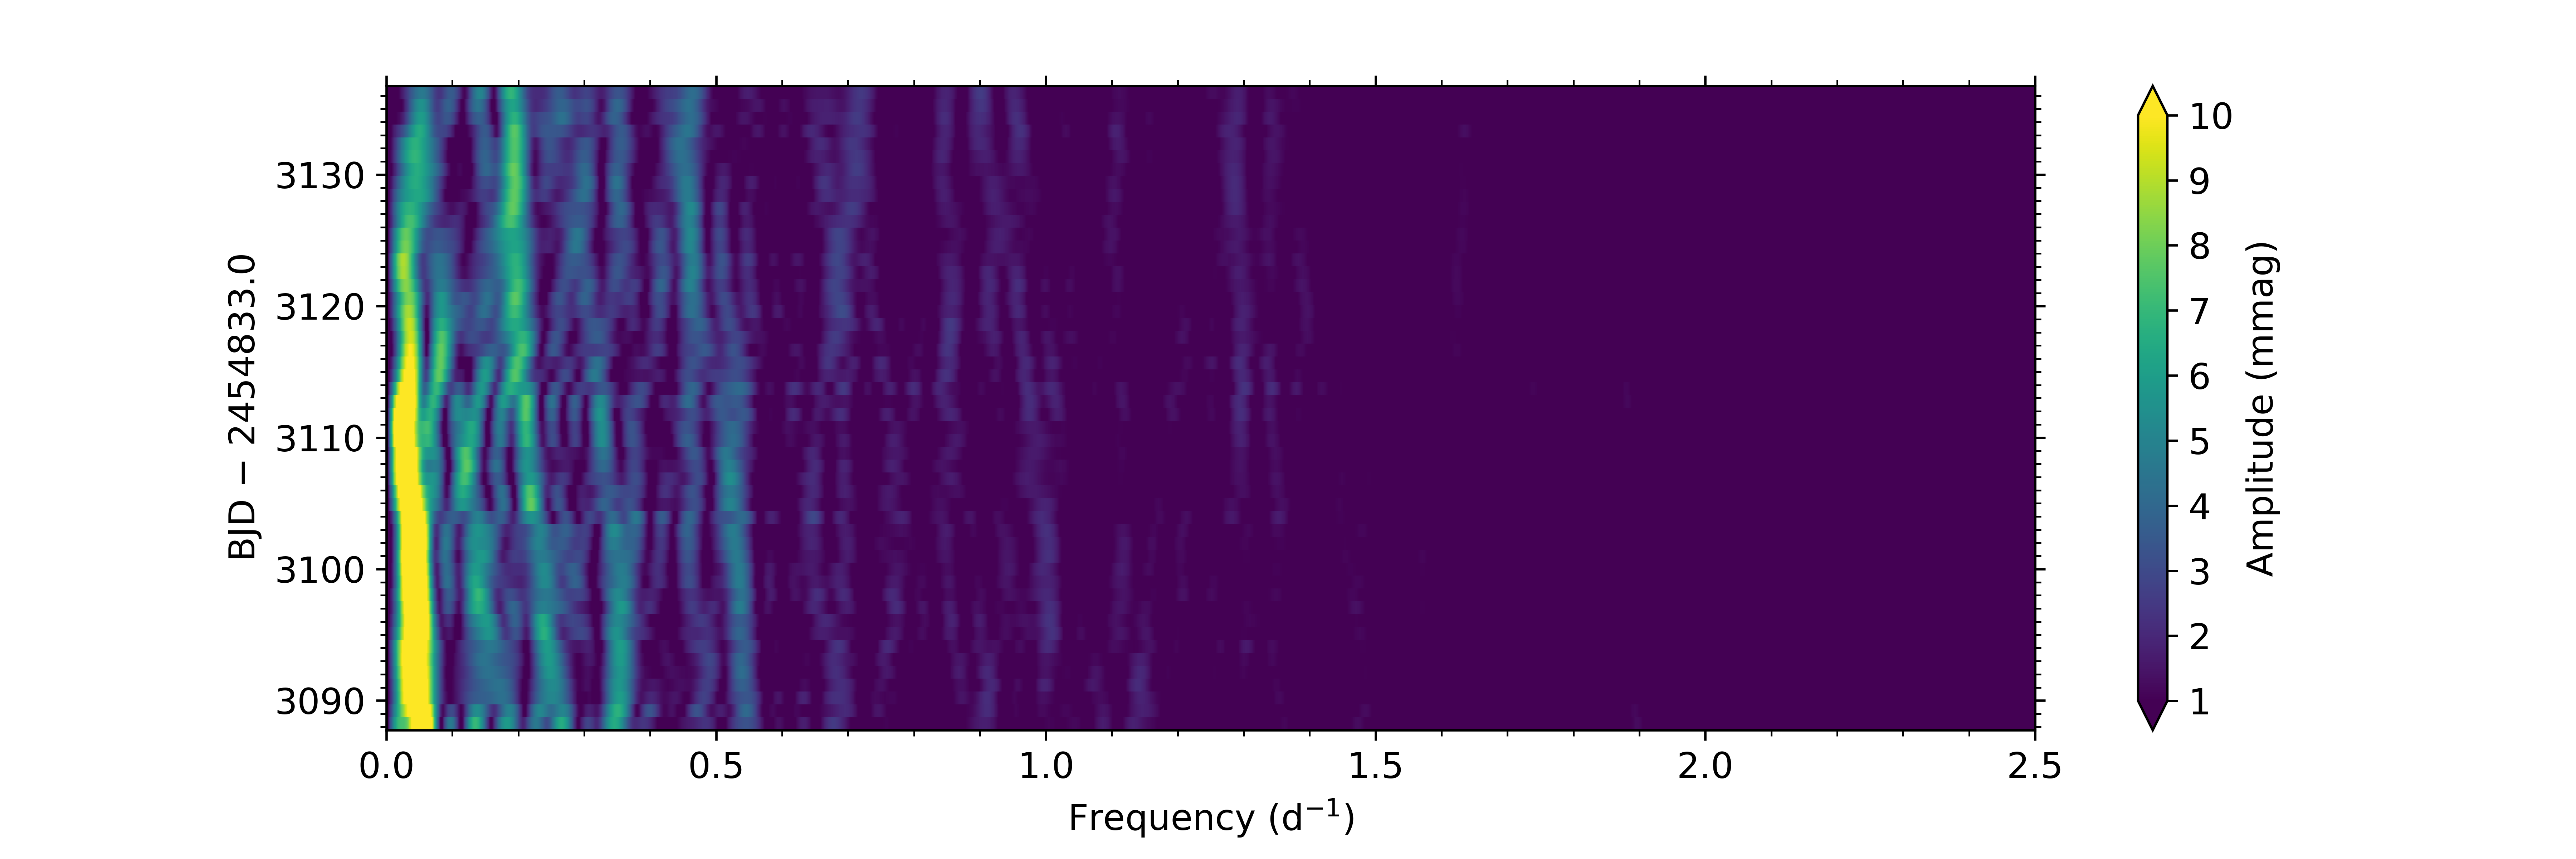
Figure 3 shows a Short-Term Fourier-Transform (STFT) for the K2 data. Each of the colour-coded stacked Fourier Transforms is oversampled by a factor of 10. A moving time step of 1 d and a window size of 30 d was used to create this STFT, but the result is independent of this particular choice. It can be seen that exhibits amplitude and frequency modulation. This is also the case for other frequency peaks. Due to the Rayleigh limit, we are unable to distinguish intrinsic amplitude and frequency modulation of one feature from multiperiodic beating due to unresolved frequencies. Hence, any prewhitening procedure may introduce spurious signal in the residuals, given the unresolved nature of and its harmonics. For this reason, we first turn to sparse but long-term spectroscopy to improve upon the value of , before interpreting the K2 halo photometry further.
4 HERMES Spectroscopy
We included Leo in an ongoing long-term spectroscopic monitoring program (Simón-Díaz et al., 2015) to assemble multi-instrument data similar to those used in the study of HD 188209 (Aerts et al., 2017a) and HD 2905 (Simón-Díaz et al., 2018). Here, we limit our analysis to the currently available 293 spectra taken with the HERMES spectrograph (Raskin et al., 2011) attached to the 1.2m Mercator telescope at La Palma Observatory, which covers a time base of 1800 d (Rayleigh limit of d-1). Given the mmag variability of Leo, we have intensified the ongoing spectroscopic monitoring to reach higher cadence, but the current HERMES data are sufficient to refine the dominant frequencies of the star.
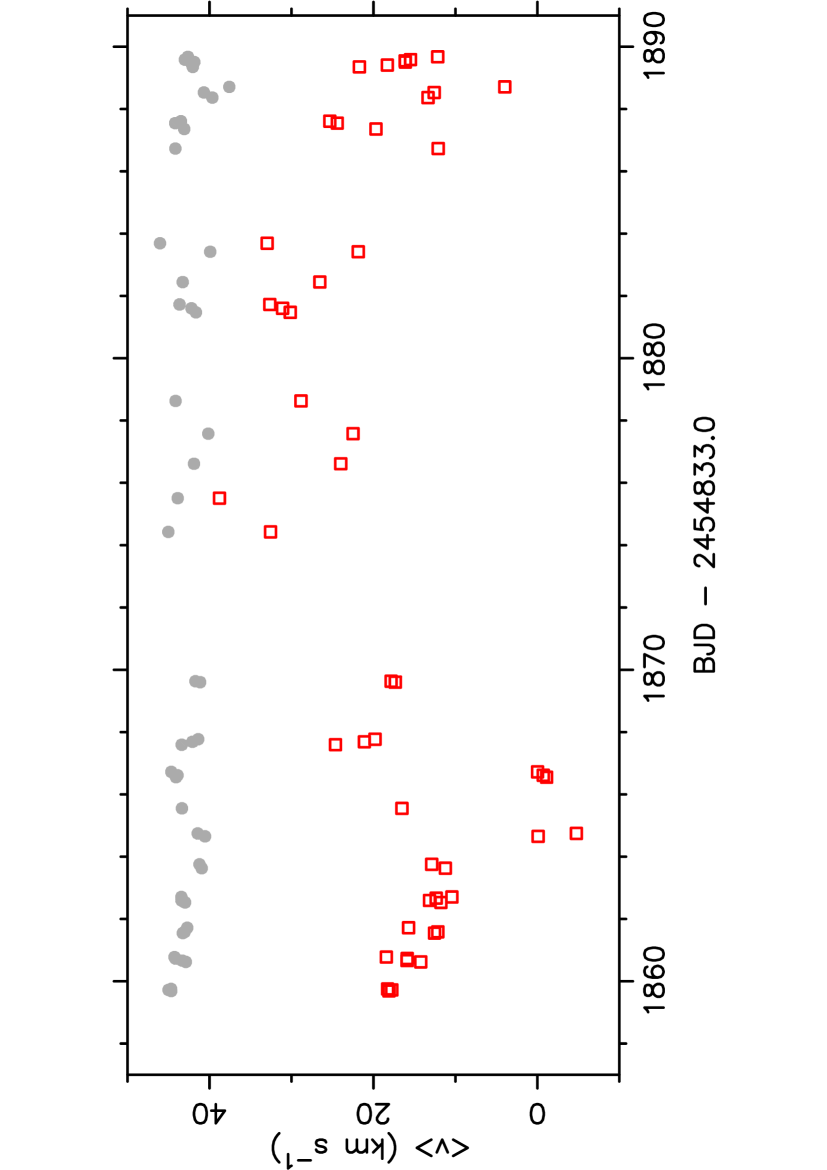
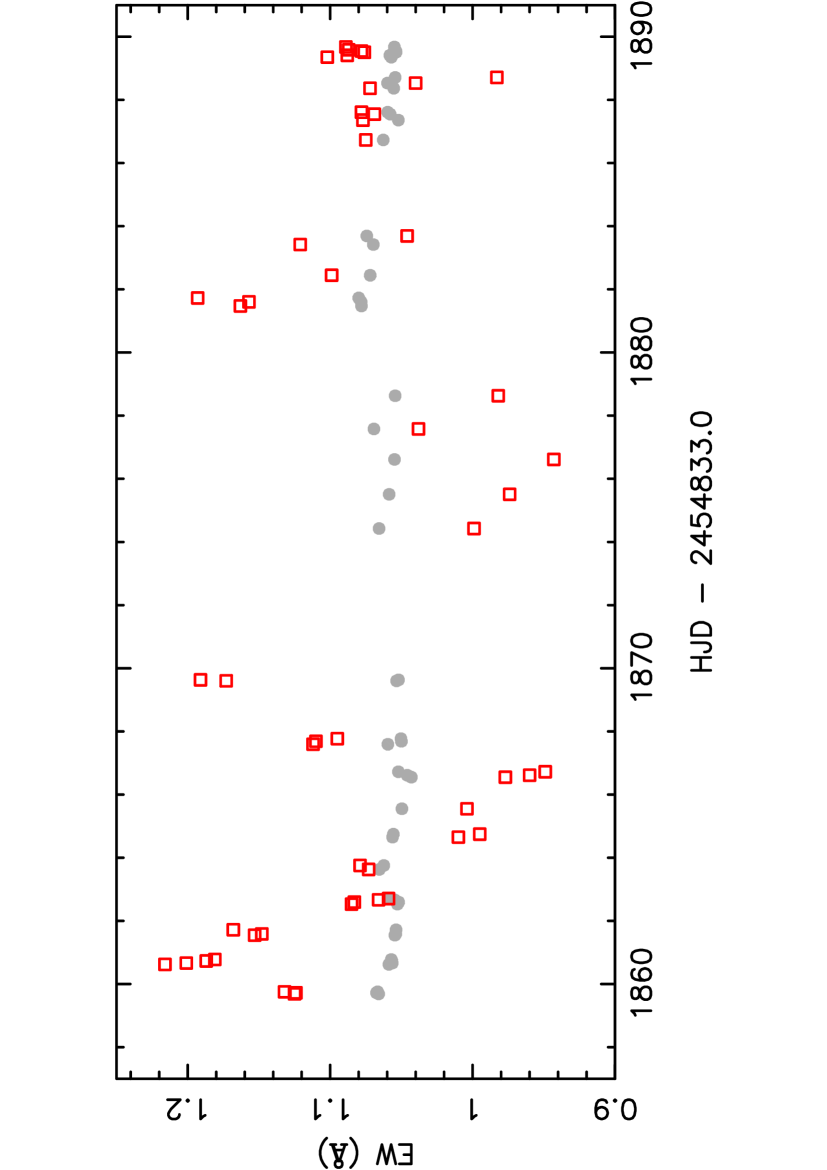
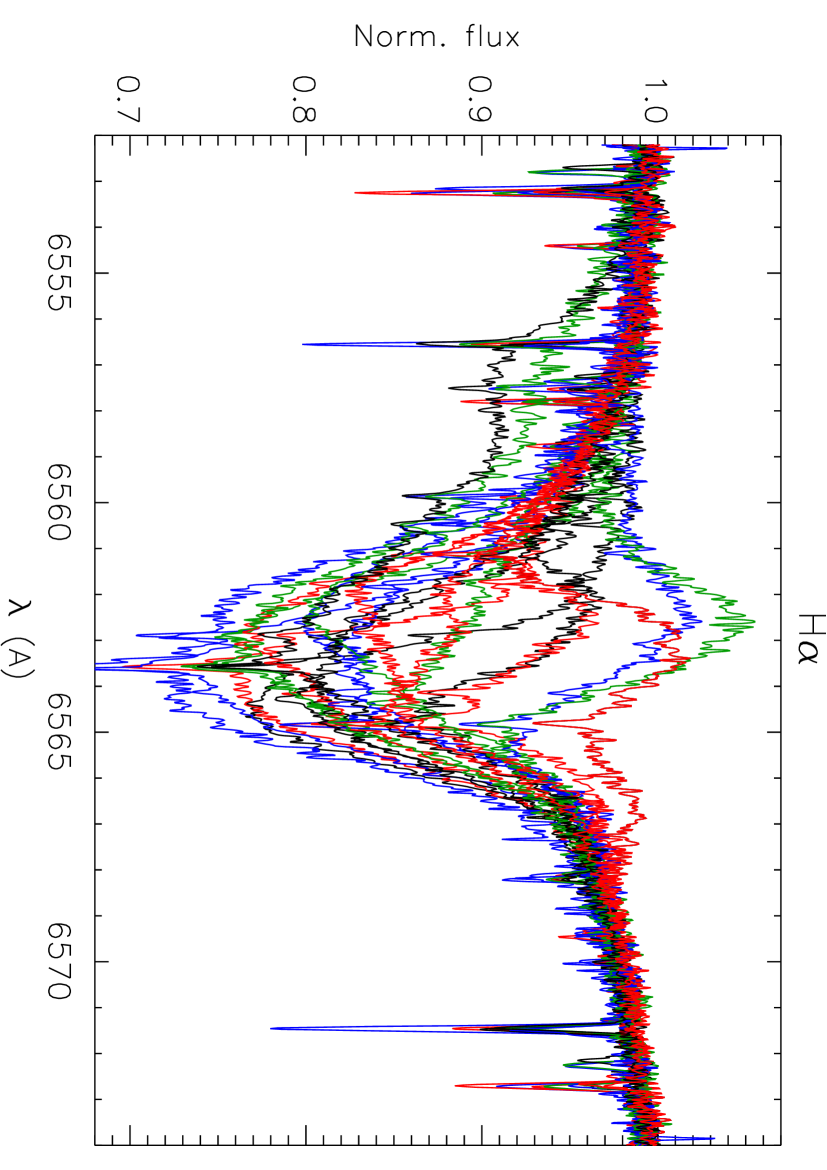
In this initial paper, we focus on the equivalent width (EW) and radial velocity of the photospheric line Si III 4567Å and the H wind line to demonstrate that different mechanisms are responsible for the variability in these regions of the envelope and atmosphere of Leo. We use these two line diagnostics to highlight that similar variability to that in the K2 photometry is also present in the low-cadence optical spectroscopy. These two quantities are computed as the zeroth- and first-order moments of the lines, where EW captures temperature variations and centroid velocity variations (Aerts et al., 1992). Figures 4 and 5 show the only “dense” part of these otherwise sparsely sampled data and reveal (quasi-)periodicity. The H line, formed at the base of the stellar wind, shows complex and large-amplitude variations with a dominant time scale of d in and about half this period in EW. To further demonstrate the variability in H, we show 20 epochs of spectroscopic observations in Fig. 6, which vary between strong absorption and weak emission. The time scale and amplitude of this variability differ to that of the photospheric Si III 4567Å line, which can also be seen in Figs 4 and 5.
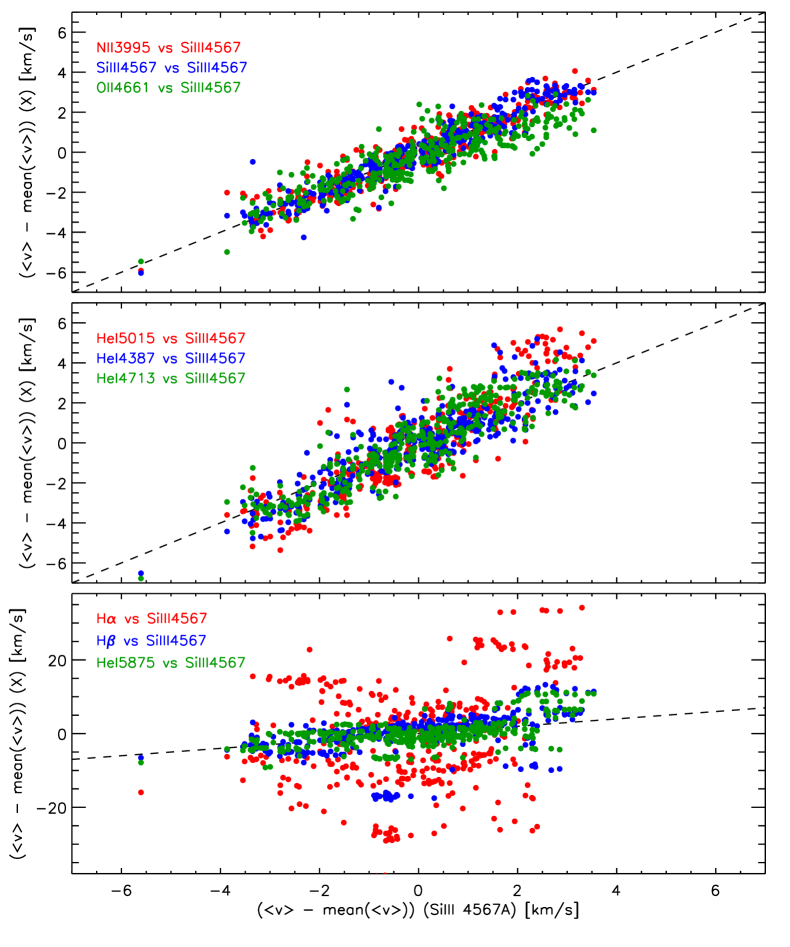
Just as in Simón-Díaz et al. (2018, their Fig. 6), we studied the variability of the zeroth and first moments of various lines formed in the photosphere in addition to Si III 4567Å. Even though our spectroscopic monitoring of the star is still ongoing, the current HERMES spectroscopy already reveals that the moments of various photospheric lines are strongly correlated with each other, as illustrated in Fig. 7. Similar coherent periodicity was found in photospheric lines of the early-B supergiant HD 2905 (Simón-Díaz et al., 2018). Furthermore, we investigated the zeroth and first moment variability of other lines partially formed in the wind, including H and H, and found that their variability is different from the one of the photospheric lines (see also Fig. 7). This indicates that the dynamic wind of Leo alters the observed variability in the photosphere, again as in HD 2905 (Simón-Díaz et al., 2018). A more detailed analysis using continuing but higher-cadence spectroscopy will be provided in a future follow-up paper. For the purposes of the present paper, the photospheric line Si III 4567Å and the H wind line are fully representative and sufficient to probe the variability mechanism in the photosphere and wind of Leo.
We now turn to the Fourier analysis of the EW and of the Si III 4567Å and the H lines. Scargle amplitude spectra of these four full data sets are heavily affected by daily aliasing but the EW of both lines are dominated by a frequency close to and , within the Rayleigh limit of the K2 data. This is also the case for the H data; the Si data indicate a dominant low-amplitude (km s-1) frequency near d-1. In each of the individual data sets, these frequencies reach low significance, typically between 2 and 4 .
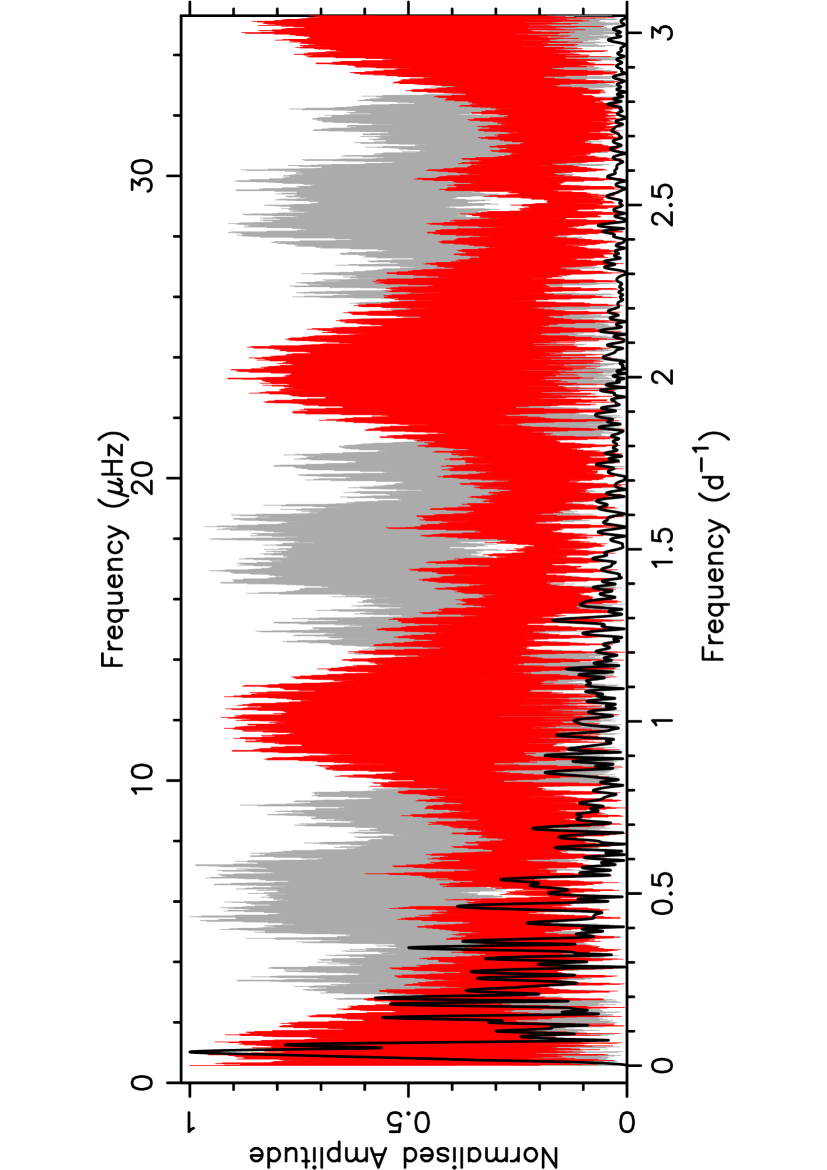
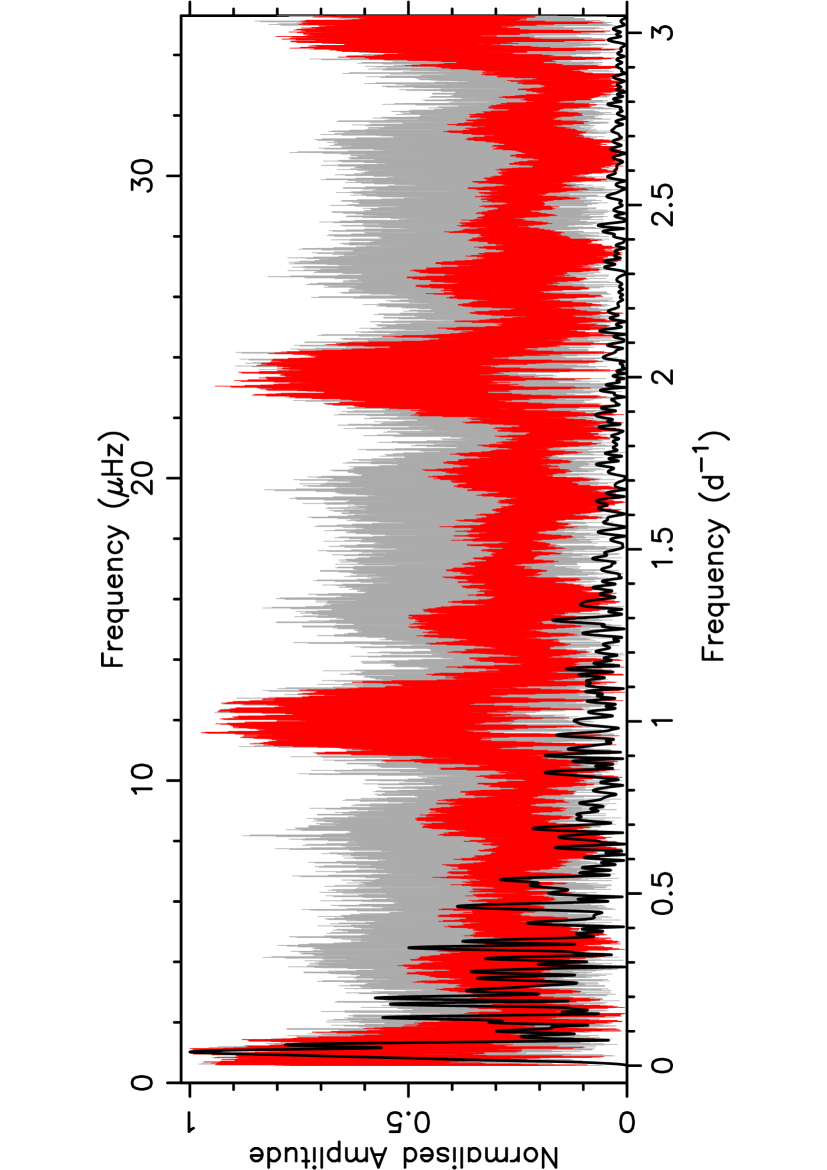


As in Aerts et al. (2017a), we exploit the full potential of the totally independent K2 and HERMES data sets by “merging” the information in the Fourier domain. This is done by computing harmonic geometric means of the normalised dimensionless individual Scargle amplitude spectra, where we give equal weight to the K2, H, and Si III 4567Å data. In this way, we combine the high-cadence uninterrupted K2 data with time base of 80 d with the low-cadence aliased HERMES photospheric and wind data with time base of 1800 d. This has the aim to illustrate which frequencies are present in the multiple datasets, but we refrain from any formal statistical interpretation in terms of significance. The result is shown in Fig. 8 and leads to a dominant frequency based on EW of d-1, well within the K2 Rayleigh limit of . The dominant frequency for is slightly different. This is not surprising as it is determined by the velocity rather than the temperature variations in the photosphere. As this frequency gives a much poorer fit to the K2 data, we select the frequency on the basis of EW and interpret as the best estimate of the rotation frequency of the star (with corresponding rotation period of 26.8 d). Harmonics of occur in both the and EW multiplied Scargle amplitude spectra. The latter confirm the findings based on the K2 data alone and revealed by Fig. 3: the dominant K2 frequency is due to cyclic variabillity caused by rotational modulation by an aspherical stellar wind and reveals fine structure due to a variable amplitude and frequency. This is illustrated quantitatively in Fig. 9, where we show the amplitude and phase of computed from the K2 data following the methodology of Bowman et al. (2016). The figure represents the amplitude and phase of by tracking them at fixed frequency using 30-d time bins with a 1-d moving time step. Values of amplitude and phase were optimised using linear least-squares fits in each time bin and plotted against time. The zero-point of the time-scale for the phases is BJD 2454943.0. Results are qualitatively similar for other combinations of bin duration and overlap, but Fig. 9 represents the best compromise between frequency and temporal resolution in the STFT.
The multiplied amplitude spectrum in Fig. 8 reveals two more frequencies that stand out beyond the fine structure of the rotational frequency: d-1 and d-1. These hardly occur in the EW spectrum nor in the individual Scargle spectrum of the H . These two frequencies are therefore interpreted as due to velocity variations in the photosphere. Both of them also occur in the K2 data, at low amplitude. This suggests a different astrophysical cause compared to and we interpret these frequencies, along with several others in Fig. 8 that peak above 0.2, in Fig. 3, as due to gravity waves — whether this photospheric variability is caused by coherent gravity-mode oscillations or convectively-driven travelling gravity waves, or a combination thereof, cannot be deduced from the K2 data due to the too limited time base of 80 d. The frequency spectra derived from numerical simulations of gravity waves in massive stars have a similar morphology to that shown in Fig. 8 (Rogers et al., 2013; Aerts & Rogers, 2015; Aerts et al., 2017a; Simón-Díaz et al., 2018), which supports this interpretation as the cause of the photospheric variability in Leo. Furthermore, Leo lies within the parameter space of the instability strip on the Hertzsprung–Russell diagram, in which high-degree coherent gravity-mode oscillations are predicted (Star “C” in Fig. 3 of Godart et al., 2017). Gravity waves have dominant tangential amplitudes, which we observe for Leo in spectroscopy of the photospheric lines, supporting this interpretation. For either the case of travelling gravity waves or coherent gravity modes, our detection of the photospheric variability using both high-quality K2 space photometry combined with high-resolution spectroscopy is in full agreement with the similar detection by Kholtygin & Sudnik (2016).
5 Interpretation and Discussion
We unravelled the dominant causes of the variability of the blue supergiant Leo from combined 80 d K2 halo photometry and 1800 d high-resolution spectroscopy. All variability occurs at frequencies below 1.5 d-1. We find that the dominant variability is caused by rotational modulation at the base of the aspherical stellar wind, with amplitudes of about 8 mmag in photometry and 20 km s-1 in velocity as revealed by H (Figs 1, 4, and 5). Variability with amplitudes below 2 km s-1 in velocity and 4 mmag in brightness are connected with velocity and temperature variations in the photosphere. These low-amplitude variations are interpreted as due to gravity waves caused by convective driving or by an opacity mechanism in the envelope. This interpretation relies on the large macroturbulent velocity measured in the spectral line wings of the star, which requires tangential rather than vertical velocity fields. The velocity variations occur at frequencies that are an order of magnitude higher than the rotation frequency, indicating super-inertial large-scale waves of low degree.
The tangential velocities associated with convectively-driven gravity waves in the stellar photosphere of massive stars are of order a tenth of a km s-1 for an individual wave (Rogers et al., 2013), but the combined effect of hundreds of gravity waves is similar to the effect of a few coherent heat-driven gravity-mode oscillations (Aerts & Rogers, 2015). Thus, both travelling gravity waves and coherent gravity modes are feasible explanations for the variability observed in the K2 space photometry and high-resolution HERMES spectroscopy of Leo, which is similar to the conclusions made recently for other O and B supergiants (Aerts et al., 2017a; Simón-Díaz et al., 2018) and previously for Leo by Kholtygin & Sudnik (2016).
Besides the studies of HD 188209 (O9.5Iab) and HD 2905 (B1Ia), combined long-term space photometry and high-resolution spectroscopy was recently also assembled for the fast rotator Puppis (spectral type O4I(n)fp, Ramiaramanantsoa et al., 2017). The BRITE photometry revealed cyclic variability at the base of the stellar wind with a rotation period of d, as well as stochastic low-amplitude variability assigned to sub-surface convection. A quantitative comparison between the frequency spectra caused by convection/granulation velocities must await 3D convection simulations in the envelope of OB stars. 2D numerical simulations of gravity waves do lead to the appropriate horizontal velocity fields that explain macroturbulence (Aerts et al., 2009; Aerts & Rogers, 2015), but this must yet be proven for velocities due to convection. A key question is whether surface convection can give rise to large-scale tangential velocity fields in the appropriate frequency range.
Should convective motions cause the detected variability, one also expects some level of granulation to occur in addition to stochastic variability, as is the case for acoustic waves excited in the envelope of red giants. Using the approximation of granulation scales from Kallinger & Matthews (2010) for the mass, radius and Teff estimates for Leo, and assuming that the solar values can be scaled, leads to granulation signal at frequencies d-1. With the current K2 data set at hand, we cannot explicitly rule out near-surface convection and granulation as (one of) the causes of the detected multiperiodic variability of Leo. However, the shape of the detected frequency spectrum is more in line with gravity waves, because we see isolated frequency peaks that resemble a discrete spectrum of eigenvalues of the star.
We are currently in the process of obtaining further high-resolution and high-cadence spectroscopy of Leo. In a follow-up study, we will carry out a detailed quantitative analysis of various spectral lines that are formed at different depths in the photosphere and in the wind. This will allow the derivation of the tangential versus vertical velocity structure, as well as how the photospheric variability, concluded to be non-radial gravity-modes oscillations by Kholtygin & Sudnik (2016) and/or travelling gravity waves in this work, propagates into the wind. The wind in Leo is clearly a dynamic and turbulent environment, as indicated by the line profile variability of H shown in Fig. 6 varying between strong absorption and emission. Furthermore, the variability of other lines formed partially in the wind (i.e., H and H) vary differently with smaller amplitudes than that of H but larger than those of pure photospheric lines. Therefore, Leo is a promising target to investigate how photospheric variability propagates into the wind (see e.g., Kholtygin & Sudnik 2016).
Our study once more illustrates the power of combined high-cadence uninterrupted space photometry with a time base of months and ground-based high-resolution spectroscopy covering several years. Such a combination is necessary for a proper interpretation of hot supergiant variability and the hunt for optimal asteroseismic targets among blue supergiants.
Acknowledgements
The research leading to these results has received funding from the European Research Council (ERC) under the European Union’s Horizon 2020 research and innovation programme (grant agreement N∘670519: MAMSIE). S. S-D. acknowledges funding by the Spanish Ministry of Economy and Competitiveness (MINECO) under the grants AYA2010-21697-C05-04, AYA2012-39364-C02-01, and Severo Ochoa SEV-2011-0187. P.G.B. acknowledges support through the MINECO-programme ‘Juan de la Cierva Incorporacion’ (IJCI-2015-26034). D.H. acknowledges support by the Australian Research Council’s Discovery Projects funding scheme (project number DE140101364) and support by the National Aeronautics and Space Administration under Grant NNX14AB92G issued through the Kepler Participating Scientist Program. T.R.W. acknowledges the support of the Villum Foundation (research grant 10118). This paper includes data collected by the K2 mission. Funding for K2 is provided by the NASA Science Mission directorate. The authors wish to thank the K2 Guest Observer Office for all their efforts and support to the scientific community. The K2 data presented in this paper were obtained from the Mikulski Archive for Space Telescopes (MAST). Support for MAST for non-HST data is provided by the NASA Office of Space Science via grant NNX09AF08G and by other grants and contracts. We thank the referee for reading the paper and providing constructive suggestions for improving its content.
References
- Aerts & Rogers (2015) Aerts C., Rogers T. M., 2015, ApJ, 806, L33
- Aerts et al. (1992) Aerts C., de Pauw M., Waelkens C., 1992, A&A, 266, 294
- Aerts et al. (2009) Aerts C., Puls J., Godart M., Dupret M.-A., 2009, A&A, 508, 409
- Aerts et al. (2010) Aerts C., et al., 2010, A&A, 513, L11
- Aerts et al. (2013) Aerts C., et al., 2013, A&A, 557, A114
- Aerts et al. (2017a) Aerts C., et al., 2017a, A&A, 602, A32
- Aerts et al. (2017b) Aerts C., Van Reeth T., Tkachenko A., 2017b, ApJ, 847, L7
- Aigrain et al. (2015) Aigrain S., Hodgkin S. T., Irwin M. J., Lewis J. R., Roberts S. J., 2015, MNRAS, 447, 2880
- Aigrain et al. (2016) Aigrain S., Parviainen H., Pope B. J. S., 2016, MNRAS, 459, 2408
- Aigrain et al. (2017) Aigrain S., Parviainen H., Roberts S., Reece S., Evans T., 2017, MNRAS, 471, 759
- Bedding et al. (2011) Bedding T. R., et al., 2011, Nature, 471, 608
- Bowman et al. (2016) Bowman D. M., Kurtz D. W., Breger M., Murphy S. J., Holdsworth D. L., 2016, MNRAS, 460, 1970
- Crowther et al. (2006) Crowther P. A., Lennon D. J., Walborn N. R., 2006, A&A, 446, 279
- Godart et al. (2017) Godart M., Simón-Díaz S., Herrero A., Dupret M. A., Grötsch-Noels A., Salmon S. J. A. J., Ventura P., 2017, A&A, 597, A23
- Heger et al. (2000) Heger A., Langer N., Woosley S. E., 2000, ApJ, 528, 368
- Kallinger & Matthews (2010) Kallinger T., Matthews J. M., 2010, ApJ, 711, L35
- Kholtygin & Sudnik (2016) Kholtygin A. F., Sudnik N. P., 2016, MNRAS, 458, 1604
- Kraus et al. (2015) Kraus M., et al., 2015, A&A, 581, A75
- Lamers et al. (1998) Lamers H. J. G. L. M., Bastiaanse M. V., Aerts C., Spoon H. W. W., 1998, A&A, 335, 605
- Langer (2012) Langer N., 2012, ARA&A, 50, 107
- Lefever et al. (2007) Lefever K., Puls J., Aerts C., 2007, A&A, 463, 1093
- Lefèvre et al. (2005) Lefèvre L., et al., 2005, ApJ, 634, L109
- Markova et al. (2005) Markova N., Puls J., Scuderi S., Markov H., 2005, A&A, 440, 1133
- Martins et al. (2015) Martins F., Marcolino W., Hillier D. J., Donati J.-F., Bouret J.-C., 2015, A&A, 574, A142
- Massa et al. (1995) Massa D., et al., 1995, ApJ, 452, L53
- Moffat et al. (2008) Moffat A. F. J., et al., 2008, ApJ, 679, L45
- Moravveji et al. (2012) Moravveji E., Guinan E. F., Shultz M., Williamson M. H., Moya A., 2012, ApJ, 747, 108
- Mosser et al. (2014) Mosser B., et al., 2014, A&A, 572, L5
- Pope et al. (2016) Pope B. J. S., et al., 2016, MNRAS, 455, L36
- Prinja & Howarth (1986) Prinja R. K., Howarth I. D., 1986, ApJS, 61, 357
- Ramiaramanantsoa et al. (2017) Ramiaramanantsoa T., et al., 2017, MNRAS, in press (arXiv1710.08414),
- Raskin et al. (2011) Raskin G., et al., 2011, A&A, 526, A69
- Rogers et al. (2013) Rogers T. M., Lin D. N. C., McElwaine J. N., Lau H. H. B., 2013, ApJ, 772, 21
- Saio et al. (2006) Saio H., et al., 2006, ApJ, 650, 1111
- Simón-Díaz & Herrero (2014) Simón-Díaz S., Herrero A., 2014, A&A, 562, A135
- Simón-Díaz et al. (2010) Simón-Díaz S., Herrero A., Uytterhoeven K., Castro N., Aerts C., Puls J., 2010, ApJ, 720, L174
- Simón-Díaz et al. (2015) Simón-Díaz S., et al., 2015, in Cenarro A. J., Figueras F., Hernández-Monteagudo C., Trujillo Bueno J., Valdivielso L., eds, Highlights of Spanish Astrophysics VIII. pp 576–581 (arXiv:1504.04257)
- Simón-Díaz et al. (2018) Simón-Díaz S., Aerts C., Urbaneja M. A., Camacho I., Antoci V., Fredslund Andersen M., Grundahl F., Pallé P. L., 2018, A&A, in press (arXiv1711.08994),
- Wade et al. (2016) Wade G. A., et al., 2016, MNRAS, 456, 2
- White et al. (2017) White T. R., et al., 2017, MNRAS, 471, 2882
- van Genderen (1989) van Genderen A. M., 1989, A&A, 208, 135
Appendix A Additional figures: K2 masks used for the light curve extraction