2017 November 21 \Accepted2018 February 1 \Publishedpublication date
galaxies: individual (NGC 613) — galaxies: ISM — galaxies: active — ISM: jets and outflows — radio lines: ISM
Usage of pasj01.cls
ALMA [C\emissiontypeI] observations toward the central region of a Seyfert galaxy NGC 613
Abstract
We report ALMA observations of [C\emissiontypeI](), \atomC13O, and C\atomO18() toward the central region of a nearby Seyfert galaxy NGC 613. The very high resolutions of (= pc) for [C\emissiontypeI] and (= pc) for \atomC13O, and C\atomO18 resolve the circum-nuclear disk (CND) and star-forming ring. The distribution of [C\emissiontypeI] in the ring resembles that of the CO emission, although [C\emissiontypeI] is prominent in the CND. This can be caused by the low intensities of the CO isotopes due to the low optical depths under the high temperature in the CND.
We found that the intensity ratios of [C\emissiontypeI] to \atomC12O(3–2) () and to \atomC13O(1–0) () are high at several positions around the edge of the ring. The spectral profiles of CO lines mostly correspond each other in the spots of the ring and high , but those of [C\emissiontypeI] at spots of high are different from CO. These results indicate that [C\emissiontypeI] at the high traces different gas from that traced by the CO lines . The [C\emissiontypeI] kinematics along the minor axis of NGC 613 could be interpreted as a bubbly molecular outflow. The outflow rate of molecular gas is higher than star formation rate in the CND. The flow could be mainly boosted by the AGN through its radio jets.
1 Introduction
Molecular hydrogen (H2) is a major component of the interstellar medium in galaxies. While 12CO(1–0) line has been used as a principal probe to trace molecular gas and to study dynamics and molecular gas distribution in galaxies, \atomC12O is not easy to estimate the gas mass due to the large optical depth. Recently, atomic carbon (C\emissiontypeI) attracts attention as a good tracer of mass of the cold molecular gas especially in high redshift galaxies or metal-poor objects (e.g., [Papadopoulos & Greve (2004)], [Papadopoulos et al. (2004)]).
It has been recognized that C\emissiontypeI exists predominantly in the thin layer near the surface of molecular clouds exposed to UV radiation, which is called a photodissociation region (PDR) ([Tielens & Hollenbach (1985)], [Hollenbach et al. (1991)]). However, large-scale C\emissiontypeI(), hereafter simply referred as [C\emissiontypeI], mapping of the Orion A and B molecular clouds revealed that [C\emissiontypeI] coexists with \atomC12O and \atomC13O(1–0) and their intensities correlate each other (Ikeda et al., 2002). Since the critical density of [C\emissiontypeI] is similar to that of \atomC12O ( cm-3), these findings indicate that the emission lines arise from the same volume and share similar excitation temperature.
The global extent of the [C\emissiontypeI] emission is similar to that of dense molecular gas traced by C18O, whereas the intensities of [C\emissiontypeI] and C18O anti-correlates to each other (e.g., Maezawa et al. (1999)). Oka et al. (2005) showed distribution of the C\emissiontypeI-to-\atomC12O intensity ratio on the Galactic scale and suggested that the locations of the high intensity ratio correspond to the upstream of spiral arms. These results indicate that [C\emissiontypeI] abundance is high in the early stage of chemical evolution (within a timescale for conversion from C\emissiontypeI to CO; yr) and [C\emissiontypeI] traces young clouds which are just forming dense cores (Suzuki et al. (1992), Maezawa et al. (1999)).
A couple of dozen observations toward nearby galaxy centers with single-dish telescopes whose linear resolution of several 100 pc have been found that the intensity ratio of [C\emissiontypeI] to \atomC13O in most galaxy centers exceeds unity, being rare for the Galactic molecular clouds, and is likely related with the central activities (Israel, 2005). The central outflow or shock may enhance [C\emissiontypeI] compared with CO(1–0) (Krips et al., 2016), indicating a possibility of [C\emissiontypeI] as an outflow or shock tracer. On the other hand, the distribution of [C\emissiontypeI] is still unclear due to a few mapping observations with the limited spatial resolution (e.g., Gerin & Phillips (2000)). For characterizing molecular clouds traced by C\emissiontypeI, it is necessary to clarify the distributions of C\emissiontypeI and CO lines relative to energetic activities, such as star formation and central outflow.
Molecular gas in barred galaxies can be transported toward the galactic center, because the galactic bar can effectively drain the angular momentum of the gas (Binney & Tremaine (2008), and references therein). The gas gathers at the region of nearly circular orbits (x2 orbits) and forms a nuclear ring which is the site of vigorous star formation ( a few 100 pc; we refer to a star-forming ring). Star-forming rings are promising reservoirs of the gas that feeds to the accretion disks in active galactic nuclei (AGN) via the circum-nuclear disk (CND; pc).
The nearby galaxy NGC 613 hosts a low-luminosity AGN and prominent radio jets from the center (e.g., Goulding & Alexander (2009), Hummel & Jorsater (1992)). The central CND of NGC 613 ( pc) contains abundant molecular gas, while the star formation rate (SFR) in the CND is lower than that in its star-forming ring ( pc), which is probably caused by the interaction between the jets and gas in the CND (Falcón-Barroso et al. (2014), Davies et al. (2017), Miyamoto et al. (2017)). Comparisons between [C\emissiontypeI] and CO lines in the energetic activities could provide clues to understanding what [C\emissiontypeI] traces. This letter reports [C\emissiontypeI] and CO observations with higher resolution enough to resolve the central region of the galaxy, i.e., CND and star-forming ring, for the first time as a galaxy.
2 Observations
NGC 613 was observed with the Atacama Large Millimeter/submillimeter Array (ALMA) using Bands 3 and 8 receivers. For Band 8, the Atacama compact array (ACA) and total power array (TP) were used in addition to the 12-m array. The synthesized beams at Bands 3 and 8 were () and (), corresponding to and pc, respectively, at the distance of the galaxy (17.5 Mpc; Tully (1988)). Single-point observations and three-point mosaic observations were conducted for Band 3 and Band 8, respectively. The maximum recoverable scale for Band 3 is . These setups allowed us to image the CND and star-forming ring of NGC 613. The phase reference center of , (\timeform1h34m18.19s, \timeform-29D25’06.60”) was adopted (Miyamoto et al. 2017). The correlators for Band 3 were configured to set three spectral windows in the upper sideband to measure \atomC13O(1–0) (110.201354 GHz) and C18O(1–0) (109.782176 GHz) in the 2SB dual-polarization mode. The correlators for Band 8 were configured to set one spectral window in the upper sideband to cover C\emissiontypeI() (492.160651 GHz), in the dual-polarization mode. The flux density at the Band 3 was calibrated by J2357-5311 and J0334-4008, and at Band 8 by J0006-0623 and Uranus. The time variations of amplitude and phase were calibrated by J0106-2718 and J0145-2733 for Band 3 and by J0204-1701 and J0137-2430 for Band 8.
The data were processed using the Common Astronomy Software Application (CASA; McMullin et al. (2007)). The velocity resolution of each line data obtained at different observing tracks with the 12 m array and ACA were separately rearranged to be 10 km s-1. Each line data was then combined after subtracting continuum emission determined at the channels that are free from spectral line emission. To image the continuum emission, we used the flux density at the emission-free channels. The imaging was performed using the CLEAN-algorithm in CASA. CLEAN maps were obtained considering the Briggs weighting mode on the data with robustness of 0.5 for Band 3 and the natural weighting mode for Band 8. The resultant maps were pixels with per pixel and per pixel for Band 3 and 8, respectively. For line emission of Band 8, TP data were calibrated through flagging and the system temperature correction, and imaged independently from the 12-m array and ACA data. By using the Feather algorithm in CASA, the low-resolution image obtained through the TP and high-resolution image obtained through the 12-m and ACA were converted into the gridded visibility plane and combined. Finally, the data was reconverted into a combined image. The sensitivities in the resultant cube of [C\emissiontypeI], \atomC13O, and C\atomO18() are 6 mJy beam-1 ( K), 0.2 mJy beam-1 ( K), and 0.2 mJy beam-1 ( K), respectively, in channels of 10 km s-1 width.
We found that the peak position of 100-GHz continuum corresponds to the phase center with the uncertainty of , while the peak position of 490-GHz continuum is offset from the phase center by , which is caused by large separation of between NGC 613 and the phase calibrator (J0204-1701). We, therefore, shifted the position in Band 8 data so that the continuum position coincides with the center.
3 Results and Discussion
3.1 Distributions of [C\emissiontypeI] and CO lines
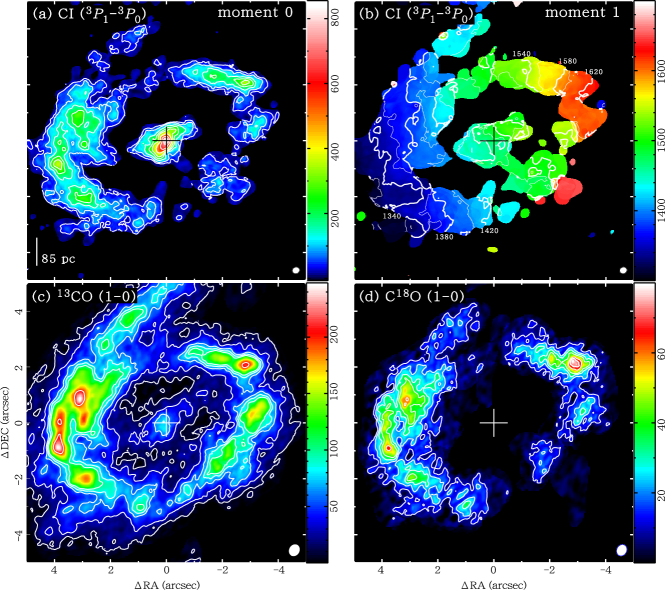
Figures 1(a), (c), and (d) show the integrated intensity maps of [C\emissiontypeI], \atomC13O( 1–0), and C\atomO18( 1–0), respectively, where pixel values in each velocity channel of the cube smoothed with twice the size of the beam-width were masked to derive the integrated intensities of the weak emission accurately and enhance the contrasts, and figure 1(b) shows the intensity-weighted [C\emissiontypeI] velocity field map. The [C\emissiontypeI] line emission is detected both in the star-forming ring and CND, while C\atomO18 is faint in the CND. The velocity field of [C\emissiontypeI] is consistent with that of \atomC12O(3–2) shown by Miyamoto et al. (2017), i.e., rigid rotation in the ring. The peak positions and distribution of the [C\emissiontypeI] emission in the ring are consistent with those of the CO emission, although being inconsistent with them in the CND. According to Ikeda et al. (2002), we calculated the optical depths of [C\emissiontypeI], \atomC13O(1–0) and C\atomO18(1–0) under LTE assumption, where those excitation temperatures are similar, and we adopted the rotational temperatures of K in the CND and K in the ring as the excitation temperatures (Miyamoto et al., 2017). The optical depths of [C\emissiontypeI] in the CND and in the ring are estimated to be and , respectively, and those of \atomC13O(1–0) and C\atomO18(1–0) are thin both in the CND and ring; (CND) and (ring), and (CND) and (ring). The relatively high optical depth of [C\emissiontypeI] in the ring can be caused by the underestimation of the excitation temperature. The corresponding distributions of [C\emissiontypeI] and \atomC13O(1–0) in the ring are consistent with the previous studies about the Galactic components (e.g., Shimajiri et al. (2013)), indicating a clumpy PDR model, in which UV radiation can penetrate deeper in a clumpy cloud (Spaans, 1996), and/or chemical evolution model (e.g., Oka et al. (2001), Ikeda et al. (2002)).

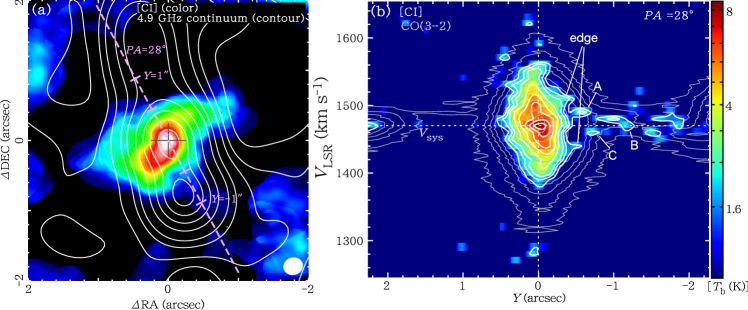
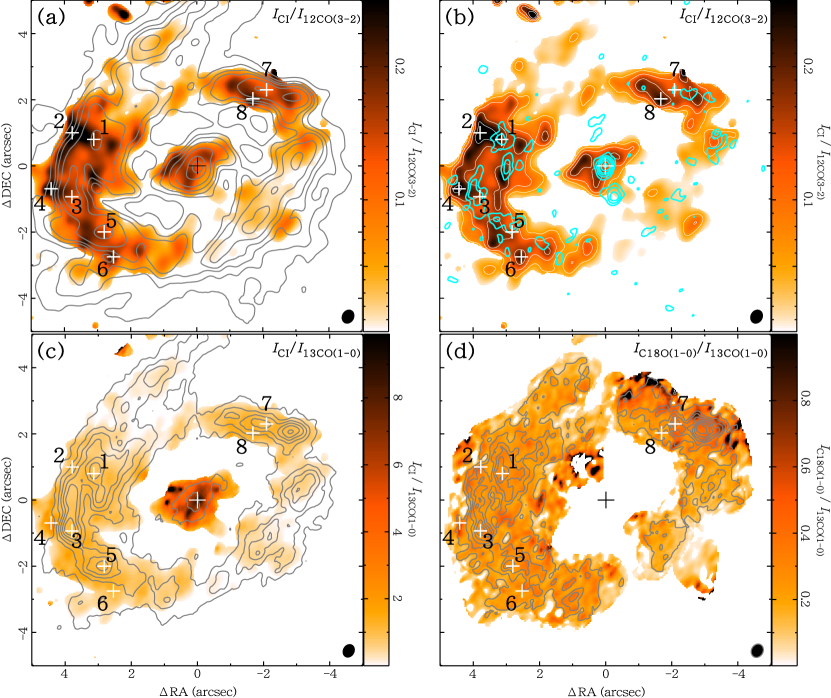
Figure 2(a) and (c) show the integrated line ratios of [C\emissiontypeI] to \atomC12O(3–2) () and to \atomC13O(1–0) (), where the \atomC12O intensity map is from Miyamoto et al. (2017) and the beam size of [C\emissiontypeI] is convolved with those of the CO. For comparison, the distribution of 100-GHz continuum, whose flux density can be dominated by free-free thermal emission from H\emissiontypeII regions followed by non-thermal emission, such as radio jets (e.g., Condon (1992), Salak et al. (2017)), superposed on the ratio map of in figure 2(b). The is in a range of 0.1–0.3 in both the CND and star-forming ring and there are several high spots at the edge of the ring. The temperature ratio of [C\emissiontypeI] to CO at the spots of the edge, , is enhanced more than double that in the ring, (see channel map in supplementary material). The high likely locates around the bright spots in 100-GHz continuum, although not being always, e.g., south-west region. The is strikingly very high in the CND due to the low intensity of \atomC13O, although being high at the edge of the ring as the case in . The low intensity of \atomC13O relative to \atomC12O (and C\emissiontypeI) in the CND can be due to the low optical depth, not by the extreme abundance of \atomC13O, which is caused by selective photo-dissociation, fractionation, or nucleosynthesis (e.g., Langer et al. (1984), van Dishoeck & Black (1988), and Casoli et al. (1992)). The selective photo-dissociation and nucleosynthesis are inconsistent with the lower star formation activity in the CND than that in the ring (Falcón-Barroso et al., 2014). In addition, the lower intensity ratio of C\atomO18 to \atomC13O in the CND than that in the ring [figure 2(d)] cannot be explained by the fractionation, since the high temperature in the CND (e.g., K; Miyamoto et al. (2017)) makes the formation of \atomC13O ineffective, by contrast with C\atomO18 which does not undergo the fractionation. We found that of in the CND is consistent with the ratio of the optical depths of to . In addition, it is expected that the low optical depth and high temperature in the CND cause the ratio of the fractions of the upper state level of \atomC13O (and C\atomO18) to the level. In NGC 1068, a case that the intensities of CO isotopic species of the transition in the CND are lower than those in the ring and those of the higher transition in the CND was reported (Takano et al. (2014), Nakajima et al. (2015))
Figure 3 shows the spectra of [C\emissiontypeI], \atomC12O(3–2), \atomC13O(1–0) and C\atomO18(1–0) at representative positions on the CND and ring. Spots 1, 3, 5, and 7 are peaks on the ring traced by CO(3-2) and \atomC13O(1-0) [see figure 2(a) and (c)], whereas spots 2, 4, 6, and 8 show the high intensity ratio of at the edge of the ring. The profiles of the CO lines mostly correspond each other at all spots, but those of C\emissiontypeI at spots of high have different velocity features from those of CO. The different spectral profiles at the high suggest that C\emissiontypeI traces different gas from that traced by the CO lines. In the high at the edge of the ring, [C\emissiontypeI] would trace dark CO, e.g., an early stage of chemical evolution (Tanaka et al., 2011), although other models including the PDR model cannot be excluded. In order to clarify the reason of the different spectral profiles, multi-wavelength observations with high angular resolution enough to resolve individual molecular clouds ( pc) are needed, since PDR models are developed to represent the structure of an individual cloud.
3.2 [C\emissiontypeI] outflow in circum nuclear disk (CND)
Figure 4(b) shows the position-velocity (PV) diagram of [C\emissiontypeI] along the minor axis with of NGC 613 [figure 4(a)], superposed on the PV diagram of CO(3–2). The gas motion in NGC 613 is counterclockwise and the southern part of NGC 613 is on the near side (figure 1(b), Burbidge et al. (1964)). In the southern region (), we found some compact components (A, B, and C) whose size of pc) and velocity width of , being consistent with those of GMC (e.g., Sanders et al. (1985)). Especially, the location of component B at is close to the peak of the southern bubble traced by 4.9 GHz continuum, whose flux density is dominated by synchrotron emission due to the nuclear jets (Hummel & Jorsater, 1992). The [C\emissiontypeI] intensities of 31.4, 41.7, and 14.7 of components A, B, and C correspond to the column densities of , , and , respectively, according to Ikeda et al. (2002) and in the CND. The ratio of to in the ring becomes , where we adopted by assuming K and (cf. Ikeda et al. (2002)). We roughly estimated molecular gas masses of components A, B, and C to be 7.7, 10.2, and \MO, respectively, with manners similar to Israel & Baas (2001), but adopting typical value of [C]/[H] (e.g., Israel & Baas (2001), Israel & Baas (2003)).
The molecular clouds may expand spherically because of the symmetric velocity patterns of the components and edge relative to in figure 4(b). We assumed that the velocity difference of the edge to is the same as the expanding velocities of all components, , where is an angle between a normal line to the bubble and the line of sight. The offset between the averaged velocity of the edge and could be caused by an inclination of the outflow to the line-of-sight, although the velocity resolution of km s-1 is not enough to discuss further. For the hight of the component B of and the expanding velocity of as a lower limit, the expanding time is , and the mass outflow rate of only component C becomes \MO , which is higher than SFR in the CND, (Falcón-Barroso et al., 2014). It is noted that the mass outflow rate in nearby starburst galaxies is comparable to SFR, e.g., M82 (Salak et al., 2013), NGC 253 (Bolatto et al., 2013), NGC 1808 (Salak et al., 2016). The AGN bolometric luminosity of NGC 613 is a few , accounting for of total luminosity including contribution of shock excitation and star formation (Davies et al., 2017). In addition, the Eddington luminosity is by adopting the expected BH mass of (Beifiori et al., 2012). The kinetic energy and luminosity of the outflowing component become and , respectively. The jet power of , which can be estimated by adopting the central 1.4 GHz luminosity of (Hummel et al., 1985) to a scaling relation suggested by Cavagnolo et al. (2010), is larger than the kinetic luminosity. The ratio of is consistent with a value expected from a numerical simulation, in whose range the jet can drive the interstellar medium efficiently (Wagner et al., 2012). These results indicate that the jet contributes driving the gas outflow, although the [C\emissiontypeI] outflow is tentative. In order to confirm the outflow, more sensitive [C\emissiontypeI] observations are needed.
This paper makes use of the following ALMA data: ADS/JAO. ALMA#2015.1.01487.S. ALMA is a partnership of ESO (representing its member states), NSF (USA) and NINS (Japan), together with NRC (Canada) and NSC and ASIAA (Taiwan) and KASI (Republic of Korea), in cooperation with the Republic of Chile. The Joint ALMA Observatory is operated by ESO, AUI/NRAO and NAOJ. This work was financially supported by Grants-in-Aid for Scientific Research (KAKENHI) of the Japanese society for the Promotion of Science (JSPS, Grant No. 16H03961).
References
- (1)
- Beifiori et al. (2012) Beifiori, A., Courteau, S., Corsini, E. M., & Zhu, Y. 2012, MNRAS, 419, 2497
- Binney & Tremaine (2008) Binney, J., & Tremaine, S. 2008, Galactic Dynamics: Second Edition, by James Binney and Scott Tremaine. ISBN 978-0-691-13026-2 (HB). Published by Princeton University Press, Princeton, NJ USA, 2008.,
- Bolatto et al. (2013) Bolatto, A. D., Warren, S. R., Leroy, A. K., et al. 2013, Nature, 499, 450
- Burbidge et al. (1964) Burbidge, E. M., Burbidge, G. R., Rubin, V. C., & Prendergast, K. H. 1964, ApJ, 140, 85
- Casoli et al. (1992) Casoli, F., Dupraz, C., & Combes, F. 1992, A&A, 264, 55
- Cavagnolo et al. (2010) Cavagnolo, K. W., McNamara, B. R., Nulsen, P. E. J., et al. 2010, ApJ, 720, 1066
- Condon (1992) Condon, J. J. 1992, ARA&A, 30, 575
- Davies et al. (2017) Davies, R. L., Groves, B., Kewley, L. J., et al. 2017, MNRAS, 470, 4974
- Falcón-Barroso et al. (2014) Falcón-Barroso, J., Ramos Almeida, C., Böker, T., et al. 2014, MNRAS, 438, 329
- Gerin & Phillips (2000) Gerin, M., & Phillips, T. G. 2000, ApJ, 537, 644
- Goulding & Alexander (2009) Goulding, A. D., & Alexander, D. M. 2009, MNRAS, 398, 1165
- Hollenbach et al. (1991) Hollenbach, D. J., Takahashi, T., & Tielens, A. G. G. M. 1991, ApJ, 377, 192
- Hummel et al. (1985) Hummel, E., Pedlar, A., Davies, R. D., & van der Hulst, J. M. 1985, A&AS, 60, 293
- Hummel & Jorsater (1992) Hummel, E., & Jorsater, S. 1992, A&A, 261, 85
- Ikeda et al. (2002) Ikeda, M., Oka, T., Tatematsu, K., Sekimoto, Y., & Yamamoto, S. 2002, ApJS, 139, 467
- Israel & Baas (2001) Israel, F. P., & Baas, F. 2001, A&A, 371, 433
- Israel & Baas (2003) Israel, F. P., & Baas, F. 2003, A&A, 404, 495
- Israel (2005) Israel, F. P. 2005, Ap&SS, 295, 171
- Krips et al. (2016) Krips, M., Martín, S., Sakamoto, K., et al. 2016, A&A, 592, L3
- Langer et al. (1984) Langer, W. D., Graedel, T. E., Frerking, M. A., & Armentrout, P. B. 1984, ApJ, 277, 581
- Maezawa et al. (1999) Maezawa, H., Ikeda, M., Ito, T., et al. 1999, ApJ, 524, L129
- McMullin et al. (2007) McMullin, J. P., Waters, B., Schiebel, D., Young, W., & Golap, K. 2007, Astronomical Data Analysis Software and Systems XVI, 376, 127
- Miyamoto et al. (2017) Miyamoto, Y., Nakai, N., Seta, M., et al. 2017, PASJ, 69, 83
- Nakajima et al. (2015) Nakajima, T., Takano, S., Kohno, K., et al. 2015, PASJ, 67, 8
- Oka et al. (2001) Oka, T., Yamamoto, S., Iwata, M., et al. 2001, ApJ, 558, 176
- Papadopoulos & Greve (2004) Papadopoulos, P. P., & Greve, T. R. 2004, ApJ, 615, L29
- Papadopoulos et al. (2004) Papadopoulos, P. P., Thi, W.-F., & Viti, S. 2004, MNRAS, 351, 147
- Salak et al. (2013) Salak, D., Nakai, N., Miyamoto, Y., Yamauchi, A., & Tsuru, T. G. 2013, PASJ, 65, 66
- Salak et al. (2016) Salak, D., Nakai, N., Hatakeyama, T., & Miyamoto, Y. 2016, ApJ, 823, 68
- Salak et al. (2017) Salak, D., Tomiyasu, Y., Nakai, N., et al. 2017, ApJ, 849, 90
- Sanders et al. (1985) Sanders, D. B., Scoville, N. Z., & Solomon, P. M. 1985, ApJ, 289, 373
- Shimajiri et al. (2013) Shimajiri, Y., Sakai, T., Tsukagoshi, T., et al. 2013, ApJ, 774, L20
- Spaans (1996) Spaans, M. 1996, A&A, 307, 271
- Suzuki et al. (1992) Suzuki, H., Yamamoto, S., Ohishi, M., et al. 1992, ApJ, 392, 551
- Takano et al. (2014) Takano, S., Nakajima, T., Kohno, K., et al. 2014, PASJ, 66, 75
- Tanaka et al. (2011) Tanaka, K., Oka, T., Matsumura, S., Nagai, M., & Kamegai, K. 2011, ApJ, 743, L39
- Tielens & Hollenbach (1985) Tielens, A. G. G. M., & Hollenbach, D. 1985, ApJ, 291, 747
- Tully (1988) Tully, R. B. 1988, Cambridge and New York, Cambridge University Press, 1988, 221 p.,
- van Dishoeck & Black (1988) van Dishoeck, E. F., & Black, J. H. 1988, ApJ, 334, 771
- Wagner et al. (2012) Wagner, A. Y., Bicknell, G. V., & Umemura, M. 2012, ApJ, 757, 136