Fast and Slow Precession of Gaseous Debris Disks Around Planet-Accreting White Dwarfs
Abstract
Spectroscopic observations of some metal-rich white dwarfs (WDs), believed to be polluted by planetary material, reveal the presence of compact gaseous metallic disks orbiting them. The observed variability of asymmetric, double-peaked emission line profiles in about half of such systems could be interpreted as the signature of precession of an eccentric gaseous debris disk. The variability timescales — from decades down to yr (recently inferred for the debris disk around HE 1349–2305) — are in rough agreement with the rate of general relativistic (GR) precession in the test particle limit. However, it has not been demonstrated that this mechanism can drive such a fast, coherent precession of a radially extended (out to ) gaseous disk mediated by internal stresses (pressure). Here we use the linear theory of eccentricity evolution in hydrodynamic disks to determine several key properties of eccentric modes in gaseous debris disks around WDs. We find a critical dependence of both the precession period and radial eccentricity distribution of the modes on the inner disk radius, . For small inner radii, , the modes are GR-driven, with periods of yr. For , the modes are pressure-dominated, with periods of yr. Correspondence between the variability periods and inferred inner radii of the observed disks is in general agreement with this trend. In particular, the short period of HE 1349–2305 is consistent with its small . Circum-WD debris disks may thus serve as natural laboratories for studying the evolution of eccentric gaseous disks.
Subject headings:
accretion, accretion disks — hydrodynamics — white dwarfs — relativistic processes1. Introduction
Tens of percent of white dwarfs (WDs) show signs of metal pollution (Farihi, 2016), which is generally believed to be caused by the accretion of high-Z material originating from circum-WD planetary systems (Debes & Sigurdsson, 2002; Jura, 2003). A number of such WDs exhibit infrared (IR) excesses (Jura, 2003; Jura et al., 2007; Farihi, 2016), revealing the presence of compact (), warm ( K) and dense disks orbiting these stellar remnants. Moreover, eight metal-rich WDs with IR excesses also show double-peaked metal emission lines, indicative of high metallicity compact gaseous disks in Keplerian rotation around them (Gänsicke et al., 2006, 2007, 2008; Gänsicke, 2011; Melis et al., 2012; Farihi et al., 2012). Three of these systems exhibit roughly periodic time variability111Wilson et al. (2014) reported variation of the strength of the lines in SDSS J1617+1620, culminating in their disappearance. of the emission line profiles of the Ca ii triplet, with periods of one to several decades (Wilson et al., 2015; Manser et al., 2016a, b). Additionally, the gas disk around WD 1145+017 (Xu et al., 2016), which is also orbited by transiting, disintegrating planetesimals (Vanderburg et al., 2015), shows periodic variability of absorption lines (due to Ni ii, Mg i, and Fe ii) with a period of years (Redfield et al., 2017; Cauley et al., 2018); properties of circum-WD disks showing quasi-periodic variability are summarized in Table 1.
Manser et al. (2016b) suggested that emission line variability is the signature of an eccentric, precessing gas disk, and that the variability periods are broadly consistent with the general relativistic (GR) precession of a test particle with a semi-major axis comparable to the stellocentric radii from which gas emission is detected. However, real gaseous disks are fluid entities, meaning that understanding their precession requires a full hydrodynamic treatment.
Recently, Dennihy et al. (2018) reported rapid variability of the Ca ii triplet emission from HE 1349–2305 with a period of years, an order of magnitude shorter than in other WD debris disks. This variability has been reported to be inconsistent with GR precession, due to the large disparity (factor of ) between the GR precession rate at the inner and outer disk edges ( and ).
In this paper, we use the linear theory for the evolution of eccentric disks (Ogilvie, 2001; Teyssandier & Ogilvie, 2016) to model the hydrodynamic behavior of eccentric gaseous debris disks orbiting WDs. In general, an eccentric disk can be described by a series of global modes, each with a corresponding radial eccentricity profile and coherent precession frequency, which we compute in this work. We demonstrate that the location of the inner edge of the disk plays a critical role in setting the global disk precession period and can explain the range of observed variability periods. We also show that the rapid variability of HE 1349–2305 is consistent with its small inner radius.
2. Eccentric Disk Dynamics
Thin fluid disks can in general be eccentric, and may precess due to external forces or internal stresses (e.g. Ogilvie, 2001; Statler, 2001). Our goal is to understand the precession periods of eccentric WD debris disks, to determine whether or not they can be identified with the observed periods of variability. We therefore do not attempt to address the process by which these disks become eccentric, or how the eccentricity is maintained over long (relative to the precession period) timescales (if it is in fact maintained over such timescales). Rather, we simply assume that the disk has somehow acquired a significant eccentricity (see section 4 for a more detailed discussion), and seek to understand its subsequent behavior.
The structure of an eccentric disk is described by the eccentricity and argument of pericenter , which are combined in the complex disk eccentricity
| (1) |
Ogilvie (2001) developed a disk eccentricity evolution theory, which has been applied to a variety of astrophysical systems, including accreting black holes (Ferreira & Ogilvie, 2009), Be stars (Ogilvie, 2008), and protoplanetary disks with embedded giant planets (Teyssandier & Ogilvie, 2016). In the framework of this theory, the linear () equation describing the evolution of for a non-self-gravitating, locally isothermal disk is (Teyssandier & Ogilvie, 2016)
| (2) | ||||
where is the disk surface density, is the sound speed, and is the Keplerian orbital frequency. Equation (2) includes the terms (most importantly ) describing the 3D effect related to the variation of the vertical gravitational force exerted on a fluid element as it moves along an eccentric orbit (Ogilvie, 2008), which has a significant impact on our results (see section 4). We have also added the last term multiplying on the right-hand side of equation (2) to describe GR precession with the frequency (in the limit )
| (3) | ||||
where is the speed of light.
In equation (2) we neglect terms associated with viscosity, (Ogilvie, 2001), where is the dimensionless effective viscosity (Shakura & Sunyaev, 1973). This is justified since (1) we do not consider excitation/damping of the disk eccentricity and (2) the characteristic viscous time
| (4) |
(for and the mean molecular weight of the gas ) is significantly longer than the observed variability periods (or theoretical eccentricity evolution timescale).
The terms inside the brackets multiplying in equation (2) represent different sources of differential precession. All of them except the last one characterize effects related to the disk pressure, which together typically result in prograde precession.222Pressure leads to prograde precession because of the significant role of the term related to the 3D effect described by Ogilvie (2008). If this effect is neglected, then pressure typically leads to retrograde precession (Goodchild & Ogilvie, 2006). The last term describes GR-driven precession, which is always prograde. As the two types of terms scale differently with , there is a critical radius, , at which they become comparable in magnitude, which delineates the region in which GR is dominant (), from the region in which pressure is dominant (). Assuming the disk surface density and sound speed are described by
| (5) |
and
| (6) |
where and are the gas temperature and surface density333Note that drops out of equation (2). at ( and are the constant power law indices), the critical radius is given by
| (7) |
where . For a globally isothermal disk (),
| (8) | ||||
The gaseous component of a typical WD debris disk can conceivably lie entirely within the pressure-dominated region, entirely within the GR-dominated region, or span both regions, depending on its radial extent. The dominant physical mechanism responsible for the precession of such a disk is then determined by the details of its structure.
2.1. Normal Modes
We look for the normal mode solutions of equation (2) of the form
| (9) |
so that the entire disk precesses coherently with an angular frequency . Equation (2) then becomes an ordinary differential equation for :
| (10) | ||||
We solve the eigenvalue equation (10), supplied with a choice of boundary conditions (BCs), using the shooting method. The solutions constitute a spectrum of eigenvalues and associated eigenfunctions , each with a different number of nodes — radial locations at which and experiences a shift. Note that , which refers to linear mode solution, is distinct from the physical disk eccentricity , which differs by an amplitude factor (see section 3.1).
For the inner and outer BCs, we choose
| (11) |
The choice of the inner BC is motivated by the observed emission line profiles. A disk with a circular inner edge should produce double-peaked lines, equidistant from the rest frame velocity and with equal height. The observed line profiles show a distinct difference between the maximum redshifted and blueshifted velocities of the line peaks (as well as different heights), indicating that the inner edge of the disk has a significant eccentricity. The zero-gradient BC applied to at allows the inner disk edge to be eccentric (as opposed to, e.g., setting at ). Also, we found the outer BC to be relatively unimportant in determining the mode properties, so we simply apply the same BC at .
For several reasons, we focus only on the lowest-order mode, whose eigenfunction has no nodes. First, modeling of the disk eccentricity distribution for WD 1145+017 by Cauley et al. (2018) indicates that varies on a length scale comparable to the disk radius, which is indicative of a low-order mode. Second, for higher-order modes, the disk gets divided into multiple (but smoothly connected) eccentric, anti-aligned sub-disks. As a result, the systematic difference in orbital velocities from one side of the disk to the other (for some range of ) is reduced, suppressing the asymmetry of the double-peaked emission lines. Third, the lowest-order mode typically has the longest precession period, in a way setting an upper limit on the precession period. Finally, the lowest-order mode is typically the least affected by viscous damping, when this effect is considered (Goodchild & Ogilvie, 2006).
We consider a range of values for and (motivated by the actual measurements in disk-hosting systems, see Table 1), inner disk temperature , and for the surface density and temperature power-law indices and . Under the assumption that the gas disk is fed by the sublimation of a particulate debris disk (Rafikov, 2011a, b) at the sublimation radius (Rafikov & Garmilla, 2012), one can show that the profile with should naturally develop in a globally isothermal disk outside this radius (Metzger et al., 2012; Rafikov, 2016). However, we also look at profiles with , which have more mass at large radii. The thermal structure of gaseous circum-WD disks was computed in Melis et al. (2010), who showed that around hot WDs, K with may be typical. However, for completeness we also consider the possibility of colder disks and lower .
3. Results
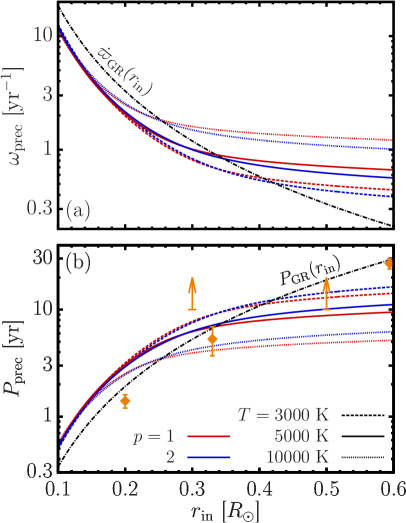
The mode precession frequency, , and precession period, , are shown in Figure 1 as a function of inner disk radius for a variety of disk models with fixed at . We focus on the case of a globally isothermal () disk, since we found the mode properties to depend only weakly on the slope of the temperature profile (at least for ). Note that is always positive, corresponding to prograde precession, and that increases with , but much more steeply for than for , where it becomes almost constant.
For , the modes are GR dominated, with periods of years. In this regime, is about twice as large as , the GR precession period of a nearly-circular test particle at . For very small (), a lower disk temperature results in a smaller [closer to ] for a given , since hotter disks transition to the pressure-dominated regime at smaller (see equation 8). Colder disks are therefore forced to precess at a rate closer to the fast , suggesting that in the limit .
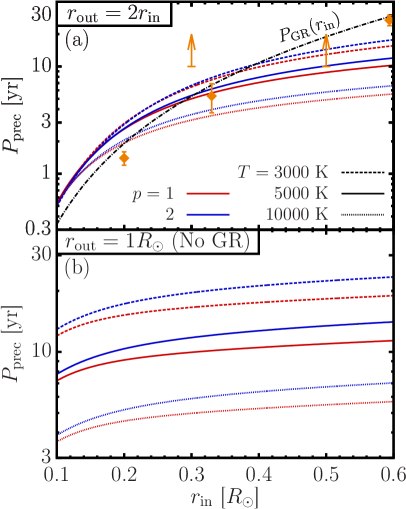
For , the modes are pressure-dominated and have periods of years [notice that in this regime]. Periods in this range arise for purely pressure-dominated disks, when the effect of GR is ignored. This is illustrated in Figure 2b, where is calculated by dropping the GR precession term in equation (10). Note a very weak dependence of the precession period on in the case of pure pressure modes.
The correspondence of with for small and with the pressure-driven precession period for large is not sensitive to the outer disk radius. Figure 2a demonstrates this by showing that the profile for narrow disks with is not very different from Figure 1b. Nor is the qualitative behavior sensitive to the disk surface density profile (see Figures 1b, 2a), in particular, whether the disk mass is concentrated at the outer edge (for ) or is evenly spread in (as for ).
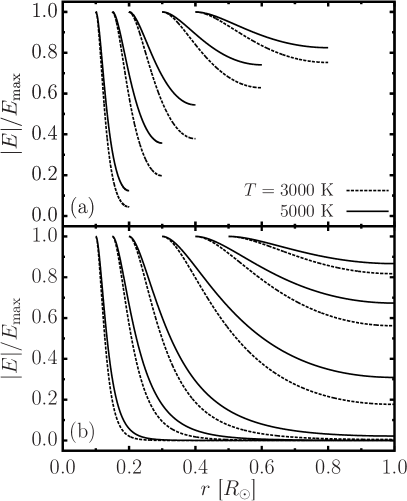
In Figure 3 we show the radial eccentricity profiles of the modes computed for disks with different inner radii (and different temperatures). For the BCs (11), the maximum eccentricity always occurs at , and decreases with . For sufficiently small (), in the GR-dominated regime, sharply decreases near the inner edge of the disk, by at least an e-fold between and . The eccentricity varies much more slowly with when precession is dominated by pressure, for . Also, the steepness of the profile decreases for hotter disks, and is only weakly dependent on the slope of the surface density profile.
3.1. Mode Amplitude
Equations (2) and (10) are linear in and, thus, cannot predict the amplitude of the mode; they yield only the radial profile of . In real disks the mode amplitude is ultimately determined by the balance of eccentricity excitation and damping, which we do not address. Nevertheless, we can still come up with an upper limit on the mode amplitude, which in some cases can be more restrictive than the obvious condition .
Indeed, to be physically realizable, the eccentricity profile must satisfy 444Formally, the eccentricity profile is a function of semi-major axis . In the linear framework for which the modes are computed, and are interchangeable. For non-small eccentricity, should be thought of as being representative of .
| (12) |
otherwise adjacent orbits would cross one another (Ogilvie, 2001; Statler, 2001). This requires to be less than the limiting eccentricity,
| (13) |
for all .
The physical eccentricity profile of the disk is given by the linear mode eigenfunction obtained from equation (10) scaled by an amplitude :
| (14) |
where is the maximum value of , which in our case occurs at , see Figure 3 [thus ]. The maximum mode amplitude for which orbit crossing is guaranteed to be avoided is then
| (15) |
where we minimize over the full radial extent of the disk and use and from our linear mode calculation.
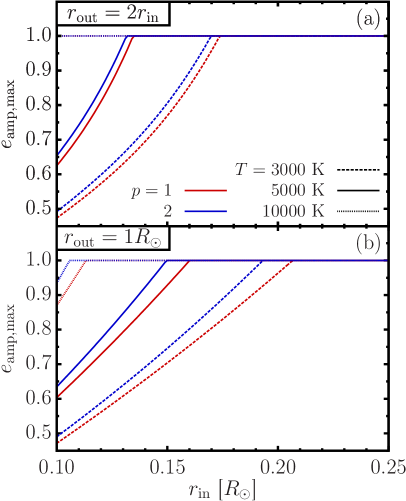
The results of such a calculation are shown in Figure 4. The limitation (12) turns out to be only weakly restrictive when the BCs (11) are used; the mode can in principle take on any amplitude (less than unity) unless , in which case equation (15) is modestly restrictive, requiring for . This amplitude is large compared to observationally inferred values of for SDSS 1228 (Gänsicke et al., 2006), and for WD 1145 (Cauley et al., 2018). If instead we were to choose as our inner BC, then the maximum mode amplitudes would be about three times smaller (note however that such a BC is disfavored by observations; see section 2.1).
4. Discussion
| Object | HE 1349–2305 | SDSS J1228+1040 | SDSS J0845+2257 (Ton 345) | SDSS J1043+0855 | WD 1145+017 |
| Type | DA | DA | DB | DA | DB |
| 18,000 | 20,700 | 19,800 | 17,900 | 15,900 | |
| , | 0.67 | 0.7 | 0.68 | 0.69 | 0.6 |
| , | 0.011 | 0.011 | 0.011 | 0.011 | 0.013 |
| , g s-1 | 1.3 | 5.6 | 160 | 2.5-12 | 430 |
| Lines showing variability111Type of spectroscopic lines used to infer variability of the disk in a given object: e - emission lines, a - absorption lines. | e | e | e | e | a |
| Gas disk | |||||
| , | 0.2 | 0.6 | 0.5 | 0.33 | |
| , | 1 | 1.2 | 1 | 0.9 | 0.52 |
| 222Strength of the WD surface magnetic field necessary to disrupt the gaseous disk accreting at the rate at a radius (Koenigl, 1991)., G | 50 | 750 | 2,880 | 150-320 | 1,340 |
| Dust disk333Dust disk radii are very uncertain; inner radii are highly degenerate with the disk inclination (Bergfors et al., 2014). | |||||
| , | 0.15 | 0.28 | 0.17 | 0.23 | |
| , | 0.7 | 1 | 0.9 | 0.49 | (?) |
| Observed precession period, yr | 5.3 | ||||
| Theoretical precession period444Precession period of the linear eccentric mode computed in this work for each system. The mode is computed using the spectroscopically inferred and of the gas, and assuming a globally isothermal () disk with a temperature K and surface density power law index . See Figures 1b and 2a for the effect of varying the disk temperature and surface density profile. Note that this precession period results from the combined effects of pressure and GR, see Figure 2b for the periods of hypothetical pressure-only modes., yr | 2.5 | 12 | 10 | 5.6 | 5.4 |
| 555Period of the GR precession of a test particle on a nearly-circular orbit, evaluated at the inner radius of the gaseous disk inferred from spectroscopic observations., yr | 1.6 | 24 | 16 | 4.3 | 5.3 |
| References666Key to references: 1Gänsicke et al. (2006), 2Gänsicke et al. (2007), 3Gänsicke et al. (2008), 4Melis et al. (2010), 5Melis et al. (2012), 6Brinkworth et al. (2012), 7Girven et al. (2012), 8Wilson et al. (2015), 9Vanderburg et al. (2015), 10Xu et al. (2016), 11Manser et al. (2016a), 12Manser et al. (2016b), 13Cauley et al. (2018), 14Dennihy et al. (2018). | 5,7,14 | 1,4,12 | 3,4,6,8 | 2,4,6,11 | 9,10,13 |
The most important result of our calculations is finding that the inner disk radius, , plays a decisive role in setting the global precession period of the disk, . If the inner edge of the disk is inside the GR-dominated region (see equation 7), with , then we find years, about twice as large as , the GR precession period of a test particle at , with shorter periods corresponding to smaller inner radii. For larger , the precession is dominated by pressure, with a period primarily determined by the temperature and surface density profile of the disk. The resulting years is only weakly dependent on . Note that periods less than a few years are only possible for , and result from GR-dominated modes.
Looking at the properties of the systems listed in Table 1 (also see Figures 1b and 2a), we see that HE 1349–2305, which has the shortest variability period ( years), indeed has the smallest inferred from the shape of its emission line profiles. Our calculations give a about twice as large for the observed value of , and require a slightly smaller () to reproduce the observed period. However, we caution that due to the simplified model (isothermal disk with sharply truncated power-law surface density profile) used in our calculations, discrepancies at this level should not be considered too seriously.
The variability periods of SDSS J1043+0855 and WD 1145+017 are consistent with their slightly larger values of (), which point towards precession periods of years, resulting from modes roughly equally affected by pressure and GR. The large values of inferred for SDSS J1228+1040 and J0845+2257 () are also consistent with their longer periods ( yr), resulting from pressure-dominated modes. See Table 1 for a more detailed comparison of the observed precession periods and our computed mode precession periods for each system.
It is important to emphasize that our calculations do require the disk to have a relatively sharp inner edge at : if the disk were to extend smoothly all the way to the WD, our calculations would predict much faster GR-dominated precession than found observationally. The existence of an inner edge requires a physical mechanism responsible for truncating the disk at . If is set by magnetospheric truncation, then the precession rate should be closely linked to the accretion rate and the WD magnetic field. Table 1 provides estimates of the surface field necessary for disrupting the gaseous debris disk (and creating a magnetospheric cavity) at the inner radius (Koenigl, 1991), provided that the WD accretes at the rate . In the case of SDSS J1043-0855, the resultant field strength ( kG) is below the current upper limit kG established in Farihi et al. (2018).
The determination of is not trivial. For an eccentric disk, the model inferring the innermost semi-major axis must involve some information about the disk eccentricity at the inner edge, which is not easy to obtain observationally.555Such detailed fitting was attempted in Cauley et al. (2018), and we adopt their estimates of the minimum disk periastron and eccentricity to infer the innermost semi-major axis, which we associate with . For example, the early, low quality spectral data for SDSS J1043+0855 indicated an extremely small size of the inner cavity of the gaseous disk, (Melis et al., 2010). However, subsequent higher quality data (Manser et al., 2016a) suggests that the emission line splitting is in fact smaller than adopted in Melis et al. (2010), and the disk is more edge-on, all resulting in larger , which we estimate to be about .
Furthermore, the existing determinations of are based on the premise that the truncation radius of the disk surface density profile corresponds to the innermost location where the observed emission lines are produced. This is not necessarily true, as the radial span of the emission region can be determined, e.g., by the excitation conditions of the line-emitting species, rather than by the distribution of . It is also not clear what role the underlying dust disk plays in setting , as ultimately it is the sublimation of the solid debris disk particles that likely feeds the gaseous, line-emitting disk (Rafikov, 2011a, b; Rafikov & Garmilla, 2012; Metzger et al., 2012).
An eccentric, precessing disk scenario is not unique in its ability to produce periodic time-variabile emission line profiles, although its ability to reproduce variability on the observed timescales is promising. Testing the eccentric disk hypothesis would require self-consistent modeling of the emission from an eccentric disk (e.g., Statler, 2001; Regály et al., 2011). It is important to emphasize that, in addition to determining the period of variability, our calculations also naturally provide the radial eccentricity profile of the disk (Figure 3). Any eccentric, rigidly precessing disk model used to reproduce the observed line profiles (Cauley et al., 2018) should agree with these mode profiles. For example, the disk eccentricity should be largest near the inner edge and decrease with radius.666This is in part a consequence of the free inner boundary condition (11) we have adopted, which allows the inner disk edge to be eccentric, in accordance with the observed emission line profiles. Further, if is small (), the eccentricity should sharply decrease near the inner edge (cf. Cauley et al. 2018), while for larger , the disk can be more uniformly eccentric. If is sufficiently small, our calculations also impose an upper limit on the disk eccentricity in order to avoid orbit crossings (see Figure 4).
It is important to note that the qualitative behavior of is significantly affected by the inclusion of the 3D contribution in the eccentricity evolution equation (2). This term arises due to the variations of the vertical gravitational force along an eccentric orbit (Ogilvie, 2008), an effect omitted in Goodchild & Ogilvie (2006). If this term is neglected, pressure-dominated modes become retrograde (), while its inclusion results in prograde modes (). If the pressure-dominated modes were retrograde, then would cross zero and change sign near (since the GR-dominated modes are prograde), leading to a very small , and therefore a very large ( yr). However, when the 3D effect is properly included, is always positive, and the very long periods associated with a zero-crossing of are excluded. We therefore find that the longest possible precession periods are years, implying that all gaseous debris disks should display signs of variability over years to decades (provided they are eccentric).
In this work we do not address the origin of the disk eccentricity, i.e., the physical mechanism behind its excitation, damping and saturation. Since WD debris disks are believed to be formed by the disruption of planetoids on nearly parabolic orbits, the disk eccentricity could be an artifact of the disruption. However, this “primordial” eccentricity would be viscously damped in several s of years, depending on the value of the viscous parameter, see equation (4). Given that more than of known gaseous debris disks show variability likely related to their non-zero eccentricity, it is unlikely that the disk eccentricity is a transient phenomenon.
This suggests that some eccentricity excitation mechanism must continually operate, so that the eccentricity is maintained by a balance between excitation and damping. One natural source of the eccentricity driving could be the interaction of the inner disk edge with the (inclined dipole) magnetic field of the WD that is responsible for the disk truncation.777We defer exploration of this possibility to future work. Other possible mechanisms could include viscous overstability (Kato, 1978; Lyubarskij et al., 1994), or nontrivial aerodynamic coupling with the underlying particulate debris disk (Rafikov, 2011b; Metzger et al., 2012).
References
- Bergfors et al. (2014) Bergfors, C., Farihi, J., Dufour, P., & Rocchetto, M. 2014, MNRAS, 444, 2147
- Brinkworth et al. (2012) Brinkworth, C. S., Gänsicke, B. T., Girven, J. M., et al. 2012, ApJ, 750, 86
- Cauley et al. (2018) Cauley, P. W., Farihi, J., Redfield, S., et al. 2018, ApJ, 852, L22
- Debes & Sigurdsson (2002) Debes, J. H., & Sigurdsson, S. 2002, ApJ, 572, 556
- Dennihy et al. (2018) Dennihy, E., Clemens, J. C., Dunlap, B. H., et al. 2018, ArXiv e-prints, arXiv:1801.05443
- Farihi (2016) Farihi, J. 2016, New Astronomy Reviews, 71, 9
- Farihi et al. (2012) Farihi, J., Gänsicke, B. T., Steele, P. R., et al. 2012, MNRAS, 421, 1635
- Farihi et al. (2018) Farihi, J., Fossati, L., Wheatley, P. J., et al. 2018, MNRAS, 474, 947
- Ferreira & Ogilvie (2009) Ferreira, B. T., & Ogilvie, G. I. 2009, MNRAS, 392, 428
- Gänsicke (2011) Gänsicke, B. T. 2011, in American Institute of Physics Conference Series, Vol. 1331, American Institute of Physics Conference Series, ed. S. Schuh, H. Drechsel, & U. Heber, 211–214
- Gänsicke et al. (2008) Gänsicke, B. T., Koester, D., Marsh, T. R., Rebassa-Mansergas, A., & Southworth, J. 2008, MNRAS, 391, L103
- Gänsicke et al. (2007) Gänsicke, B. T., Marsh, T. R., & Southworth, J. 2007, MNRAS, 380, L35
- Gänsicke et al. (2006) Gänsicke, B. T., Marsh, T. R., Southworth, J., & Rebassa-Mansergas, A. 2006, Science, 314, 1908
- Girven et al. (2012) Girven, J., Brinkworth, C. S., Farihi, J., et al. 2012, ApJ, 749, 154
- Goodchild & Ogilvie (2006) Goodchild, S., & Ogilvie, G. 2006, MNRAS, 368, 1123
- Jura (2003) Jura, M. 2003, ApJ, 584, L91
- Jura et al. (2007) Jura, M., Farihi, J., Zuckerman, B., & Becklin, E. E. 2007, AJ, 133, 1927
- Kato (1978) Kato, S. 1978, MNRAS, 185, 629
- Koenigl (1991) Koenigl, A. 1991, ApJ, 370, L39
- Lyubarskij et al. (1994) Lyubarskij, Y. E., Postnov, K. A., & Prokhorov, M. E. 1994, MNRAS, 266, 583
- Manser et al. (2016a) Manser, C. J., Gänsicke, B. T., Koester, D., Marsh, T. R., & Southworth, J. 2016a, MNRAS, 462, 1461
- Manser et al. (2016b) Manser, C. J., Gänsicke, B. T., Marsh, T. R., et al. 2016b, MNRAS, 455, 4467
- Melis et al. (2010) Melis, C., Jura, M., Albert, L., Klein, B., & Zuckerman, B. 2010, ApJ, 722, 1078
- Melis et al. (2012) Melis, C., Dufour, P., Farihi, J., et al. 2012, ApJ, 751, L4
- Metzger et al. (2012) Metzger, B. D., Rafikov, R. R., & Bochkarev, K. V. 2012, MNRAS, 423, 505
- Ogilvie (2001) Ogilvie, G. I. 2001, MNRAS, 325, 231
- Ogilvie (2008) —. 2008, MNRAS, 388, 1372
- Rafikov (2011a) Rafikov, R. R. 2011a, ApJ, 732, L3
- Rafikov (2011b) —. 2011b, MNRAS, 416, L55
- Rafikov (2016) —. 2016, ApJ, 830, 7
- Rafikov & Garmilla (2012) Rafikov, R. R., & Garmilla, J. A. 2012, ApJ, 760, 123
- Redfield et al. (2017) Redfield, S., Farihi, J., Cauley, P. W., et al. 2017, ApJ, 839, 42
- Regály et al. (2011) Regály, Z., Sándor, Z., Dullemond, C. P., & Kiss, L. L. 2011, A&A, 528, A93
- Shakura & Sunyaev (1973) Shakura, N. I., & Sunyaev, R. A. 1973, A&A, 24, 337
- Statler (2001) Statler, T. S. 2001, AJ, 122, 2257
- Teyssandier & Ogilvie (2016) Teyssandier, J., & Ogilvie, G. I. 2016, MNRAS, 458, 3221
- Vanderburg et al. (2015) Vanderburg, A., Johnson, J. A., Rappaport, S., et al. 2015, Nature, 526, 546
- Wilson et al. (2014) Wilson, D. J., Gänsicke, B. T., Koester, D., et al. 2014, MNRAS, 445, 1878
- Wilson et al. (2015) —. 2015, MNRAS, 451, 3237
- Xu et al. (2016) Xu, S., Jura, M., Dufour, P., & Zuckerman, B. 2016, ApJ, 816, L22