Understanding the magnetism in noncentrosymmetric CeIrGe3: Muon spin relaxation and neutron scattering studies
Abstract
The magnetic properties of a pressure induced noncentrosymmetric heavy-fermion superconductor CeIrGe3 have been investigated by muon spin relaxation (SR), powder neutron diffraction (ND) and inelastic neutron scattering (INS) techniques at ambient pressure. For completeness we have also measured the ac magnetic susceptibility , dc magnetic susceptibility , dc isothermal magnetization and heat capacity down to 2 K. CeIrGe3 is known to exhibit pressure induced superconductivity ( K) at a pressure of 20 GPa and antiferromagnetic ordering at 8.7 K, 4.7 K and 0.7 K at ambient pressure. Our and data show an additional anomaly near 6.2 K which is also captured in data. From , and measurements we infer three antiferromagnetic transitions above 2 K at K, K and K. Our SR study also confirms the presence of three transitions through the observation of one frequency for , two frequencies for and three frequencies for in the oscillatory asymmetry. The ND data reveal an incommensurate nature of the magnetic ordering at K with the propagation vector k = (0,0,0.688(3)), and a commensurate magnetic structure at K with the propagation vector locked to the value k = (0, 0, 2/3) and magnetic moments oriented along the axis. The commensurate structure couples a macroscopic ferromagnetic component, resulting in a strong dependence of the lock-in transition temperature on external magnetic field. The INS data show two well defined crystal electric field (CEF) excitations arising from the CEF-split Kramers doublet ground state of Ce3+. The CEF energy levels scheme and wavefunctions have been determined. The ND and INS results together suggest that the anisotropic magnetic exchange are playing an important role in the magnetism of CeIrGe3.
I INTRODUCTION
Recently, a new class of materials that lack an inversion symmetry in their crystal structure have attracted lots of attention for their exotic superconductivity on account of an antisymmetric spin-orbit coupling (ASOC) Bauer2012 . In these noncentrosymmetric superconductors (NCSs) the ASOC removes the spin degeneracy of conduction band electrons, implying that the spin and orbital parts of the Cooper pair wave function cannot be treated independently. Therefore parity is no longer a good quantum number and a parity mixing of spin-singlet and spin-triplet states occurs Edelstein ; Gorkov ; Samokhin ; Frigeri ; Fujimoto2007 ; Saxena2004 . This behavior of noncentrosymmetric superconductors is very different from that of centrosymmetric superconductors which have degenerate conduction band irrespective of the strength of spin-orbit coupling, the Cooper pair wave function of the latter thus consists of a pure spin-singlet (s-wave) or spin-triplet (p-wave) pairing.
The noncentrosymmetric heavy fermion superconductor CePt3Si crystallizing in a primitive tetragonal structure (space group ) has been found to exibit many unusual superconducting properties because of the presence of Rashba-type ASOC as a result of the lack of an inversion symmetry in its crystal structure Bauer2004 ; Bauer2005 ; Bauer2007 . Interestingly, superconductivity ( K) in this compound coexists with an antiferromagnetic (AFM) order ( K) Bauer2004 . The upper critical field T of CePt3Si is much higher than the expected Pauli paramagnetic limiting field T for spin-singlet pairing. This provides evidence for the order parameter to have a mixed spin singlet-triplet state Bauer2004 ; Fujimoto2007 .
After the report of noncentrosymmetric superconductivity in CePt3Si, a number of noncentrosymmetric materials have been reported to exhibit interesting superconducting properties Bauer2012 . Of particular interests are the compounds Ce ( transition metal and Si, Ge) having a BaNiSn3-type noncentrosymmetric tetragonal structure (space group ) which lack a mirror plane symmetry along the -axis and host a Rashba-type ASOC. Among noncentrosymmetric Ce the noncentrosymmetric heavy fermion superconductors CeRhSi3, CeIrSi3, CeCoGe3 and CeIrGe3, all of which exhibit a long-range antiferromagnetic ordering at ambient pressure, have been found to show superconductivity under applied pressure with –1.6 K Muro1998 ; Kimura2005 ; Kimura2007 ; Sugitani2006 ; Knebel2009 ; Settai2007 ; Honda2010 ; Okuda2007 ; Thamizhavel2005 ; Kawai2008 . However, their nonmagnetic analogs such as LaRhSi3, LaIrSi3, LaPdSi3 and LaPtSi3 exhibit superconductivity at ambient pressure with –2.7 K Okuda2007 ; Anand2011a ; Anand2014a ; Anand2015a ; Smidman2014 . Valence fluctuating CeCoSi3 on the other hand is reported to exhibit superconductivity at ambient pressure (sample dependent –1.4 K) Haen1985 ; Iwamoto1995 . While Ce-based NCSs exhibit exotic superconducting ground state, most of the nonmagnetic La-based NCSs behave like conventional -wave superconductors. Thus the magnetic fluctuations seem to be important for the exotic behavior of NCSs. The relationship between superconductivity and the lack of inversion symmetry as well as the role of magnetic fluctuations in noncentrosymmetric -electron systems is still puzzling.
At ambient pressure, CeRhSi3 exhibits antiferromagnetic ordering below K, superconductivity appears at pressures GPa ( K) that coexists with AFM. A large T ( T) reflects the influence of ASOC on the superconducting state Kimura2005 ; Kimura2007 . CeIrSi3 exhibits antiferromagnetic ordering below K at ambient pressure and superconductivity appears at GPa ( K) after the AFM order is suppressed Sugitani2006 ; Okuda2007 . The anisotropic T for and T for is much larger than T, indicating a mixed pairing state Sugitani2006 ; Okuda2007 . CeCoGe3 exhibits three successive AFM transitions at K, K and K at ambient pressure and become superconducting at GPa with K Kawai2008 ; Thamizhavel2005 ; Knebel2009 ; Settai2007 .
CeIrGe3 which is the subject of the present work is reported to order antiferromagnetically, showing three transitions at K, K and K Muro1998 . The pressure study on CeIrGe3 have revealed that K remains nearly constant, but K increases with pressure until it merges with at 4 GPa, superconductivity appears at pressures above 20 GPa ( K) coexisting with AFM up to 22 GPa above which AFM order is suppressed completely. At 24 GPa superconductivity is accompanied with non-Fermi liquid behavior Kawai2008 ; Honda2010 . A large T ( T) for was found as is commonly seen in other NCSs. CeRhGe3 on the other hand, also with antiferromagnetic ground state, does not show pressure induced superconductivity, the increases with increasing pressure and reaches 21.3 K at 8.0 GPa from 14.6 K at ambient pressure Muro1998 ; Kawai2008 .
In our efforts to understand the magnetism and the role of single-ion anisotropy arising from crystal field in system Anand2011b ; Anand2011c ; Anand2012a ; Adroja2012a ; Adroja2012b ; Anand2013 ; Anand2014b ; Anand2015b ; Anand2016 ; Adroja2015 recently some of us have investigated the magnetic properties of BaNiSn3-type noncentrosymmetric materials CeRhGe3 Hillier2012 , CeCoGe3 Smidman2013 and CeRuSi3 Smidman2015 using neutron scattering and muon spin relaxation (SR) techniques. Our SR study on heavy fermion CeRhGe3 revealed clear frequency oscillations indicating two AFM transitions at K and K Hillier2012 . The magnetic structure determination by powder neutron diffraction (ND) revealed a spin-density-wave-type magnetic ordering of Ce3+ moments [ordered moment of 0.45(9) ] represented by propagation vector along the -axis Hillier2012 . The observed -axis moment direction differs from the expected single-ion -plane CEF anisotropy, which is ascribed to the presence of two-ion anisotropic exhange interaction. The inelastic neutron scattering (INS) data revealed the presence of two well-defined crystal field (CEF) excitations at 7.5 meV and 18 meV. The INS data indicated a local moment magnetism in CeRhGe3 which is thought to be responsible for the absence of pressure induced superconductivity in this compound Hillier2012 .
Our SR investigations on CeCoGe3 revealed clear frequency oscillations associated with AFM orderings Smidman2013 . As stated above, CeCoGe3 exhibits three transitions at K, K and K which are further confirmed by ND data. The single crystal ND data revealed that the three AFM phases of CeCoGe3 are characterized by the propagation vectors between and , between and , and below Smidman2013 . The magnetic structure turns out to be an equal moment two-up two-down below [ordered moment of 0.405(5) ] and equal moment two-up one-down above [ordered moment of 0.360(6) ] Smidman2013 . The INS data show two well-defined CEF excitations at 19 meV and 27 meV and present evidence for - hybridization in CeCoGe3 Smidman2013 . The INS investigations on valence fluctuating CeRuSi3 have shown existence of a hybridization gap Smidman2015 .
Here we present the results of neutron scattering and SR studies on the noncentrosymmetric heavy fermion superconductor CeIrGe3. Consistent with the heat capacity and magnetic susceptibility, the SR data reveal three magnetic transitions above 2 K at K, K and K. It should be noted that previous investigations on CeIrGe3 by Muro et al. Muro1998 and Kawai et al. Kawai2008 could not capture the 6 K transition. Our powder ND data reveal an incommensurate magnetic structure with propagation vector k = (0,0,0.688) below which then locks to the commensurate propagation vector k = (0, 0, 2/3) in the ground state. The commensurate magnetic phase, taking place at , couples a macroscopic ferromagnetic component and can be induced by external magnetic filed above this temperature. This results in experimentally observed metamagnetic behaviour and implies magnetic-filed induced lock-in transition. The INS data reflect two well defined excitations of magnetic origin accounted by the crystal field model.
II Experimental details
The polycrystalline samples of CeIrGe3 and LaIrGe3 were prepared by arc melting stoichiometric amounts of high purity (%) Ce, La, Ir and Ge on a water cooled copper hearth in inert argon atmosphere. The resulting ingots were flipped and re-melted several times to ensure homogeneity. The arc melted ingots were annealed for a week at 950 ∘C to improve the phase purity. The sample quality was checked by powder x-ray diffraction which showed the sample to be single phase without any evidence of an impurity phase. The dc magnetization measurements were carried out using a Quantum Design magnetic property measurement system SQUID magnetometer, and the ac magnetization and heat capacity measurements were carried out using a Quantum Design physical properties measurement system.
The muon spin relaxation measurements were performed at the ISIS facility of Rutherford Appleton Laboratory, U.K. using the MuSR spectrometer in longitudinal geometry configuration. The powdered CeIrGe3 sample was mounted on a high purity Ag plate using GE varnish which was then covered with a thin layer of mylar film. The sample mount was cooled down to 1.2 K using He-exchange gas in an Oxford Instruments Variox cryostat. The powder neutron diffraction measurements were also performed at the ISIS facility using the time-of-flight diffractometer WISH. The powdered CeIrGe3 sample was mounted in a 6 mm vanadium can and cooled down to 1.5 K using a standard He-cryostat. The ND data were collected at three temperatures 1.5 K, 7 K and 10 K, with a long counting time of six hours at each temperature.
The inelastic neutron scattering measurements were carried out at the Institut Laue-Langevin (ILL), Grenoble, France on the time-of-flight (TOF) spectrometer IN4. The powder CeIrGe3 samples were wrapped in a thin Al-foil which was mounted inside a thin-walled cylindrical Al-can that was cooled down to 2 K using a top-loading closed-cycle-refrigerator with He-exchange gas environment. The INS data were collected at 2 K, 10 K and 100 K with neutrons of incident energy meV. In order to determine the magnetic scattering of CeIrGe3 we also measured the INS response of isostructural nonmagnetic reference compound LaIrGe3 that served as a phonon background. The low-energy INS measurements on CeIrGe3 were also carried out at ILL using the TOF spectrometer IN6. The low energy INS data were collected at 1.5 K and 10 K with neutrons of meV.
III ac and dc Magnetic Susceptibility and Magnetization
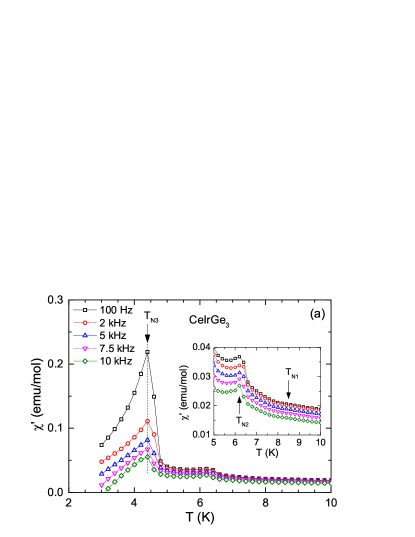
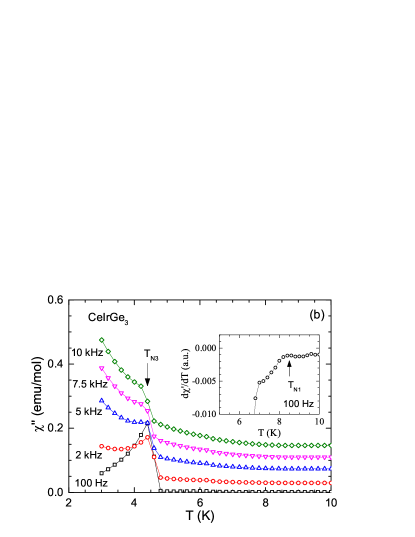
Figure 1 shows the temperature dependence of the real and imaginary parts of the ac susceptibility of CeIrGe3 for different frequencies ( kHz) measured with an ac magnetic field of 1.0 mT. Both and show a well pronounced anomaly near 4.5 K. As marked by the vertical dotted line in Fig. 1(a) the temperature position of the anomaly (peak) is frequency independent over entire range of measured frequency kHz, though the magnitude of and are dependent. The also show an almost frequency independent anomaly, though the dependence of for K is significantly modified by increasing [Fig. 1(b)]. While at low frequency (100 Hz) decreases with decreasing at K, at kHz the increases as is lowered. The magnitude of increases with increasing which is opposite to the observation for which decreases with increasing .
We also see another weak anomaly in near 6.2 K which is better seen from the expanded scale plot in the inset of Fig. 1(a), though this anomaly is not visible in . The position of the 6.2 K anomaly is also independent. Previous investigations by Muro et al. Muro1998 and Kawai et al. Kawai2008 did not report any anomaly near 6 K. As discussed below the dc susceptibility and heat capacity data also show anomaly near 6 K which reflects the intrinsic nature of this anomaly. The frequency independent behavior of the 4.5 K and 6.2 K anomalies suggests that they are not related to spin-freezing, instead they represent the long range magnetic phase transitions. Further, a weak change in slope, better visualized in derivative plot ( vs ) shown in the inset of Fig. 1(b), mark another anomaly near 8.5 K where a well pronounced anomaly is seen in the heat capacity data.
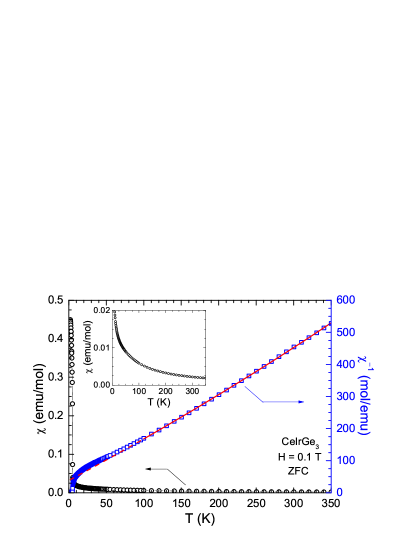
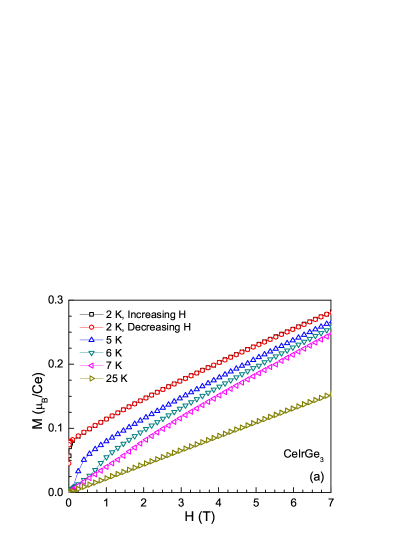
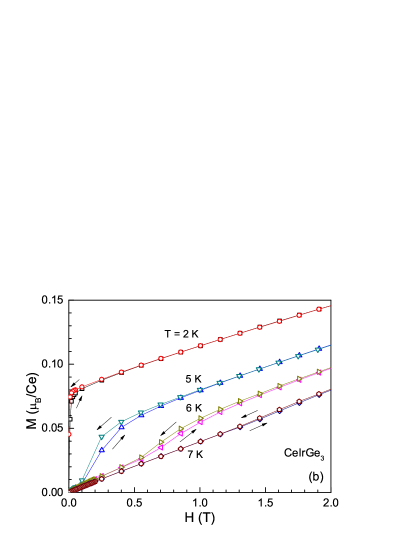
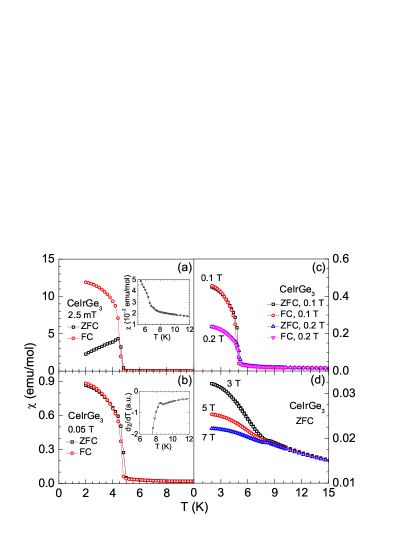
Figure 2 shows the low- zero-field-cooled (ZFC) and field-cooled (FC) dc magnetic susceptibility of CeIrGe3 for different applied magnetic field . As seen from Fig. 2(a) the measured at mT shows a very rapid increase below 4.8 K and peaks near 4.5 K. We also notice a clear splitting between the ZFC and FC data. While the 4.5 K anomaly is present even at higher fields, the splitting between the ZFC and FC data almost disappears at T [Figs. 2(b) and 2(c)]. A weak increase in temperature marking the rapid increase of , from 4.8 K at 2.5 mT [Fig. 2(a)] to 5.2 K at 0.2 T [Fig. 2(c)], is also observed. The relatively large magnitude of below 4.5 K and irreversibility between ZFC and FC suggest for the presence of significant ferromagnetic fluctuations and/or formation of antiferromagnetic domains.
The expanded scale plot of 2.5 mT data [see inset of Fig. 2(a)] shows a weak anomaly near 6.2 K, consistent with the anomaly in data discussed above. However, the anomaly near 8.5 K is too waek to be visible. As shown in the inset of Fig. 2(b), the derivative plot ( vs ) shows a clear change in the slope near 8.5 K. At T [Fig. 2(d)] one can clearly see a weak cusp near 8.5 K which shifts towads the lower temperature side with increasing field (e.g., to 8.2 K at 7 T). The 8.5 K anomaly thus is related to the occurence of an antiferromagnetic transtion. The 6.2 K anomaly is very likely related to a spin-reorientation transtion in antiferromagnetic state.
The ZFC and its inverse for the temperature range 2 K 350 K (measured in T) are shown in Fig. 3. The paramagnetic state data follow the modified Curie-Weiss behavior, . The fit of data in the temperature range 100 K 350 K is shown by the solid red line in Fig. 3, giving a independent susceptibility of emu/mol, Curie constant emu K/mol and Weiss temperature K. The effective moment estimated from is /Ce in very good agreement with the theoretically expected value of for Ce3+ ions. The negative value of reflects a dominant antiferromagnetic interaction in CeIrGe3.
Figure 4 shows the isothermal magnetization of CeIrGe3 measured at selected temperatures of 2, 5, 6, 7, and 25 K. At 2 K, the isotherm exhibits a ferromagnetic-like spontaneous magnetization at low- and then increases almost linearly with . We also see a very small magnetic hysteresis below 0.05 T in at 2 K [see Fig. 4(b)]. At 5 K, the isotherm shows a metamagnetic like feature near 0.2 T and a magnetic hysteresis below 0.8 T [Fig. 4(b)]. The isotherm at 6 K also shows the metamagnetic feature at relatively higher field but with a narrower hysteresis loop [Fig. 4(b)]. The metamagnetic feature becomes very weak at 7 K and hysteresis loop becomes extremely narrow. In view of the metamagnetic behavior at 5 K and 6 K, the ferromagnetic-like spontaneous behavior of at 2 K could be understood to be the result of an extremely small critical field of metamagnetic transtion at 2 K. The observation of hysteresis in antiferromagnetic state likely reflects the formation of antiferromagnetic domains Tanner1979 .
The isotherms do not saturate up to 7 T, the value of /Ce at 2 K and 7 T is very low compared to the theoretical value of saturation magnetization = 2.14 /Ce for Ce3+ ions (). The reduction in can be attributed to the combined effect of Kondo effect and CEF. Our data are consistent with those reported by Muro et al. Muro1998 and Kawai et al. Kawai2008 , however they did not explore the hysteresis in curves.
IV Heat Capacity
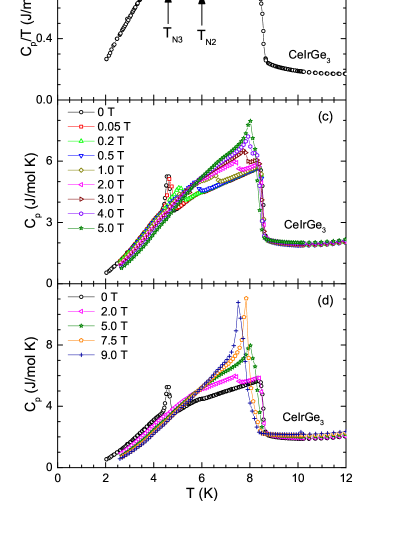
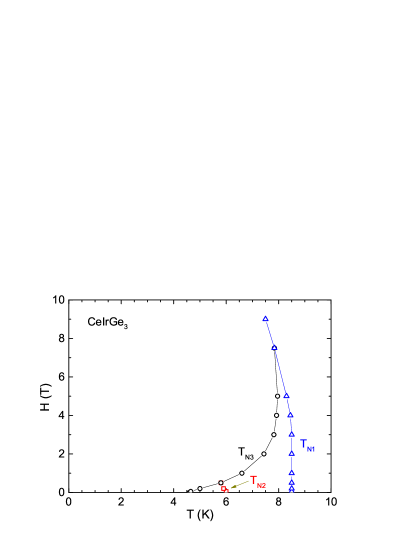
Figure 5 shows the heat capacity data of CeIrGe3 measured at different for T. The zero-field data [Fig. 5(a)] exhibit three anomalies near 4.6 K, 6.0 K and 8.5 K. While the anomalies near 4.6 K and 8.5 K are well pronounced, the 6.0 K anomaly is much weaker. This anomaly can be better visualized in versus plot shown in Fig. 5(b). We define the three transitions temperatures K, K and K. Because of the influence of magnetic interaction in the ordered state and crystal field above , it is difficult to estimate the Sommerfeld coefficient precisely. Nevertheless, we estimate mJ/mole K2 by fitting the versus plot over K (fit not shown) according to . The fit also gave mJ/mole K4 which in turn gives Debye temperature K. For LaIrGe3 is found to be 5.9(1) mJ/mole K2 and K.
We notice that the jump in heat capacity at is much lower than the expected mean field jump of 12.48 J/mol K for purely magnetic two-level system (effective ) which could be attributed to the presence of Kondo effect. We estimate the Kondo temperature following Besnus et al. Besnus who suggested a universal behavior for jump in magnetic heat capacity versus plot for Ce-based Kondo lattice systems. For CeIrGe3, we find J/mol K at K which corresponds to in that universal plot. This yields K. Another estimate of follows from the Weiss temperature, Gruner , which for K gives K which is little lower than above estimate of K.
The data measured at different shown in Figs. 5(c) and 5(d) present an interesting behavior. The temperature of the anomaly at increases with increasing field until it merges with at around 7.5 T. The anomaly at shifts downwards and is not detectable for fields above 0.5 T. On the other hand the anomaly at is almost insensitive to fields for T, above this a weak decrease is observed in on increasing . The – phase diagram obtained from data is shown in Fig. 6. The – phase diagram clearly shows the dependence of , and and depicts a complex magnetic behavior of CeIrGe3.
Furthermore, we see that the peak height of anomaly at initially decreases up to 1 T, then increases at T. The peak height of anomaly at initially increases very slowly up to 4 T above which a rapid increase is observed, particularly at T and 9 T. We thus see that the jump in heat capacity increases very rapidly at T. An increase in would suugest that the Kondo interaction and hence - hybridization weakens with increasing field and the system moves towards a more localized state. A change in the nature of phase transition from second order to first order can also lead to an increase in the heat capacity jump in high field limit.
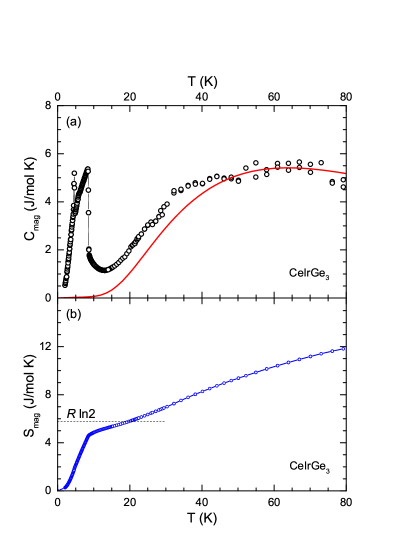
The magnetic contribution to heat capacity is shown in Fig. 7(a). The was estimated by subtracting off the lattice contribution using the heat capacity data of isostructural LaIrGe3. We see a broad Schottky-type anomaly (centered around 60 K) in which can be attributed to crystal field. A comparison of data with the CEF contribution to heat capacity estimated according to the CEF level scheme obtained from the analysis of inelastic neutron scattering data in Sec. VII is presented in Fig. 7(a) (solid red curve). A very reasonable agreement is observed between the and in reproducing the Schottky-type feature. The magnetic contribution to entropy obtained by integrating the versus plot is shown in Fig. 7(b). The shows that attains a value of of at . The magnetic entropy of is achieved by 20 K.
The reduced magnetic entropy at again indicates sizable Kondo effect in this compound. The magnetic entropy of magnetically ordered Kondo lattice system in a simple two-level model with an splitting energy of is given by Yashima
| (1) |
For of of at this suggests K, in good agreement with above estimate of K from .
V Muon Spin relaxation
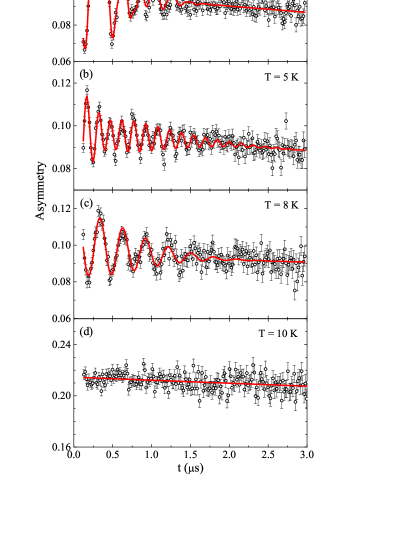
The representative zero-field SR spectra are shown in Fig. 8 for , 8 and 10 K. At (10 K) the SR spectra are slow depolarizing, described by a simple exponential decay arising from spin fluctuations. However, clear oscillations are observed in the SR spectra at , accompanied with a loss in initial asymmetry (see Fig. 8). This is a classic signature of long range magnetic ordering. The ordered state SR spectra are well described by a combination of oscillatory functions convoluted with a Gaussian envelope, and depending on the temperature ranges data could be fitted with either one, two or three oscillating functions. The fitting function that we used to fit the ordered state SR spectra is
| (2) |
Here and are the initial asymmetries of oscillatory and exponential components, are the muon depolarisation rates (arising from a distribution of internal fields) forming a Gaussian envelope to the oscillating component with a frequency of and a phase , is the muon depolarization rate and is the background. The value of was estimated by fitting spectra at 10 K and was kept fix for fitting other temperature points. The frequency , where MHz/T is the muon gyromagnetic ratio and is the internal field at the muon site.
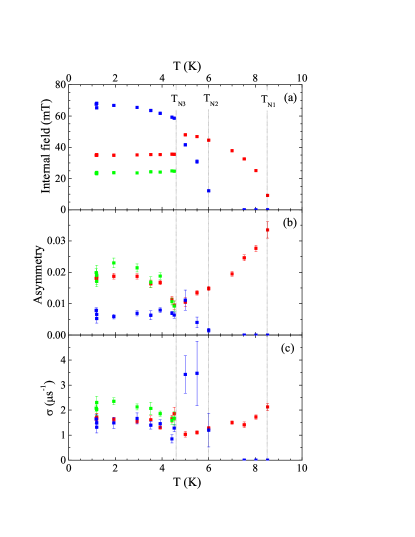
In order to fit the SR data three oscillating functions are required for K, two oscillating functions are required for K and only one is required for K. The fit of the representative spectra are shown by solid lines Fig. 8. The temperature dependences of the fitting parameters are shown in Fig. 9. It is evident from Fig. 9(a) that muons sense three different internal fields corresponding to three different frequencies. Each change in the number of frequencies corresponds to an anomaly in the heat capacity presented in previous section. The dependent initial asymmetries of the oscillatory component show that CeIrGe3 is fully ordered below TN1 [see Fig. 9(b)]. The damping of the oscillating component also shows an interesting temperature dependence [see Fig. 9(c)]. The is more or less temperature independent over a wide range of temperature with the exception of the intermediate regime where there is a rapid increase in . This implies that there is a broad distribution of internal fields.
VI Neutron Diffraction
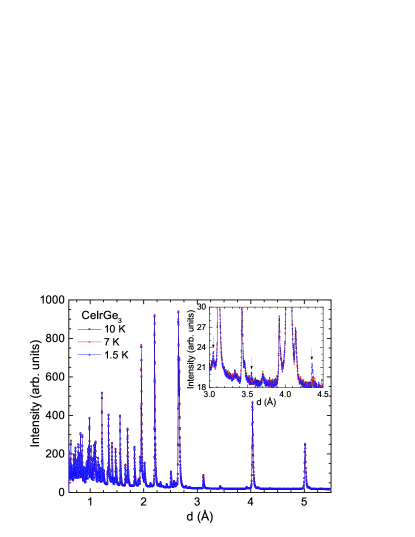
In order to get further insight into the magnetic properties of CeIrGe3 and discern the nature of the low-temperature phase transitions we performed the neutron diffraction measurements. The ND data collected at 1.5 K, 7 K and 10 K are shown in Fig. 10. The 10 K ND data were successfully refined using the BaNiSn3-type non-centrosymmetric tetragonal () structural model similar to the isostructural compound CeCoGe3 Smidman2013 . The expanded scale plot shown in the inset of Fig. 10 clearly shows the appearance of additional reflections at 1.5 K and 7 K. The peaks are observed only at low momentum-transfer region, revealing the magnetic origin of these reflections. The intensity of these magnetic Bragg peaks is temperature dependent. The additional weak reflections at 7 K can be accounted with an incommensurate propagation vector k = (0,0,0.688(3)). The absence of zero satellites strongly indicates that the magnetic ordering is a longitudinal spin density wave and a quantitative magnetic structure refinement confirmed this conclusion.
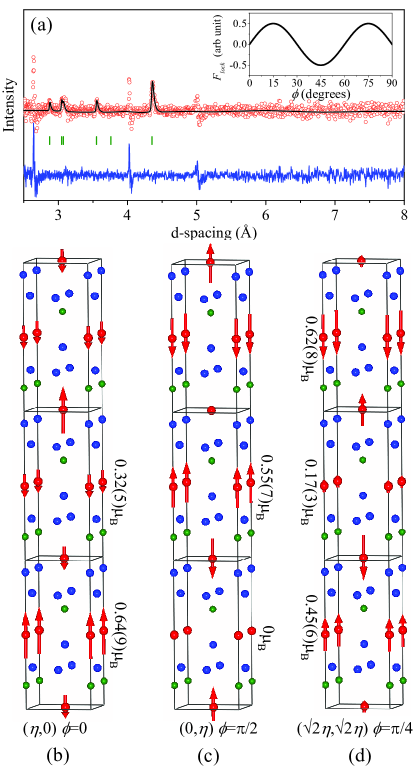
The diffraction pattern measured at K qualitatively looks very similar to the 7 K data set. However, the refinement procedure [Fig. 11(a)] yields a commensurate propagation vector k = (0,0,2/3) within the error bar of the fitting (). This key result indicates that the anomaly found in the specific heat and susceptibility data at K should be assigned to a magnetic lock-in transition. A further support of this scenario comes from symmetry arguments Stokes ; Campbell2006 . The longitudinal spin density wave associated with the (0,0,)-line of symmetry transforms as a two-dimensional time-odd irreducible representation mLD4LE4(,) of the space group. The symmetry of this magnetic order parameter impels the presence of six-power lock-in invariant in the Landau free-energy decomposition: . The invariant is allowed only at and an activation of this energy term naturally explains the transition. Another important point is that at the commensurate value of , the Landau free energy also allows a term which couples a homogeneous ferromagnetic component along the fourfold axis: ) and ). This is in excellent agreement with the magnetization data revealing the net moment below (see Figs. 2 and 4). In the temperature range of , the phase with the spontaneous magnetization can be induced by magnetic field (metamagnetic behavior), which implies a field induced lock-in transition.
The commensurate value of the propagation vector also implies that the ordered moments localized on the Ce sites depend on the global phase of the magnetic structure. It is well known, however, that the magnetic structure factors are insensitive to and therefore the magnetic structure cannot be unambiguously determined directly from the neutron diffraction data. The problem can be overcome, if we consider the lock-in term as a function of the magnetic phase. Different values of correspond to different directions of the magnetic order parameter in the (,) representation space. depends on the magnetic global phase and takes extremal values at some particular values of (inset of [Fig. 11(a)]). At these values the proximity of the magnetic structure to be locked is maximal. Note, vanishes at and and therefore the corresponding magnetic structures [shown in Fig. 11(b) and (c)] cannot be locked. The values of which maximize (minimize) the lock-in term correspond to equivalent magnetic structures, and the case of is shown in Fig. 11(d). Thus, the presented above symmetry-based approach allows to unambiguously determine the magnetic structure of CeIrGe3 and can be efficiently used for other systems. It is seen that the ordered moments are aligned along the -axis and the commensurate spin density wave magnetic structure consists of an alternation of Ce-layers with the ordered moments , and stacked along the -direction. It should be noted that the observation of the three frequencies in our SR study [see Fig. 9(a)] is consistent with the proposed commensurate magnetic structure having three types of the layers with distinct Ce moments.
VII Inelastic neutron study
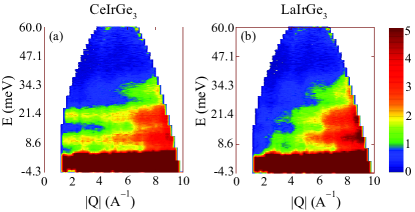
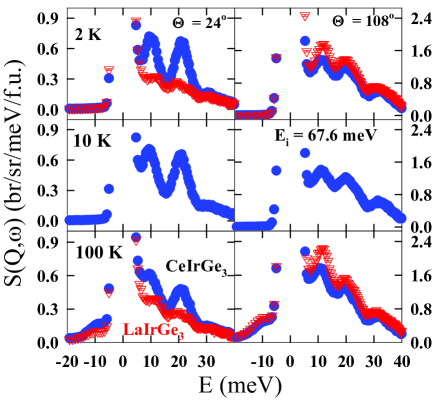
The INS scattering responses from CeIrGe3 and LaIrGe3 measured with meV at K are shown in Fig. 12 as the color coded intensity maps. A comparison of the INS scattering responses from CeIrGe3 and LaIrGe3 clearly reveals two excitations (near 9.7 and 20.9 meV) of magnetic origin for CeIrGe3. The scattering angle -integrated one-dimensional (1D) energy cuts of INS responses at 1.2, 10 and 100 K for low () and high () angles are shown in Fig. 13. The two magnetic excitations are very clear at low (left panels, Fig. 13). At high (right panels, Fig. 13) both La and Ce show similar excitations suggesting that these excitations are mainly of phononic origin.
The magnetic scattering for CeIrGe3 is shown in Fig. 14 which was obtained after subtracting the phonon background using the INS data of LaIrGe3. The where is the ratio of neutron scattering cross sections of CeIrGe3 and LaIrGe3. The two magnetic excitations near 9.7 and 20.9 meV seen in Fig. 14 are well accounted by a model based on crystal electric field. The six-fold degenerate ground state of Ce3+ splits into three doublets in tetragonal symmetry environment. The crystal field Hamiltonian for the tetragonal symmetry (point symmetry ) Ce3+ atoms are given by
| (3) |
where are CEF parameters and are the Stevens operators.
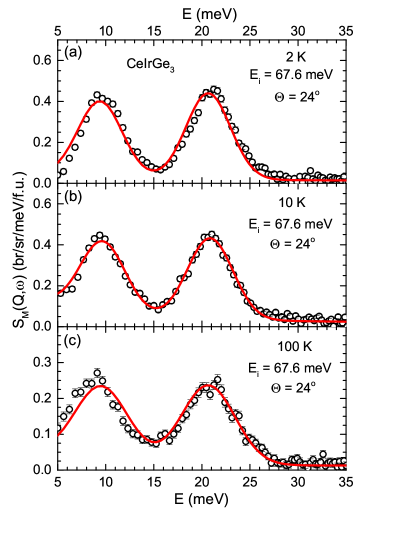
In order to obtain a unique set of CEF parameters we fitted the 2 K, 10 K and 100 K data simultaneously. The CEF parameters obtained from the analysis of INS data are listed in Table 1 and the fits of INS data are shown by solid red curves in Fig. 14. A very small difference between the fitted line and the data at 1.2 K is due to the fact that we have not included the molecular field term in our calculation. Further small difference at 100 K is attributed to the thermal expansion, which will also change the CEF potential. The first excited doublet is found to be situated at 112.7 K (9.71 meV) and the second excited doublet at 242.4 K (20.89 meV) with respect to ground state doublet. The CEF wave functions obtained are:
| (4) |
where corresponds to ground state doublet, to first excited state doublet and to second excited state doublet.
| (meV) | (meV) | (meV) | (meV) | (meV) |
| 0.323(6) | 9.71 | 20.89 |
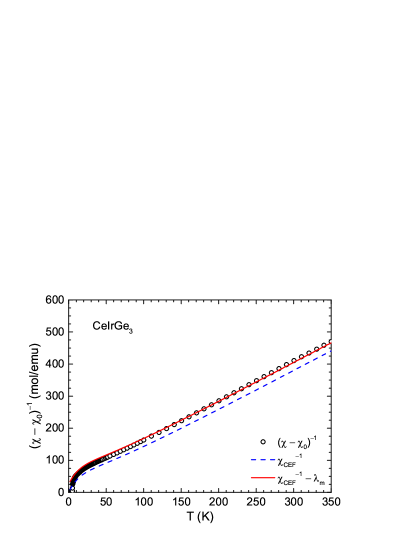
The CEF contribution to specific heat estimated according to the obtained CEF level scheme is shown by the solid red curve in Fig. 7 which shows a very reasonable agreement with the experimental data. A comparison of the CEF susceptibility with the dc susceptibility after subtracting the -independent contribution is shown in Fig. 15. Taking into account the molecular field constant , the susceptibility is given by . As shown by the solid red line, a very good agreement is observed between the data and () for mol/emu.
We estimate the ground state magnetic moment using the relation,
| (5) |
which gives the -plane moment and -direction moment . The positive suggests the moment to be in -plane which is different from the observed moment direction (along -axis) from the ND data. This indicates that the anisotropic exchange interactions are playing an important role, dominating over the single-ion CEF anisotropy, in determining the moment direction. A very similar situation has been observed for CeRhGe3 Hillier2012 , CeCuAl3 Adroja2012b , CeRu2Al10 Khalyavin2010 ; Kato2011 ; Strigari2012 ; Bhattacharyya2014 and CeOs2Al10 Kato2011 ; Strigari2013 ; Adroja2016 , where the direction of the ordered moments is different from that expected from the single-ion CEF anisotropy. In the case of CeRhGe3 the single-ion CEF anisotropy predicts the moments to lie in the -plane, however, the ND revealed the ordered moments to be directed along the -axis Hillier2012 . For CeCuAl3 the CEF predicts -axis to be the direction of moments, whereas the ND finds ordered moments oriented along the -axis Adroja2012b . On the other hand, for CeCoGe3 the CEF prediction of moments along the -axis is found to be consistent with that determined from ND study Smidman2013 . For CeAuAl3 also the CEF predicted direction of moments (-plane) is found to agree with that determined by ND Adroja2015 .
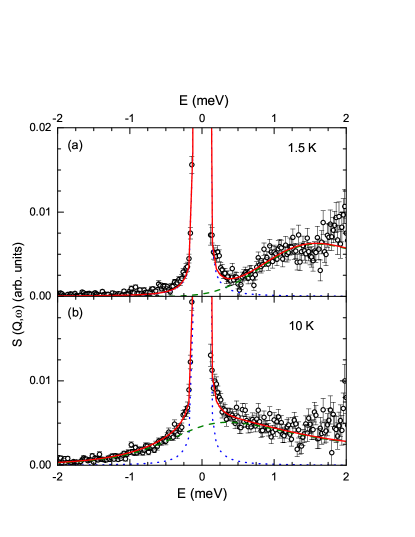
In order to have an idea about the spin-wave energy scale and estimate the Kondo temperature we also performed the low-energy INS measurements with meV which are shown in Fig. 16. The 1D cuts in Fig. 16 display the total scattering summed over all scattering angles from to . At 1.5 K, the scattering of spin-wave origin is clearly seen at energies above 0.8 meV. Further, we also see a reminiscent of a gapped spin wave behavior with a possible energy gap of meV. In the paramagnetic state, at 10 K we clearly see a significant contribution from quasielastic scattering. We have fitted the low energy INS data using a Lorentzian line-shape function for the quasielastic and inelastic components, the fits are shown in Fig. 16 along with the components. From the quasielastic linewidth at 10 K we estimate K which is in very good agreement with that estimated from the heat capacity data in Sec. IV.
VIII Conclusions
A comprehensive study of magnetic properties of pressure induced noncentrosymmetric heavy-fermion superconductor CeIrGe3 have been performed using , , , , SR, powder ND and INS measurements. In addition to the previously reported magnetic transitions at 8.7 K and 4.7 K, we found evidence for an additional magnetic phase transition near 6 K in our , and measurements. Further confirmation of three magnetic transitions above 2 K comes from our SR study. The oscillatory SR asymmetry evidences three transitions at K, K and K revealed by different number of oscillating functions (up to three frequencies) for describing the SR spectra. We found the oscillatory SR asymmetry to have one frequency for , two frequencies for and three frequencies for revealing that muons sense different internal fields in these temperature ranges of ordered state. Similar complex magnetic ground states were inferred from the SR study on the isostructural compounds CeRhGe3 Hillier2012 and CeCoGe3 Smidman2013 .
The ND data showed the appearance of weak magnetic Bragg peaks at 7 K and 1.5 K confirming the antiferromagnetic phase transitions. At 7 K the refinement of ND data reveal an incommensurate magnetic structure, well represented by propagation vector k = (0,0,0.688(3)). On the other hand, the magnetic Bragg peaks at 1.5 K are well indexed by commensurate propagation vector k = (0, 0, 2/3). The magnetic structures in both the high-temperature incommensurate and low-temperature commensurate phases are longitudinal spin density waves with strongly reduced values of the ordered moments. The latter phase couples by symmetry a macroscopic ferromagnetic component, resulting in a strong dependence of the lock-in transition temperature on external magnetic field (metamagnetic behaviour). The global magnetic phase, imposed by the lock-in free-energy invariant to be in the commensurate spin density wave, implies an alternation of Ce-layers with the ordered moments , and at , which is in full agreement with the three internal fields or frequencies observed in our SR study at low temperatures.
An estimate of K was obtained from the quasielastic linewdith. The high energy INS revealed two well defined magnetic excitations which were accounted by a model based on crystal field. We have extracted information about the CEF states of Ce3+. The CEF-spilt excited doublet states are found to be at 9.7 meV and 20.9 meV above the Kramers doublet ground state. The single-ion CEF anisotropy predicts the moment direction in the -plane, but the moment direction observed from the ND is along the -axis, indicating that anisotropic magnetic exchange interactions are important for the moment direction. Further investigations of the spin wave in CeIrGe3 that will give direct information on the anisotropic exchange interactions would be very interesting.
Acknowledgements.
We thank Dr. M. Smidman, Dr. A. Bhattacharyya and Prof. Geetha Balakrishnan for helpful discussion. DTA and VKA acknowledge financial assistance from CMPC-STFC grant number CMPC-09108.References
- (1) E. Bauer and M. Sigrist (editors): Lecture Notes in Physics Vol. 847: Non-centrosymmetric Superconductors: Introduction and Overview, (Spring-Verlag, Berlin Heidelberg, 2012).
- (2) V. M. Edel’stein, Sov. Phys. JEPT 68, 1244 (1989).
- (3) L. P. Gor’kov, E. I. Rashba, Phys. Rev. Lett. 87, 037004 (2001).
- (4) K. V. Samokhin, E. S. Zijlstra, and S. K. Bose, Phys. Rev. B 69, 094514 (2004).
- (5) P. A. Frigeri, D. F. Agterberg, A. Koga, and M. Sigrist, Phys. Rev. Lett. 92, 097001 (2004).
- (6) S. Fujimoto, J. Phys. Soc. Jpn. 76, 051008 (2007).
- (7) S. S. Saxena et al, Nature (London) 427, 799 (2004).
- (8) E. Bauer, G. Hilscher, H. Michor, C. Paul, E. W. Scheidt, A. Gribanov, Y. Seropegin, H. Noel, M. Sigrist, and P. Rogl, Phys. Rev. Lett. 92, 027003 (2004).
- (9) E. Bauer, I. Bonalde, M. Sigrist, Low Temp. Phys. 31, 748 (2005).
- (10) E. Bauer, H. Kaldarar, A. Prokofiev, E. Royanian, A. Amato, J. Sereni, W. Bramer-Escamilla, and I. Bonalde, J. Phys. Soc. Jpn. 76, 051009 (2007).
- (11) Y. Muro, D. Eom, N. Takeda, and M. Ishikawa, J. Phys. Soc. Jpn. 67, 3601 (1998).
- (12) N. Kimura, K. Ito, K. Saitoh, Y. Umeda, H. Aoki, and T. Terashima, Phys. Rev. Lett. 95, 247004 (2005).
- (13) N. Kimura, Y. Muro, and H. Aoki, J. Phys. Soc. Jpn. 76, 051010 (2007).
- (14) I. Sugitani, Y. Okuda, H. Shishido, T. Yamada, A. Thamizhavel, E. Yamamoto, T. D. Matsuda, Y. Haga, T. Takeuchi, R. Settai, and Y. Ōnuki, J. Phys. Soc. Jpn. 75, 043703 (2006).
- (15) Y. Okuda, Y. Miyauchi, Y. Ida, Y. Takeda, C. Tonohiro, Y. Oduchi, T. Yamada, N. D. Dung, T. D. Matsuda, Y. Haga, T. Takeuchi, M. Hagiwara, K. Kindo, H. Harima, K. Sugiyama, R. Settai, and Y. Ōnuki, J. Phys. Soc. Jpn. 76, 044708 (2007).
- (16) R. Settai, I. Sugitani, Y. Okuda, A. Thamizhavel, M. Nakashima, Y. Ōnuki, and H. Harima, J. Magn. Magn. Mater. 310, 844 (2007).
- (17) G. Knebel, D. Aoki, G. Lapertot, B. Salce, J. Flouquet, T. Kawai, H. Muranaka, R. Settai, and Y. Ōnuki, J. Phys. Soc. Jpn. 78, 074714 (2009).
- (18) A. Thamizhavel, T. Takeuchi, T. D. Matsuda, Y. Haga, K. Sugiyama, R. Settai, and Y. Ōnuki, J. Phys. Soc. Jpn. 74, 1858 (2005).
- (19) T. Kawai, H. Muranaka, M.-A. Measson, T. Shimoda, Y. Doi, T. Matsuda, Y. Haga, G. Knebel, G. Lapertot, D. Aoki, J. Flouquet, T. Takeuchi, R. Settai, and Y. Ōnuki: J. Phys. Soc. Jpn. 77, 064716 (2008).
- (20) F. Honda, I. Bonalde, K. Shimizu, S. Yoshiuchi, Y. Hirose, T. Nakamura, R. Settai, and Y. Ōnuki, Phys. Rev. B 81, 140507 (2010).
- (21) V. K. Anand, A. D. Hillier, D. T. Adroja, A. M. Strydom, H. Michor, K. A. McEwen, and B. D. Rainford, Phys. Rev. B 83, 064522 (2011).
- (22) V. K. Anand, D. Britz, A. Bhattacharyya, D. T. Adroja, A. D. Hillier, A. M. Strydom, W. Kockelmann, B. D. Rainford and K. A. McEwen, Phys. Rev. B 90, 014513 (2014).
- (23) V. K. Anand, D. T. Adroja and A. M. Strydom: Type-I Superconductivity in Noncentrosymmetric LaRhSi3 and LaIrSi3 in P. Grant (editor): Superconductivity: Properties, Applications and New Developments p. 1–15 (Nova Science Publishers, Inc., New York, 2015).
- (24) M. Smidman, A. D. Hillier, D. T. Adroja, M. R. Lees, V. K. Anand, R. P. Singh, R. I. Smith, D. M. Paul, and G. Balakrishnan, Phys. Rev. B 89, 094509 (2014).
- (25) P. Haen, P. Lejay, B. Chevalier, B. Lloret, J. Etourneau and M. Sera, J. Less-Common Met. 110, 321 (1985).
- (26) Y. Iwamoto, K. Ueda, T. Kohara, and Y. Yamada, Physica B 206 & 207, 276 (1995).
- (27) V. K. Anand, D. T. Adroja, A. D. Hillier, J. Taylor, and G. Andŕe, Phys. Rev. B 84, 064440 (2011).
- (28) V. K. Anand, D. T. Adroja, A. D. Hillier, W. Kockelmann, A. Fraile, and A. M. Strydom, J. Phys.: Condens. Matter 23,276001 (2011) .
- (29) V. K. Anand, D. T. Adroja, and A. D. Hillier, Phys. Rev. B 85, 014418 (2012).
- (30) D. T. Adroja and V. K. Anand, Phys. Rev. B 86, 104404 (2012).
- (31) D. T. Adroja, A. del Moral, C. de la Fuente, A. Fraile, E. A. Goremychkin, J. W. Taylor, A. D. Hillier, and F. Fernandez-Alonso, Phys. Rev. Lett. 108, 216402 (2012).
- (32) V. K. Anand, D. T. Adroja, and A. D. Hillier, J. Phys.: Condens. Matter 25, 196003 (2013).
- (33) V. K. Anand, D. T. Adroja, A. Bhattacharyya, A. D. Hillier, J. W. Taylor and A. M. Strydom, J. Phys.: Condens. Matter 26, 306001 (2014).
- (34) V. K. Anand, D. T. Adroja, A. Bhattacharyya, A. D. Hillier, D. Britz, A. M. Strydom, J. W. Taylor, A. Fraile and W. Kockelmann, J. Phys.: Conf. Ser. 592, 012008 (2015).
- (35) V. K. Anand, D. T. Adroja, D. Britz, A. M. Strydom, J. W. Taylor and W. Kockelmann, Phys. Rev. B 94, (2016) 014440.
- (36) D. T. Adroja, C. de la Fuente, A. Fraile, A. D. Hillier, A. Daoud-Aladine, W. Kockelmann, J. W. Taylor, M. M. Koza, E. Burzur, F. Luis, J. I. Arnaudas, and A. del Moral Phys. Rev. B 91, 134425 (2015).
- (37) A. D. Hillier, D. T. Adroja, P. Manuel, V. K. Anand, J. W. Taylor, K. A. McEwen, B. D. Rainford and M. M. Koza, Phys. Rev. B 85, 134405 (2012).
- (38) M. Smidman, D. T. Adroja, A. D. Hillier, L. C. Chapon, J. W. Taylor, V. K. Anand, R. P. Singh, M. R. Lees, E. A. Goremychkin, M. M. Koza, V. V. Krishnamurthy, D. M. Paul and G. Balakrishnan, Phys. Rev. B 88, 134416 (2013).
- (39) M. Smidman, D. T. Adroja, E. A. Goremychkin, M. R. Lees, D. M. Paul, and G. Balakrishnan, Phys. Rev. B 91, 064419 (2015).
- (40) B. K. Tanner, Contemp. Phys. 20, 187 (1979).
- (41) M. J. Besnus, A. Braghta, N. Hamdaoui and A. Meyer, J. Magn. Magn. Mater. 104-107, 1385 (1992).
- (42) G. Grüner and A. Zawadowski, Rep. Prog. Phys. 37, 1497 (1974).
- (43) H. Yashima, H. Mori, N. Sato, and T. Satoh, J. Magn. Magn. Mater. 31-34, 411 (1983).
- (44) H. T. Stokes, D. M. Hatch, and B. J. Campbell, ISOTROPY Software Suite [http://iso.byu.edu].
- (45) B. J. Campbell, H. T. Stokes, D. E. Tanner, and D. M. Hatch, J. Appl. Crystallogr. 39, 607 (2006).
- (46) D. D. Khalyavin, A. D. Hillier, D. T. Adroja, A. M. Strydom, P. Manuel, L. C. Chapon, P. Peratheepan, K. Knight, P. Deen, C. Ritter, Y. Muro, and T. Takabatake, Phys. Rev. B 82, 100405(R) (2010).
- (47) F. Strigari, T. Willers, Y. Muro, K. Yutani, T. Takabatake, Z. Hu, Y.-Y. Chin, S. Agrestini, H.-J. Lin, C. T. Chen, A. Tanaka,M. W. Haverkort, L.-H. Tjeng, and A. Severing, Phys. Rev. B 86, 081105(R) (2012).
- (48) A. Bhattacharyya, D. D. Khalyavin, D. T. Adroja, A. M. Strydom, A. D. Hillier, P. Manuel, T. Takabatake, J. W. Taylor, and C. Ritter, Phys. Rev. B 90, 174412 (2014).
- (49) H. Kato, R. Kobayashi, T. Takesaka, T. Nishioka, M. Matsumura, K. Kaneko, and N. Metoki, J. Phys. Soc. Jpn. 80, 073701 (2011).
- (50) F. Strigari, T. Willers, Y. Muro, K. Yutani, T. Takabatake, Z. Hu, S. Agrestini, C.-Y. Kuo, Y.-Y. Chin, H.-J. Lin, T. W. Pi, C. T. Chen, E. Weschke, E. Schierle, A. Tanaka, M. W. Haverkort, L. H. Tjeng, and A. Severing, Phys. Rev. B 87, 125119 (2013).
- (51) D. T. Adroja, Y. Muro, T. Takabatake, M. D. Le, H. C. Walker, K. A. McEwen, and A.T. Boothroyd, arXiv:1607.06538.