The MASSIVE Survey – X. Misalignment between Kinematic and Photometric Axes and Intrinsic Shapes of Massive Early-Type Galaxies
Abstract
We use spatially resolved two-dimensional stellar velocity maps over a field of view to investigate the kinematic features of 90 early-type galaxies above stellar mass in the MASSIVE survey. We measure the misalignment angle between the kinematic and photometric axes and identify local features such as velocity twists and kinematically distinct components. We find 46% of the sample to be well aligned (), 33% misaligned, and 21% without detectable rotation (non-rotators). Only 24% of the sample are fast rotators, the majority of which (91%) are aligned, whereas 57% of the slow rotators are misaligned with a nearly flat distribution of from to . 11 galaxies have and thus exhibit minor-axis (“prolate”) rotation in which the rotation is preferentially around the photometric major axis. Kinematic misalignments occur more frequently for lower galaxy spin or denser galaxy environments. Using the observed misalignment and ellipticity distributions, we infer the intrinsic shape distribution of our sample and find that MASSIVE slow rotators are consistent with being mildly triaxial, with mean axis ratios of and . In terms of local kinematic features, 51% of the sample exhibit kinematic twists of larger than , and 2 galaxies have kinematically distinct components. The frequency of misalignment and the broad distribution of reported here suggest that the most massive early-type galaxies are mildly triaxial, and that formation processes resulting in kinematically misaligned slow rotators such as gas-poor mergers occur frequently in this mass range.
keywords:
galaxies: elliptical and lenticular, cD – galaxies: evolution – galaxies: formation – galaxies: kinematics and dynamics – galaxies: structure1 Introduction
Understanding the distribution of the intrinsic shapes of early-type galaxies plays a key role in the study of galaxy formation and evolution. The two-dimensional surface brightness profile of an individual galaxy alone can not uniquely determine its three-dimensional intrinsic shape. Comparing stellar kinematics along the apparent major and minor axes can provide additional information about the triaxiality of an early-type galaxy (Binney, 1985).
Early spectroscopic observations along both the major and minor axes of elliptical galaxies found a varying degree of rotation along each axis (e.g., Schechter & Gunn 1979; Davies & Birkinshaw 1986, 1988; Wagner et al. 1988; Franx & Illingworth 1988; Jedrzejewski & Schechter 1989; Franx et al. 1991), lending support to the notion that elliptical galaxies can have intrinsically triaxial shapes (Binney, 1978). An in-depth study by Franx et al. (1991) found that the observed apparent ellipticity and kinematic misalignment distributions of 38 elliptical galaxies can be explained by various intrinsic shape distributions, including all nearly oblate, a mixture of oblate and prolate, and all triaxial.
More recently, several surveys have taken advantage of integral-field spectroscopy (IFS) observations to obtain detailed two-dimensional maps of stellar kinematics, e.g., SAURON (Emsellem et al., 2004), ATLAS (Cappellari et al., 2011), SAMI (Croom et al., 2012), CALIFA (Sánchez et al., 2012), and MaNGA (Bundy et al., 2015) (see Cappellari 2016 for a review). In addition, a number of IFS studies of early-type galaxies targeted specifically brightest cluster galaxies (BCGs), e.g., Brough et al. (2011); Jimmy et al. (2013), and a few IFS (or multi-slit) studies had wide enough sky coverage to reach effective radii, e.g., SLUGGS (Brodie et al., 2014) and Raskutti et al. (2014). A major goal of these studies was to investigate the properties and statistics of fast rotators (FR) and slow rotators (SR). Some of these studies further investigated the misalignment between kinematic and photometric axes and local velocity features in early-type galaxies. This was achieved by using the kinemetry method (Krajnović et al., 2006), a generalization of isophotal analysis of light distributions to the analysis of the spatial properties of velocity features. It was found that, in general, fast rotators have well aligned photometric and kinematic axes and show relatively featureless velocity maps or small kinematic twists, while slow rotators tend to be misaligned, show large kinematic twists or complex kinematic features, and are mildly triaxial (e.g., Emsellem et al. 2007; Krajnović et al. 2011; Weijmans et al. 2014). Measuring the kinematics of the outer parts of elliptical galaxies further than a few effective radii is difficult to achieve using absorption spectroscopy due to the decrease in surface brightness at large radii. Instead, one must use discrete tracers such as planetary nebulae, which have been shown to be good tracers of stellar kinematics in the halos of early-type galaxies (Coccato et al., 2009; Cortesi et al., 2013). Results from planetary nebulae derived velocity fields (Pulsoni et al., 2017) show that the halos of elliptical galaxies exhibit more diverse kinematic properties, such as misaligned halos in fast rotators and decoupled halos in slow rotators.
Aside from the BCG studies, the early-type galaxies targeted in the aforementioned spectroscopic surveys were predominantly fast-rotating, lower-mass S0 or elliptical galaxies. For example, ATLAS studied 260 early-type galaxies with stellar mass in a volume up to 42 Mpc. They found 86% of the galaxies to be fast rotators, and 90% of the galaxies to show alignment between the kinematic and photometric axes (Emsellem et al., 2011). In the SAMI pilot sample of 106 galaxies, 80 are early-types, and only of them are classified as slow rotators (Fogarty et al., 2015). They found 83% of their fast rotators to be aligned, while only 38% of the slow rotators are aligned. A study of 315 early-type galaxies in galaxy clusters in the SAMI survey found only 14% to be slow rotators (Brough et al., 2017).
We designed the MASSIVE survey (Ma et al., 2014) to sample the high-mass regime of early-type galaxies that was little explored in previous IFS surveys. MASSIVE is volume-limited, surveying the most massive galaxies located up to a distance of 108 Mpc in the northern sky. This survey is complete to an absolute -band magnitude of mag, or stellar mass . In a series of three papers (Veale et al., 2017a, b; Veale et al., 2018), we investigated a wide range of stellar kinematic properties of MASSIVE galaxies using spatially-resolved IFS measurements of stellar velocities, velocity dispersions, and higher velocity moments over a field of view (FOV). We found the fraction of slow rotators to rise rapidly with increasing in our mass range, reaching % at (Paper V; Veale et al. 2017a). Paper VII (Veale et al., 2017b) examined the relationships between galaxy spin, stellar mass, and environment in a combined sample of 370 MASSIVE and ATLAS survey galaxies. We found that the apparent kinematic morphology-density relation for local early-type galaxies is primarily driven by galaxy mass rather than galaxy environment. The radial profiles of velocity dispersions for 90 MASSIVE galaxies out to projected radii as large as 30 kpc were presented in Paper VIII (Veale et al., 2018). We found the fraction of galaxies with rising outer profiles to increase with and in denser galaxy environments, and this trend is likely to be caused by variations in the total mass profiles rather than in the velocity anisotropy alone. Additionally, Paper VI (Pandya et al., 2017) analysed the morphology and kinematics of warm ionized gas detected in MASSIVE galaxies. We found kinematic misalignment between stars and gas to be more prevalent in slow rotators (2/2) than in fast rotators (1/4), pointing to external means of acquiring gas for massive early-type galaxies.
This paper is devoted to the stellar velocity properties of MASSIVE galaxies. Here we make use of the two-dimensional nature of IFS data to analyse the stellar velocity features of 90 MASSIVE galaxies. We use the kinemetry method (Krajnović et al., 2006) to determine the kinematic features and misalignment angle of each galaxy. We investigate the correlations between kinematic misalignment and galaxy morphology and environment for fast and slow rotating galaxies.
The paper is organized as follows. The galaxy sample and data reduction procedure are described in Section 2. Section 3 describes how the kinemetry method is used to measure the global and local velocity properties. In Section 4 we investigate the distribution of the misalignment between the photometric and kinematic axes and the correlations between alignment and galaxy morphological parameters such as ellipticity, stellar mass, or environmental parameters. In Section 5 we invert the observed kinematic misalignment and ellipticity distributions to determine the intrinsic shape distribution of our galaxy sample. Section 6 presents the local kinematic features we identified on the velocity maps and discusses the more interesting cases. We enumerate the main conclusions and discuss the implications of our findings in Section 7.
2 Observations and Data
| Name | PA | PA | Alignment/ | Features | |||||
|---|---|---|---|---|---|---|---|---|---|
| [folded] | [unfolded] | deg | deg | deg | km/s | Rotator | |||
| (1) | (2) | (3) | (4) | (5) | (6) | (7) | (8) | (9) | (10) |
| IC0310 | 0.06 | 0.085 | 0.091 | 32.6 | 192.0 13.8 | 20.6 | 30.5 | M-SR4 | Kinematic Twist |
| NGC0057 | 0.17 | 0.022 | 0.028 | 41.1 | - | - | 9.6 | None | - |
| NGC0080 | 0.09 | 0.039 | 0.045 | 9.6 | 28.5 28.5 | 18.9 | 13.6 | A-SR | Regular Rotation∗ |
| NGC0315 | 0.28 | 0.062 | 0.063 | 42.4 | 222.0 7.2 | 0.4 | 44.1 | A-SR | Regular Rotation |
| NGC0383 | 0.14 | 0.252 | 0.247 | 141.2 | 140.5 2.8 | 0.7 | 103.8 | A-FR | Regular Rotation |
| NGC0410 | 0.25 | 0.034 | 0.048 | 34.9 | 161.0 18.5 | 53.9 | 18.9 | M-SR | Kinematic Twist∗ |
| NGC0499 | 0.35 | 0.060 | 0.066 | 73.8 | 273.5 8.0 | 19.7 | 46.2 | M-SR | Regular Rotation |
| NGC0507 | 0.09 | 0.049 | 0.082 | 21.9 | 183.5 4.0 | 18.4 | 50.4 | M-SR | KDC |
| NGC0533 | 0.26 | 0.034 | 0.051 | 51.2 | 6.0 24.8 | 45.2 | 19.8 | M-SR | Kinematic Twist |
| NGC0545 | 0.28 | 0.129 | 0.081 | 59.7 | - | - | 10.9 | None | - |
| NGC0547 | 0.14 | 0.056 | 0.081 | 94.1 | - | - | 29.6 | None | - |
| NGC0665 | 0.24 | 0.402 | 0.395 | 114.8 | 116.0 3.2 | 1.2 | 126.0 | A-FR | Regular Rotation |
| NGC0708 | 0.40 | 0.036 | 0.043 | 45.0 | 126.0 17.5 | 81.0 | 31.8 | M-SR | Regular Rotation |
| NGC0741 | 0.17 | 0.037 | 0.050 | 86.7 | - | - | 12.4 | None | - |
| NGC0777 | 0.17 | 0.046 | 0.060 | 148.4 | 8.0 10.0 | 39.6 | 41.0 | M-SR | Kinematic Twist |
| NGC0890 | 0.38 | 0.101 | 0.136 | 55.0 | 100.5 9.2 | 45.5 | 45.7 | M-SR | Kinematic Twist |
| NGC0910 | 0.16 | 0.039 | 0.050 | 30.0 | 59.0 27.8 | 29.0 | 14.5 | A-SR | Regular Rotation |
| NGC0997 | 0.13 | 0.243 | 0.240 | 14.7 | 219.5 6.2 | 24.8 | 93.5 | M-FR | Kinematic Twist |
| NGC1016 | 0.06 | 0.033 | 0.040 | 40.5 | 261.5 19.5 | 41.0 | 29.9 | M-SR | Kinematic Twist∗ |
| NGC1060 | 0.24 | 0.023 | 0.048 | 74.0 | 342.0 13.5 | 88.0 | 14.9 | M-SR | Kinematic Twist∗ |
| NGC1129 | 0.151 | 0.120 | 0.124 | 46.2 | 179.0 6.0 | 47.2 | 66.2 | M-SR | Kinematic Twist |
| NGC1132 | 0.37 | 0.061 | 0.082 | 141.3 | 122.0 18.2 | 19.3 | 26.3 | A-SR | Kinematic Twist∗ |
| NGC1167 | 0.17 | 0.427 | 0.395 | 71.4 | 254.0 3.8 | 2.6 | 110.0 | A-FR | Regular Rotation |
| NGC1226 | 0.18 | 0.033 | 0.030 | 90.0 | - | - | 22.5 | None | - |
| NGC1272 | 0.07 | 0.023 | 0.037 | 160.3 | - | - | 11.4 | None | - |
| NGC1453 | 0.14 | 0.201 | 0.204 | 35.0 | 35.0 3.2 | 0.0 | 91.8 | A-FR | Regular Rotation |
| NGC1497 | 0.40 | 0.474 | 0.466 | 60.0 | 54.5 3.5 | 5.5 | 161.1 | A-FR | Regular Rotation |
| NGC1573 | 0.34 | 0.040 | 0.056 | 35.0 | 189.5 19.2 | 25.5 | 25.5 | M-SR | Kinematic Twist |
| NGC1600 | 0.26 | 0.026 | 0.035 | 10.0 | - | - | 21.8 | None | - |
| NGC1684 | 0.24 | 0.122 | 0.133 | 95.0 | 223.0 1.0 | 52.0 | 41.8 | M-SR | Kinematic Twist∗ |
| NGC1700 | 0.28 | 0.195 | 0.198 | 90.0 | 268.0 1.8 | 2.0 | 114.9 | A-FR | Regular Rotation |
| NGC2208 | 0.32 | 0.062 | 0.049 | 95.0 | - | - | 16.9 | None | - |
| NGC2256 | 0.20 | 0.048 | 0.056 | 75.0 | - | - | 17.0 | None | - |
| NGC2258 | 0.24 | 0.036 | 0.071 | 135.0 | 71.0 17.2 | 64.0 | 30.6 | M-SR | Regular Rotation |
| NGC2274 | 0.10 | 0.067 | 0.073 | 145.0 | 287.5 25.8 | 37.5 | 25.9 | M-SR | Kinematic Twist |
| NGC2320 | 0.30 | 0.233 | 0.214 | 140.0 | 147.0 4.0 | 7.0 | 112.7 | A-FR | Regular Rotation |
| NGC2332 | 0.34 | 0.037 | 0.034 | 65.0 | - | - | 14.9 | None | - |
| NGC2340 | 0.44 | 0.029 | 0.032 | 80.0 | - | - | 12.4 | None | - |
| NGC2418 | 0.20 | 0.241 | 0.242 | 63.9 | 77.5 3.2 | 13.6 | 100.4 | A-FR | Regular Rotation |
| NGC2513 | 0.20 | 0.095 | 0.101 | 166.8 | 348.0 9.0 | 1.2 | 44.0 | A-SR | Regular Rotation |
| NGC2672 | 0.14 | 0.095 | 0.106 | 126.0 | 167.5 5.2 | 41.5 | 44.8 | M-SR | Kinematic Twist |
| NGC2693 | 0.25 | 0.295 | 0.294 | 166.5 | 169.0 2.2 | 2.5 | 144.2 | A-FR | Regular Rotation |
| NGC2783 | 0.39 | 0.042 | 0.060 | 165.2 | 269.5 11.0 | 75.7 | 29.4 | M-SR | Kinematic Twist∗ |
| NGC2832 | 0.31 | 0.071 | 0.084 | 156.2 | 253.0 31.0 | 83.2 | 32.2 | M-SR | Kinematic Twist |
| NGC2892 | 0.06 | 0.070 | 0.070 | 138.4 | - | - | 18.3 | None | - |
| NGC3158 | 0.18 | 0.255 | 0.258 | 152.6 | 330.0 2.2 | 2.6 | 127.0 | A-FR | Regular Rotation |
| NGC3209 | 0.27 | 0.039 | 0.051 | 82.2 | 323.0 27.0 | 60.8 | 19.0 | M-SR | Regular Rotation |
| NGC3462 | 0.26 | 0.085 | 0.106 | 55.5 | 109.5 11.2 | 54.0 | 51.5 | M-SR | Kinematic Twist |
| NGC3562 | 0.16 | 0.038 | 0.051 | 160.0 | 354.0 27.0 | 14.0 | 26.3 | A-SR | Kinematic Twist |
| NGC3615 | 0.38 | 0.399 | 0.399 | 44.2 | 41.5 3.2 | 2.7 | 136.7 | A-FR | Kinematic Twist |
| NGC3805 | 0.36 | 0.496 | 0.475 | 64.6 | 61.5 1.5 | 3.1 | 184.9 | A-FR | Kinematic Twist |
| NGC3816 | 0.31 | 0.105 | 0.144 | 70.0 | 255.0 12.8 | 5.0 | 35.1 | A-SR | Regular Rotation |
| NGC3842 | 0.22 | 0.038 | 0.040 | 1.6 | 185.0 30.2 | 3.4 | 11.4 | A-SR | Kinematic Twist∗ |
| NGC3862 | 0.06 | 0.045 | 0.055 | 148.2 | - | - | 28.4 | None | - |
| NGC3937 | 0.20 | 0.074 | 0.060 | 27.3 | 200.0 15.5 | 7.3 | 32.4 | A-SR | Kinematic Twist |
| NGC4073 | 0.32 | 0.023 | 0.038 | 101.3 | 339.5 20.5 | 58.2 | 20.1 | M-SR | Kinematic Twist∗ |
| NGC4472 | 0.171 | 0.197 | 0.197 | 155.0 | 169.0 5.52 | 14.0 | 58.93 | A-FR | - |
| NGC4555 | 0.20 | 0.120 | 0.121 | 117.7 | 119.5 7.0 | 1.8 | 60.2 | A-SR | Kinematic Twist |
| NGC4816 | 0.20 | 0.069 | 0.073 | 85.6 | 239.0 18.8 | 26.6 | 23.7 | M-SR | Kinematic Twist |
| NGC4839 | 0.35 | 0.045 | 0.045 | 65.0 | - | - | 19.0 | None | - |
| NGC4874 | 0.09 | 0.070 | 0.072 | 40.6 | 334.5 5.5 | 66.1 | 40.1 | M-SR | Kinematic Twist |
| Name | PA | PA | Alignment/ | Features | |||||
|---|---|---|---|---|---|---|---|---|---|
| [folded] | [unfolded] | deg | deg | deg | km/s | Rotator | |||
| (1) | (2) | (3) | (4) | (5) | (6) | (7) | (8) | (9) | (10) |
| NGC4889 | 0.36 | 0.032 | 0.033 | 80.3 | - | - | 24.2 | None | - |
| NGC4914 | 0.39 | 0.054 | 0.064 | 155.1 | 350.0 13.2 | 14.9 | 23.3 | A-SR | Regular Rotation |
| NGC5129 | 0.37 | 0.402 | 0.389 | 5.6 | 3.0 2.5 | 2.6 | 134.7 | A-FR | Regular Rotation |
| NGC5208 | 0.63 | 0.615 | 0.622 | 162.9 | 343.0 1.5 | 0.1 | 243.2 | A-FR | Regular Rotation |
| NGC5322 | 0.33 | 0.054 | 0.054 | 92.0 | 267.5 7.8 | 4.5 | 40.3 | A-SR | KDC |
| NGC5353 | 0.56 | 0.551 | 0.550 | 138.9 | 323.0 0.5 | 4.1 | 285.0 | A-FR | Regular Rotation |
| NGC5490 | 0.20 | 0.138 | 0.136 | 3.4 | 183.0 4.8 | 0.4 | 67.7 | A-SR | Regular Rotation |
| NGC5557 | 0.17 | 0.035 | 0.035 | 93.7 | 202.0 16.2 | 71.7 | 27.4 | M-SR | Kinematic Twist∗ |
| NGC6223 | 0.20 | 0.315 | 0.320 | 85.0 | 288.0 2.2 | 23.0 | 135.6 | M-FR | Kinematic Twist |
| NGC6375 | 0.10 | 0.240 | 0.232 | 145.0 | 322.0 7.0 | 3.0 | 66.2 | A-FR | Regular Rotation |
| NGC6482 | 0.36 | 0.137 | 0.138 | 65.0 | 63.5 2.0 | 1.5 | 118.4 | A-SR | Regular Rotation |
| NGC6575 | 0.28 | 0.124 | 0.136 | 65.0 | 65.0 7.5 | 0.0 | 48.6 | A-SR | Kinematic Twist |
| NGC7052 | 0.50 | 0.148 | 0.147 | 65.0 | 61.5 2.2 | 3.5 | 71.1 | A-SR | Regular Rotation∗ |
| NGC7242 | 0.28 | 0.037 | 0.043 | 40.0 | - | - | 17.1 | None | - |
| NGC7265 | 0.22 | 0.039 | 0.079 | 165.0 | 259.5 9.5 | 85.5 | 30.5 | M-SR | Kinematic Twist |
| NGC7274 | 0.06 | 0.090 | 0.081 | 160.0 | 253.5 12.5 | 86.5 | 31.9 | M-SR4 | Kinematic Twist |
| NGC7386 | 0.28 | 0.071 | 0.090 | 140.9 | 111.0 19.5 | 29.9 | 29.2 | M-SR | Kinematic Twist |
| NGC7426 | 0.34 | 0.563 | 0.525 | 70.0 | 251.0 1.2 | 1.0 | 216.3 | A-FR | Regular Rotation |
| NGC7436 | 0.12 | 0.085 | 0.082 | 13.1 | 197.5 10.2 | 4.4 | 47.6 | A-SR | Regular Rotation |
| NGC7550 | 0.07 | 0.038 | 0.040 | 155.2 | - | - | 14.9 | None | - |
| NGC7556 | 0.25 | 0.049 | 0.052 | 113.8 | 294.0 30.8 | 0.2 | 54.9 | A-SR | Kinematic Twist∗ |
| NGC7618 | 0.28 | 0.247 | 0.239 | 0.0 | 178.0 4.5 | 2.0 | 106.5 | A-FR | Regular Rotation |
| NGC7619 | 0.23 | 0.119 | 0.125 | 36.1 | 215.5 2.2 | 0.6 | 53.3 | A-SR | Regular Rotation |
| NGC7626 | 0.14 | 0.034 | 0.040 | 10.5 | 2.5 40.0 | 8.0 | 18.4 | A-SR | Kinematic Twist∗ |
| UGC01332 | 0.30 | 0.037 | 0.056 | 80.0 | - | - | 16.7 | None | - |
| UGC02783 | 0.11 | 0.068 | 0.082 | 113.9 | 9.0 10.2 | 75.1 | 47.9 | M-SR | Kinematic Twist |
| UGC03683 | 0.26 | 0.090 | 0.102 | 45.0 | 49.5 6.2 | 4.5 | 32.3 | A-SR | Kinematic Twist |
| UGC03894 | 0.10 | 0.122 | 0.130 | 35.2 | 217.0 8.5 | 1.8 | 52.9 | A-FR | Regular Rotation |
| UGC10918 | 0.14 | 0.042 | 0.022 | 5.0 | - | - | 29.7 | None | - |
-
•
Column (1): Galaxy name.
-
•
Column (2): Ellipticity, taken from NSA where available, otherwise from 2MASS (denoted by ). 1 is taken from our CFHT data for NGC 1129 and from Emsellem et al. (2011) for NGC 4472.
-
•
Column (3): Spin parameter at the effective radius, using the folded binning scheme of Veale et al. (2017a).
-
•
Column (4): Spin parameter at the effective radius, using the unfolded binning scheme of this work.
-
•
Column (5): Photometric position angle, taken from NSA where available, otherwise from 2MASS (denoted by ).
- •
-
•
Column (7): Kinematic misalignment angle. See Section 3.1 for definitions.
- •
-
•
Column (9): Kinematic misalignment category: aligned (’A’) or misaligned (’M’) and fast rotator (’FR’) or slow rotator (’SR’) classification. The non-rotating slow rotators are denoted by ’None’. 4 These galaxies would be fast rotators by using the ATLAS3D – criterion. Based on the slow rotation seen on the velocity maps, we classify these galaxies as slow rotators.
- •
2.1 Galaxy sample and IFS data
We study the velocity features of 90 early-type galaxies in the MASSIVE survey (Ma et al., 2014). The list of galaxies and key galaxy parameters are given in Table 1. The MASSIVE galaxies are selected from the Extended Source Catalog (Jarrett et al., 2000) of the Two Micron All Sky Survey (2MASS) (Skrutskie et al., 2006). The MASSIVE survey is volume limited ( Mpc) and complete down to .
For each galaxy, our observations provide fiber spectra from the Mitchell/VIRUS-P IFS (Hill et al., 2008) on the 2.7 m Harlan J. Smith Telescope at McDonald Observatory. The IFS covers a by FOV with 246 fibers, each of diameter. The fibers are evenly spaced with a one-third filling factor. We observe three dithering positions to achieve contiguous spatial coverage of each galaxy. The wavelength coverage is 3650Å to 5850Å and the average spectral resolution is 5Å FWHM. Details of the observing strategy and data reduction procedure are given in Ma et al. (2014) and Veale et al. (2017a).
2.2 Spatial binning and velocity maps
We apply the binning procedure described in Veale et al. (2017a) to ensure that our IFS spectra in the outskirts of galaxies achieve a threshold signal-to-noise ratio (S/N). The spectra from single fibers in the central regions of our target galaxies always have a S/N higher than the threshold, so no binning is needed here. In the fainter outer parts of each galaxy, we group the fibers with lower S/N into bins until the co-added spectrum reaches the threshold. See Veale et al. (2017a) for details.
To make full use of the velocity map across the entire FOV of each galaxy, we make one modification to the binning scheme of Veale et al. (2017a). Veale et al. (2017a) imposed a minimum S/N of 20 for each bin, and to enhance the spatial resolution in the outer parts of each galaxy, the individual fiber spectra with S/N below 20 were first co-added in pairs (i.e. “folded") over the photometric major axis. As a result, the velocity maps only contained independent bins for half of the FOV. Here, we instead generate “unfolded" maps and use a lower S/N threshold that is adequate for measuring the line-of-sight velocities. For ease of comparison with the results in Veale et al. (2017a, b); Veale et al. (2018), we opt to preserve the approximate area of each velocity bin in the folded version of the bin maps and therefore impose a minimum S/N of 14 for the unfolded data. This procedure results in roughly twice as many velocity bins as in Veale et al. (2017a).
To extract the line-of-sight velocity distribution (LOSVD), we use the penalized pixel-fitting (pPXF) method of Cappellari & Emsellem (2004). This method recovers the LOSVD function by convolving the observed galaxy spectrum with a set of template star spectra and assuming that can be reasonably described by a Gauss-Hermite series of order :
| (1) |
where , is the mean velocity, is the velocity dispersion, and is the Hermite polynomial. For details on the parameters of this fitting process, see Veale et al. (2017a). For each galaxy, the final result is a set of best-fitting kinematic moments (, and through ) for each bin of our unfolded maps. The error bars on the kinematic moments are estimated using Monte Carlo methods. For each bin, we generate 100 trial spectra where we add random Gaussian noise to the original spectrum – the Gaussian noise scale for each trial is derived using the actual noise of the spectrum. The reported error represents the standard deviation of the pPXF results for the 100 trial spectra.
To quantify the amount of rotation for each galaxy, we compute the dimensionless spin parameter (Binney, 2005; Emsellem et al., 2007) at the effective radius (see Veale et al. 2017a). Since all the fibers in the inner regions of the galaxies are treated in the same way in the folded and unfolded versions of our velocity maps, we find measured from the two velocity maps to agree well, differing by less than for % of the galaxies (see columns 3 and 4 of Table 1). Larger differences are found for the small subset of galaxies that exhibit rotation around the photometric major axis, which are discussed in Section 4.3. This is because the folding procedure in Veale et al. (2017a) is performed about the photometric major axis under the standard assumption that galaxies rotate around the minor axis. However, all these galaxies have folded , such that the unfolded is still less than 0.1 for most cases (and less than 0.15 for all cases); their classification as slow rotators therefore remains the same.
We observed NGC 4472 early on using a different pointing strategy from that used in the MASSIVE run, and the data are not suitable for the current unfolded analysis pipeline. For completeness, we instead use the parameters derived by Veale et al. (2017a, b); Veale et al. (2018) and the kinematic results from ATLAS (Krajnović et al., 2011).
2.3 Photometric data
The photometric position angle (PA) and ellipticity () of each galaxy are taken primarily from the NASA-Sloan Atlas (NSA; http://www.nsatlas.org). For galaxies that do not have NSA photometric data, the 2MASS catalog is used. Since neither NSA nor 2MASS provide error bars on the photometric PA, for the purposes of our analysis we assume a fiducial uncertainty on PA of 5 for all galaxies in our sample.
For a subsample of 35 MASSIVE galaxies, we have obtained detailed WFC3 photometry (Goullaud et al., 2018) which provides surface brightness profiles and photometric parameters, including luminosity-weighted photometric PA. For 28 of these galaxies, the WFC3 photometric PA agrees with the NSA/2MASS value within or less. The 7 galaxies that have different WFC3 PAs are NGC 507, NGC 665, NGC 1129, NGC 1272, NGC 1453, NGC 2258, NGC 2274, and NGC 2672. NGC 1272 is a non-rotator (see Section 4.1 for the definition), so the disagreement between the WFC3 and NSA/2MASS photometric position angles does not affect any of our results. For the remaining 6 galaxies, we find that using the WFC3 photometric PA increases the value of the misalignment angle by and , respectively, from the values reported in Table 1. However, this does not affect our classification of each galaxy into aligned or misaligned (Section 4.2) or significantly change our conclusions.
3 Kinematic Analysis
3.1 Global kinematic position angle PA and misalignment angle
We use the fit_kinematic_pa111http://www-astro.physics.ox.ac.uk/mxc/software/ routine described in Appendix C of Krajnović et al. (2006) to measure a global kinematic position angle, PA, from the velocity map of each galaxy. The angle PA represents the average orientation of the stellar motion in our IFS field of view, and measures the direction of the receding part of the velocity map relative to the north, following the same convention as PA that eastward is positive. The routine uses the observed velocity map to generate a bi-anti-symmetric model map for each possible PA value. It then searches for the value of PA that corresponds to the best matching model map, defined as the angle that minimizes the between the observed map and the model map.
From the photometric position angle PA and the kinematic position angle PA, we compute the kinematic misalignment angle following the definition of Franx et al. (1991):
| (2) |
We note that while the range of PA is to and the range of PA is to , the misalignment angle , by construction, is restricted to be between 0 and 90. That is, measures the misalignment of the two position angles regardless of the sense of the galaxy rotation.
Our measurements of PA and , along with 1-sigma confidence level errors on PA, are listed in Table 1.
3.2 Local kinematic features
We use the kinemetry222http://davor.krajnovic.org/idl/ method (Krajnović et al., 2006) to analyse the various local kinematic features in each galaxy in our sample. Kinemetry generalizes isophotal analysis by modeling a galaxy velocity (or higher-order velocity moments) map as simple forms along ellipses: a cosine term for antisymmetric (odd) moments and a constant for symmetric (even) moments. The velocity profile along an ellipse is Fourier decomposed as:
| (3) |
where is the length of the semi-major axis of the ellipse, is the eccentric anomaly, and and are the amplitude and phase coefficients, respectively.
In addition to the kinematic coefficients , the kinemetry code returns a local position angle and a parameter for the flattening of the best-fitting ellipses along which velocity extraction was performed – their radial profiles can be used to identify kinematic features on the velocity maps. Briefly, the kinemetry algorithm consists of two steps. At each radius , first, a kinematic profile is extracted for each value of (, ) chosen from a finely-sampled grid. The best-fitting and are the ones that minimize . Then, in the second step, a new Fourier decomposition is performed along the ellipse given by the best-fitting and of the previous step.
The physical meanings of the kinemetry parameters are as follows:
-
•
The local kinematic position angle gives the orientation of the velocity map at each radius. Similar to the global PA, it is measured east of north to the receding part of the velocity map. The value corresponds to the receding part being aligned with the north direction. As noted in Krajnović et al. (2006), the global PA described in Section 3.1 can be used as a proxy for a luminosity-weighted average . We have verified that our global PA is indeed consistent with the spatial average of our local .
-
•
The flattening (also the ratio of the semi-minor to semi-major axes of the ellipse) is related to the opening angle of the iso-velocity contours. Setting translates to velocity extraction along best-fitting circles.
-
•
is related to the systemic velocity of the galaxy.
-
•
represents the amplitude of the rotational motion.
-
•
represents higher-order deviations from the assumption of a simple cosine law rotation. A high term generally indicates the existence of multiple kinematic components. In practice, one works with the dimensionless ratio .
For the galaxies in our samples, we first let kinemetry perform velocity extraction along best-fitting ellipses. This is well suited for the velocity profiles of fast rotators. Applying kinemetry to slow rotators, however, is inherently more complicated since their low rotation velocities can introduce degeneracies in the position angle and flattening parameters. In order to reduce the degeneracies, we rerun the analysis for slow rotators and restrict kinemetry to perform velocity extraction along best-fitting circles. For some intermediate cases, we run kinemetry along ellipses “restricted” such that . We find this to be helpful, for example, for cases where either the velocity is small in the central region and large in the outer region, or vice versa. In both cases, an ellipse expansion across the entire radial range does not describe well the changes in the observed velocity map.
4 Global Kinematic Alignment
4.1 Non-rotators
For 19 galaxies (21%) in our sample, the kinemetry code is unable to identify a well-defined PA, i.e., the error on PA is close to . We have visually inspected the velocity map of each galaxy and verified that none shows clear signs of organized rotation. All 19 galaxies have low spin with and low rotation velocity with km s-1, and all were classified as slow rotators in Veale et al. (2017a, b); Veale et al. (2018). Here we refer to this subset of slow rotators as non-rotators (labelled as "None" in column 9 of Table 1), and do not include them in the alignment versus misalignment statistics below.
It is possible that the lack of apparent rotation is a projection effect caused by the angular momentum pointing along the line-of-sight. For a population of galaxies with randomly distributed intrinsic angular momentum direction, we expect only to have their angular momentum pointing along or close to the line-of-sight. If this projection effect were indeed the only cause of observed non-rotation, we would expect to find a non-rotator fraction much smaller than the observed 21%. In addition, if the angular momentum is indeed pointing along the line-of-sight (i.e. we are seeing the galaxies face-on), we would expect the non-rotators to have rounder . However, only 4 of the 19 non-rotators have ellipticity below 0.1, and 9 have ellipticity between 0.26 and 0.44 (see middle panel of Fig. 2), making it unlikely that all the non-rotators are face-on. We therefore conclude that most of the non-rotators are indeed rotating very slowly.
4.2 Rotators: aligned versus misaligned
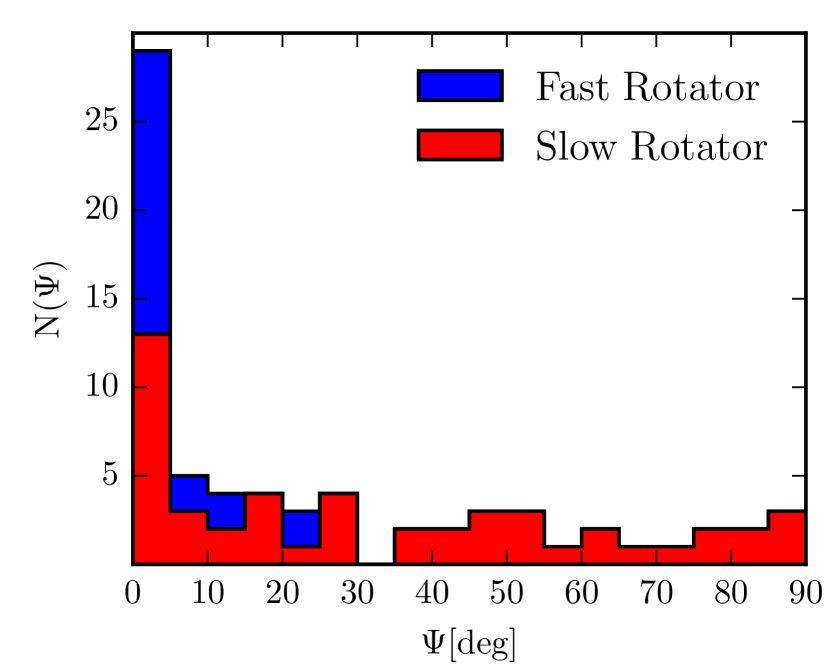
In our sample of 90 galaxies, 71 have identifiable kinematic axes. Our measurements of the global kinematic position angle, PA, and the misalignment angle between the photometric and kinematic PA, , for each galaxy are given in Table 1. The distribution of (Fig. 1) is sharply peaked at small , with a long and flat tail to maximal misalignment of . The distributions for fast and slow rotators are markedly different from each other, which will be discussed further in Section 4.4.
Based on the distribution, we divide the 71 galaxies into aligned versus misaligned, using a similar criterion as in Krajnović et al. (2011) and Fogarty et al. (2015):
-
•
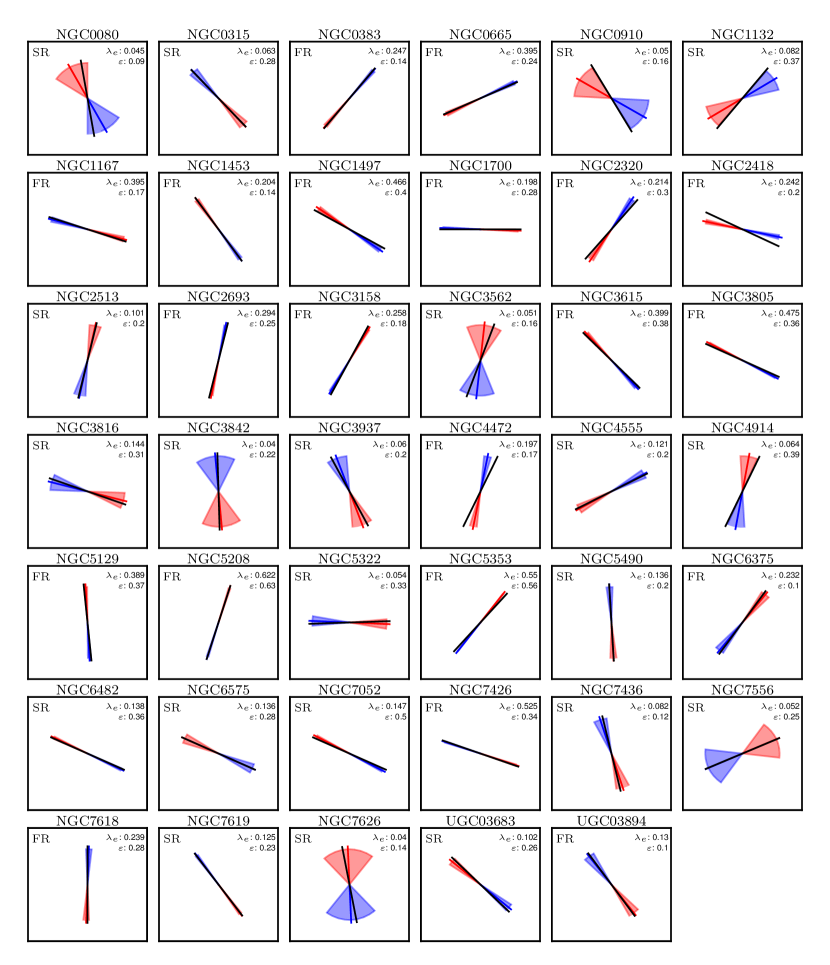
41 galaxies (46% of the total sample) are aligned, for which . Fig. 11 shows the photometric (black bar) and kinematic (red-blue bar) axes for each galaxy. Due to the larger error bars on PA for some of the galaxies, we also include in this category 3 galaxies for which but the error bars of PA and PA overlap.
-
•
30 galaxies (33%) are misaligned, for which and the error bars of PA and PA do not overlap. Fig. 12 shows how the two axes are misaligned for each galaxy in this category.
Galaxy merger simulations have found that gas-rich major mergers of disc galaxies preferentially form axisymmetric oblate remnants with small , whereas gas-poor major mergers of disc galaxies form more triaxial or prolate remnants with a broad distribution of (e.g., Naab & Burkert 2003; Cox et al. 2006; Jesseit et al. 2009). The general trends of the simulated distributions shown in, e.g., fig. 12 of Moody et al. (2014), figs. 5 and 10 of Jesseit et al. (2009) and fig. 13 of Cox et al. (2006) are in broad agreement with our results in Fig. 1. However, these simulated galaxies are from idealized binary mergers and do not represent a well-defined galaxy population of a given mass range in a cosmological setting. Furthermore, these simulations mostly focused on mergers of disc galaxies, which are unlikely to result in galaxies as massive as those in the MASSIVE survey (). Further mergers of smaller elliptical galaxies and significant mass accretion are needed to build up such high stellar masses (e.g., Boylan-Kolchin et al. 2005, 2006). Larger simulations probing galaxies in the mass range of MASSIVE would be needed for a more quantitative comparison of Fig. 1 and theoretical predictions.
4.3 Galaxies with large misalignment angles: minor-axis rotation
As Fig. 1 shows, 11 galaxies in our sample have . In particular, 7 of the 11 galaxies have nearly orthogonal photometric and kinematic position angles with : NGC 708, NGC 1060, NGC 2783, NGC 2832, NGC 7265, NGC 7274, and UGC 2783. While the rotation of a galaxy is typically found to be around the photometric minor axis, these galaxies rotate around the major axis, sometimes referred to as showing “minor-axis rotation” or “prolate rotation” (e.g., Schechter & Gunn 1979; Davies & Birkinshaw 1986, 1988; Wagner et al. 1988; Jedrzejewski & Schechter 1989; Franx et al. 1989).
Our data detect rotation around the photometric major axis to varying radii. The radial extent is for NGC 708, NGC 2258, NGC 3209 and UGC 2783, for NGC 7265 and NGC 7274, and for NGC 1060. NGC 2783 shows minor-axis rotation up to and mild major-axis rotation in the outer parts. NGC 2832 shows only mild minor-axis rotation up to .
Another MASSIVE galaxy with known rotation around the major axis is NGC 7626 (Davies & Birkinshaw, 1988). Our detailed velocity map for this galaxy shows hints of rotation around the major axis in the inner part up to , but the outer part up to is rotating around the minor axis at higher velocity. The high velocity rotation in the outer parts affects the global value of the misalignment angle such that .
Tsatsi et al. (2017) present evidence for minor-axis rotation for eight massive galaxies from the CALIFA survey (Walcher et al., 2014). This rotation occurs either in a main galaxy body or in the kinematically decoupled component of a galaxy. They argue that prolate rotation among massive early-type galaxies is more common than previously thought, citing a fraction of for CALIFA and for ATLAS galaxies with . At the high mass end, Krajnović et al. (2018) find that 44% of their sample of 25 M3G galaxies more massive than display main rotation around the major axis. This fraction increases to 50% if they select only the BCGs in the sample.
Higher-mass galaxies in numerical simulations are found to have a higher probability of being intrinsically prolate or showing minor-axis rotation (Ebrová & Łokas, 2017; Li et al., 2018). The emergence of prolate shape and minor-axis rotation typically occurs at similar time (Ebrová & Łokas, 2017), and the angular momentum of the minor-axis rotation often results from the spin of the primary progenitor in the last significant merger (Li et al., 2018).
Keeping all this in mind, we find that 11 out of 90 galaxies exhibit rotation around their respective photometric major axis to some extent, corresponding to a fraction of in the mass range .
4.4 Kinematic misalignment versus galaxy spin
A total of 22 galaxies in our sample of 90 galaxies have spin parameter , which we classify as fast rotators (Veale et al., 2018). Of the 22 fast rotators, 20 galaxies (91%) are well-aligned with (blue histogram in Fig. 1 and blue points in Fig. 2). The two exceptions are NGC 997 and NGC 6223, with and , respectively, which we discuss in more detail in Section 6.2.
By contrast, only 21 (43%) of the 49 slow rotators (excluding the 19 non-rotators) are aligned with . The remaining 28 slow rotators show a wide variation in misalignment angle (red histogram in Fig. 1), with distributed fairly evenly from to . We therefore conclude that only 21/68 (31%) of the MASSIVE galaxies with low spins () have aligned kinematic and photometric axes.
To verify that the fractions of aligned galaxies among fast and slow rotators are statistically different, we use Fisher’s test. Since there is some uncertainty in assigning a fast/slow rotator label (particularly for galaxies close to the threshold line), as well as an aligned (or not) label, we perform a Monte Carlo (MC) run of Fisher’s test where we draw from the uncertainty distributions (in and ) for each galaxy prior to assigning FR/SR and alignment labels. The resulting distribution of is well described by , confirming that the two fractions are different to at least the 99% confidence level. Additionally, we use standard non-parametric tests to verify that the distributions in stellar mass and distance for fast/slow rotators are not statistically different. This shows that the difference in alignment fraction between fast and slow rotating MASSIVE galaxies is statistically significant and does not result from differences in distance or mass distributions between the two classes.
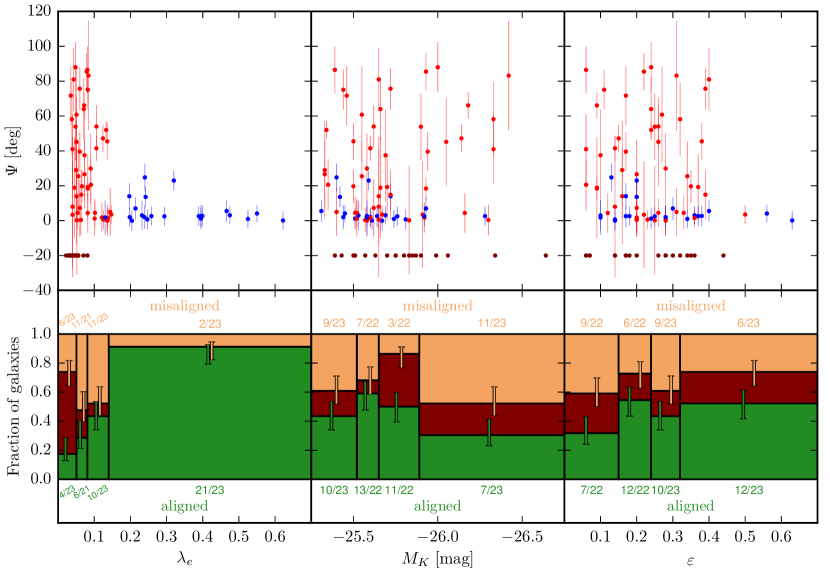
As can be seen in the left panels of Fig. 2, we find that the misalignment angle decreases quickly with increasing . In addition, we find a noticeable increase in the fraction of aligned galaxies with increasing spin parameter, from in the lowest spin bin to in the highest spin bin. An MC run (again, drawing from the uncertainty distributions of and ) of a two-sample Kolmogorov-Smirnov (K-S) test yield a -value (with ) and further confirms that there is a significant difference between the spin distribution of the aligned and misaligned samples.
The error bars on the fraction of aligned/misaligned galaxies as a function of (as well as in bins of morphological and environmental parameters) are computed within a Bayesian framework. The likelihood function for this particular type of problem is a binomial distribution of finding aligned (or misaligned) galaxies in a sample of size . For computational simplicity, we assume that the prior is a Beta(, ) distribution of mean and sample size . For each sample, we assume that the prior mean is the sample mean (i.e. 41/90 for the aligned sample and 30/90 for the misaligned sample). We use as the prior sample size for both aligned and misaligned samples. By Bayes’ theorem, the posterior is also a beta distribution with parameters (, ), where and . Finally, we determine the error bars by finding the region that contains 68.3% of the posterior probability distribution.
In previous kinematic studies of lower-mass galaxies, Fogarty et al. (2015) found that for 80 early-type galaxies in the SAMI survey, 83% of the 62 FRs and 38% of the 16 SRs are aligned. For the 260 ATLAS early-type galaxies, Krajnović et al. (2011) found 96% of the 224 FRs and 56% of the 36 SRs to be aligned. While only 24% of the galaxies in our sample are FRs due to the higher mass range () probed by the MASSIVE survey, we also find fast rotators to be predominantly aligned. The non-fast rotators at this high mass, however, show a diverse misalignment behavior.
In a similar spirit to Franx et al. (1991), Weijmans et al. (2014) and Foster et al. (2017) inferred the distributions of the intrinsic galaxy shapes from the distributions of the observed ellipticity and kinematic misalignment in the ATLAS3D and SAMI surveys. The general finding is that galaxies with high spin are predominantly axisymmetric systems formed by gas-rich mergers, while those with low spins are likely to be mildly triaxial formed by gas-poor mergers. Considering the prevalence of slow rotators and misalignment in the MASSIVE sample, we expect gas-poor minor and major mergers to be the dominant channel for the late-time mass assembly of early-type galaxies in our mass range (). To verify this, in Section 5 we perform shape inversion to determine the distribution of intrinsic shapes of MASSIVE galaxies.
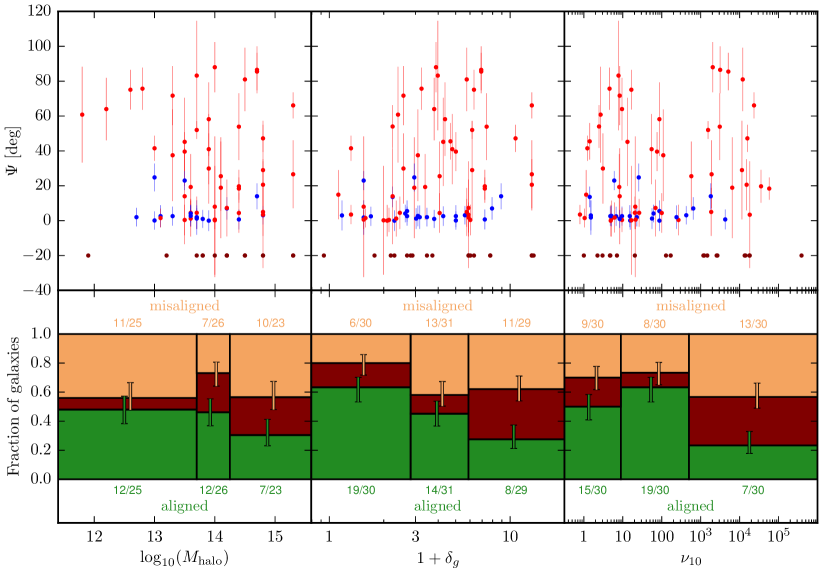
4.5 Kinematic misalignment versus galaxy mass and ellipticity
Our measurements of the kinematic misalignment angle as a function of the absolute -band magnitude or stellar mass (middle panel) and ellipticity (right panel) are shown in the top row of Fig. 2. The corresponding fraction of aligned (; green) and misaligned (; orange) galaxies in bins (with roughly equal number of galaxies) of and are shown in the bottom row. For completeness, the 19 non-rotators without measurable kinematic axis and are shown in dark red.
The fraction of misaligned galaxies is not significantly higher for the most massive galaxies than for the less massive ones (lower middle panel of Fig. 2). Indeed, a two-sample KS test for the distribution yields a -value of , showing that misalignment likely does not depend on stellar mass.
All but 6 galaxies in our sample have . At a given (below 0.4), the distribution of covers the entire range of to . This trend was also found by Franx et al. (1991). As a function of , we do not find any significant correlations for the fraction of aligned/misaligned galaxies (right panel of Fig. 2). Additionally, we do not find any significant difference between the two samples: a K-S test yields a -value of when comparing the aligned sample to the misaligned one. At fixed , a galaxy has a roughly equal chance of being aligned or misaligned. This suggests the probability that a galaxy is aligned or misaligned does not depend on the galaxy’s ellipticity.
4.6 Kinematic misalignment versus galaxy environment
We now investigate whether there exist any correlations between the amount of misalignment and the environmental properties described in Veale et al. (2017b): group membership, halo mass , large-scale density (the density field that surrounds the galaxy on Mpc scale), and local galaxy density (the luminosity density of galaxies in a sphere that contains the 10 nearest neighbor).
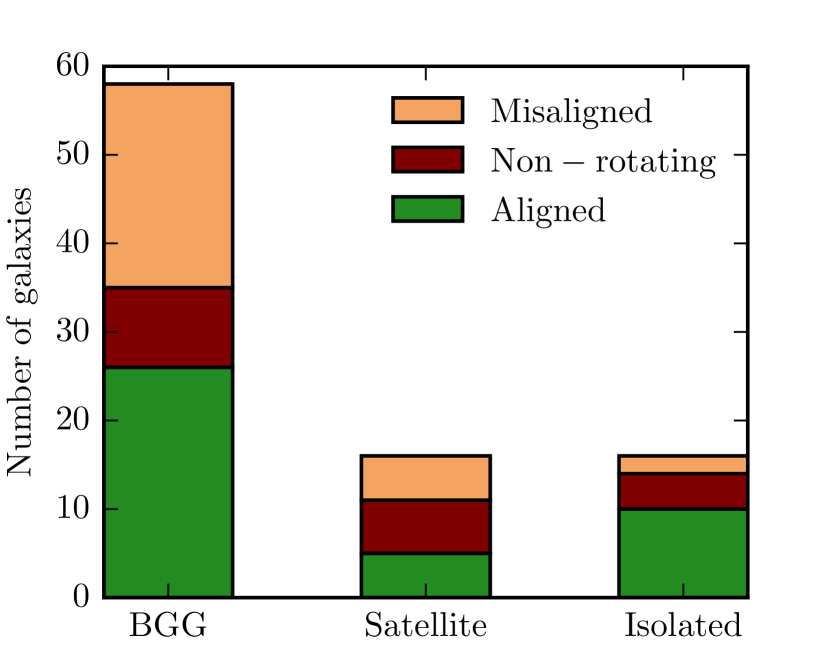
The results for group membership are shown in Fig. 3. We find that among the isolated galaxies, there are more aligned () than misaligned () galaxies. Among BGGs and satellites, the numbers of aligned and misaligned galaxies are comparable ( aligned versus misaligned galaxies among BGGs and aligned versus misaligned galaxies for satellites.) Previous studies of lower-mass galaxies have shown that environmental interactions lead to misalignment between the kinematic and photometric axes (Barrera-Ballesteros et al., 2014, 2015). They analysed isolated and interacting galaxies in the CALIFA survey with and found that isolated galaxies are much more likely to be aligned while interacting galaxies are roughly half aligned and half misaligned.
The misalignment results as a function of (left), (middle), and (right) are shown in Fig. 4. We find that the fraction of aligned galaxies is smaller in more dense environments, as quantified by both and . The strongest such trend is with the large-scale density (middle panel), where the fraction of aligned galaxies drops from to as increases. We do not find any significant trends between misalignment and halo mass.
Within the volume and mass range sampled by the ATLAS3D survey, no strong correlations between misalignment and environment were found (Krajnović et al., 2011). They did note that misaligned galaxies were predominantly found in environments with intermediate number densities. We have previously found that the primary driver of kinematic changes in local early-type galaxies is stellar mass rather than environment (Veale et al., 2017b, and references therein), it is therefore possible that mass is contributing to the trends between misalignment and environment.
5 Intrinsic shapes
We follow the method presented in Franx et al. (1991), as implemented by Foster et al. (2017), to infer the intrinsic shape of slow rotating MASSIVE galaxies. We assume that our galaxies can be approximated as simple ellipsoids with semi-major axes . This allows us to define the following axis ratios: and , such that . For oblate systems (), and may be referred to as the intrinsic disc circularity and intrinsic flattening, respectively. The technique relies on two observables (), which can be written in terms of the intrinsic kinematic misalignment (, the angle between the short axis and the angular momentum vector in 3D), the aforementioned intrinsic axis ratios ( and ) and the projection angles () as follows:
| (4) |
Exact equations can be found in Foster et al. (2017). For every galaxy, we have 2 observables and 5 variables.
Assuming that galaxies in the MASSIVE survey are randomly oriented on the sky, fitting for the whole population removes the dependency on and . We may solve the equations for a reasonable set of simplifying assumptions on the form of the axis ratio distributions and the distribution in intrinsic kinematic misalignments . We assume that all galaxies are drawn from a common distribution in intrinsic axis ratios. We assume a normal distribution for with mean and standard deviation , and a log-normal distribution for such that , with mean and standard deviation (Padilla & Strauss, 2008).
The final assumption is that the intrinsic kinematic misalignment depends solely on the intrinsic shape of the system. We assume that coincides with the viewing direction that generates a round apparent ellipticity. This is mathematically equivalent to:
| (5) |
where
| (6) |
is the triaxiality parameter defined in Franx et al. (1991). This implies in prolate systems, while requiring alignment (i.e. ) for oblate systems. Triaxial systems may take intermediate values of . We refer to appendix A of Weijmans et al. (2014) for a justification of this assumption.
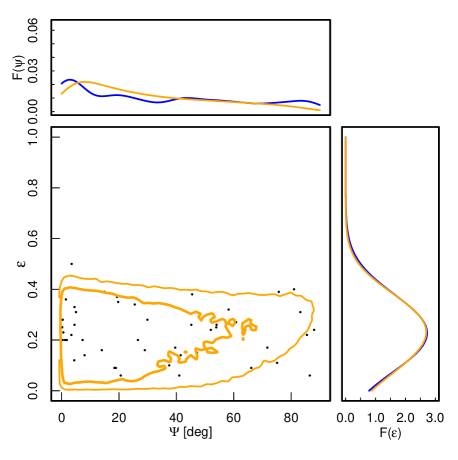

Fig. 5 shows the smoothed normalised distribution of the observables () and () for the MASSIVE slow rotators. We simultaneously fit the observed distributions by minimising the area between the observed and modelled distributions ( and ) using the following parameter:
| (7) |
as per Foster et al. (2017). The global minimum is efficiently found using the DEoptim R package, which is an implementation of the differential evolution optimisation algorithm (see Mullen et al., 2011, for more detail). After 200 iterations, the best fit parameters are , , , and , corresponding to . The intrinsic shape distribution of a mock galaxy sample drawn from the best-fitting log-normal and normal model distributions can be visualised in Fig. 6 along with comparable previous literature studies from the ATLAS3D (Weijmans et al., 2014) and SAMI surveys (Foster et al., 2017). The former was refitted with the same algorithm in Foster et al. (2017).
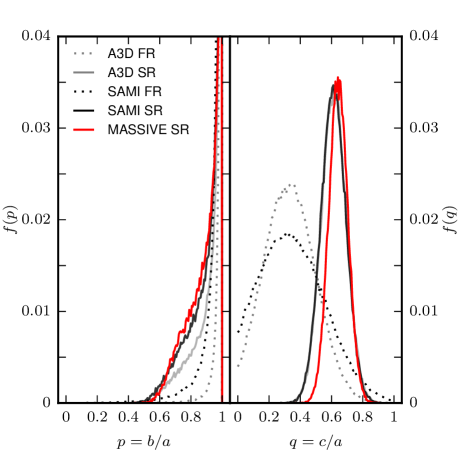
From Fig. 6 we see that the distribution of the axis ratio (with mean and median ) has a tail towards lower values, indicating that some of the MASSIVE slow rotators are triaxial. However, 56% of the galaxies have , and these are close to oblate, with an intrinsic flattening of .
Also visible in Fig. 6 is a similar behavior in the inferred intrinsic axis ratios distributions of MASSIVE , ATLAS3D (e.g., fig. 9 of Weijmans et al., 2014) and SAMI slow rotators (e.g., fig. 1 of Foster et al., 2017). Similar to these previous works, we find that the FR/SR difference is larger than differences between SRs from different surveys. However, each survey has different stellar mass distributions, so quantitatively determining whether the intrinsic shape distributions depend on within the slow rotator populations will require more careful analysis.
6 Local Kinematic features
The spatial profiles of the local kinematic position angle (measured with respect to the global PA) and circular velocity coefficient (defined in Eq. 3) are two main quantities that can be used to identify local kinematic features in galaxy velocity maps. For clarification, we note that while our alignment classification in Section 4 is based on the global PA and PA, there can be local kinematic variations (e.g., twists, distinct cores) about the global kinematic axis in either aligned or misaligned galaxies. The goal of this section is to examine these local features.
6.1 Radial profiles of and
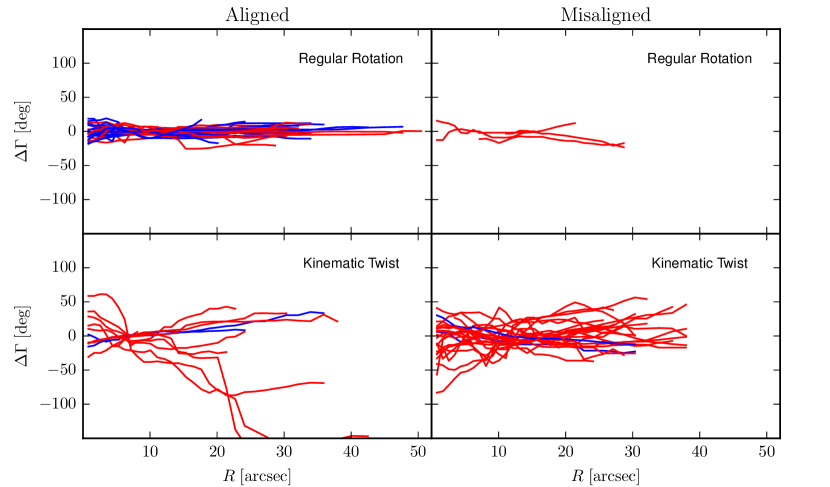
Fig. 7 shows the radial profile of the local kinematic position angle for the 41 aligned galaxies (left panels) and 30 misaligned galaxies (right panels) in our sample. The local kinematic features can be classified into one of the 3 following categories:
-
•
Regular rotation: Variations in are smooth and less than from PA across the entire map (top panels of Fig. 7).
- •
- •
While the majority of aligned galaxies shows regular rotation (upper left panel of Fig. 7) and the majority of misaligned galaxies shows kinematic twists (lower right panel), the correspondence is not one-to-one: 11 of the 41 globally aligned galaxies exhibit local kinematic twists (lower left panel), and 4 of the globally misaligned galaxies have regular rotation about their respective kinematic axis with minimal twists. Furthermore, we identify one aligned galaxy and one misaligned galaxy exhibiting KDCs. We will discuss more details of kinematic twists and KDCs in the next two subsections.
The outer parts of our velocity maps for 6 galaxies (NGC 0708, NGC 2258, NGC 2832, NGC 3562, NGC 3816, and NGC 6575) show systemic red or blue shifts while the inner regions show clear rotation. The velocity difference between the outer and inner parts is roughly 10, 20, , 30, 30, 75 km s-1, respectively. This systemic offset in the galaxy outskirts could be due to low S/N in the outer bins that would affect the pPXF recovered velocity or to a non-existent rotation in the outskirts which kinemetry is ill-suited to analyse. For these galaxies, we classify the kinematic features based on in the inner regions where clear rotation could be detected.
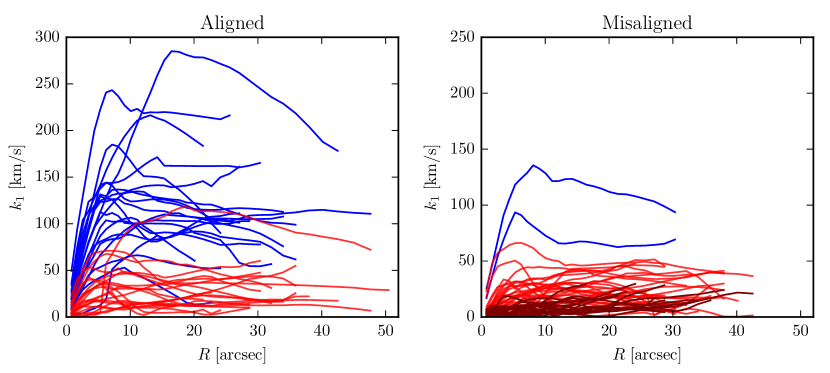
The radial profiles of the velocity coefficient are shown in Fig. 8. A typical in our sample rises in the inner and then either decreases or stays roughly constant. With a few exceptions, km s-1 is seen to separate fast (blue) from slow (red) rotators (defined by the spin parameter ), regardless of misalignment. All non-rotators (dark red) consistently populate the region with km s-1. The apparent outlier in Fig. 8 (left panel) is the slow rotator (NGC 6482) with rising to km s-1. NGC 6482 is nonetheless classified as a slow rotator because its high central values compensated for the high rotation speeds to lower the spin parameter to 0.14, which is at the high end of the distribution for slow rotators in our sample (see Fig. 6 of Veale et al. 2017b).
Table 4 summarizes the statistics of the kinematic features that we identified in the velocity maps. For comparison, Krajnović et al. (2011) defined 7 types of velocity features for the ATLAS sample, where the data was collected using the SAURON IFS with 0.9′′ lenses and a FOV. Since we have both a large FOV () and larger fibers ( diameter) than ATLAS, we can only identify kinematic features that occur on larger scales. For this reason, our kinematic categories are similar, but not identical to the corresponding ATLAS ones.
| Feature | Total No. | Aligned | Misaligned |
|---|---|---|---|
| Regular Rotation | 32 | 28 | 4 |
| Kinematic Twist | 36 | 11 | 25 |
| Kinematically Distinct | 2 | 1 | 1 |
| Components | |||
| No Rotation | 19 | - | - |
6.2 Kinematic Twists
We classify galaxies whose changes smoothly by more than from PAkin as displaying a kinematic twist (KT). We find more than twice as many cases of kinematic twists among the misaligned galaxies (25 misaligned versus 11 aligned), and the twists tend to have larger amplitudes (lower panels of Fig. 7). Out of the 30 misaligned galaxies, only 2 are classified as fast rotators (NGC 997 and NGC 6223), and both galaxies show local kinematic twists (blue curves in the lower right panel of Fig. 7). For NGC 997, twists by , and its PA () represents the rotation direction of a faster component within the first , while the outer parts rotate with a lower velocity and the kinematic axis is aligned with the photometric axis of (within the criterion described in Section 4). NGC 6223 shows a smooth twist of about over the entire map, while its PA agrees with the median .
Among the slow rotators, we find that many slow rotators show large twists of . Two examples are NGC 1129 and NGC 4874 for which Veale et al. (2017a) found misalignment between the photometric and kinematic axes. We can now quantify the amount of misalignment: NGC 1129 has PA and , while NGC 4874 has PA and is misaligned by . Since the profile of NGC 1129 shows a twist of across a limited radial range, it would seem that it exhibits a kinematically distinct inner component. However, because its and profiles do not show the drop and/or rise, respectively, indicative of multiple kinematic components, we classify NGC 1129 as having a kinematic twist. Meanwhile, NGC 4874 shows a kinematic twist of across the entire map, and like NGC 6223, its PA agrees with the median , reflecting the misalignment of the galaxy as a whole. Both galaxies also show significant twists in their photometric axis. Goullaud et al. (2018) found that PA of NGC 1129 has a large twist from in the inner part (which is very well aligned with the global kinematic axis) to in the outer part. The PA of NGC 4874 twists from to , making it misaligned with the kinematics at all radii.
Moody et al. (2014) analysed the properties of mock kinematic maps of remnants (comparable to ATLAS3D galaxies) in a set of multiple merger simulations of disc progenitors. They found that kinematic twists are more common ( of projections) in simulated multiple merger remnants (which resemble observed slow rotators) than in binary mergers which produce fast-rotating remnants ( of projections). For our sample of 90 galaxies, we also find that kinematic twists are more prevalent among slow rotators: of slow rotators have kinematic twists versus of fast rotators (corresponding to a -value of for a Fisher’s test). Since the simulated remnants and our MASSIVE galaxies probe different mass ranges, we do not expect exact quantitative agreement for the occurrence of kinematic twists in fast/slow rotators. However, the higher prevalence of kinematic twisting among our slow rotators is in agreement with the predictions of simulations.
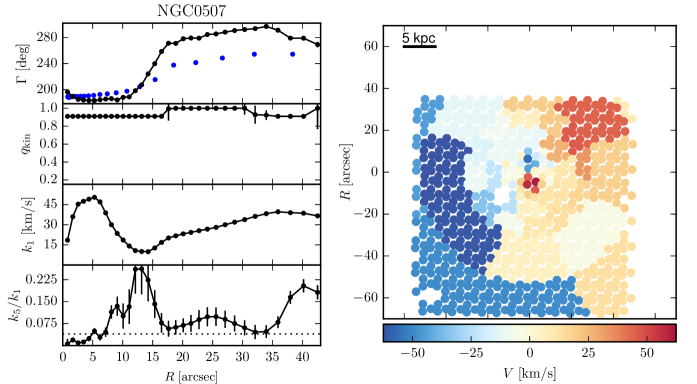
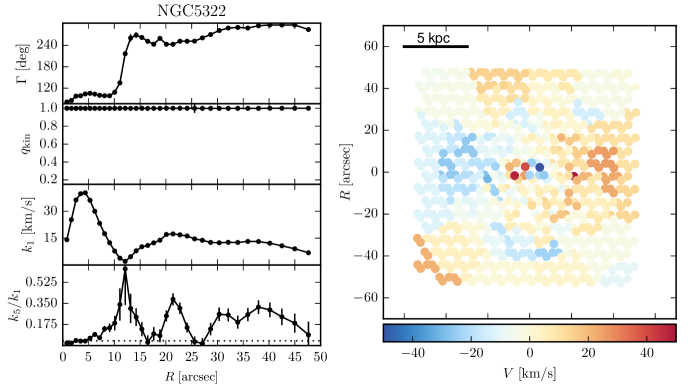
6.3 Kinematically Distinct Components in NGC 507 and NGC 5322
We find kinematically distinct components (KDC) in NGC 507 and NGC 5322. Both are slow rotators with km s-1 and below 0.1. The KDC of NGC 507 was reported in our earlier paper (Veale et al., 2017a). The KDC of NGC 5322 was reported in Bender (1988) based on long-slit observations and was observed as part of the ATLAS3D survey (Krajnović et al., 2011). NGC 5322 is one of the six ATLAS3D galaxies that are massive enough to be in the MASSIVE survey (Ma et al., 2014).
The velocity map and kinematic parameters for NGC 507 are shown in Fig. 9. The local kinematic position angle shows a large jump of between a radius of and . The inner kinematic component extends to and exhibits a disk-like rotation with km s-1 around a median PA of . The outer component rotates at km s-1 around a median PA of , and it shows a mild twist of around this outer axis. Our measurement of the global PA for NGC 507 is , which is close to the the rotation direction of the inner, higher-velocity component.
The global photometric PA for NGC 507 according to the NSA is , but our data for this galaxy from the Hubble Space Telescope (HST) Wide Field Camera 3 (WFC3; F110W filter) reveal a dramatic change of in PA (Goullaud et al., 2018) that roughly traces the kinematic changes out to ; see blue versus black points in top left panel of Fig. 9. Our measured misalignment angle for NGC 507 is , which is primarily due to the slight offset of between the photometric and kinematic PA in the inner component.
For the KDC in NGC 5322, Fig. 10 shows that the inner kinematic component extends up to radius and is rotating at km s-1around a median PA of . The outer kinematic component is counter-rotating with a lower speed in almost exactly the opposite direction (median PA of ) as the inner component. Similar features for the inner were also reported in Krajnović et al. (2011). The rotation axis for both components is aligned with the photometric axis (PA from NSA) and the misalignment angle is , so this galaxy is classified as aligned. Our HST WFC3 data for NGC 5322 shows a constant PA of identical value as the NSA out to (Goullaud et al., 2018).
We note that the Mitchell IFS used for our MASSIVE survey has both a larger FOV ( vs. ) and a larger fiber/lens size ( vs. ) than the SAURON IFS used for the ATLAS survey. We can therefore only resolve kinematic features above , such as the KDCs in NGC 507 and NGC 5322 that occur over a large radial extent of . Many KDCs in the ATLAS survey occur on smaller scales and in slow rotators (Krajnović et al., 2011). It is therefore possible that more MASSIVE galaxies have KDCs below the resolution scale of the Mitchell IFS. On a similar note, NGC 4472 is classified by Krajnović et al. (2011) as a KDC with the inner component rotating in the opposite direction of the outer component. Given the small radial extent of the KDC, it is unlikely that we could have resolved the KDC even if we had the necessary data to produce unfolded maps. We will report central kinematic features in a subset of MASSIVE galaxies observed with an IFS with lenslets in a subsequent paper (Ene et al. in preparation).
7 Conclusions
In this paper we have studied the stellar velocity features of 90 early-type galaxies in the volume-limited MASSIVE survey, with mag and . Our velocity map for each galaxy is constructed from closely-packed fiber spectra from the Mitchell IFS (with 3 ditherings) at the McDonald Observatory. The FOV of the IFS provides kinematic maps beyond two effective radii for many galaxies in our sample.
We use the kinemetry method of Krajnović et al. (2006) to identify the average kinematic axis (PA) for each galaxy in our sample (Section 3) and to measure the global misalignment angle between this axis and the photometric axis (Section 4). We further identify detailed local kinematic features such as twists and distinct cores (Section 6).
Our main findings are:
-
•
19 of the 90 galaxies (21%) are non-rotators that have no detectable rotation or identifiable kinematic axis. For the other 71 galaxies, 22 are fast rotators (with spin parameter ) and 49 are slow rotators.
-
•
41 of the 71 rotating galaxies show good alignment between the photometric and kinematic axes (), while 30 galaxies are misaligned (). Only 2 of the 22 fast rotators (9%) show misalignment, while by contrast, 28 of the 49 slow rotators (57%) are misaligned with a nearly flat distribution of out to (Fig. 1).
-
•
We find 11 galaxies to have large misalignment angle (), 7 of which have and are rotating around the photometric major axis rather than the more typical minor axis (Section 4.3).
-
•
We find a strong trend of increasing fraction of aligned galaxies with increasing spin parameter, from in the lowest spin bin to in the highest spin bin (Section 4.4 and Fig. 2). We also find that kinematic misalignment likely does not depend on stellar mass, the fraction of misaligned galaxies at higher mass is not significantly higher than at lower mass. The fraction of aligned galaxies does not depend on ellipticity (Section 4.5).
-
•
The fraction of galaxies with aligned kinematic and photometric axes is smaller in denser galaxy environments, as measured by large-scale galaxy density and local galaxy density (Fig. 4). The strongest trend is with , where the fraction of aligned galaxies drops from to as increases. As a function of group membership, we find similar numbers of aligned and misaligned galaxies among BGGs and satellite galaxies (Fig. 3). But for isolated galaxies, we find 10 aligned ()and only 2 misaligned () galaxies. This is consistent with the idea that environmental interactions can be a potential cause of misalignment.
-
•
We use the kinematic misalignment and ellipticity distributions to infer the intrinsic shape distribution of our sample (Section 5). For MASSIVE slow rotators, the mean axis ratios are and , consistent with being mildly triaxial (Fig. 6). The inferred axis ratio distributions have similar trends as those of ATLAS and SAMI galaxies, however, a more careful analysis is required to determine whether the intrinsic shape distributions depend on stellar mass.
-
•
45% of the 71 rotating galaxies exhibit regular rotation in which the local kinematic position angle, , varies by less than across the entire velocity map, while 51% show twisting of the kinematic axis with varying by more than (Section 6 and Fig. 7). Most of the regular rotators are aligned (on average), and most of the local twisters are misaligned (on average), but the correspondence is not one-to-one (off-diagonal panels in Fig. 7). We identified kinematically distinct components in NGC 507 and NGC 5322 (Section 6.3 and Figs. 9 and 10).
We have shown in this paper that the remarkable near alignment of the photometric and kinematic axes found in lower-mass early-type galaxies in the ATLAS survey does not extend to higher-mass early-type galaxies. The fast rotators in the MASSIVE survey are indeed very well aligned, consistent with the expectation that they have oblate shapes and rotate around the photometric minor axis. Unlike ATLAS, however, the majority of the galaxies in our sample are slow rotators, among which 57% are misaligned with evenly distributed from to . This flat distribution can be produced by a population of intrinsically (mildly) triaxial galaxies.
In the context of galaxy formation, the high frequency of kinematic misalignment and the broad distribution of the misalignment angle of slow rotators reported in this paper support the notion that major gas-poor mergers are a primary formation process leading to mildly triaxial shapes in massive early-type galaxies. Our study demonstrates the importance of using volume-limited samples with well-defined galaxy mass range when making inferences about the properties or formation history of early-type galaxies.
Acknowledgements
We thank Marijn Franx for enlightening discussions. The MASSIVE survey is supported in part by NSF AST-1411945, NSF AST-1411642, HST-GO-14210, and HST-AR-14573. Part of this research was conducted by the Australian Research Council Centre of Excellence for All Sky Astrophysics in 3 Dimensions (ASTRO 3D), through project number CE170100013.
References
- Barrera-Ballesteros et al. (2014) Barrera-Ballesteros J. K., et al., 2014, A&A, 568, A70
- Barrera-Ballesteros et al. (2015) Barrera-Ballesteros J. K., et al., 2015, A&A, 582, A21
- Bender (1988) Bender R., 1988, A&A, 202, L5
- Binney (1978) Binney J., 1978, MNRAS, 183, 501
- Binney (1985) Binney J., 1985, MNRAS, 212, 767
- Binney (2005) Binney J., 2005, MNRAS, 363, 937
- Boylan-Kolchin et al. (2005) Boylan-Kolchin M., Ma C.-P., Quataert E., 2005, MNRAS, 362, 184
- Boylan-Kolchin et al. (2006) Boylan-Kolchin M., Ma C.-P., Quataert E., 2006, MNRAS, 369, 1081
- Brodie et al. (2014) Brodie J. P., et al., 2014, ApJ, 796, 52
- Brough et al. (2011) Brough S., Tran K.-V., Sharp R. G., von der Linden A., Couch W. J., 2011, MNRAS, 414, L80
- Brough et al. (2017) Brough S., et al., 2017, ApJ, 844, 59
- Bundy et al. (2015) Bundy K., et al., 2015, ApJ, 798, 7
- Cappellari (2016) Cappellari M., 2016, ARA&A, 54, 597
- Cappellari & Emsellem (2004) Cappellari M., Emsellem E., 2004, PASP, 116, 138
- Cappellari et al. (2011) Cappellari M., et al., 2011, MNRAS, 413, 813
- Coccato et al. (2009) Coccato L., et al., 2009, MNRAS, 394, 1249
- Cortesi et al. (2013) Cortesi A., et al., 2013, A&A, 549, A115
- Cox et al. (2006) Cox T. J., Dutta S. N., Di Matteo T., Hernquist L., Hopkins P. F., Robertson B., Springel V., 2006, ApJ, 650, 791
- Croom et al. (2012) Croom S. M., et al., 2012, MNRAS, 421, 872
- Davies & Birkinshaw (1986) Davies R. L., Birkinshaw M., 1986, ApJ, 303, L45
- Davies & Birkinshaw (1988) Davies R. L., Birkinshaw M., 1988, ApJS, 68, 409
- Ebrová & Łokas (2017) Ebrová I., Łokas E. L., 2017, ApJ, 850, 144
- Emsellem et al. (2004) Emsellem E., et al., 2004, MNRAS, 352, 721
- Emsellem et al. (2007) Emsellem E., et al., 2007, MNRAS, 379, 401
- Emsellem et al. (2011) Emsellem E., et al., 2011, MNRAS, 414, 888
- Fogarty et al. (2015) Fogarty L. M. R., et al., 2015, MNRAS, 454, 2050
- Foster et al. (2017) Foster C., et al., 2017, MNRAS, 472, 966
- Franx & Illingworth (1988) Franx M., Illingworth G. D., 1988, ApJ, 327, L55
- Franx et al. (1989) Franx M., Illingworth G., Heckman T., 1989, ApJ, 344, 613
- Franx et al. (1991) Franx M., Illingworth G., de Zeeuw T., 1991, ApJ, 383, 112
- Goullaud et al. (2018) Goullaud C. F., Jensen J. B., Blakeslee J. P., Ma C.-P., Greene J. E., Thomas J., 2018, ApJ, 856, 11
- Hill et al. (2008) Hill G. J., et al., 2008, in Society of Photo-Optical Instrumentation Engineers (SPIE) Conference Series. , doi:10.1117/12.790235
- Jarrett et al. (2000) Jarrett T. H., Chester T., Cutri R., Schneider S., Skrutskie M., Huchra J. P., 2000, AJ, 119, 2498
- Jedrzejewski & Schechter (1989) Jedrzejewski R., Schechter P. L., 1989, AJ, 98, 147
- Jesseit et al. (2009) Jesseit R., Cappellari M., Naab T., Emsellem E., Burkert A., 2009, MNRAS, 397, 1202
- Jimmy et al. (2013) Jimmy Tran K.-V., Brough S., Gebhardt K., von der Linden A., Couch W. J., Sharp R., 2013, ApJ, 778, 171
- Krajnović et al. (2006) Krajnović D., Cappellari M., de Zeeuw P. T., Copin Y., 2006, MNRAS, 366, 787
- Krajnović et al. (2011) Krajnović D., et al., 2011, MNRAS, 414, 2923
- Krajnović et al. (2018) Krajnović D., Emsellem E., den Brok M., Marino R. A., Schmidt K. B., Steinmetz M., Weilbacher P. M., 2018, MNRAS, 477, 5327
- Li et al. (2018) Li H., Mao S., Emsellem E., Xu D., Springel V., Krajnović D., 2018, MNRAS, 473, 1489
- Ma et al. (2014) Ma C.-P., Greene J. E., McConnell N., Janish R., Blakeslee J. P., Thomas J., Murphy J. D., 2014, ApJ, 795, 158
- Moody et al. (2014) Moody C. E., Romanowsky A. J., Cox T. J., Novak G. S., Primack J. R., 2014, MNRAS, 444, 1475
- Mullen et al. (2011) Mullen K. M., Ardia D., Gil D. L., Windover D., Cline J., 2011, Journal of Statistical Software, 40
- Naab & Burkert (2003) Naab T., Burkert A., 2003, ApJ, 597, 893
- Padilla & Strauss (2008) Padilla N. D., Strauss M. A., 2008, MNRAS, 388, 1321
- Pandya et al. (2017) Pandya V., et al., 2017, ApJ, 837, 40
- Pulsoni et al. (2017) Pulsoni C., et al., 2017, preprint, p. arXiv:1712.05833 (arXiv:1712.05833)
- Raskutti et al. (2014) Raskutti S., Greene J. E., Murphy J. D., 2014, ApJ, 786, 23
- Sánchez et al. (2012) Sánchez S. F., et al., 2012, A&A, 538, A8
- Schechter & Gunn (1979) Schechter P. L., Gunn J. E., 1979, ApJ, 229, 472
- Skrutskie et al. (2006) Skrutskie M. F., et al., 2006, AJ, 131, 1163
- Tsatsi et al. (2017) Tsatsi A., Lyubenova M., van de Ven G., Chang J., Aguerri J. A. L., Falcón-Barroso J., Macciò A. V., 2017, A&A, 606, A62
- Veale et al. (2017a) Veale M., et al., 2017a, MNRAS, 464, 356
- Veale et al. (2017b) Veale M., Ma C.-P., Greene J. E., Thomas J., Blakeslee J. P., McConnell N., Walsh J. L., Ito J., 2017b, MNRAS, 471, 1428
- Veale et al. (2018) Veale M., Ma C.-P., Greene J. E., Thomas J., Blakeslee J. P., Walsh J. L., Ito J., 2018, MNRAS, 473, 5446
- Wagner et al. (1988) Wagner S. J., Bender R., Moellenhoff C., 1988, A&A, 195, L5
- Walcher et al. (2014) Walcher C. J., et al., 2014, A&A, 569, A1
- Weijmans et al. (2014) Weijmans A.-M., et al., 2014, MNRAS, 444, 3340
Appendix A Kinemetry results and 2D velocity maps for galaxies with kinematically distinct components
Appendix B Kinematic versus photometric axis of individual MASSIVE galaxies