Lattice dynamics of Sb2O6 ( Cu, Co) with trirutile structure
Abstract
Raman spectroscopy experiments on single crystals of CuSb2O6 and CoSb2O6 quasi-one-dimensional antiferromagnets with trirutile crystal structure were performed, with a focus on the first material. The observed Raman-active phonon modes and previously reported infrared-active modes were identified with the aid of ab-initio lattice dynamics calculations. The structural transition between monoclinic -CuSb2O6 and tetragonal -CuSb2O6 phases at K is manifested in our spectra by a “repulsion” of two accidentally quasi-degenerate symmetric modes below , caused by a phonon mixing effect that is only operative in the monoclinic -CuSb2O6 phase due to symmetry restrictions. Also, two specific phonons, associated with CuO6 octahedra rotation and with a Jahn-Teller elongation mode, soften and broaden appreciably as . A crossover from a displacive to an order-disorder transition at is inferred.
pacs:
78.30.-j, 63.20.D-, 64.60.Cn, 63.20.kgI Introduction
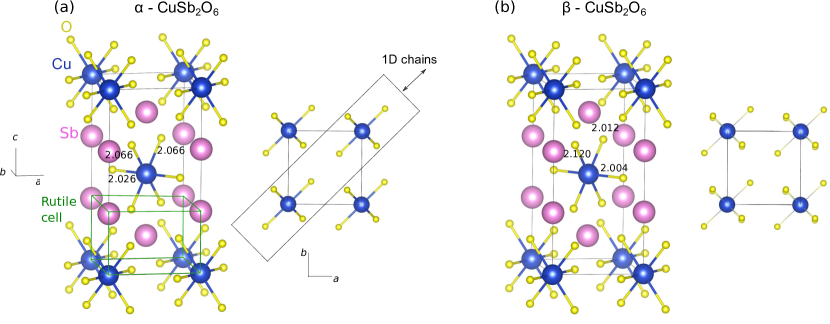
Low dimensional magnetic systems have attracted continuous interest due to their enhanced quantum fluctuation effects. Nearly ideal one-dimensional (1D) or 2D magnetic behavior may be experimentally attained in crystalline materials that show dominant exchange interactions along a specific direction or within a plane. Examples of quasi-1D magnetism are found in materials that crystallize in the trirutile structure with chemical formula O6 (=magnetic, =non-magnetic cations). This structure is derived from the TiO2 rutile structure by allowing distinct and metallic sites and triplicating the unit cell along the direction (see Fig. 1). Perhaps the most studied material of this class is the spin- quantum spin chain CuSb2O6.Donaldson ; Nakua ; Nakua2 ; Yamagushi ; Giere ; Kato ; Koo ; Kato2 ; Prokofiev ; Heinrich ; Torgashev ; Gibson ; Wheeler ; Kasinathan ; Rebello ; Christian ; Prasai ; Herak In this material, the Cu2+ spins show a 3D magnetic order below K. The magnetic susceptibility curve has a broad maximum at about 60 K, being well modelled by a 1D Bonner and Fisher modelBonner with an Heisenberg exchange coupling strength K between spins.Nakua ; Yamagushi ; Kato ; Kato2 ; Prokofiev ; Heinrich ; Torgashev ; Gibson ; Rebello This value of has been associated with antiferromagnetic Cu-O-O-Cu superexchange interactions along the [1 1 0] and [1 -1 0] directions for Cu ions at and , respectively [see Fig. 1(a)], while the interchain exchange interactions are estimated to be at least two orders of magnitude weaker.Nakua ; Kasinathan Another representative material of this class is CoSb2O6 with K and a maximum at K in the magnetic susceptibility curve,Christian ; Reimers ; Kato ; Christian2 also indicating low-dimensional magnetic correlations above . While an early report stated that these data are consistent with the anisotropic square planar Ising model, more recent studies rather indicate the presence of 1D Ising chains of Co2+ spins for CoSb2O6 (Refs. Christian, ; Christian2, ), with the intrachain exchange constant K being substantially smaller than in CuSb2O6.
The overall magnetic behavior of materials are often determined by details of their crystal structure. CuSb2O6 shows a structural phase transition at K Donaldson ; Giere ; Heinrich between tetragonal [-CuSb2O6, space group , see Fig. 1(a)]Giere and monoclinic [-CuSb2O6, space group , see Fig. 1(b)]Nakua structural variants. The high-temperature -CuSb2O6 phase shows slightly compressed CuO6 octahedra along the 1D chain direction,Giere while the -CuSb2O6 phase shows elongated octahedra, with the elongation axis being nearly perpendicular to the 1D magnetic chains (see Fig. 1). Other similar compounds with Jahn-Teller active ions, such as CrTa2O6 (Ref. Saes, ) and CuTa2O6 (Ref. Golubev, ) also exhibit analogous monoclinic distortions. Besides the Jahn-Teller distortion, the monoclinic phase of CuSb2O6 exhibits a subtle rotation of the CuO6 octahedra (see right pannel of Fig. 1(b)], which contributes to relax the lattice strain. The structural transition at is reported to be of second-order.Donaldson ; Giere ; Heinrich CoSb2O6, on the other hand, crystallizes in a tetragonal lattice with no structural phase transition between 4 and 300 K.Donaldson ; Reimers
Vibrational spectroscopies including Raman scattering and infrared absorption are powerful tools to investigate structural, electronic and magnetic phase transitions, since lattice vibrations may be sensitive to slight electronic and structural modifications, also sensing magnetic correlations through the spin-phonon coupling mechanism.Granado For CuSb2O6 in particular, the 3D magnetic transition at has been suggested to be associated with a spin-Peierls transition occurring as a result of three-dimensional phonons coupling with Jordan-Wigner-transformed fermions,Rebello and thermal conductivity reveals strong phonon-spin resonant scattering,Prasai reinforcing the need for detailed investigations of the vibrational properties of this and other materials with trirutile structure. An important step towards this direction is to achieve a reliable identification of the corresponding normal modes of vibration. This is a challenging task, considering that this structure, with 18 atoms per unit cell, allows for 54 vibrational degrees of freedom. This issue was originally addressed by Husson, Repelin and BrussetHusson and Haeuseler,Haeuseler however the mode frequencies and mechanical representations are highly dependent on the model and on the chosen values of force fields, leading to considerable ambiguity in the mode assignment. This ambiguity was reduced but not fully eliminated by a more recent group theoretical treatment that related the normal modes of the trirutile structure with those of the simpler rutile one.Torgashev
Despite the challenges in assigning the observed vibrational modes, Raman and infrared spectroscopies have been continuously employed to investigate trirutile-like materials.White ; Franck ; Husson ; Haeuseler ; Giere ; Torgashev ; Bonilla ; Golubev Temperature-dependent Raman spectra of CuSb2O6 showed an evolution of a peak at 645 cm-1 at K () into two peaks, at 639 and 672 cm-1, at K (),Giere which, supported by the mode assignment of Ref. Husson, , was ascribed to a degenerate mode of the tetragonal phase being splitted in two separate modes in -CuSb2O6. Remarkably, such mode splitting at was not observed in the related material CuTa2O6.Golubev An infrared absorption study showed an agreement between the number of predicted and observed phonon modes for -CuSb2O6, also reporting noticeable anomalies for some phonons around K that are presumably associated with the presence of magnetic correlations.Torgashev
Structural phase transitions have been widely investigated by vibrational spectroscopies, and may be classified either as displacive type, with at least one associated soft mode with frequency as (Ref. Cochran, ), or order-disorder type, with large broadening of some phonon peaks.GranadoJT Cases with a crossover between displacive and order-disorder types were also reported.Bruce ; Muller Structural transitions associated with Jahn-Teller active ions are expected to be of order-disorder character if the Jahn-Teller energy level splitting is much larger than the stiffness parameter that orients the distortion from site to site,Millis leading to local, non-cooperative Jahn-Teller distortions above such as in LaMnO3.GranadoJT ; EXAFSJT On the other hand, when the Jahn-Teller level splitting is relatively small, the structural phase transition may be of displacive type with the presence of a soft Jahn-Teller mode.Srinivasan For the specific case of CuSb2O6, the relatively small Jahn-Teller distortion of the CuO6 octahedra [see Fig. 1(b)] is presumably associated with a small separation between the and orbital levels,Kasinathan and the order-disorder or displacive character or the structural phase transition remains to be determined.
In this work, we report temperature-dependent Raman scattering data on single crystalline samples of CuSb2O6 and CoSb2O6, complemented by ab-initio lattice dynamics calculations. The Raman-active modes observed in this work and the infrared-active modes reported in Ref. Torgashev, are identified and the corresponding mechanical representations are obtained. The Jahn-Teller transition of CuSb2O6 is also investigated in detail. Two Raman-active modes, associated with CuO6 octahedra rotation and with a Jahn-Teller elongation mode, soften appreciably as from below, indicating an incipient behavior characteristic of a displacive phase transition. However, this displacive mechanism is truncated by a strong phonon damping, signaling a crossover to an order-disorder transition at . This transition is also manifested in our data by a remarkably large phonon mixing effect that occurs in the spectral region cm-1 in the monoclinic -CuSb2O6 phase. The phonon assignment and investigation of the structural transition of CuSb2O6 achieved in this work pave the way for future studies on the effect of magnetic order and correlations on the vibrational spectra of materials with trirutile structure.
II Experimental and Calculation details
The CuSb2O6 and CoSb2O6 crystals employed in this work were grown by chemical vapor transport as described elsewhere.Prokofiev ; Rebello The single crystals were oriented using Laue x-ray diffraction. Naturally grown ab- and ac- surfaces were employed in our Raman investigations on CuSb2O6 and CoSb2O6, respectively, with surface areas of the order of mm2. The Raman spectra for CuSb2O6 and CoSb2O6 were taken in quasi-backscattering geometry using the 488.0 and 514.5 nm lines, respectively, of an Ar+ laser as the exciting source, except where otherwise noted. The laser beam, with power below mW, was focused into a spot of m diameter. The crystals were mounted on the cold finger of closed-cycle He cryostat with a base temperature of 20 K. A triple 1800 mm-1 grating spectrometer equipped with a N2-cooled multichannel CCD detector was employed. The polarized data are represented in Porto’s notation , where and indicate the electric field polarizations of the incident and scattered light, respectively, and and indicate the propagation directions of the incident and scattered light, respectively.
Our normal mode assignments and the corresponding mechanical representations were supported by -initio lattice dynamics calculations that were made using the PHonon package of the Quantum Espresso suite.QE The calculations were carried out within the Density-Functional Perturbation Theory with the Perdew, Burke, and Enzerhof (PBE) Generalized Gradient Approximation (GGA) for the exchange-correlation potentialPerdew and the projetor augmented wave (PAW) method.Kresse ; pseudopotentials The energy cuttoffs for the wavefunctions and charge density were 40 and 200 Ry, respectively, and a grid for the reciprocal space was employed. The mechanical representations of the lattice vibrations were drawn using the program XCrySDen,xcrysden while Fig. 1 was prepared with the aid of the software VESTA.VESTA
III Phonon Symmetry Analysis and First Principles Lattice Dynamics Calculations
| Atom | Wyckoff | -point phonon modes |
| position | ||
| Cu | ++ | |
| Sb | +++++ | |
| O(1) | +++++++ | |
| O(2) | +++++++ | |
| +++ | ||
| Classification: | ||
| =+++ | ||
| =+ | ||
| =+++ | ||
| =+ | ||
| Raman tensors: | ||
| , | ||
| Atom | Wyckoff | -point phonon modes |
|---|---|---|
| position | ||
| Cu | + | |
| Sb | +++ | |
| O(1) | +++ | |
| O(2) | +++ | |
| O(3) | +++ | |
| Classification: | ||
| =+ | ||
| =+ | ||
| =+ | ||
| Raman tensors: | ||
| , | ||
| Tetragonal | Monoclinic | |||
|---|---|---|---|---|
| Symmetry | Activity | Symmetry | Activity | |
| Raman | Raman | |||
| Silent | IR | |||
| Silent | Raman | |||
| IR | IR | |||
| Raman | Raman | |||
| Silent | IR | |||
| Raman | Raman | |||
| Silent | IR | |||
| Raman | + | Raman | ||
| IR | + | IR | ||
| CuSb2O6 | CuSb2O6 | CuSb2O6 | CuSb2O6 | CoSb2O6 | ||
|---|---|---|---|---|---|---|
| Assignment | Assignment | Calcul. (cm-1) | Calcul. (cm-1) | Observ. (cm-1) | Observ. (cm-1) | Observ. (cm-1) |
| non-relaxed | relaxed | K | K | K | ||
| imaginary | 110 | 73 | 98 | |||
| 84 | 86 | 113 | ||||
| 171 | 188 | 226 | ||||
| (S) | 216 | 228 | ||||
| 246 | 218 | 236 | 240 | |||
| 260 | 241 | 284, 286 | 277 | |||
| 284 | 290 | 313 | 318 | |||
| 300 | 271 | 309 | 312 | 310 | ||
| (S) | 357 | 340 | ||||
| 413 | 374 | 432 | 445 | |||
| 503 | 456 | 507 | 501 | 521 | ||
| 506 | 470 | 585 | 585 | |||
| 605 | 498 | 557 | 552 | |||
| 671 | 567 | 644 | 627 | 656 | ||
| 688 | 588 | 700 | ||||
| 723 | 585 | |||||
| 744 | 624 | 721 | 730 | 725 | ||
| 843 | 703 | 816 | 831 |
| CuSb2O6 | CuSb2O6 | CuSb2O6 | CuSb2O6 | ||
| Assignment | Assignment | Calcul. (cm-1) | Calcul. (cm-1) | Observ. (cm-1) | Observ. (cm-1) |
| non-relaxed | relaxed | K | K | ||
| Ref. Torgashev, | Ref. Torgashev, | ||||
| (acoustic) | |||||
| (acoustic) | |||||
| 110 | 57 | ||||
| (S) | 112 | 162 | 169.48 | 171.17 | |
| (S) | 155 | 148 | 177.30 | 177.92 | |
| 197 | 166 | ||||
| 213 | 216 | () | |||
| 254 | 242 | ||||
| (S) | 258 | 234 | 238.05 | ||
| 262 | 245 | 259.70 | 259.10 | ||
| 292 | 275 | ||||
| (S) | 334 | 313 | 325.67 | ||
| 483 | 424 | 547.00 | 547.00 | ||
| 491 | 443 | ||||
| (S) | 505 | 456 | 315.24 | 315.29 | |
| 593 | 525 | ||||
| 650 | 550 | 591.50 | 591.50 | ||
| (S) | 679 | 563 | 653.94 | 654.64 | |
| 730 | 597 | ||||
| (S) | 745 | 624 | 715.11 | 707.31 | |
| 836 | 700 | 842.00 | 832.47 |
Both the tetragonal (space group ) and monoclinic (space group ) variants of the trirutile structure present two chemical formulas per unit cell. The irreducible representations of the -point phonon modes as well as the corresponding Raman tensors for the tetragonal and monoclinic phases are listed in Tables 1 and 2, respectively. The correlation between the modes in the tetragonal and monoclinic phases are shown in Table 3. In total, 16 Raman-active modes are predicted for the tetragonal phase (+++), while 24 Raman modes are expected for the monoclinic structure (+). The higher number of Raman-active modes in the monoclinic phase arise from the splitting of the modes into + modes and also from the fact that the two silent modes of the tetragonal phase become Raman-active modes after the monoclinic distortion.
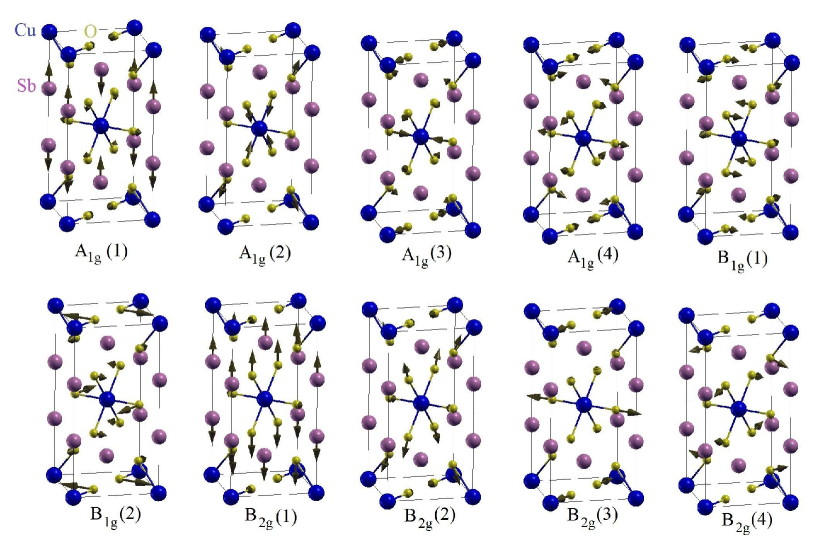
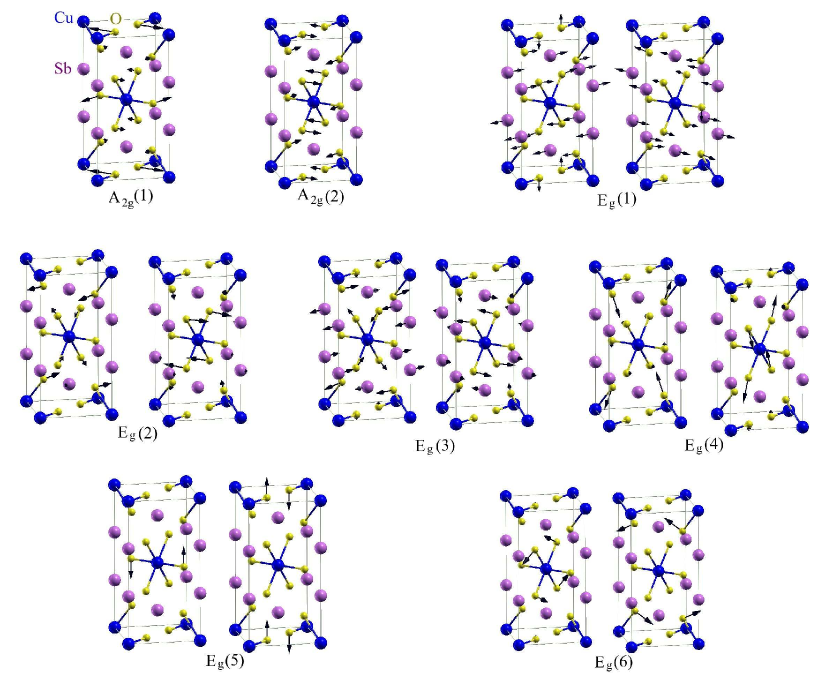
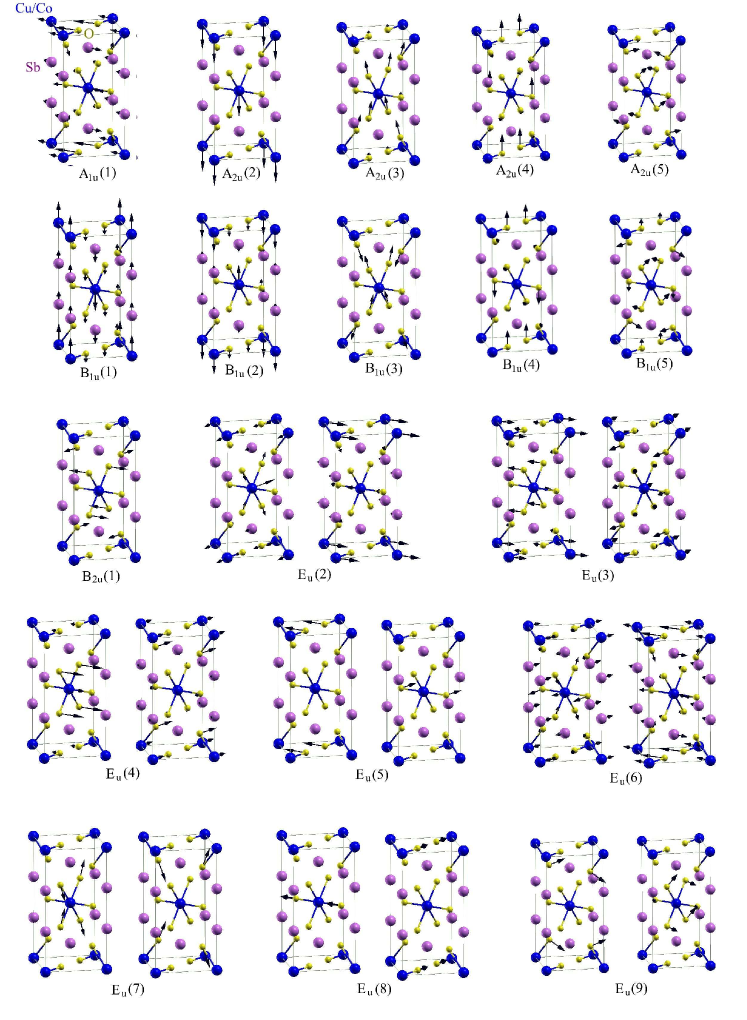
Ab-initio lattice dynamics calculations were performed for the tetragonal phase of CuSb2O6, following two independent procedures: (i) the experimental lattice parameters and atomic positions reported in Ref. Giere, were employed as inputs for the calculation; and (ii) a relaxation of the atomic positions and lattice parameters was performed prior to the lattice dynamics calculation to reach the minimal total energy. Tables 4 and 5 show the frequencies of the even (gerade) and odd (ungerade) modes, respectively, calculated using both procedures, and the corresponding symmetries for the tetragonal and monoclinic space groups. The mechanical representations of these modes are shown in Figs. 2, 3, and 4. An assignment of the previously reported infrared-active modes at 5 and 300 K Torgashev according to our lattice dynamics calculations is also given in Table 5.
IV Experimental Results and Analysis
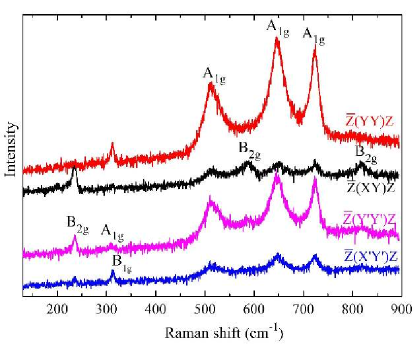
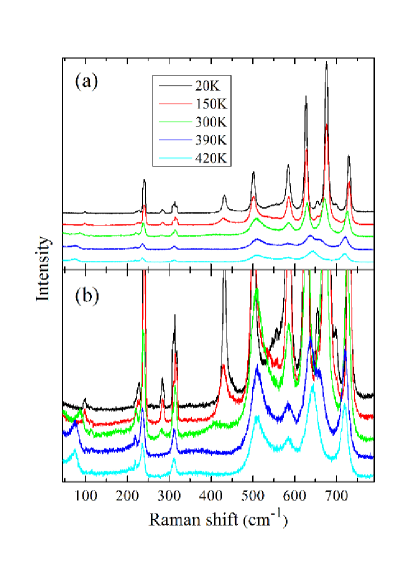
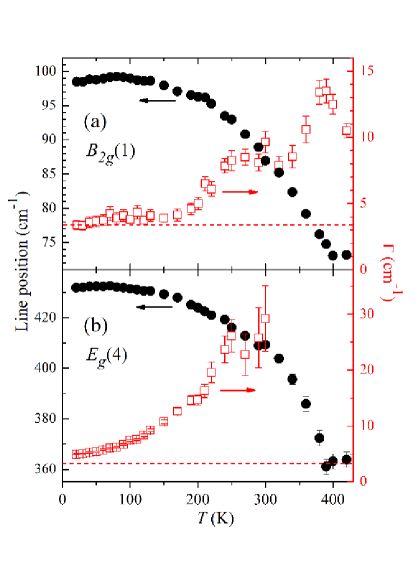
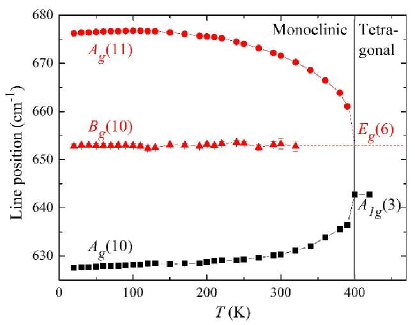
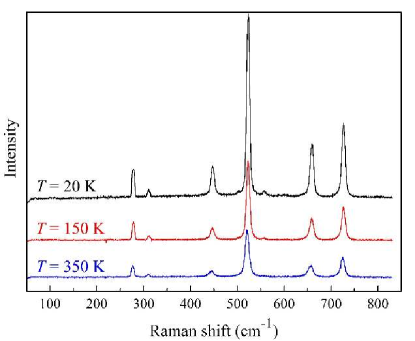
Figure 5 shows the linearly polarized Raman spectra of tetragonal CuSb2O6 at K. Three modes, at 507, 644, and 721 cm-1, are identified for their strong intensities in and polarizations. In addition, a mode is observed in and polarizations at 313 cm-1 [], next to a weaker mode at 309 cm-1. Finally, three modes were observed at 236, 585, and 816 cm-1. Residual intensities of the strong modes were also observed in the forbidden and polarizations. This partial depolarization effect is ascribed to a slight deviation of our experimental geometry with respect to the ideal backscattering geometry (), allied with a possible birefringence of the sample.
Figures 6(a) and 6(b) show unpolarized Raman spectra of CuSb2O6 at selected temperatures. At low temperatures, additional Raman peaks are detected at 113, 226, 284, 286, 432, 557, 653, 676, and 700 cm-1. The assignments of all observed modes at the tetragonal and monoclinic phases of CuSb2O6, supported by a comparison to the results of our ab-initio lattice dynamics calculations, are given in Table 4. The extra modes at 113, 226, 284, 286, 432, 557, 653 and 676 cm-1 are monoclinic and/or modes derived from tetragonal modes that are not observed in the ab-plane quasi-backscattering geometry of this experiment in the high-symmetry phase, and the 700 cm-1 peak is ascribed to a mode derived from a weak tetragonal mode that is not observed at high temperatures within our sensitivity. Finally, the mode at 73 cm-1 at K (98 cm-1 at K) is ascribed to a () mode in the tetragonal (monoclinic) phase.
Figures 7(a) and 7(b) show the temperature-dependence of the peak positions of the and modes (tetragonal cell), associated with rotations around the axis and Jahn-Teller-like elongations, respectively, of the CuO6 octahedra (see also Figs. 2 and 3). The structural transition is clearly manifested by remarkable softenings of 26% and 17%, respectively, of these modes on warming up to K, indicating these would be the soft modes of the transition. Nonetheless, we emphasize that these modes do not freeze () as as would be expected for a classical soft mode behavior.Cochran The linewidth of the mode is resolution-limited at low temperatures ( cm, broadens to cm-1 between 250 and 350 K, and reaches its maximum value cm-1 near [see Fig. 7(a)]. We should mention that, although the mode is forbidden for ab-plane scattering, a residual intensity is still observed in the tetragonal phase [see Fig. 6(b)], which was sufficient to determine its peak position in the whole investigated temperature interval. Nonetheless, the reliable determination of for this mode could only be obtained up to K, showing a qualitatively similar behavior with respect to the mode [see Fig. 7(b)].
The structural phase transition at is also manifested by large spectral changes at the spectral region cm-1, consistent with a previous report.Giere Above , a single mode is observed at 644 cm-1, while two distinct modes are observed immediately below [see Fig. 6(a)]. Also, a third and much weaker mode at 653 cm-1 is detected at low temperatures. Figure 8 shows the temperature-dependence of the position of these peaks. As from below, the two strongest modes approach each other. The separation between these modes does not tend to zero but to cm-1 at K. We conclude that the lower-frequency mode in the monoclinic phase is the mode originated from the 644 cm-1 tetragonal mode, while the intermediate- and high-frequency peaks originate from a distinct [] mode at cm-1 that is Raman-forbidden at -plane backscattering geometry in the tetragonal phase (see Table 4). Below , the tetragonal mode transform in the modes. The so-derived mode would then have the same symmetry of the mode originated from the phonon in the tetragonal phase. The similar frequencies of these two phonons would favor their mixing Yan in the monoclinic phase, leading to the observed “repulsion” of these modes on cooling below . The weak peak at 653 cm-1 is attributed to the mode, also derived from the tetragonal mode, but which does not mix with the mode for having a different symmetry.
It is interesting to note that, despite the subtle monoclinic distortion of CuSb2O6 below ,Giere the observed symmetry-breaking-induced monoclinic phonon mixing in CuSb2O6 is an extraordinarily large effect. We should mention that this large separation of the cm-1 band in the monoclinic phase was also reported in Ref. Giere, but rather interpreted in terms of a splitting of a degenerate mode. This interpretation is dismissed by our polarized Raman data at 450 K, which shows unambiguously that the 644 cm-1 mode has symmetry in the tetragonal phase (see Fig. 5).
The Raman spectra of tetragonal CoSb2O6 at selected temperatures are given in Fig. 9. Peaks at 277, 310, 445, 521, 552, 656, and 725 cm-1 are observed, consistent with a previously published powder Raman spectrum at room temperature.Haeuseler The mode assignment is given Table 4. In contrast to the strong temperature-dependence observed for the Raman spectrum of CuSb2O6, little spectral changes were observed for CoSb2O6 between and K.
V Discussion
V.1 Lattice dynamical calculations and mode assignment
Except for some modes below cm-1, the calculated phonon frequencies using the relaxed crystal structure of CuSb2O6 yielded softer modes as compared to the calculations using the experimental crystal structure (see Tables 4 and 5). The difference becomes more significant for the hardest modes, where the comparison with the observed frequencies favors the calculation using the experimental crystal structure. On the other hand, such calculation yielded a imaginary frequency for the soft mode (see Table 4). Still, the comparison between experimental and calculated phonon frequencies is fair enough to allow for an assignment of the observed modes for CuSb2O6 with very little ambiguity. Also, the symmetry classification of observed modes in the tetragonal phase using polarized data (see Fig. 5) resolved most of the ambiguities related with the existence of distinct modes at similar frequencies. The symmetry classification of the mode at 644 cm-1 in the tetragonal phase (rather than an mode as previously assumed)Giere was particularly important to interpret the apparent splitting of this mode in the monoclinic phase.
Since ab-initio lattice dynamics calculations such as those carried out in this work do not deal with manual adjustments of force constants, less ambiguity in the mode assignment with respect to other calculation methods Husson ; Haeuseler arises for a relatively complex structure such as the trirutiles. Also, mode assignments through correlations between parent rutile and the trirutile phonons such as performed in Ref. Torgashev, do not take into account the effect of distinct chemical species at the Cu and Sb sites on the normal modes, and may lead to largely different mechanical representations of the resulting vibrations for many phonons, as verified by a comparison between the drawings of Figs. 2, 3 and 4 with those given in Ref. Torgashev, . Overall, we believe that our methodology will be useful to interpret the vibrational spectra of other similar materials.
V.2 Structural transition of CuSb2O6
The Raman spectrum of CuSb2O6 shows a rich temperature dependence (see Fig. 6), in contrast to CoSb2O6 (see Fig. 9). Some observed effects for CuSb2O6 are clearly related with the Jahn-Teller structural transition at K. First of all, the phonons derived from the tetragonal modes fade away or show only residual intensities above in our Raman measurements, including the soft mode. This is due to the specific geometry of our experiment, which exploited a natural ab-surface, with null Raman tensor elements in the tetragonal phase (see Table 1). Another interesting effect associated with the transition at is the remarkable phonon mixing at cm-1 in the monoclinic phase, as described in detail in Section IV.
A revealing manifestation of the structural transition of CuSb2O6 in our data is the observation of large softenings of the peaks derived from the and tetragonal modes on warming up to (see Fig. 7). In fact, the mode softens from 99 cm-1 at 20 K to 73 cm-1 at 420 K (26%), while the central position of the peak derived from the tetragonal mode softens from 432 cm-1 at 20 K to 360 cm-1 at 420 K (17%). These modes correspond, respectively, to a dynamic rotation of the CuO6 octahedra along the axis and to Jahn-Teller-like elongations of the same octahedra. Considering that the structural differences between the -CuSb2O6 and -CuSb2O6 phases are precisely a Jahn-Teller distortion plus a rotation of the CuO6 octahedra (see Fig. 1), the and modes could be indeed anticipated as good candidates for soft modes of the structural transition. On the other hand, the behavior of these modes is not characteristic of classical soft modes, which should freeze () as (Ref. Cochran, ). A large anomalous broadening was observed for the mode on warming up to , indicating an important influence of anharmonicity in this phase transition. In fact, the damping constant of the mode, which is resolution-limited at low temperatures, reach a maximum value of 14(1) cm-1 at [see Fig. 7(a)], corresponding to a phonon lifetime of only times the vibrational period. A large broadening is also observed for the mode [see Fig. 7(b)]. Such large phonon damping signals a crossover from a displacive to an order-disorder phase transition,Bruce ; Muller where incoherent local Jahn-Teller distortions and rotations of CuO6 octahedra grow and dominate the lattice dynamics as . We conclude that, although the Jahn-Teller energy level splitting is slightly larger than the stiffness parameter that orients the distortion cooperatively, these quantities show comparable magnitudes. Also, the extrapolated behavior of the line positions of the “soft” modes indicate that, in the absence of the order-disorder transition at , these modes would actually freeze () at K. Based on these considerations, we suggest that local Jahn-Teller distortions of CuO6 octahedra take place between and K, being likely washed out above this temperature. Further investigations at higher temperatures than those reached in this work are necessary to confirm or dismiss this scenario.
VI Conclusions
In summary, a Raman scattering study of CuSb2O6 and CoSb2O6 crystals with trirutile structure is presented, supported by ab-initio lattice dynamics calculations. The methodology employed in this work allowed for the identification of the observed Raman-active and previously published infrared-active modes Torgashev of CuSb2O6, which proved to be determinant to interpret the observed phonon anomalies associated with the Jahn-Teller structural transition at K. A crossover from a displacive to an order-disorder transition at is inferred from our data, indicating that local Jahn-Teller fluctuations should be present immediately above , with a possible modification to a state with regular local CuO6 octahedra above K. A study of the effect of magnetic correlations on the vibrational Raman spectra of these materials is currently underway.Damaris
Acknowledgements.
Work at UNICAMP was conducted with financial support from FAPESP Grant 2012/04870-7, CAPES, and CNPq, Brazil. Work at Montana State University was conducted with financial support from the US Department of Energy (DOE), Office of Science, Basic Energy Sciences (BES) under Award No. DE-SC0016156.References
- (1) E.-O. Giere, A. Brahimi, H.J. Deiseroth and D. Reinen, J. Sol. State Chem. 131, 263 (1997).
- (2) A. Nakua, H. Yun, J.N. Reimers, J.E. Greedan, and C.V. Stager, J. Sol. State Chem. 91, 105 (1991).
- (3) J.D. Donaldson, A. Kjekshus, D.G. Nicholson, and T. Rakke, Acta Chem. Scandin. A29, 803 (1975).
- (4) A.M. Nakua and J.E. Greedan, J. Sol. State Chem. 118, 199 (1995).
- (5) M. Yamaguchi, T. Furuta, and M. Ishikawa, J. Phys. Soc. Japan 65, 2998 (1996).
- (6) M. Kato, A. Hatazaki, K. Toshimura, and K. Kosuge, Physica B 281 & 282, 663 (2000).
- (7) H.-J. Koo and M.-H. Whangbo, J. Sol. State Chem. 156, 110 (2001).
- (8) M. Kato, K. Kajimoto, K. Yoshimura, K. Kosuge, M. Nishi, and K. Kakurai, J. Phys. Soc. Japan 71, 187 (2002).
- (9) A.V. Prokofiev, F. Ritter, W. Assmus, B.J. Gibson, and R.K. Kremer, J. Cryst. Growth 247, 457 (2003).
- (10) M. Heinrich, H.-A. Krug von Nidda, A. Krimmel, A. Loidl, R.M. Eremina, A.D. Ineev, B.I. Kochelaev, A.V. Prokofiev, and W. Assmus, Phys. Rev. B 67, 224418 (2003).
- (11) V.I. Torgashev, V.B. Shirokov, A.S. Prokhorov, B. Gorshunov, P. Haas, M. Dressel, B.J. Gibson, R.K. Kremer, A.V. Prokofiev, and W. Assmus, Phys. Rev. B 67, 134433 (2003).
- (12) B.J. Gibson, R.K. Kremer, A.V. Prokofiev, W. Assmus, and B. Ouladdiaf, J. Magn. Magn. Mater. 272-276, 927 (2004).
- (13) E. Wheeler, Ph.D. thesis, Somerville College, University of Oxford, 2007.
- (14) D. Kasinathan, K. Koepernik, and H. Rosner, Phys. Rev. Lett. 100, 237202 (2008).
- (15) A. Rebello, M.G. Smith, J.J. Neumeier, B.D. White, and Y.-K. Yu, Phys. Rev. B 87, 224427 (2013).
- (16) A.B. Christian, S.H. Masunaga, A.T. Schye, A. Rebello, J.J. Neumeier, and Y.-K. Yu, Phys. Rev. B 90, 224423 (2014).
- (17) N. Prasai, A. Rebello, A.B. Christian, J.J. Neumeier, and J.L. Cohn, Phys. Rev. B 91, 054403 (2015).
- (18) M. Herak, D. Zilic, D.M. Calogovic, and H. Berger, Phys. Rev. B 91, 174436 (2015).
- (19) J.C. Bonner and M.E. Fisher, Phys. Rev. 135, A640 (1964).
- (20) M. Saes, N.P. Raju, and J.E. Greedan, J. Sol. State Chem. 140, 7 (1998).
- (21) A. Golubev, R.E. Dinnebier, A. Schulz, R.K. Kremer, H. Langbein, A. Senyshyn, J.M. Law, T.C. Hansen, H.-J. Koo, and M.-H. Whangbo, Inorg. Chem. 56, 6318 (2017).
- (22) J.N. Reimers, J.E. Greedan, C.V. Stager, and R. Kremer, J. Sol. State Chem 83, 20 (1989).
- (23) A.B. Christian, A. Rebello, M.G. Smith, and J.J. Neumeier, Phys. Rev. B 92, 174425 (2015).
- (24) E. Granado, A. García, J.A. Sanjurjo, C. Rettori, I. Torriani, F. Prado, R.D. Sánchez, A. Caneiro, and S.B. Oseroff, Phys. Rev. B 60, 11879 (1999).
- (25) E. Husson, Y. Repelin, and H. Brusset, Spectrochim. Acta 35A, 1177 (1979).
- (26) H. Haeuseler, Spectrochim. Acta 37A, 487 (1981).
- (27) W.B. White, Mat. Res. Bull. 2, 381, (1967).
- (28) R. Franck and C. Rocchiccioli-Deltcheff, Spectrochim. Acta 30A, 1 (1974).
- (29) A. Guillén-Bonilla, V.-M. Rodríguez-Betancourtt, M. Flores-Martínez, O. Blanco-Alonso, J. Reyes-Gómez, L. Gildo-Ortiz, and H. Guillén-Bonilla, Sensors 14, 15802 (2014).
- (30) W. Cochran, Advan. Phys. 9, 387 (1960).
- (31) E. Granado, J.A. Sanjurjo, C. Rettori, J.J. Neumeier, and S.B. Oseroff, Phys. Rev. B 62, 11304 (2000).
- (32) A.D. Bruce, K.A. Müller, and W. Berlinger, Phys. Rev. Lett. 42, 185 (1979).
- (33) K.A. Müller Y. Luspin, J.L. Servoin, and F. Gervais, J. Physique Lett. 43, L-537 (1982).
- (34) A.J. Millis, Phys. Rev. B 53, 8434 (1996).
- (35) R.A. Souza, N.M. Souza-Neto, A.Y. Ramos, H.C.N. Tolentino, and E. Granado, Phys. Rev. B 70, 214426 (2004).
- (36) V. Srinivasan and K.N. Shrivastava, J. Phys. C 12, L367 (1979).
- (37) D.L. Rousseau, R.P. Bauman and S.P.S. Porto, J. Raman Spectr. 10, 253 (1981).
- (38) P. Giannozzi, S. Baroni, N. Bonini, M. Calandra, R. Car, C. Cavazzoni, D. Ceresoli, G. L. Chiarotti, M. Cococcioni, I. Dabo, A. Dal Corso, S. Fabris, G. Fratesi, S. de Gironcoli, R. Gebauer, U. Gerstmann, C. Gougoussis, A. Kokalj, M. Lazzeri, L. Martin-Samos, N. Marzari, F. Mauri, R. Mazzarello, S. Paolini, A. Pasquarello, L. Paulatto, C. Sbraccia, S. Scandolo, G. Sclauzero, A. P. Seitsonen, A. Smogunov, P. Umari, R. M. Wentzcovitch, J. Phys.: Condens. Matter 21, 395502 (2009).
- (39) J.P. Perdew, K. Burke, and M. Ernzerhof, Phys. Rev. Lett. 77, 3865 (1996).
- (40) G. Kresse and D. Joubert, Phys. Rev. B 59, 1758 (1999).
- (41) We used the files Cu.pbe-dn-kjpaw_psl.0.2.UPF, Sb.pbe-n-kjpaw_psl.0.3.1.UPF and O.pbe-n-kjpaw_psl.0.1.UPF available in http://www.quantum-espresso.org.
- (42) A. Kokalj, Comp. Mater. Sci. 28, 155 (2003). Code available from http://www.xcrysden.org/
- (43) K. Momma and F. Izumi, J. Appl. Crystallogr. 44, 1272 (2011).
- (44) J. Yan, T. Villarson, E.A. Henriksen, P. Kim, and A. Pinczuk, Phys. Rev. B 80, 241417(R) (2009).
- (45) D.T. Maimone, A.B. Christian, J.J. Neumeier, and E. Granado, to be published.