11email: dqasim@strw.leidenuniv.nl 22institutetext: INAF–Osservatorio Astrofisico di Catania, via Santa Sofia 78, 95123 Catania, Italy 33institutetext: School of Electronic Engineering and Computer Science, Queen Mary University of London, Mile End Road, London E1 4NS, UK 44institutetext: School of Physical Sciences, STEM, Open University, Milton Keynes MK7 6AA, UK 55institutetext: Institute for Astronomy, University of Hawaii at Manoa, 2680 Woodlawn Drive, Honolulu, HI 96822–1839
Formation of interstellar methanol ice prior to the heavy \ceCO freeze–out stage
Abstract
Context. The formation of methanol (\ceCH3OH) on icy grain mantles during the star formation cycle is mainly associated with the \ceCO freeze–out stage. Yet there are reasons to believe that \ceCH3OH also can form at an earlier period of interstellar ice evolution in \ceCO–poor and \ceH2O–rich ices.
Aims. This work focuses on \ceCH3OH formation in a \ceH2O–rich interstellar ice environment following the \ceOH–mediated \ceH–abstraction in the reaction, \ceCH4 + OH. Experimental conditions are systematically varied to constrain the \ceCH3OH formation yield at astronomically relevant temperatures.
Methods. \ceCH4, \ceO2, and hydrogen atoms are co–deposited in an ultrahigh vacuum chamber at 10–20 K. \ceOH radicals are generated by the \ceH + O2 surface reaction. Temperature programmed desorption – quadrupole mass spectrometry (TPD–QMS) is used to characterize \ceCH3OH formation, and is complemented with reflection absorption infrared spectroscopy (RAIRS) for \ceCH3OH characterization and quantitation.
Results. \ceCH3OH formation is shown to be possible by the sequential surface reaction chain, \ceCH4 + OH\ceCH3 + H2O and \ceCH3 + OH\ceCH3OH at 10–20 K. This reaction is enhanced by tunneling, as noted in a recent theoretical investigation (Lamberts et al. 2017). The \ceCH3OH formation yield via the \ceCH4 + OH route versus the \ceCO + H route is approximately 20 times smaller for the laboratory settings studied. The astronomical relevance of the new formation channel investigated here is discussed.
Key Words.:
astrochemistry – methods: laboratory: solid state – ISM: clouds – ISM: molecules – infrared: ISM – dust, extinction1 Introduction
Methanol (\ceCH3OH) is an important interstellar molecule. \ceCH3OH has been observed abundantly in both the gas phase (Friberg et al. 1988; Turner 1998; Parise et al. 2002; Bergman et al. 2011; Wirström et al. 2011; Guzmán et al. 2013; Öberg et al. 2014; Taquet et al. 2015) and the solid state (Grim et al. 1991; Allamandola et al. 1992; Skinner et al. 1992; Chiar et al. 1996; Dartois et al. 1999; Gibb et al. 2000; Pontoppidan et al. 2003; Taban et al. 2003; Gibb et al. 2004; Boogert et al. 2008; Bottinelli et al. 2010; Boogert et al. 2011). It is generally accepted that \ceCH3OH formation is most efficient by solid state interactions on icy grain mantles. Models, supported by experiments, of gas phase synthesis of \ceCH3OH provide abundances orders of magnitude below the observed fractional abundance of \ceCH3OH (Garrod et al. 2006; Geppert et al. 2006), while solid state laboratory studies show that \ceCH3OH is efficiently formed in \ceCO–rich ices through sequential hydrogenation of \ceCO (Hiraoka et al. 1994; Watanabe & Kouchi 2002; Fuchs et al. 2009). This is further supported by computational models (Cuppen et al. 2009; Fuchs et al. 2009; Garrod et al. 2006) that show that hydrogenation of \ceCO ice leads to the production of \ceCH3OH. Indeed, these findings are in line with the spectroscopic interpretation of observational data; \ceCO and \ceCH3OH are found to coexist in \ceCO–rich and \ceH2O–poor interstellar ices (Cuppen et al. 2011; Boogert et al. 2015; Penteado et al. 2015). Not only is it a prevalent interstellar molecule, but \ceCH3OH is also an important precursor in the formation of larger species. Öberg et al. (2009) illustrated that upon vacuum UV irradiation, \ceCH3OH can break apart into fragments that can recombine to form complex organic molecules (COMs). In UV–rich environments in the interstellar medium, the formation of \ceCH3OH may thus be crucial to the formation of larger COMs. The studies by Chuang et al. (2015, 2017) and Fedoseev et al. (2017) show that \ceCH3OH may be a key player in the formation of larger COMs, also for cold dense prestellar core conditions. The authors show that radicals derived from \ceCH3OH via an abstraction process can recombine or combine with other radicals, resulting in the formation of COMs as large as glycerol, even at temperatures below 20 K and without the need for UV–induced radiation.
Recent theoretical and experimental efforts (Lamberts et al. 2017) have provided results that have sparked the idea of \ceH2O and \ceCH3OH coexisting in a \ceCO–poor and \ceH2O–rich interstellar ice. Such ices are thought to form before the “heavy” CO freeze–out stage, which starts to occur at a cloud extinction () of ¿ 3 and dust temperatures ¡ 20 K, and that is followed by the “catastrophic” CO freeze–out stage at ¿ 9 and dust temperatures also ¡ 20 K. Prior to the heavy CO freeze–out stage, a \ceCO:\ceH2O ice ratio of ¡ 5% is expected due to some CO freezing out as well as atom–addition reactions (C, O, H, etc.). Due to the relatively low gas densities at this stage, only a relatively low amount of CO is able to accrete onto dust grains, as examined in Pontoppidan (2006) and discussed in Öberg et al. (2011), Boogert et al. (2015), and van Dishoeck (2017). This time period is known as the “\ceH2O–rich ice phase” or “polar ice phase” (i.e., the phase that lacks CO ice). \ceCH3OH formation through this reaction, \ceCH4 + OH, can take place in this phase. However, this does not exclude this reaction to also take place during the \ceCO freeze–out stage, where \ceCH3OH formation is normally dominated by \ceCO hydrogenation. During this time, \ceO2 might be intimately mixed with \ceCO (Vandenbussche et al. 1999) and can be hydrogenated to form \ceOH radicals. Gas phase \ceCH4 becomes more dominant relative to atomic carbon (van Dishoeck 1998) and could freeze out with \ceCO. The importance of the present study is that it focuses on a phase in which \ceCH3OH is only formed through \ceCH4 + OH, as \ceCO is not frozen out yet, and an identification of \ceCH3OH in corresponding environments, therefore, directly relates to this alternative reaction pathway.
The study by Lamberts et al. (2017) was done to provide reaction rates at cryogenic temperatures of the reaction between methane (\ceCH4) and \ceOH as \ceCH4 has been observed in the \ceH2O–rich ice phase (Boogert et al. 1997; Öberg et al. 2008), and \ceOH radicals are expected to be abundant in that phase (Cuppen & Herbst 2007; Ioppolo et al. 2008; Cuppen et al. 2010; Oba et al. 2012; Lamberts et al. 2013). These authors, as well as others (Wada et al. 2006; Hodyss et al. 2009; Weber et al. 2009; Zins et al. 2012; Bossa et al. 2015), showed that \ceCH4 hydrogen abstraction by an \ceOH radical results in the efficient formation of \ceCH3 radicals; a process that can be induced by tunneling (Lamberts et al. 2017). Thus, these findings can be taken one step further by postulation that the \ceOH–induced abstraction reaction of \ceCH4 may result in the formation of \ceCH3OH by the sequential reaction chains: \ceCH4 + OH\ceCH3 + H2O and \ceCH3 + OH\ceCH3OH. There are already a number of laboratory experiments that exhibit \ceCH3OH formation via energetic processing of ice mixtures containing \ceCH4 and \ceH2O (Schutte 1988; d’Hendecourt et al. 1996; Moore & Hudson 1998; Wada et al. 2006; Hodyss et al. 2009; Martín-Doménech et al. 2016). In addition, Bergner et al. (2017) have explored the formation of \ceCH3OH via O–atom insertion in \ceCH4 molecules upon photodissociation of \ceO2 in binary mixtures. In our paper, the reaction \ceCH4 + \ceOH leading to the formation of \ceCH3OH under relevant cold dense core conditions is discussed. The \ceOH radicals are already present at the earliest stages of ice formation via photodissociation of \ceH2O molecules and by atomic H– and O–rich accreting gas (see, e.g., Boogert et al. 2015). Therefore, this formation mechanism could work even under non–energetic conditions, and can be extended to the formation of COMs that contain the hydroxyl functional group (–\ceOH). Furthermore, \ceCH3 radical formation is constrained to abstraction reactions only, whereas in the energetic processing studies, it is unclear whether \ceCH3 radicals are formed by energetic and/or non–energetic pathways.
Data from astronomical observations also provide an incentive to explore \ceCH3OH ice formation before the heavy CO freeze–out stage (i.e., in the \ceH2O–rich ice phase). In the review published by Boogert et al. (2015), Figure 7 displays the observed ice column densities of \ceCH3OH and \ceH2O, as well as other species, as a function of (). Consistent with the current model of interstellar ice evolution, \ceH2O is concentrated at a lower with respect to \ceCH3OH. However, taking a closer look at the figure reveals that \ceCH3OH upper limit values can be found at a lower and at lower column densities than \ceCH3OH detections. Such upper limits do not prove that \ceCH3OH can be formed at lower , but they also do not exclude the idea. A possible explanation for the relatively low and column densities for the \ceCH3OH upper limits may be due to other reaction pathways expected to take place before the CO freeze–out phase. It is also possible that at such low , the sensitivity of the telescopes used may not have been high enough. In the dawn of the James Webb Space Telescope (JWST) era, it is expected that soon it will be possible to extend on the formation schemes in which solid \ceCH3OH is formed or consumed.
In this paper, the formation of \ceCH3OH ice by \ceCH4 + OH under relevant cold dense core conditions is discussed. Section 2 provides an overview of the experimental conditions and methods. Section 3 details how \ceCH3OH was identified, formed in the ice, and quantified. Section 9 provides insights into how the laboratory results presented here can be used to constrain the ice chemistry in the \ceH2O–rich ice phase of cold prestellar core environments, as well as a discussion of Figure 7 from Boogert et al. (2015). Section 5 summarizes the findings from this paper.
2 Experimental setup and methods
The experiments described here are performed with SURFRESIDE2. This is a double atom beam line, ultrahigh vacuum (UHV) setup with a base pressure of mbar in the main chamber. An in–depth description of the setup and experimental procedures can be found in Ioppolo et al. (2013) and Linnartz et al. (2015). Ices are grown on a gold–plated copper substrate ( cm2) that is attached to the cold–finger of a closed–cycle helium cooled cryostat (ColdEdge CH–204 SF). Temperatures as low as 7 K can be realized. The temperature settings are controlled by a LakeShore 340 temperature controller. The substrate temperature is measured by a silicon diode sensor (DT–670) with an absolute accuracy of 1 K. The substrate temperature is changed by resistive heating of a tungsten filament. Incorporation of a sapphire rod within the cryocooler allows substrate temperatures as high as 450 K.
The processes taking place in the ice can be studied through infrared (IR) spectroscopy and mass spectrometry. Species formed in the ice are probed by their IR signatures with a Fourier transform infrared spectrometer (FTIR; Agilent Cary 640/660) applying the reflection absorption infrared spectroscopy (RAIRS) technique. The FTIR permits a coverage of 6000–700 cm-1 with a resolution of 1 cm-1. To further constrain species present in the ice, a quadrupole mass spectrometer (QMS; Spectra Microvision Plus LM76) is used to measure the desorption temperature of ice species during a temperature programmed desorption (TPD) run, as well as the mass spectrum of the desorbing species upon electron impact ionization. A commonly used electron impact ionization energy of 70 eV is chosen. All TPD experiments involve a linear ramp rate of 2 K min-1.
| No. | Experiments | Ratio | Tsample∗ | Flux | Flux | Flux | Flux | Flux | Flux | Time |
|---|---|---|---|---|---|---|---|---|---|---|
| \ceCH4:\ceH:\ceO2 | (K) | cm-2s-1 | cm-2s-1 | cm-2s-1 | cm-2s-1 | cm-2s-1 | cm-2s-1 | (s) | ||
| 1.0 | \ceCH4 + H + O2 | 1:2:1 | 10 | 3E12 | 6E12 | 4E12 | – | – | – | 43200 |
| 2.0 | \ceCH4 + H + O2 | 1:2:1 | 10 | 3E12 | 6E12 | 4E12 | – | – | – | 21600 |
| 2.1 | 13\ceCH4 + H + O2 | 1:2:1 | 10 | 3E12 | 6E12 | 4E12 | – | – | – | 21600 |
| 2.2 | \ceCH4 + H + 18\ceO2 | 1:2:1 | 10 | 3E12 | 6E12 | 4E12 | – | – | – | 21600 |
| 2.3 | 13\ceCH4 + \ceH + 18\ceO2 | 1:2:1 | 10 | 3E12 | 6E12 | 4E12 | – | – | – | 21600 |
| 3.0 | \ceCH3OH | – | 10 | – | – | – | 4E13 | – | – | 100 |
| 4.0 | \ceCH3OH | – | 10 | – | – | – | 1E13 | – | – | 1200 |
| 4.1 | \ceCH3OH + \ceO2 (MWAS)♢ | – | 10 | – | – | 4E13 | 1E11 | – | – | 9000 |
| 4.2 | \ceCH3OH + \ceCH4 | – | 10 | 6E13 | – | – | 1E11 | – | – | 9000 |
| 4.3 | \ceCH3OH + H2O | – | 10 | – | – | – | 1E11 | 6E13 | – | 9000 |
| 4.4 | \ceCH3OH + H2O (MWAS)♢ | – | 10 | – | – | – | 1E11 | 6E13 | – | 9000 |
| 4.5 | \ceCH3OH + H2O (MWAS)♢ + \ceCH4 | – | 10 | 6E13 | – | – | 1E11 | 6E13 | – | 9000 |
| 4.6 | \ceCH3OH + CO | – | 15 | – | – | – | 2E10 | – | 7E10 | 3600 |
| 5.0 | 13\ceCH4 + \ceH + 18\ceO2 | 1:2:1♣ | 20 | 3E12♣ | 6E12 | 4E12 | – | – | – | 21600 |
| 6.0 | \ceCH4 + H + O2 | 1:2:1 | 10 | 3E12 | 6E12 | 1E13 | – | – | – | 21600 |
In order to simulate cold dense core conditions, all ices are grown on a substrate surface with a temperature between 10–20 K. \ceCH4, H, and \ceO2 are admitted into the main vacuum chamber following the co–deposition technique (i.e., different molecular species deposited simultaneously), which reproduces interstellar conditions better than with previously used pre–deposition techniques (i.e., different molecular species deposited sequentially) (Linnartz et al. 2015). Additionally, this technique allows all deposited species to react with one another, regardless of the ice thickness, which is advantageous when trying to probe trace species. The OH radicals are formed by H–atom addition to \ceO2 (Cuppen et al. 2010) and the \ceCH3 radicals are formed by \ceOH–mediated \ceH–abstraction of \ceCH4 (i.e., radicals are formed in situ). A series of control experiments performed by Lamberts et al. (2017) showed that the produced \ceOH radicals are solely responsible for the H–abstraction of \ceCH4 (i.e., formation of \ceCH3 radicals directly through reaction with H–atoms is not efficient, as proved in Lamberts et al. (2017)). We note that the formation of \ceOH radicals from \ceO2 is not necessarily representative of the formation of \ceOH radicals in low (low density) environments, where the \ceO + H route dominates, as well as photodissociation of \ceH2O. Since the \ceOH and \ceCH3 radicals are formed in the ice, they are expected to be thermalized before further reactions occur.
To perform H–atom addition reactions, H–atoms are produced by a Hydrogen Atom Beam Source (HABS) (Tschersich & Von Bonin 1998; Tschersich 2000; Tschersich et al. 2008), and the H–atom beam line has an angle of 45∘ to surface normal of the gold–plated sample. Hydrogen molecules (\ceH2; Praxair 99.8%) flow into the HABS chamber via a leak valve and are thermally cracked by a tungsten filament. The gas deposition lines of \ceO2 (Linde Gas 99.999%) and \ceCH4 (Linde Gas 99.995%) are angled at 135∘ and 68∘, respectively, to the plane of the sample’s surface. Gas isotopologues, \ce^18O2 (Campro Scientific 97%) and \ce^13CH4 (Sigma–Aldrich 99%), are used as controls to aid in identification of the formed ice products.
Fluxes and column densities are characterized as follows. An absolute D–atom flux was measured by Ioppolo et al. (2013), and the \ceO2 and \ceCH4 fluxes are calculated using the Hertz–Knudsen equation (Kolasinski 2012). Column densities are determined by the relation between absorbance and column density, as described in Hudgins et al. (1993). As discussed previously by Ioppolo et al. (2013), Teolis et al. (2007), and Loeffler et al. (2006), such measurements must be done with caution. Therefore in this work, only the relative column densities of \ceCH4, \ceH2O, and \ceCH3OH are given (i.e., absolute column densities are not listed). Care is taken to use integrated absorbances that do not deviate from the linear trend of the column density over time. The band strength used to determine the \ceCH3OH column density is cm molecule-1 (1030 cm-1) and is obtained by performance of a He–Ne laser interference experiment in SURFRESIDE2 (Chuang et al. in prep). The underlying experimental procedure is described in detail in Paardekooper et al. (2016). \ceCH4 (1302 cm-1) and \ceH2O (1659 cm-1) band strengths of cm molecule-1 and cm molecule-1, respectively, are extracted from Bouilloud et al. (2015). Since the band strengths from Bouilloud et al. (2015) are obtained from transmission IR experiments, a proportionality factor between the \ceCH3OH band strengths from Bouilloud et al. (2015) and our laser interference experiment is used as a correction factor. It should be noted that literature transmission band strength values cannot be used with optical depth values obtained from a RAIRS experiment partly due to surface–enhanced dipole coupling that occurs in RAIRS. Setup specific values have to be determined for specified conditions. All experiments discussed in this paper are listed in Table 1.
3 Results and discussion
3.1 Identification and analysis of \ceCH3OH formation
In the next sections, three different ways to confirm the formation of \ceCH3OH ice by the reaction, \ceCH4 + OH, are presented.
3.1.1 TPD
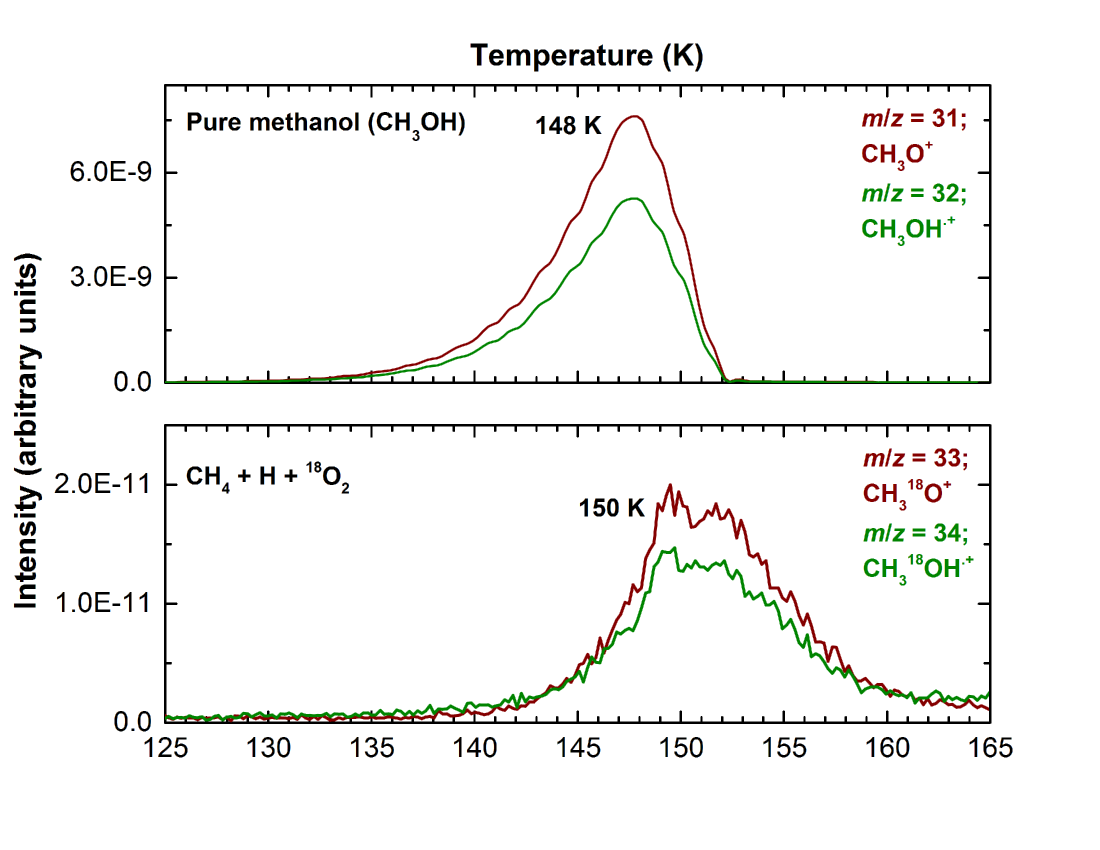
Figure 1 (top) shows the TPD spectra of pure \ceCH3OH compared to the TPD spectra of the \ceCH4 + \ceH + 18\ceO2 reaction (bottom) for m/z = 31, 32 and 33, 34, respectively. We note that m/z = 32 also represents the \ceO2.+ ion in the \ceCH4 + \ceH + \ceO2 reaction, and therefore TPD data from the 18\ceO2 isotope experiment are used instead. Because m/z = 31 (\ceCH3O+) and 32 (\ceCH3OH.+) represent the most intense ions for the \ceCH3OH cracking pattern found in our experimental setup and because their isotopically–induced shifted m/z values in the isotope–enriched experiments can be tracked for most experiments (i.e., the m/z values remain characteristic of \ceCH3OH and not of other species), we use the m/z values representing \ceCH3O+ and \ceCH3OH.+ to confirm the formation of \ceCH3OH. As seen in Figure 1 (top), the signals for m/z = 31 and 32 peak at 148 K for pure \ceCH3OH. The same m/z signals peak at 150 K in the \ceCH4 + \ceH + 18\ceO2 experiment, as seen in Figure 1 (bottom). This slight increase in the \ceCH3OH desorption temperature is expected since the binding energy of \ceCH3OH will be influenced by the presence of \ceH2O. It should be noted that \ceH2O, along with \ceH2O2, are formed during the experiments and are not initial reactants of the ice mixture. The similar peak positions and profiles for the \ceCH3O+ (\ceCH318O+) and \ceCH3OH.+ (\ceCH318\ceOH.+) ion signals between the two experiments allows to assign the observed desorption as originating from \ceCH3OH.
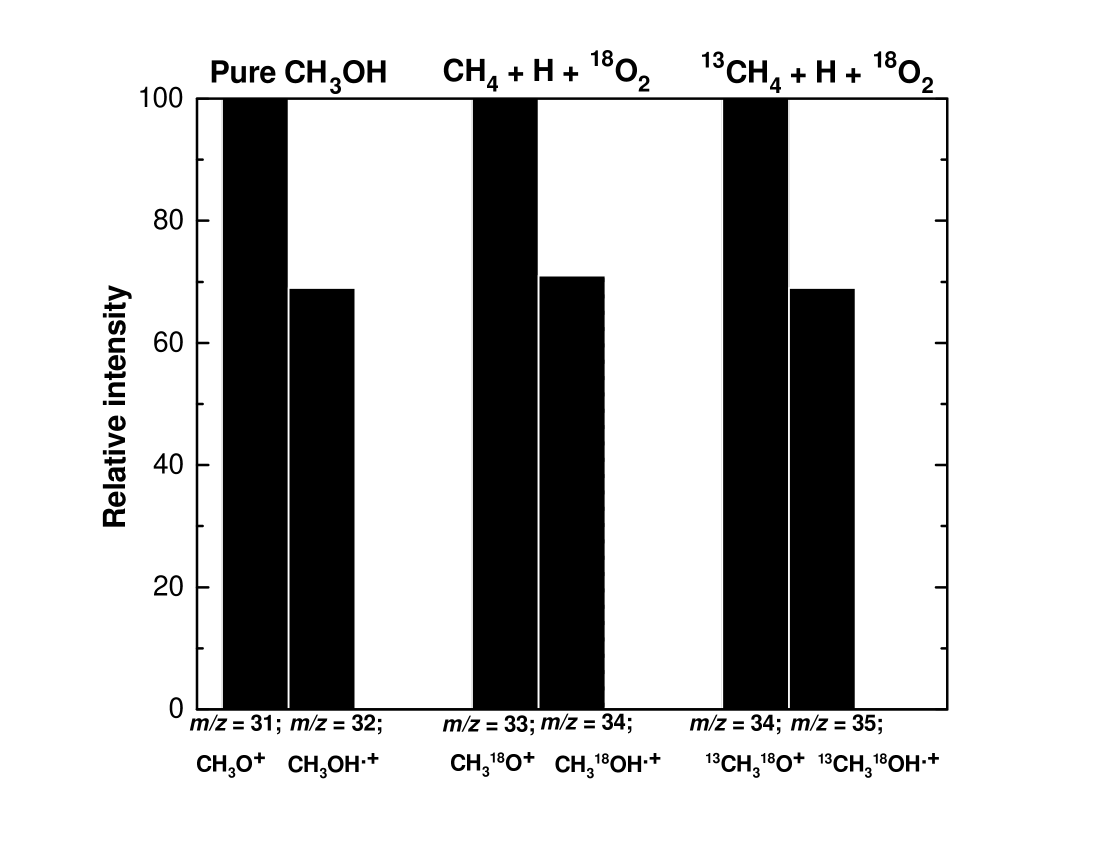
This assignment is further constrained by quantitatively comparing the \ceCH3OH fragmentation pattern upon 70 eV electron impact ionization with values available from the NIST database222NIST Mass Spec Data Center, S.E. Stein, director, “Mass Spectra” in NIST Chemistry WebBook, NIST Standard Reference Database Number 69, Eds. P.J. Linstrom and W.G. Mallard, National Institute of Standards and Technology, Gaithersburg MD, 20899, doi:10.18434/T4D303, (retrieved November 7, 2017). Figure 2 presents a column chart of the relative integrated intensities of the \ceCH3O+ and \ceCH3OH.+ ion signals observed in a pure \ceCH3OH experiment and in isotopically–enriched 13\ceCH4 + H + 18\ceO2 experiments. As seen in Figure 2, the relative integrated intensities of pure \ceCH3OH for m/z = 31 (\ceCH3O+) and 32 (\ceCH3OH.+) are 100 and 69, respectively. In the \ceCH4 + H + 18\ceO2 experiment, the intensities for m/z = 33 (\ceCH318\ceO+) and 34 (\ceCH318\ceOH.+) are 100 and 71, respectively. In the 13\ceCH4 + H + 18\ceO2 experiment, the values for m/z = 34 (13\ceCH318\ceO+) and 35 (13\ceCH318\ceOH.+) are 100 and 69, respectively. In the NIST database, the relative integrated intensities for m/z = 31 (\ceCH3O+) and 32 (\ceCH3OH.+) are 100 and 74, respectively. The relative integrated intensities in the three experiments are nearly identical and are close to the values from NIST, fully in line with \ceCH3OH formation in the ice.
3.1.2 RAIRS
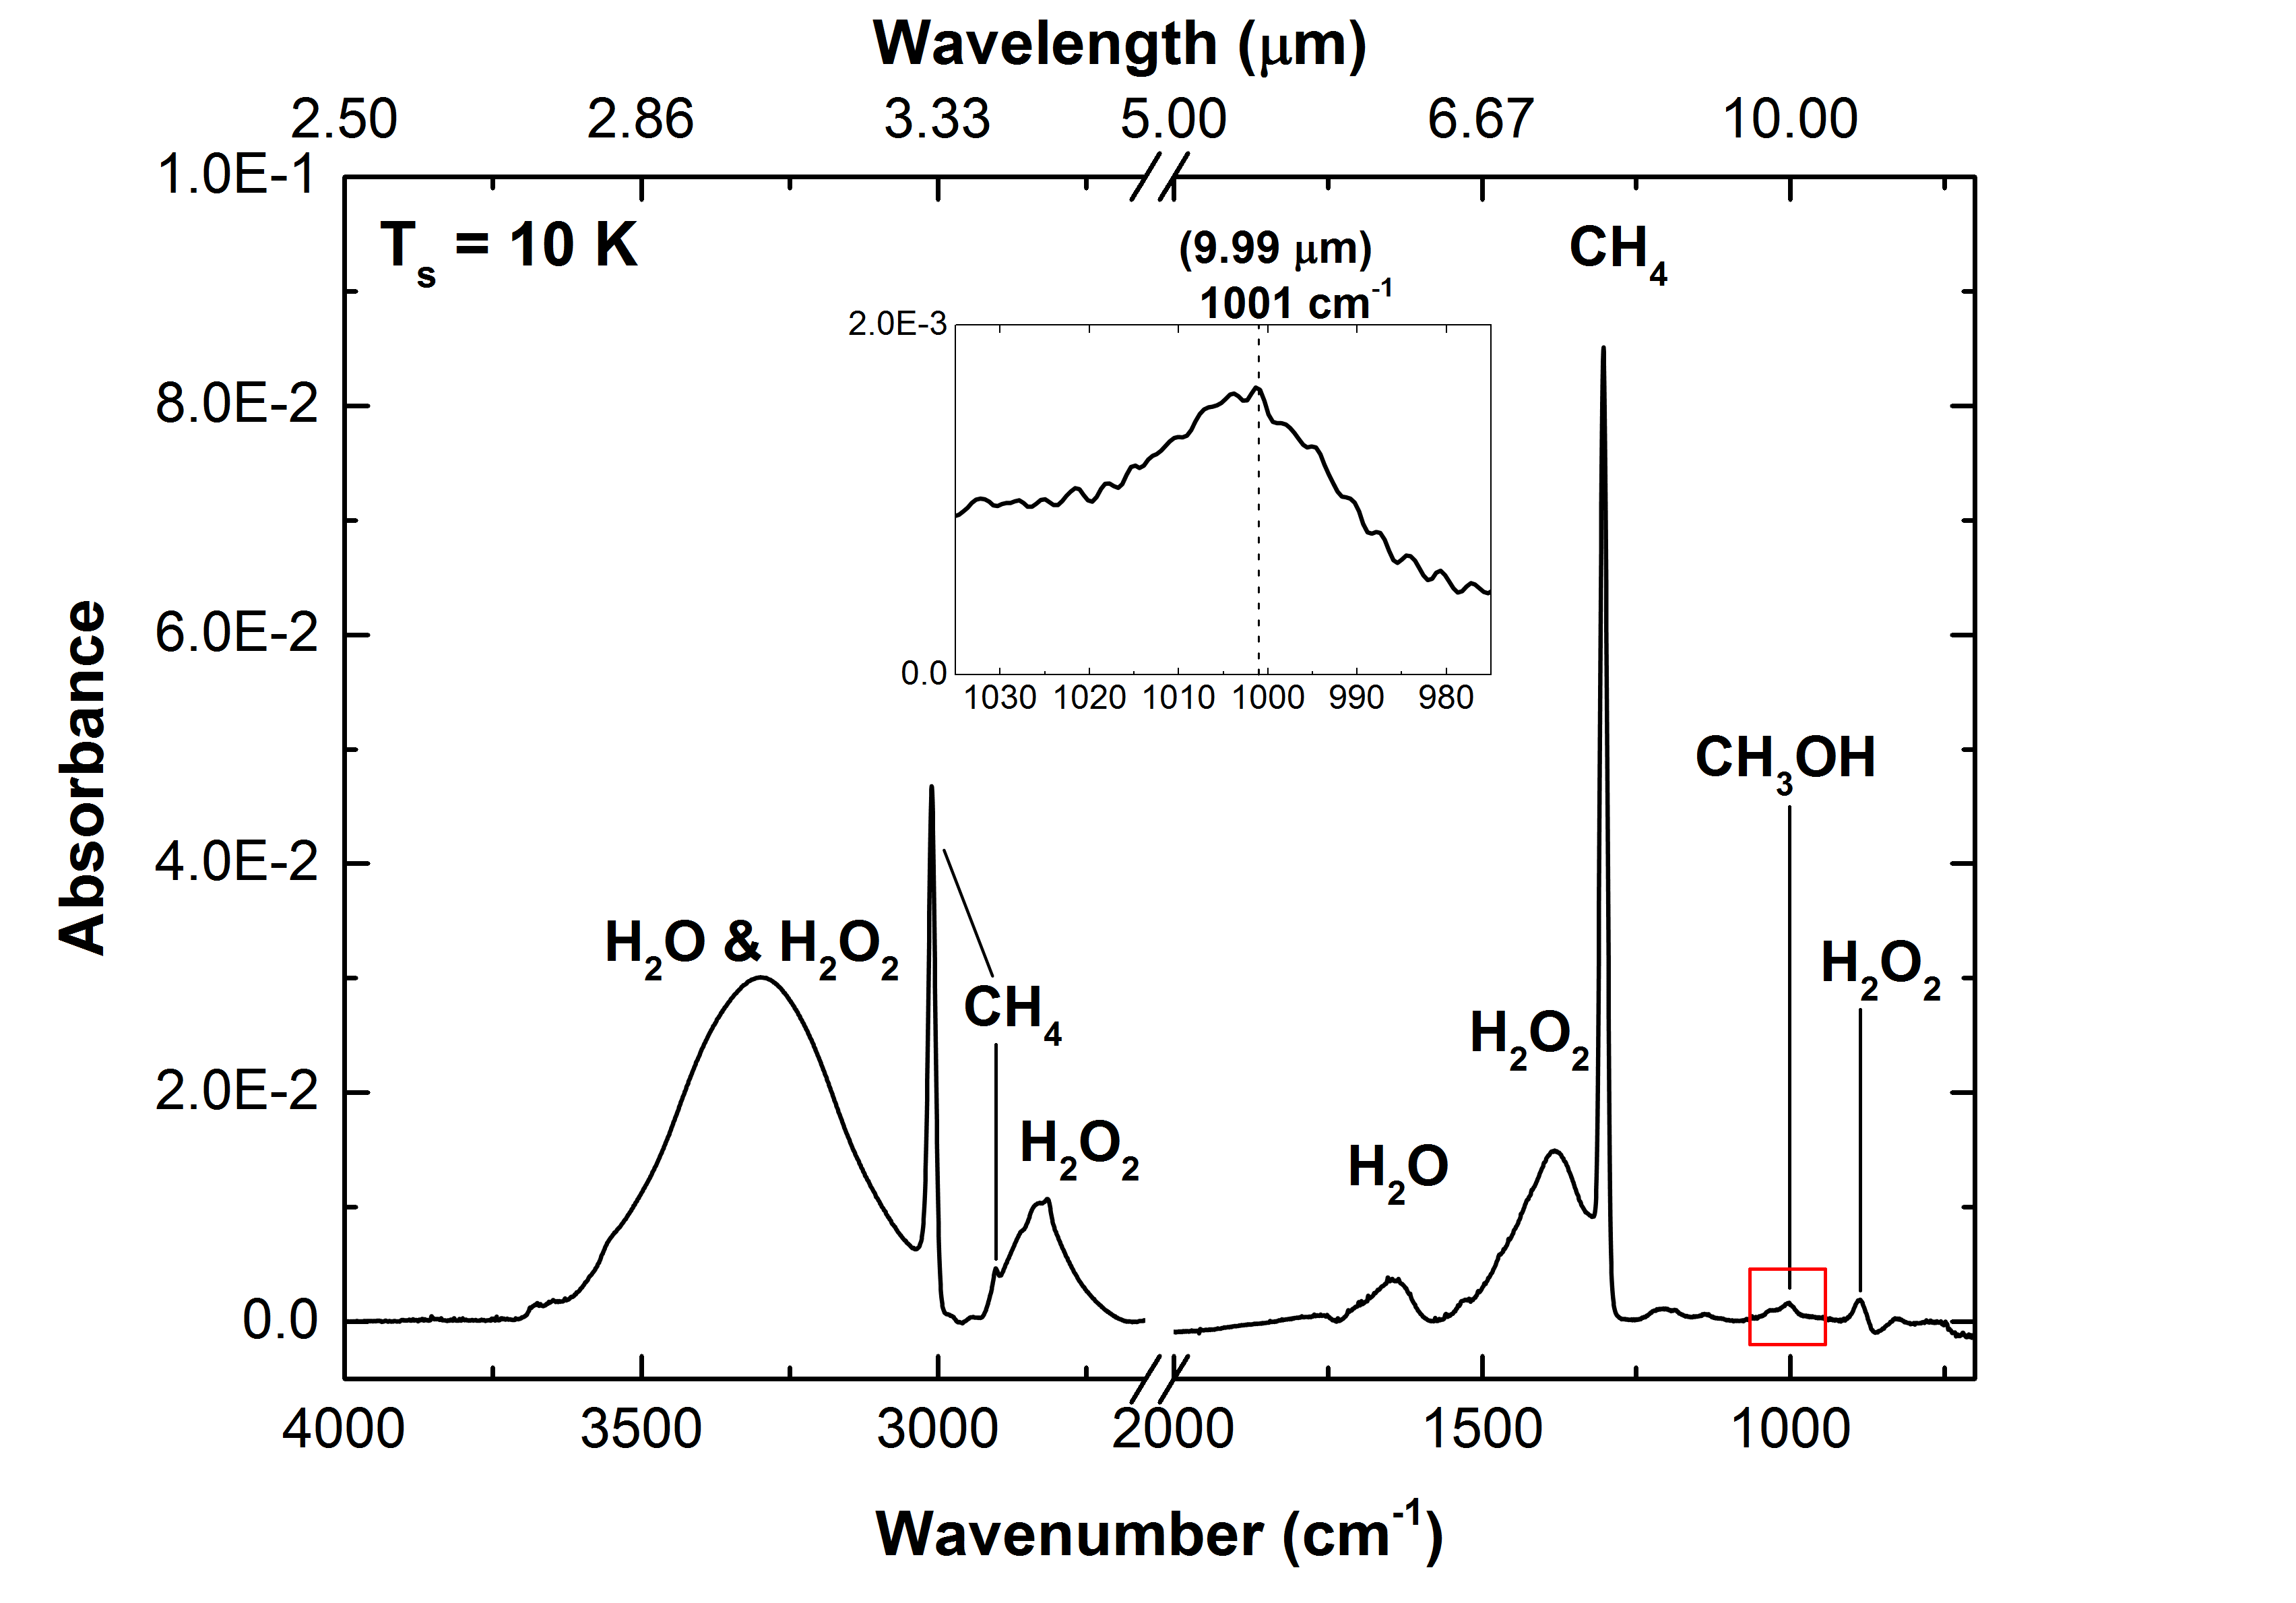
Figure 3 shows the resulting 4000–700 cm-1 (2.5–14.3 m) spectrum for \ceCH4 + H + O2 interacting on a 10 K substrate. Table 2 lists the frequencies measured, as well as the identification of species observed and the corresponding vibrational modes. The assignment of the peaks are constrained by considering literature values, isotope experiments, ice desorption temperatures, and varying flux ratios of the reactants. The inset in Figure 3 shows a band at 1001 cm-1 that is assigned to the \ceC-O stretching mode of \ceCH3OH. This assignment is based on experiments performed in Section 3.2. Literature values for this band (Wada et al. 2006; Hodyss et al. 2009; Martín-Doménech et al. 2016) are normally somewhat higher; around 1015 cm-1 when \ceCH3OH is mixed with \ceH2O. Even though this band is rather weak, it offers a tool to unambiguously link to \ceCH3OH as it has no overlap with bands of other species formed in these experiments and actually provides a nicely isolated feature.
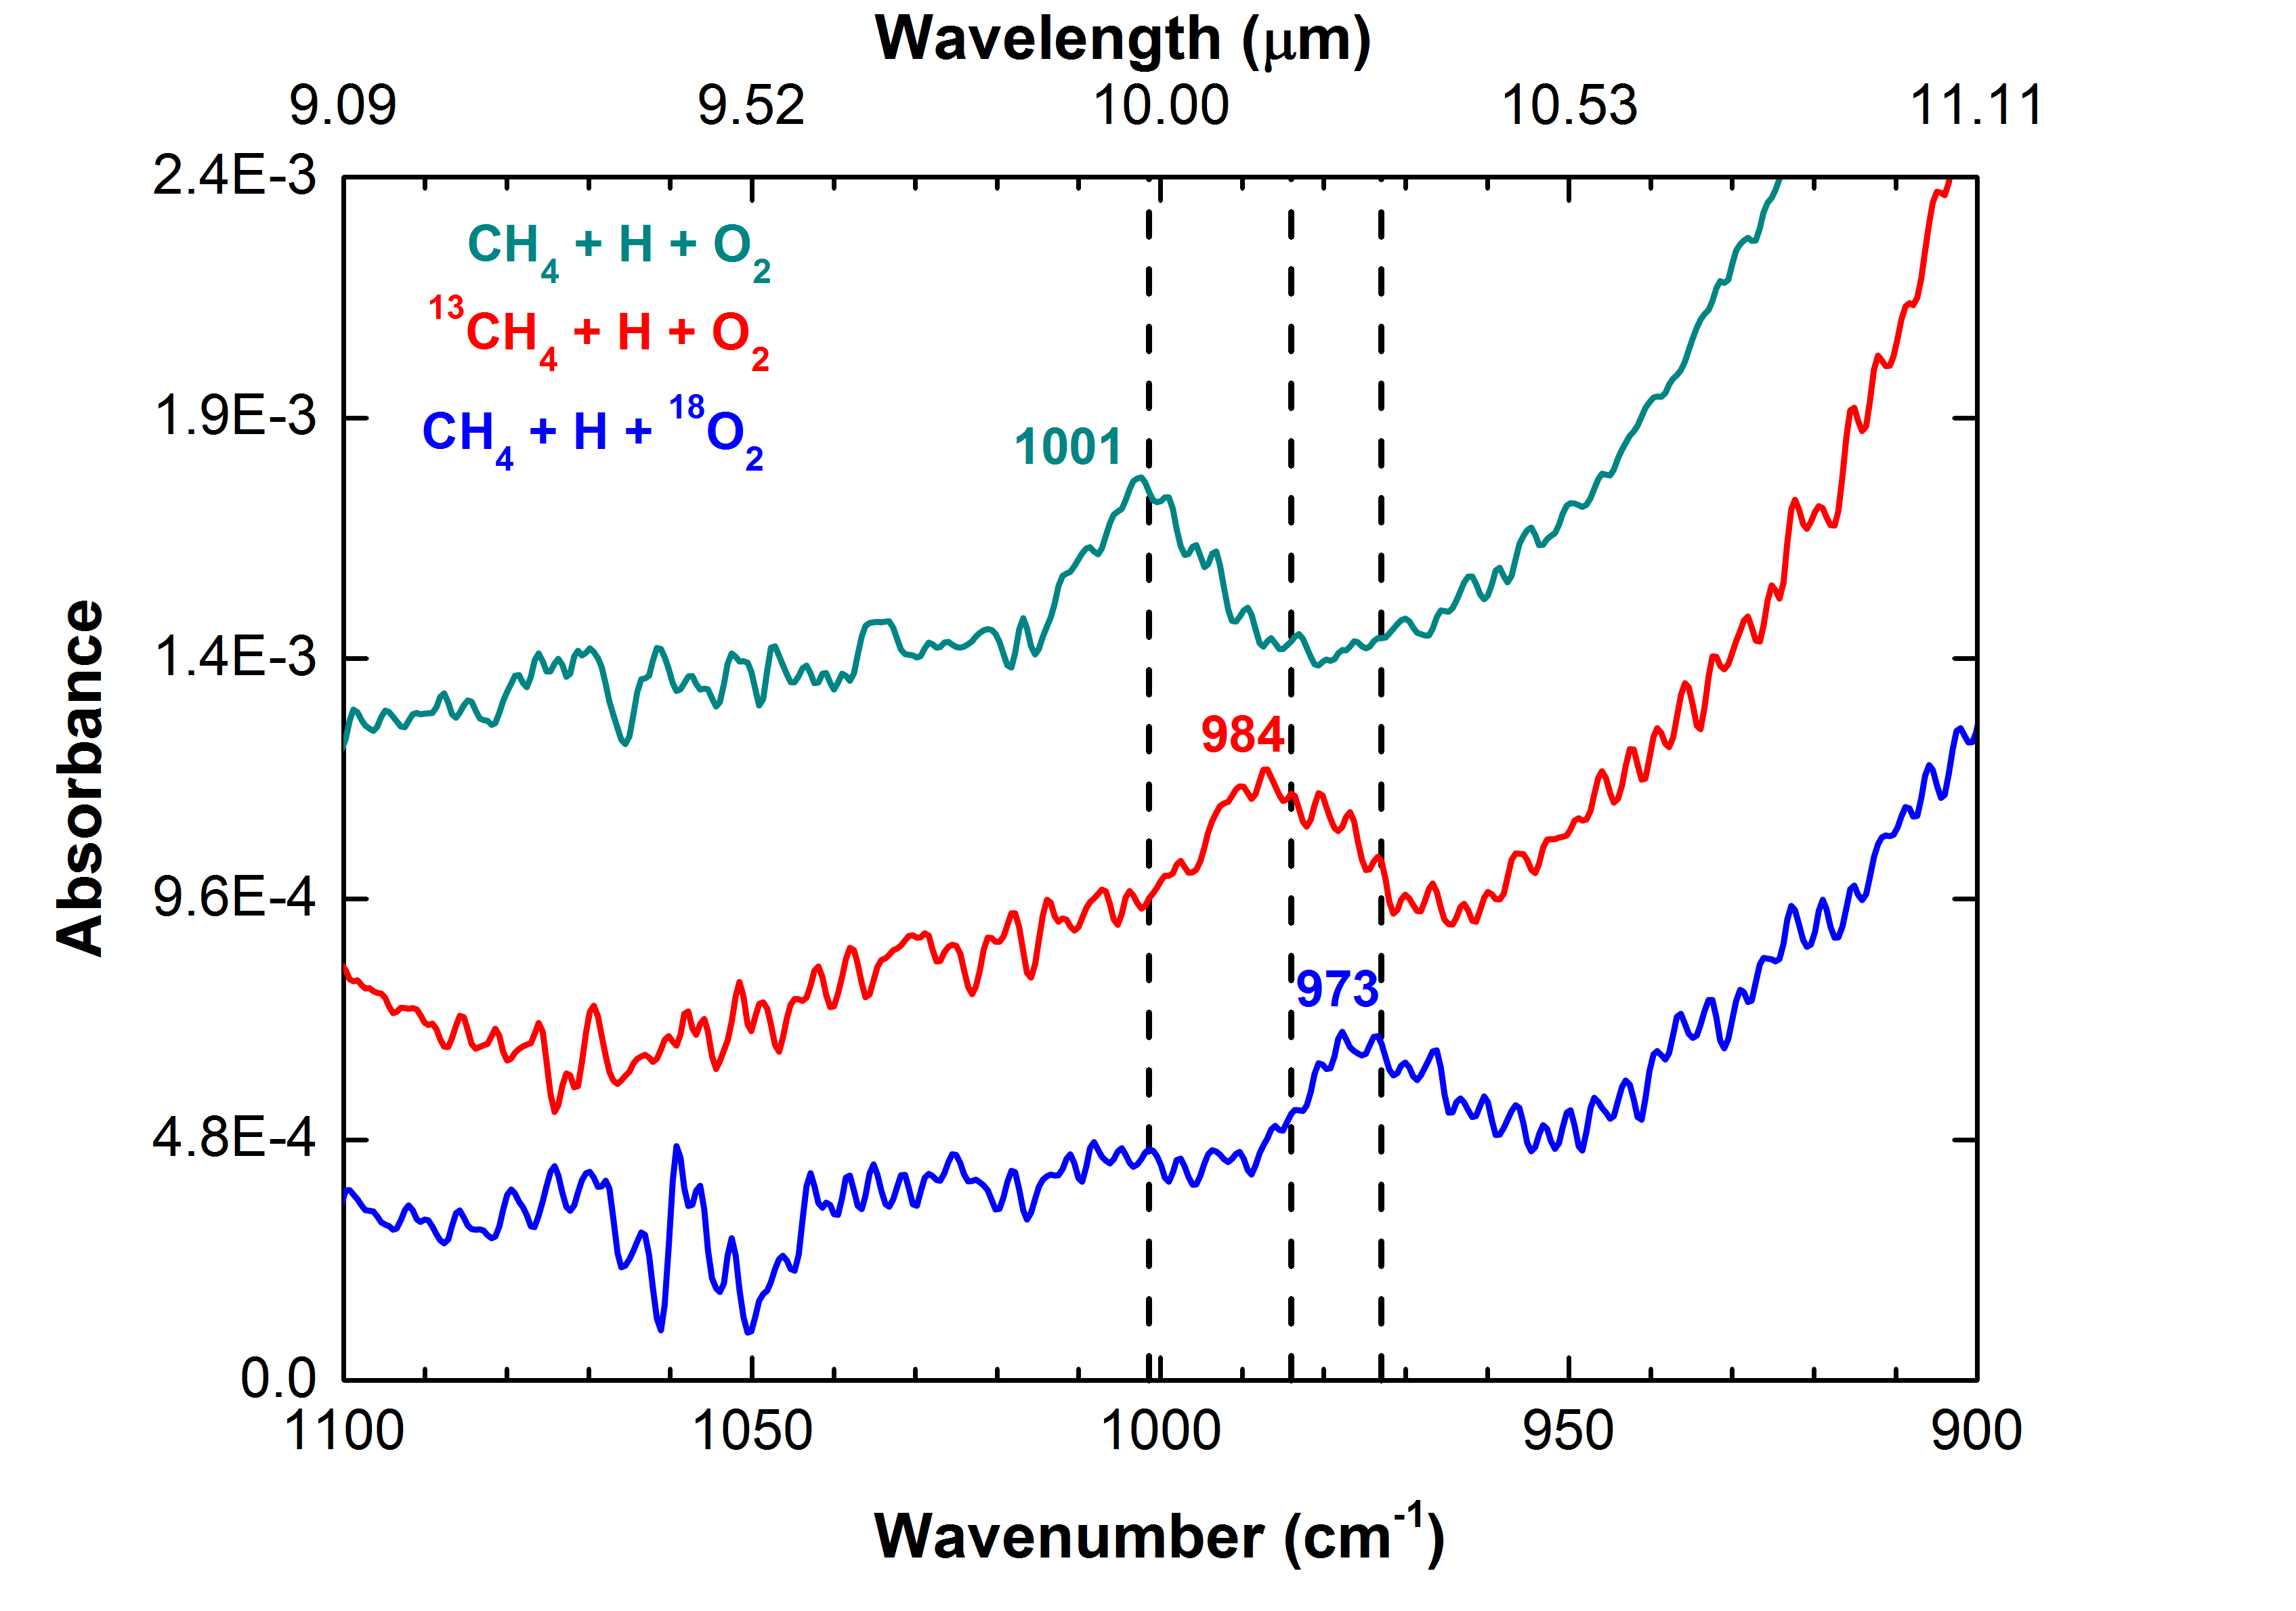
A series of additional experiments are performed in order to further prove that the band at 1001 cm-1 is indeed due to the \ceC-O stretching frequency of \ceCH3OH. This is realized in a set of isotope substitution experiments. Figure 4 shows spectra of three experiments that involve \ceCH4, 13\ceCH4, \ceO2, and 18\ceO2 isotopes. By the simple harmonic oscillator approach, a heavier isotope should result in a redshift in the stretching frequency. As seen in Figure 4, the 1001 cm-1 feature redshifts to 984 cm-1 and 973 cm-1 for the reactions involving 13\ceCH4 and 18\ceO2, respectively. This leads to differences of 17 cm-1 and 28 cm-1 from the 1001 cm-1 feature, respectively, comparable to the differences found in \ceCH3OH isotope experiments performed by Maity et al. (2014). These findings are consistent with isotopically enriched \ceC-O bonds in newly formed \ceCH3OH.
| Peak position | Peak position | Molecule | Mode∗ | Reference |
| (cm-1) | (m) | |||
| 884 | 11.3 | \ceH2O2 | 1, 2, 3 | |
| 1001 | 9.99 | \ceCH3OH | this work | |
| 1302 | 7.68 | \ceCH4 | 4, 5, 7, 8, 9 | |
| 1381 | 7.24 | \ceH2O2 | 1, 2, 3 | |
| 1637 | 6.11 | \ceH2O | 6 | |
| 2815 | 3.55 | \ceCH4 | + | 4, 5, 7, 8, 9 |
| 2836 | 3.53 | \ceH2O2 | 2 | 1, 2, 3 |
| 2902 | 3.45 | \ceCH4 | 7, 8, 9 | |
| 3010 | 3.32 | \ceCH4 | 4, 5, 7, 8, 9 | |
| 3295 | 3.0 | \ceH2O2 + \ceH2O | \ceO-H stretch | 10, 11 |
| 3675 | 2.7 | \ceH2O | dangling bonds | 7 |
3.1.3 Temperature–dependent RAIR difference spectra
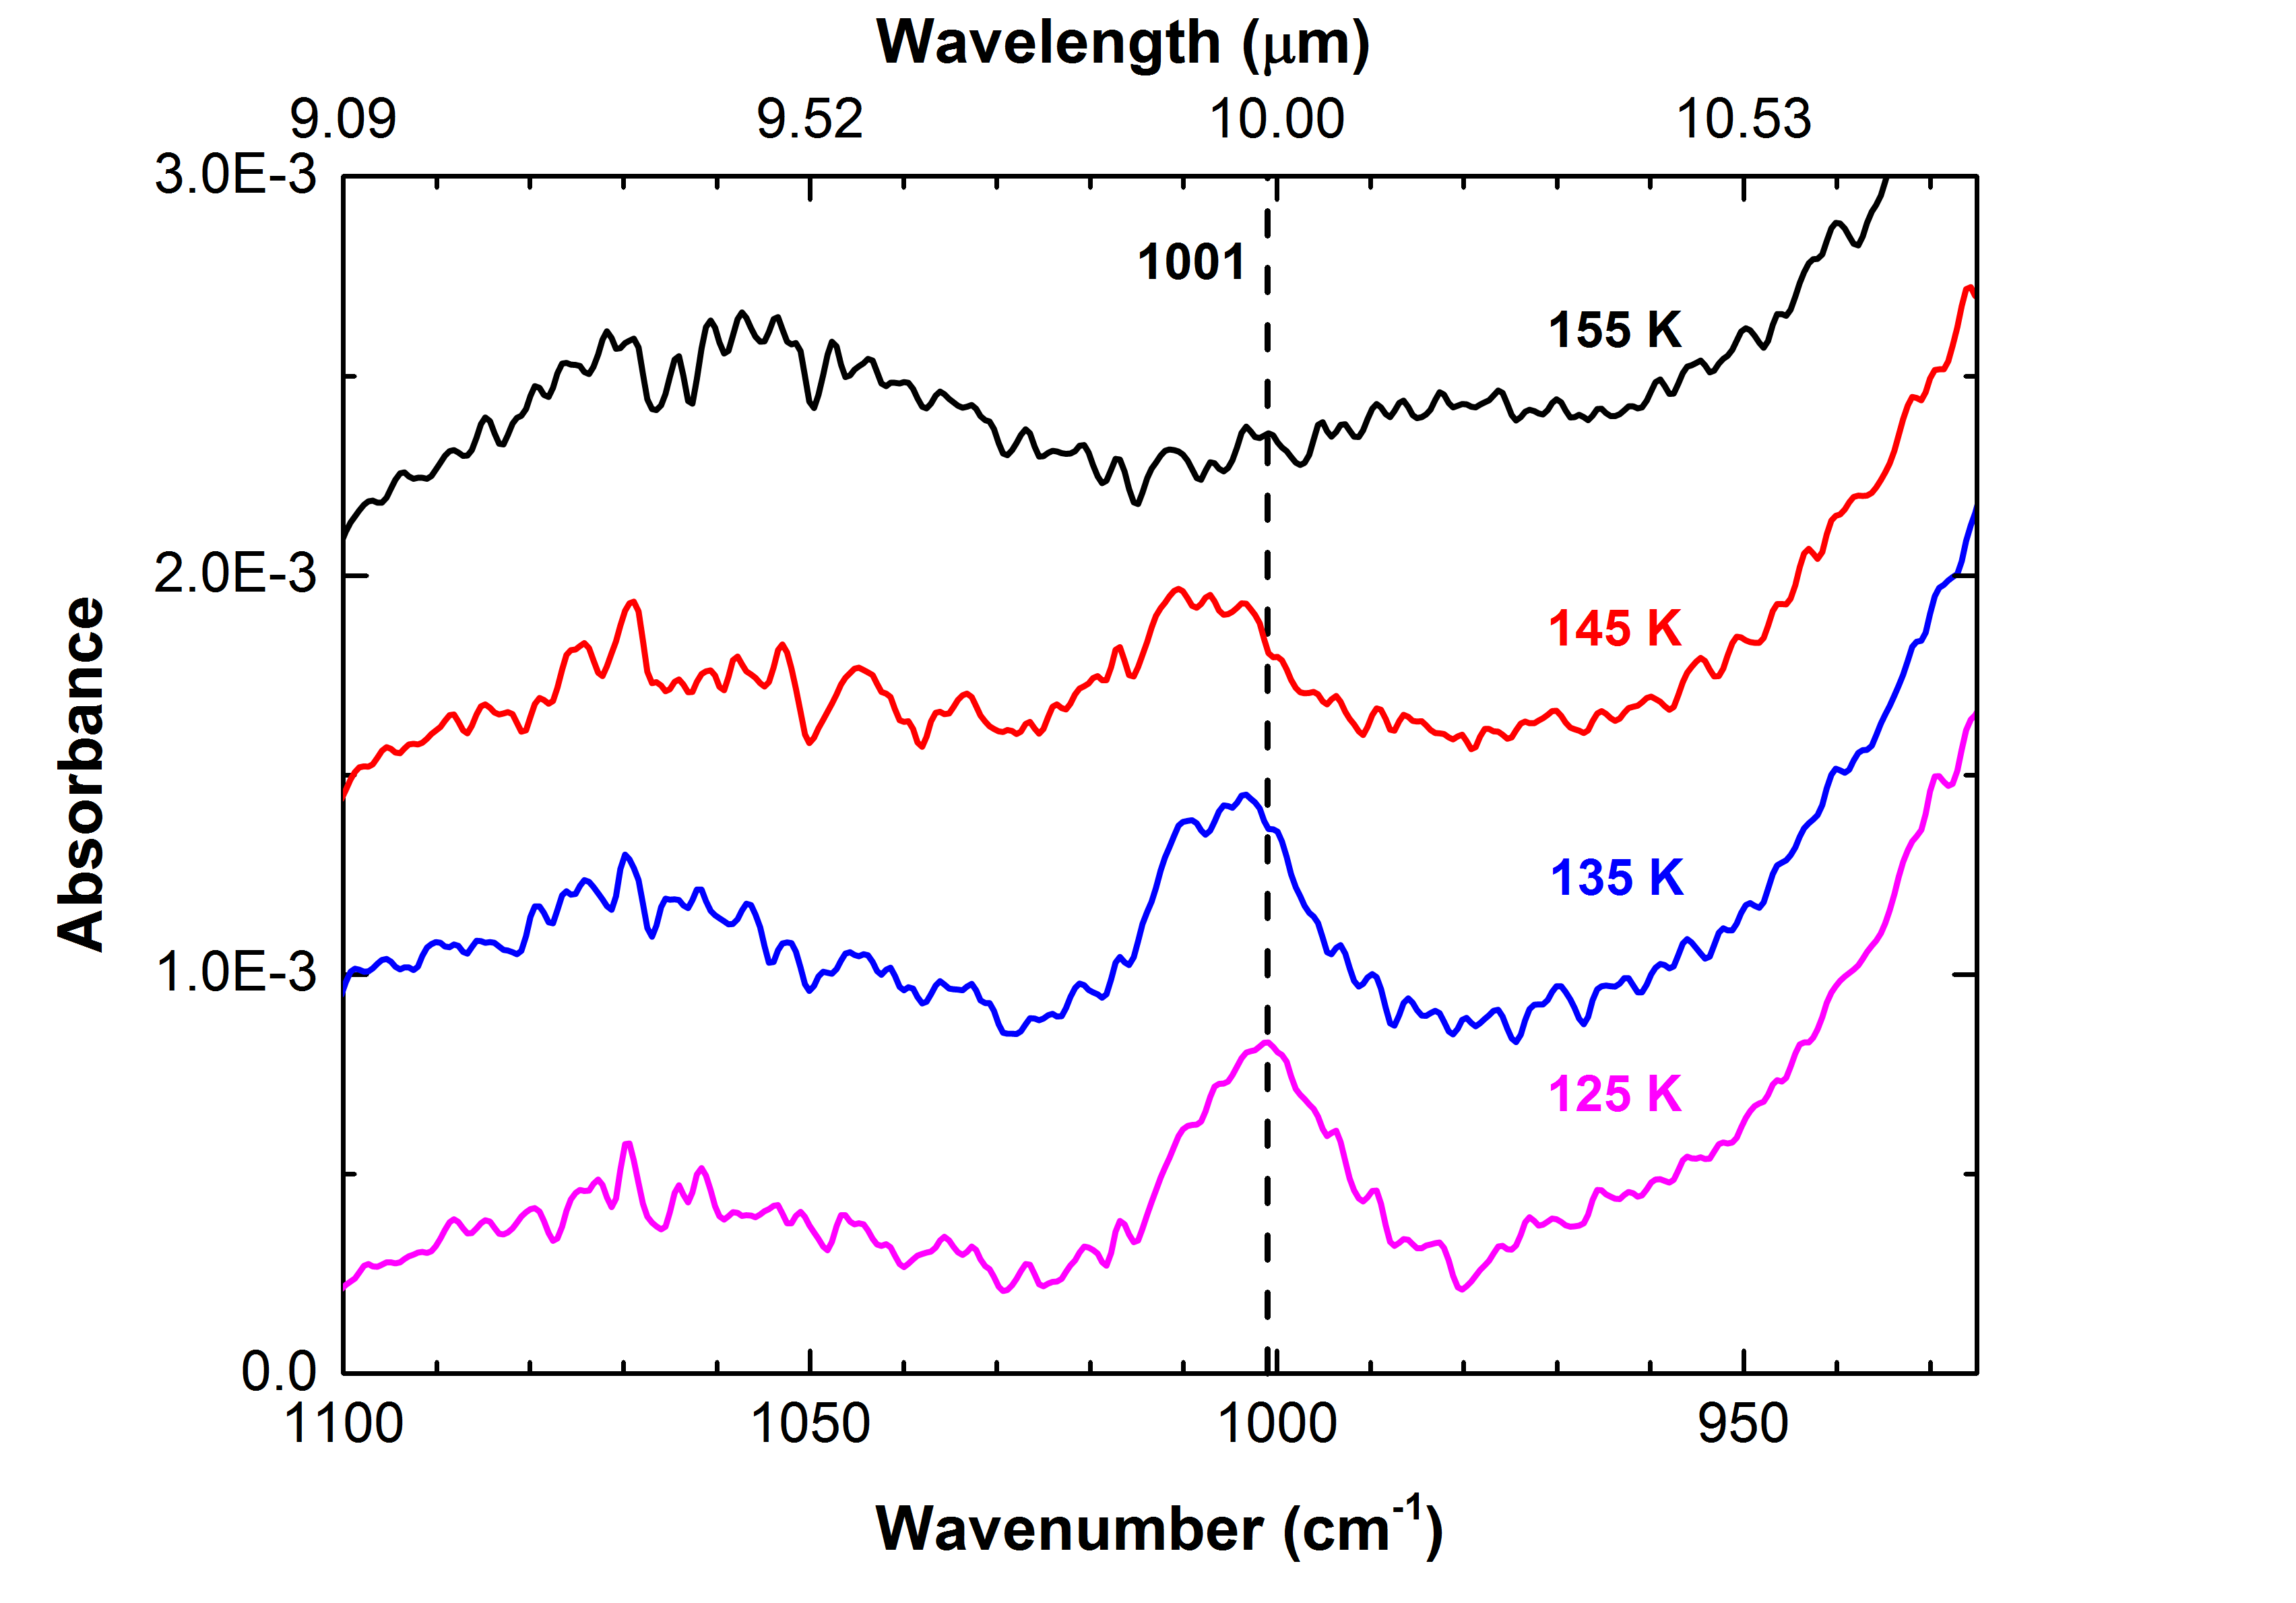
The TPD and RAIRS data can be correlated to one another to match IR features with desorption temperatures to further identify species that are initially made in the ice (i.e., before thermal processing via the TPD technique). Figure 5 shows the change in the IR features as a function of the substrate temperature (i.e., RAIR difference spectra) for the \ceCH4 + H + O2 reaction. In Section 3.1.1 the desorption of \ceCH3OH is observed at 150 K, and in Section 3.1.2 the IR feature at 1001 cm-1 is shown to be due to \ceCH3OH formation. The combination of these two pieces of data tells us that below 150 K, \ceCH3OH should be present in the ice, and above 150 K a majority of the \ceCH3OH should desorb. In Figure 5, the \ceC-O bond feature remains present at a substrate temperature of 145 K and is absent at a substrate temperature of 155 K. This correlates well with the desorption temperature of \ceCH3OH observed in Figure 1 (bottom). Thus, the experiments discussed in Sections 3.1.1, 3.1.2, and 3.1.3 make a consistent case that \ceCH3OH is formed in the ice.
3.2 Spectral signature of \ceCH3OH in a \ceH2O–rich interstellar ice analogue
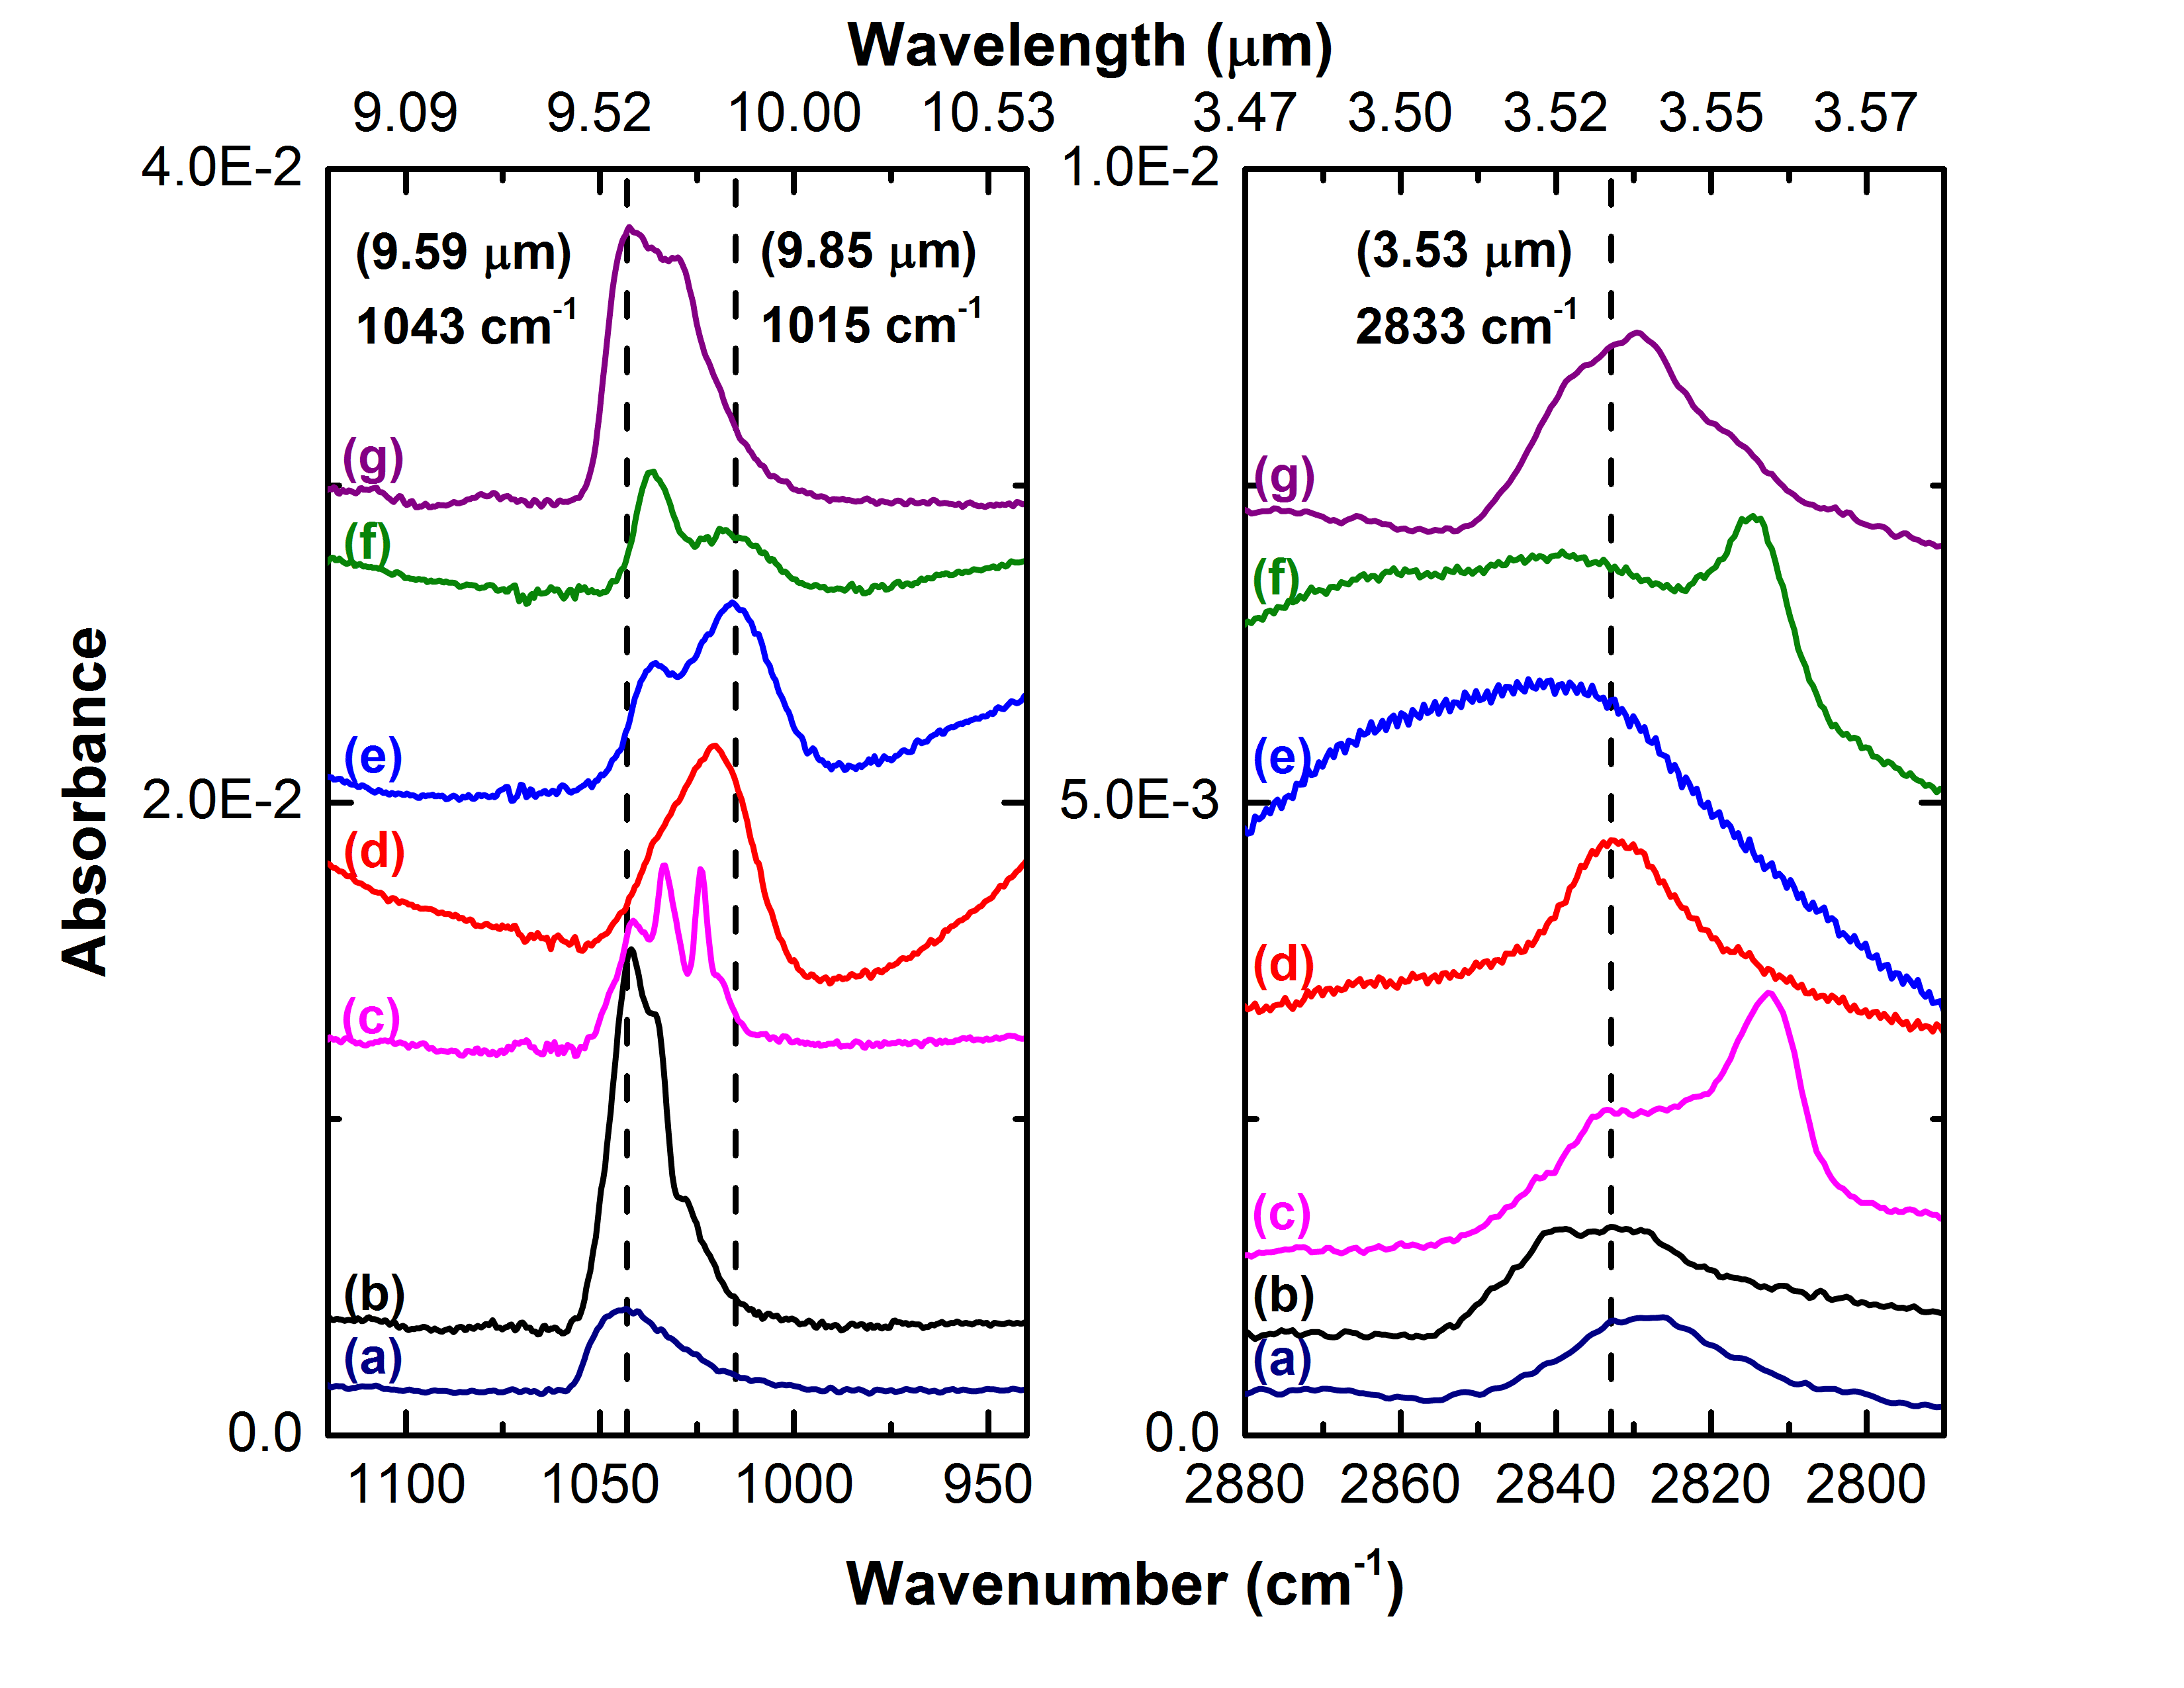
Because the \ceC-O bond of \ceCH3OH is known to be sensitive to its surrounding environment, it holds a potential as a diagnostic tool to provide a deeper insight to the interactions of \ceCH3OH with other species in the \ceH2O–rich interstellar ice analogue. Figure 6 (left) shows a RAIR spectrum of the \ceC-O stretching frequency of pure \ceCH3OH (a) in comparison to \ceCH3OH embedded in an environment originating from the \ceCH4 + H + O2 reaction (f), in addition to \ceCH3OH mixed with other species (b–e, g). Figure 6 (right) shows a RAIR spectrum of the \ceC-H stretch of pure \ceCH3OH; a mode that is a useful tracer of \ceCH3OH ice and can be probed by observational facilities (e.g., JWST NIRSpec). The experiments are performed using both the previously described HABS and a microwave atom source (MWAS), which dissociates a fraction of the incoming molecules into fragments. The fragments can recombine with each other and form products in the ice that would be found in, for example, the \ceCH4 + H + O2 reaction (\ceOH, H, \ceO2, \ceO, \ceH2, \ceH2O2, etc.). The \ceC-O stretching frequency of pure \ceCH3OH is found at 1043 cm-1 and redshifts to 1015 cm-1 in the ice where \ceCH4 and fragments from dissociated \ceH2O are co–deposited. We note that the peak does not redshift to 1001 cm-1, and there is a logical explanation for this. As illustrated in Figure 7 in the study by Dawes et al. (2016), an increase in the \ceH2O concentration in a \ceCH3OH + H2O mixture does not necessarily correlate to a more redshifted \ceC-O stretching frequency. Thus, it is expected that a specific ratio of the ice products in the \ceCH4 + H + O2 reaction is needed in order to recreate the 1001 cm-1 feature. From the spectra presented in Figure 6, it is clear that the largest redshift for the \ceC-O stretch takes place in a \ceH2O–rich ice matrix that contains \ceCH4, \ceH2O, and \ceH2O dissociation products (i.e., the mixture in the actual \ceCH4 + H + O2 experiment; exp. 4.5), as expected. When \ceCH3OH is mixed with a single species, such as \ceH2O or \ceCH4, the \ceC-O stretching frequency does not redshift as much. In conclusion, it is proposed that many, rather than one or two molecular species, interact simultaneously with \ceCH3OH in the \ceCH4 + H + O2 reaction.
3.3 \ceCH3OH formation at 10 and 20 K
As mentioned in Section 2, an absolute value for the \ceCH3OH column density is not obtained in this study. Thus, in order to provide information on the formation yield of \ceCH3OH formed at 10–20 K, a relative yield is obtained by comparing the amount of \ceCH3OH formed at 10 K (exp. 2.0) to the amount of \ceCH3OH formed at 20 K (exp. 5.0). Since it is expected in interstellar space that \ceCH4 and \ceH2O ice are initially formed by hydrogenation reactions (Tielens & Hagen 1982; Öberg et al. 2008; Ioppolo et al. 2008; Cuppen et al. 2010; van Dishoeck et al. 2013), the \ceCH4:\ceH2O ice ratio should not be drastically different between surface temperatures of 10 and 20 K. Therefore, the \ceCH4:\ceH2O ice ratio is kept the same in this temperature range. At 20 K, a 65% decrease in the \ceCH3OH abundance is observed compared to the amount of \ceCH3OH formed at 10 K. This decrease in abundance is expected to be due to the decrease in the H–atom lifetime on the surface (Fuchs et al. 2009; Cuppen et al. 2010), as expected if \ceCH3OH is being formed by the \ceOH radical. Although, it should be noted that the reaction steps for \ceCH3OH formation may also be affected by the temperature change, which can influence the change in the \ceCH3OH abundance.
3.4 Constraining the formation of \ceCH3OH in the overall reaction network
The experiments discussed here show that it is possible to form \ceCH3OH in a \ceH2O–rich environment along the low temperature pathway:
| (1a) | |||
| (1b) |
To observe how these channels fit into the overall reaction network ongoing in \ceH2O–rich ice, the change in abundances of \ceCH3OH and other ice species needs to be tracked (Öberg et al. 2010). Figure 7 shows two RAIR spectra of the reaction, \ceCH4 + H + O2, and the subsequent infrared features pertaining to newly formed \ceCH3OH, \ceH2O, \ceH2O2, and \ceO3. With an enhancement of the \ceO2 flux (dashed line in Figure 7), the \ceCH3OH abundance decreases and the \ceH2O2 and \ceO3 abundances clearly increase. The decrease in the \ceCH3OH abundance at the expense of the \ceH2O2 and \ceO3 abundances gives an indication that the formation channel of \ceCH3OH at least crosses with the formation channels of \ceH2O2 and \ceO3.
The link between the formation of \ceCH3OH, \ceH2O2, and \ceO3 in the \ceH2O–rich ice can be better understood when looking at the reaction network presented by Cuppen et al. (2010). In this study, the \ceH + O2 reaction is extensively discussed, and it is found that the \ceO atom used to react with \ceO2 to form \ceO3 is most likely created by two reactions,
| (2) |
and
| (3a) | |||
| where \ceOH is mainly formed by the following reaction: | |||
| (3b) | |||
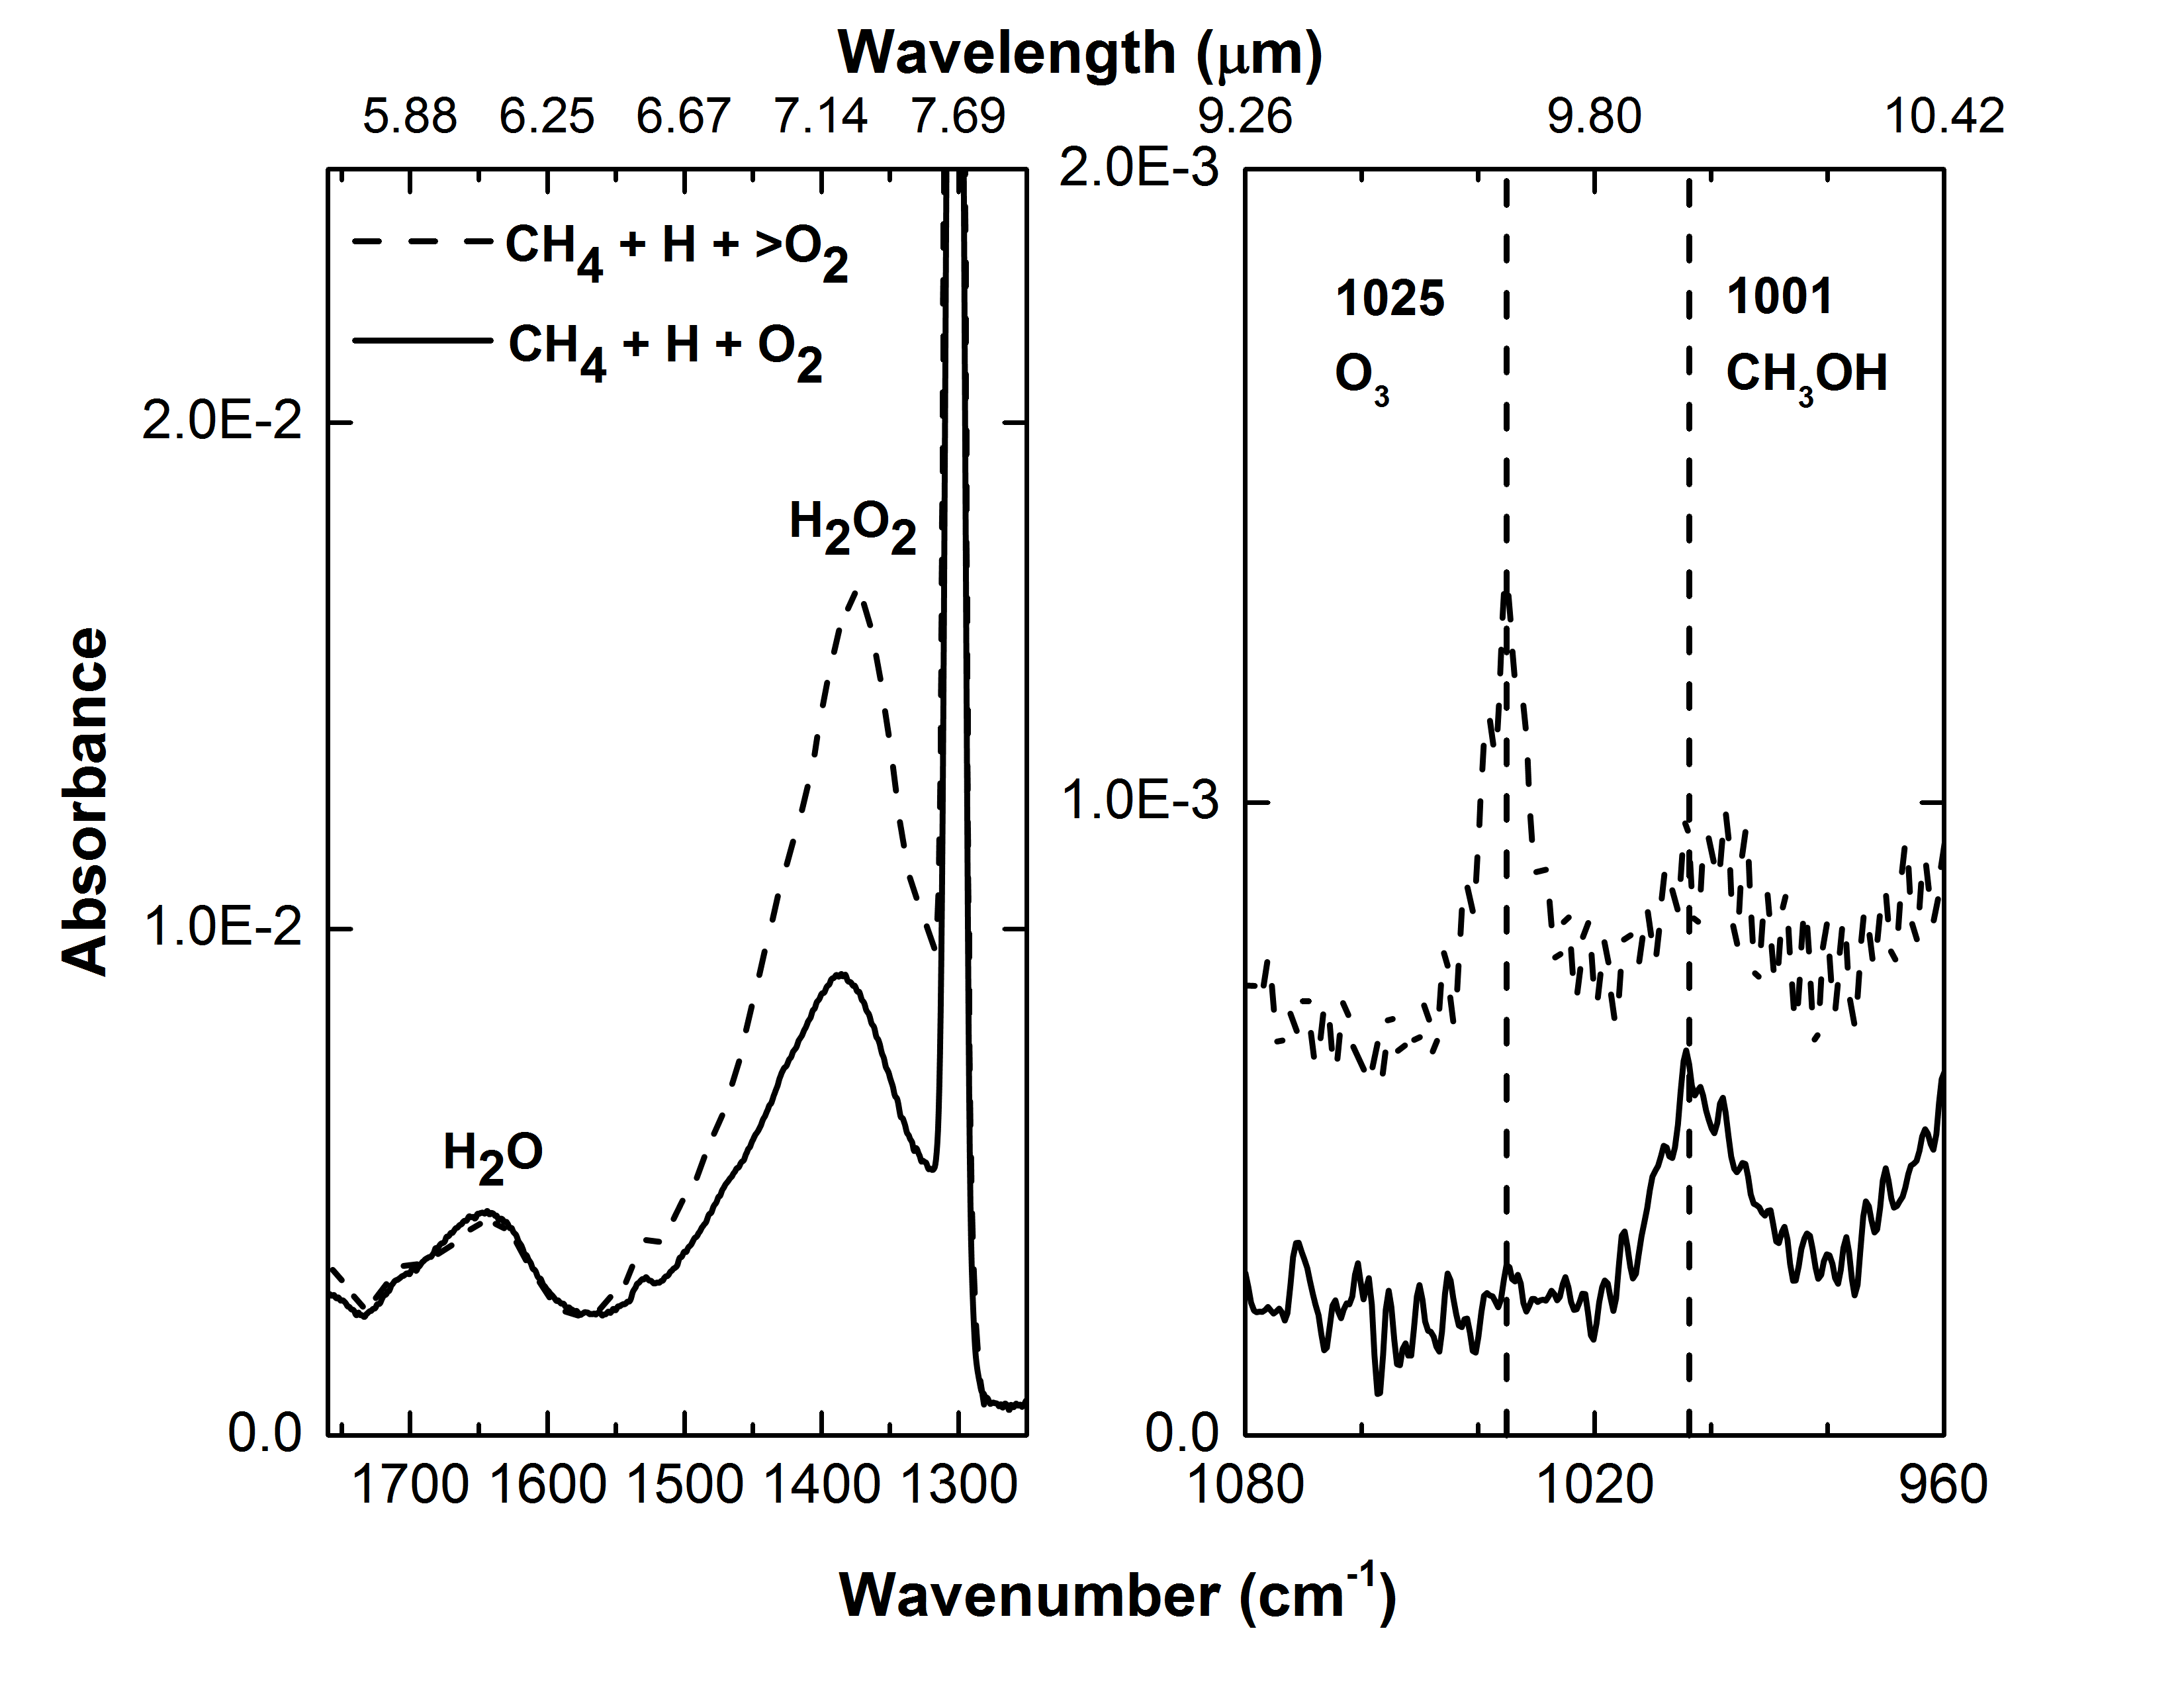
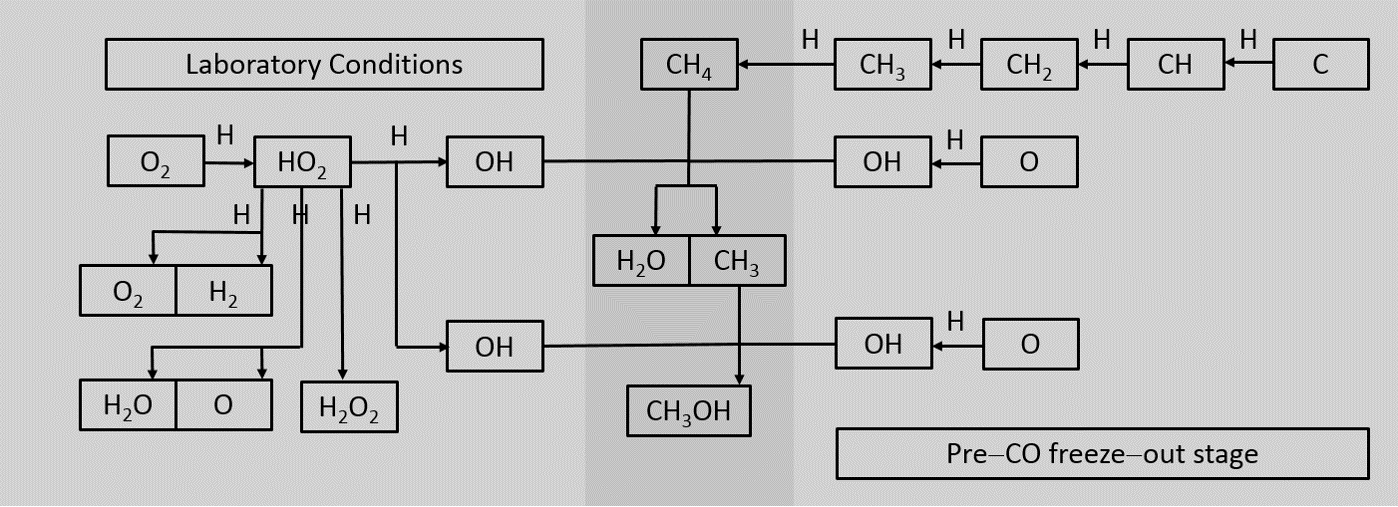
We note that only the relevant steps are discussed here, and the full reaction scheme can be found in Cuppen et al. (2010). The RAIR spectra shown in Figure 7 suggest that the latter reactions are dominant in the \ceCH4 + H + O2 reaction. As observed in Figure 7, a threefold increase in the \ceO2 flux (exp. 2.0 has a threefold increase in the \ceO2 flux compared to exp. 6.0) results in a substantial increase in the \ceH2O2 abundance compared to the change in the \ceH2O abundance. This is consistent with reactions 3a and 3b as \ceHO2 is an intermediate of the \ceH2O2 product; \ceHO2 is also an intermediate of \ceH2O formation, as shown in reaction 2. However, comparison of the two spectra in Figure 7 shows that an increase in the \ceO3 abundance is followed by a significant difference in the \ceH2O2 abundance and a relatively minor change in the \ceH2O abundance, suggesting that reactions 3a and 3b are carried out more efficiently than reaction 2 in the \ceCH4 + H + O2 experiment. Decreasing the \ceCH4 abundance by 20% shows a 10% decrease in the \ceCH3OH abundance and no change in the \ceH2O abundance, which further supports that reaction 2 is not the dominating channel. In addition, reactions 3a and 3b show that \ceO3 is formed by an \ceOH–induced process, and this is expected since \ceCH3OH is formed by an \ceOH–mediated reaction. These insights piece together to demonstrate that reactions 3a and 3b are the likely pathways that connect the formation channel of \ceCH3OH to other formation channels in a \ceH2O–rich ice reaction network. In Figure 8, the laboratory experiments and the astrochemical proposed reactions are summarized in one figure. The main difference between the two is how \ceOH radicals are inserted into the reaction scheme, but this does not change the conclusions derived here for the presented pre–CO freeze–out formation scheme.
4 Astrophysical implications
The experimental work presented here calls into question the at which \ceCH3OH ice starts to grow (i.e., the \ceCH3OH ice formation threshold). If an observational search for the \ceCH3OH ice formation threshold in low extinction (i.e., \ceH2O–rich) environments is to be performed, it would be useful to know beforehand an approximation of the \ceCH3OH abundance in these \ceH2O–rich ices. That way, the amount of \ceCH3OH formed before and after the \ceCO freeze–out stage can be distinguished. A laboratory experiment of \ceCO + H performed under similar conditions to exp. 2.0 shows that the \ceCO:\ceCH3OH ratio is 100:20. In the parallel \ceCH4 + OH experiment, the \ceCH4:\ceCH3OH ratio is 100:1. A comparison of these two experiments leads to the conclusion that the \ceCH4 + OH reaction is 20 times less efficient at producing \ceCH3OH than the \ceCO + H reaction in the laboratory setting. Making the simple assumption that \ceCH3OH is primarily formed by \ceCH4 + OH and \ceCO + H in interstellar ices around the \ceCO freeze–out stage, laboratory data can be combined with observational data to determine the amount of \ceCH3OH in the two different ice phases. According to Boogert et al. (2015), the \ceH2O:\ceCH4 and \ceH2O:\ceCO median ice ratios around low mass young stellar objects (LYSOs) are 100:4.5 and 100:21, respectively. Incorporation of the laboratory results shows that 0.045% of the interstellar ice should contain \ceCH3OH that derives from \ceCH4, and 4.2% of the ice should contain \ceCH3OH that derives from \ceCO. Thus, of the total observed abundance of \ceCH3OH, about 1% of the total amount is the abundance of \ceCH3OH from the \ceCH4 + OH reaction that is expected to be ongoing in the \ceH2O–rich ice phase. Although a \ceCH3OH:\ceH2O percentage of 0.045% may appear insignificant, multiplying this value by the typical \ceH2O ice to \ceH ratio of 2E–5 yields a \ceCH3OH ice to \ceH ratio of 9E–9, which is greater than the abundance of gas–phase \ceCH3OH and other gas–phase species detected in cold cores relative to \ceH2 (Herbst & Van Dishoeck 2009). Using values from the 20 K experiment (exp. 5.0), the \ceCH3OH ice to \ceH ratio results in a value of 3E–9, which is similar to the abundance of gas–phase \ceCH3OH in these particular astrophysical environments. We note that the median ice ratios contain sources that also have a relatively high amount of \ceCO ice, so the calculated values are not entirely representative of low extinction (i.e., \ceH2O–rich ice) scenarios. See Figure 9 for a better approximation of the possible \ceCH3OH abundance in the \ceH2O–rich ice layer at various extinctions.
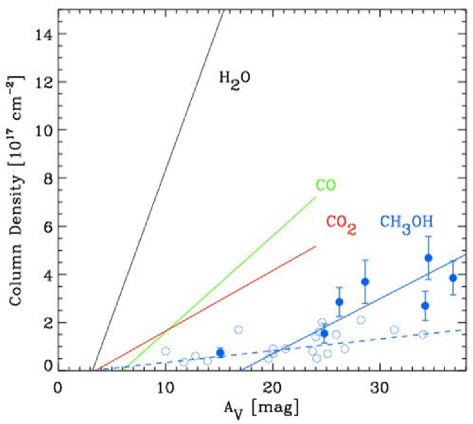
Figure 9, which is adapted from Boogert et al. (2015), shows that \ceCH3OH detections have an ice formation threshold at an value higher than \ceH2O and \ceCO (the ice formation threshold in this figure is the x–axis cut–off divided by 2 because the background stars trace both the front and back sides of the clouds). This is in line with the currently accepted model that \ceCH3OH ice is mainly formed in prestellar cores at ¿ 9 via hydrogenation of accreted \ceCO molecules. However, what is puzzling is that the upper limit sight lines are all below the detections and at similar values to that of the detections. The \ceCH3OH:\ceH2O ratio of 4:100 derived from the laboratory work presented here (from exp. 1.0) is represented by the dashed blue line and is at the level of 3— upper limits. Thus, the current observations are consistent with a \ceCH3OH:\ceH2O ratio of at most a few percent, though likely not as high as 4%, the value seen in our optimized experiments, since \ceH2O is a by–product in the \ceCH4 + H + O2 reaction and is not the main source of \ceH2O in interstellar ices. At this level, a formation threshold as low as that of \ceH2O (1.6 mag) as a result of chemical reactions in \ceH2O–rich ices cannot be excluded. More sensitive observations are needed to further constrain this scenario and with the upcoming launch of the JWST, this soon will be within range.
The insights gained here also link to the formation of larger COMs. Reaction 1 gives rise to the possibility that such a mechanism could lead to the formation of more complex species in \ceH2O–rich ices. It has been shown that COMs such as glycolaldehyde, ethylene glycol, and glycerol can be successfully formed by hydrogenation of \ceCO (Fedoseev et al. 2015, 2017), thus providing a promising reaction scheme for COM formation in \ceCO–rich interstellar ices. Formation of COMs in \ceH2O–rich ices has been less studied, and the mechanism described in this paper could be a potential source of molecular complexity in cold \ceH2O–dominated ice matrices, although formation efficiencies will be lower.
5 Conclusions
The formation of \ceCH3OH by \ceCH4 + OH shown in this laboratory study suggests that \ceCH3OH ice can also be formed before the heavy \ceCO freeze–out stage in prestellar cores, i.e., at ¡ 3 and grain temperatures of 20 K. The main findings from this work are summarized below:
-
◆
The formation of \ceCH3OH in \ceH2O–rich ices occurs by the sequential reactions, \ceCH4 + OH\ceCH3 + H2O and \ceCH3 + OH\ceCH3OH.
-
◆
Since \ceCH4 and \ceOH radicals are expected to be found in the \ceH2O–rich ice phase of cold dense cores, \ceCH3OH is also expected to be found in those ices, suggesting that the \ceCH3OH formation threshold is below = 9.
-
◆
Raising the sample temperature to 20 K results in a 65% decrease in the \ceCH3OH abundance compared to \ceCH3OH formed on a 10 K surface, showing that the formation pathway of \ceCH3OH in this study is relevant to the period of the cold dense core stage at which ice species are formed primarily by atom–induced reactions (i.e., before gas–phase molecules, like CO, accrete onto the grain surface).
-
◆
Under similar experimental parameters, the \ceCO + H channel is about 20 times more efficient to forming \ceCH3OH than the \ceCH4 + OH channel at temperatures around 10 K.
-
◆
More sensitive astronomical observations are warranted to determine the \ceCH3OH:\ceH2O ratio in \ceH2O–rich interstellar ices, which is likely to be a few percent at most, as derived from Figure 9.
-
◆
The formation of COMs under cold dark cloud conditions is mainly linked to the \ceCO freeze–out stage. The reactions studied here carry the potential to lead to the formation of COMs at an earlier astrochemical evolution stage.
Acknowledgements.
This research was funded by the Dutch Astrochemistry Network II (DANII), through a VICI grant of NWO (the Netherlands Organization for Scientific Research), and A–ERC grant 291141 CHEMPLAN. The financial support by NOVA (the Netherlands Research School for Astronomy) and the Royal Netherlands Academy of Arts and Sciences (KNAW) through a professor prize is acknowledged. G.F. acknowledges the financial support from the European Union’s Horizon 2020 research and innovation programme under the Marie Sklodowska–Curie grant agreement n. 664931. S.I. acknowledges the Royal Society for financial support and the Holland Research School for Molecular Chemistry (HRSMC) for a travel grant. D.Q. is thankful to Daniel Harsono, Ewine van Dishoeck, Thanja Lamberts, and Vianney Taquet for enlightening discussions leading to this publication.References
- Allamandola et al. (1992) Allamandola, L., Sandford, S., Tielens, A., et al. 1992, ApJ, 399, 134
- Bergman et al. (2011) Bergman, P., Parise, B., Liseau, R., & Larsson, B. 2011, A&A, 527, A39
- Bergner et al. (2017) Bergner, J. B., Öberg, K. I., & Rajappan, M. 2017, ApJ, 845, 29
- Boogert et al. (2015) Boogert, A. C. A., Gerakines, P. A., & Whittet, D. C. 2015, ARA&A, 53, 541
- Boogert et al. (2011) Boogert, A. C. A., Huard, T., Cook, A., et al. 2011, ApJ, 729, 92
- Boogert et al. (2008) Boogert, A. C. A., Pontoppidan, K. M., Knez, C., et al. 2008, ApJ, 678, 985
- Boogert et al. (1997) Boogert, A. C. A., Schutte, W., Helmich, F., et al. 1997, A&A, 317, 929
- Bossa et al. (2015) Bossa, J.-B., Paardekooper, D., Isokoski, K., & Linnartz, H. 2015, Phys. Chem. Chem. Phys., 17, 17346
- Bottinelli et al. (2010) Bottinelli, S., Boogert, A. A., Bouwman, J., et al. 2010, ApJ, 718, 1100
- Bouilloud et al. (2015) Bouilloud, M., Fray, N., Bénilan, Y., et al. 2015, MNRAS, 451, 2145
- Chiar et al. (1996) Chiar, J., Adamson, A., & Whittet, D. 1996, ApJ, 472, 665
- Chuang et al. (2015) Chuang, K.-J., Fedoseev, G., Ioppolo, S., et al. 2015, MNRAS, 455, 1702
- Chuang et al. (2017) Chuang, K.-J., Fedoseev, G., Qasim, D., et al. 2017, MNRAS, 467, 2552
- Cuppen & Herbst (2007) Cuppen, H. & Herbst, E. 2007, ApJ, 668, 294
- Cuppen et al. (2010) Cuppen, H., Ioppolo, S., Romanzin, C., et al. 2010, Phys. Chem. Chem. Phys., 12, 12077
- Cuppen et al. (2011) Cuppen, H., Penteado, E., Isokoski, K., et al. 2011, MNRAS, 417, 2809
- Cuppen et al. (2009) Cuppen, H., van Dishoeck, E., Herbst, E., et al. 2009, A&A, 508, 275
- Dartois et al. (1999) Dartois, E., Schutte, W., Geballe, T., et al. 1999, A&A, 342, L32
- Dawes et al. (2016) Dawes, A., Mason, N. J., & Fraser, H. J. 2016, Phys. Chem. Chem. Phys., 18, 1245
- d’Hendecourt et al. (1996) d’Hendecourt, L., Jourdain de Muizon, M., Dartois, E., et al. 1996, A&A, 315, L365
- Ennis et al. (2011) Ennis, C., Yuan, H., Sibener, S., et al. 2011, Phys. Chem. Chem. Phys., 13, 17870
- Fedoseev et al. (2017) Fedoseev, G., Chuang, K., Ioppolo, S., et al. 2017, ApJ, 842, 9pp
- Fedoseev et al. (2015) Fedoseev, G., Cuppen, H. M., Ioppolo, S., et al. 2015, MNRAS, 448, 1288
- Friberg et al. (1988) Friberg, P., Hjalmarson, A., Madden, S., et al. 1988, A&A, 195, 281
- Fuchs et al. (2009) Fuchs, G., Cuppen, H., Ioppolo, S., et al. 2009, A&A, 505, 629
- Gálvez et al. (2009) Gálvez, Ó., Maté, B., Herrero, V. J., et al. 2009, ApJ, 703, 2101
- Garrod et al. (2006) Garrod, R., Park, I. H., Caselli, P., et al. 2006, Faraday Discuss., 133, 51
- Geppert et al. (2006) Geppert, W. D., Hamberg, M., Thomas, R. D., et al. 2006, Faraday Discuss., 133, 177
- Gerakines et al. (2005) Gerakines, P. A., Bray, J., Davis, A., et al. 2005, ApJ, 620, 1140
- Gibb et al. (2004) Gibb, E., Whittet, D., Boogert, A., & Tielens, A. 2004, ApJS, 151, 35
- Gibb et al. (2000) Gibb, E., Whittet, D., Schutte, W. a., et al. 2000, ApJ, 536, 347
- Giguere & Harvey (1959) Giguere, P. & Harvey, K. 1959, J. Mol. Spectrosc., 3, 36
- Grim et al. (1991) Grim, R., Baas, F., Greenberg, J., et al. 1991, A&A, 243, 473
- Guzmán et al. (2013) Guzmán, V., Goicoechea, J., Pety, J., et al. 2013, A&A, 560, A73
- Hagen et al. (1981) Hagen, W., Tielens, A., & Greenberg, J. 1981, J. Chem. Phys., 56, 367
- Herbst & Van Dishoeck (2009) Herbst, E. & Van Dishoeck, E. F. 2009, ARA&A, 47, 427
- Herrero et al. (2010) Herrero, V. J., Gálvez, Ó., Maté, B., et al. 2010, Phys. Chem. Chem. Phys., 12, 3164
- Hiraoka et al. (1994) Hiraoka, K., Ohashi, N., Kihara, Y., et al. 1994, Chem. Phys. Lett., 229, 408
- Hodyss et al. (2009) Hodyss, R., Johnson, P. V., Stern, J. V., et al. 2009, Icarus, 200, 338
- Hudgins et al. (1993) Hudgins, D., Sandford, S., Allamandola, L., et al. 1993, ApJS, 86, 713
- Ioppolo et al. (2008) Ioppolo, S., Cuppen, H., Romanzin, C., et al. 2008, ApJ, 686, 1474
- Ioppolo et al. (2010) Ioppolo, S., Cuppen, H., Romanzin, C., et al. 2010, Phys. Chem. Chem. Phys., 12, 12065
- Ioppolo et al. (2013) Ioppolo, S., Fedoseev, G., Lamberts, T., et al. 2013, Rev. Sci. Instrum., 84, 073112
- Kolasinski (2012) Kolasinski, K. W. 2012, Surface science: foundations of catalysis and nanoscience (John Wiley & Sons)
- Lamberts et al. (2013) Lamberts, T., Cuppen, H. M., Ioppolo, S., et al. 2013, Phys. Chem. Chem. Phys., 15, 8287
- Lamberts et al. (2017) Lamberts, T., Fedoseev, G., Kästner, J., et al. 2017, A&A, 599, A132
- Lannon et al. (1971) Lannon, J. A., Verderame, F. D., & Anderson Jr, R. W. 1971, J. Chem. Phys., 54, 2212
- Linnartz et al. (2015) Linnartz, H., Ioppolo, S., & Fedoseev, G. 2015, Int. Rev. Phys. Chem., 34, 205
- Loeffler et al. (2006) Loeffler, M., Raut, U., Vidal, R., et al. 2006, Icarus, 180, 265
- Maity et al. (2014) Maity, S., Kaiser, R. I., & Jones, B. M. 2014, Faraday Discuss., 168, 485
- Martín-Doménech et al. (2014) Martín-Doménech, R., Caro, G. M., Bueno, J., & Goesmann, F. 2014, A&A, 564, A8
- Martín-Doménech et al. (2016) Martín-Doménech, R., Caro, G. M., & Cruz-Díaz, G. 2016, A&A, 589, A107
- Moore & Hudson (1998) Moore, M. & Hudson, R. 1998, Icarus, 135, 518
- Oba et al. (2012) Oba, Y., Watanabe, N., Hama, T., et al. 2012, ApJ, 749, 67
- Öberg et al. (2011) Öberg, K. I., Boogert, A. A., Pontoppidan, K. M., et al. 2011, ApJ, 740, 109
- Öberg et al. (2008) Öberg, K. I., Boogert, A. A., Pontoppidan, K. M., et al. 2008, ApJ, 678, 1032
- Öberg et al. (2014) Öberg, K. I., Fayolle, E. C., Reiter, J. B., & Cyganowski, C. 2014, Faraday Discuss., 168, 81
- Öberg et al. (2009) Öberg, K. I., Garrod, R. T., van Dishoeck, E. F., et al. 2009, A&A, 504, 891
- Öberg et al. (2010) Öberg, K. I., van Dishoeck, E. F., Linnartz, H., & Andersson, S. 2010, ApJ, 718, 832
- Paardekooper et al. (2016) Paardekooper, D., Fedoseev, G., Riedo, A., et al. 2016, A&A, 596, A72
- Parise et al. (2002) Parise, B., Ceccarelli, C., Tielens, A., et al. 2002, A&A, 393, L49
- Penteado et al. (2015) Penteado, E., Boogert, A., Pontoppidan, K., et al. 2015, MNRAS, 454, 531
- Pontoppidan (2006) Pontoppidan, K. M. 2006, A&A, 453, L47
- Pontoppidan et al. (2003) Pontoppidan, K. M., Dartois, E., van Dishoeck, E. F., Thi, W.-F., & d’Hendecourt, L. 2003, A&A, 404, L17
- Romanzin et al. (2011) Romanzin, C., Ioppolo, S., Cuppen, H., et al. 2011, J. Chem. Phys., 134, 084504
- Schutte (1988) Schutte, W. 1988, Leiden: Rijksuniversiteit, 1988
- Skinner et al. (1992) Skinner, C., Tielens, A., Barlow, M., et al. 1992, ApJ, 399, L79
- Taban et al. (2003) Taban, I., Schutte, W., Pontoppidan, K., et al. 2003, A&A, 399, 169
- Taquet et al. (2015) Taquet, V., López-Sepulcre, A., Ceccarelli, C., et al. 2015, ApJ, 804, 81
- Teolis et al. (2007) Teolis, B., Loeffler, M., Raut, U., et al. 2007, Icarus, 190, 274
- Tielens & Hagen (1982) Tielens, A. & Hagen, W. 1982, A&A, 114, 245
- Tschersich (2000) Tschersich, K. 2000, J. Appl. Phys., 87, 2565
- Tschersich et al. (2008) Tschersich, K., Fleischhauer, J., & Schuler, H. 2008, J. Appl. Phys., 104, 034908
- Tschersich & Von Bonin (1998) Tschersich, K. & Von Bonin, V. 1998, J. Appl. Phys., 84, 4065
- Turner (1998) Turner, B. 1998, ApJ, 501, 731
- van Dishoeck (2017) van Dishoeck, E. F. 2017, arXiv preprint arXiv:1710.05940
- van Dishoeck et al. (2013) van Dishoeck, E. F., Herbst, E., & Neufeld, D. A. 2013, Chem. Rev., 113, 9043
- Vandenbussche et al. (1999) Vandenbussche, B., Ehrenfreund, P., Boogert, A., et al. 1999, A&A, 346, L57
- Wada et al. (2006) Wada, A., Mochizuki, N., & Hiraoka, K. 2006, ApJ, 644, 300
- Watanabe & Kouchi (2002) Watanabe, N. & Kouchi, A. 2002, ApJL, 571, L173
- Weber et al. (2009) Weber, A. S., Hodyss, R., Johnson, P. V., et al. 2009, ApJ, 703, 1030
- Wirström et al. (2011) Wirström, E., Geppert, W. D., Hjalmarson, Å., et al. 2011, A&A, 533, A24
- Zins et al. (2012) Zins, E.-L., Pirim, C., Joshi, P. R., et al. 2012, J. Phys. Chem. A, 116, 12357