11email: jykim@mpifr-bonn.mpg.de 22institutetext: Korea Astronomy and Space Science Institute, 776 Daedeokdae-ro, Yuseong-gu, Daejeon, 30455, Korea 33institutetext: Korea University of Science and Technology, 217 Gajeong-ro, Yuseong-gu, Daejeon 34113, Korea 44institutetext: Department of Physics and Astronomy, Seoul National University, 1 Gwanak-ro, Gwanak-gu, Seoul 08826, Korea
Long-term millimeter VLBI monitoring of M 87 with KVN
at milliarcsecond resolution: nuclear spectrum
We study the centimeter- to millimeter-wavelength synchrotron spectrum of the core of the radio galaxy M 87 at spatial scales using four years of fully simultaneous, multi-frequency VLBI data obtained by the Korean VLBI Network (KVN). We find a core spectral index of () between 22 GHz and 129 GHz. By combining resolution-matched flux measurements from the Very Long Baseline Array (VLBA) at 15 GHz and taking the Event Horizon Telescope (EHT) 230 GHz core flux measurements in epochs 2009 and 2012 as lower limits, we find evidence of a nearly flat core spectrum across 15 GHz and 129 GHz, which could naturally connect the 230 GHz VLBI core flux. The extremely flat spectrum is a strong indication that the jet base does not consist of a simple homogeneous plasma, but of inhomogeneous multi-energy components, with at least one component with the turn-over frequency GHz. The spectral shape can be qualitatively explained if both the strongly (compact, optically thick at 100 GHz) and the relatively weakly magnetized (more extended, optically thin at 100 GHz) plasma components are colocated in the footprint of the relativistic jet.
Key Words.:
Galaxies: active — Galaxies: individual: M 87 — Techniques: interferometric1 Introduction
Located at 16.7 Mpc (Bird et al., 2010) from the Milky Way, M 87 is one of the nearest radio galaxies that contains an extraordinary massive central black hole (Gebhardt et al., 2011) 111 Some studies suggest a twice lower value of (e.g., Walsh et al. 2013). In order to be consistent with other VLBI studies of M 87, we adopt .. The close distance and the large provides an excellent spatial resolution (1 milli-arcsecond pc or 140 Schwarzschild radii ()). This makes M 87 a more than suitable target for observing and studying physical conditions in the relativistic jet launching, collimation, and acceleration region by very long baseline interferometry (VLBI) observations (Kovalev et al., 2007; Ly et al., 2007; Hada et al., 2011; Asada & Nakamura, 2012; Doeleman et al., 2012; Hada et al., 2016; Mertens et al., 2016; Kim et al., 2016; Walker et al., 2016).
The electron energy distribution and the magnetic field strength near the central engine are critical elements in relativistic jet launching models (e.g., Blandford & Znajek 1977; Blandford & Payne 1982). In particular, a stronger magnetic field helps effective jet formation (see Yuan & Narayan 2014 for a review). These models prefer a significantly inverted or at least flat synchrotron spectrum up to GHz (Broderick & Loeb, 2009; Kino et al., 2015; Punsly, 2017). A high turn-over frequency like this would imply a strong magnetic field strength G in the jet base (Kino et al., 2015). However, the previous studies of M 87 are based on data from vastly different observing times and spatial scales.
For this reason, simultaneous multi-frequency VLBI observations of M 87 in the millimeter regime can provide better observational constraints for the theoretical models. However, such an observation has been challenging. One of the main difficulties has been the limited frequency coverage offered by most VLBI observatories ( GHz=3.5 mm; Hada et al. 2016; Kim et al. 2016). Recent Event Horizon Telescope (EHT) observations studied M 87 at 230 GHz (1.3 mm; e.g., Doeleman et al. 2012), but the large frequency gap between 86 and 230 GHz and technical difficulties for submillimeter VLBI remain challenging. Furthermore, the VLBI core of M 87 varies in flux on timescales of at least weeks, especially during the ejection of a new VLBI feature from the core region (e.g., Acciari et al. 2009; Hada et al. 2014). The long-term variability properties in this frequency range are also poorly known.
In this letter, we present a study of the M 87 VLBI core spectrum based on the fully simultaneously measured core flux at 22, 43, 86 GHz and up to 129 GHz by the Korean VLBI Network (KVN) over the past four years. We especially investigate the core spectrum at short millimeter-wavelengths and attempt to clarify whether the nuclear region has a significantly inverted or steep spectrum.
2 Observations and data processing
| Epoch | MJD | ||||||||
| (yyyy-mm-dd) | (GHz) | (Jy) | (Jy/beam) | (mas) | (mJy/beam) | (mas) | (mas) | (deg) | |
| (1) | (2) | (3) | (4) | (5) | (6) | (7) | (8) | (9) | (10) |
| 2012-12-04 | 56265 | 21.7 | 1.70.2 | 1.70.1 | 10.0 | 5.70 | 3.22 | 68.0 | |
| 43.4 | 1.30.2 | 1.30.1 | 9.0 | 2.84 | 1.61 | 66.3 | |||
| 86.8 | 1.10.2 | 1.10.1 | 0.180.02 | 13.9 | 1.39 | 0.83 | 67.0 | ||
| 2013-01-16 | 56308 | 21.7 | 1.90.2 | 1.80.1 | 0.910.06 | 8.0 | 5.33 | 3.32 | 79.5 |
M 87 was monitored regularly by the KVN between Dec 2012 and Dec 2016 (31 epochs) as one of the samples included in the interferometric monitoring of gamma-ray bright AGN (iMOGABA) program (e.g., Lee et al. 2016)333 http://radio.kasi.re.kr/sslee/ . The observations were performed simultaneously at four observing frequencies of 21.700 - 21.764 GHz (K band), 43.400 - 43.464 GHz (Q band), 86.800 - 86.864 GHz (W band), and 129.300 - 129.364 GHz (D band). Each band has 64 MHz of total bandwidth. The source was observed in left-circular polarization. Details on the iMOGABA program (data acquisition, correlation, post-processing, and calibration, especially concerning the frequency-phase transfer) are provided elsewhere (see Lee et al. 2015; Algaba et al. 2015; Hodgson et al. 2016; Lee et al. 2016). Owing to the frequency-phase transfer technique, we detected fringes at the higher frequency bands (e.g., 86GHz and 129GHz). After detection of the fringes, we averaged the calibrated data in 30 s intervals at K and Q band, and in 10 s intervals at W and D band to avoid amplitude loss from decoherence. Occasional station or receiver problems and poor weather conditions led to unreliable amplitude and large residual phase errors in a certain portion of the data, especially at D band. We excluded these data in the further analysis.
We used the Difmap package (Shepherd et al., 1994) for imaging using clean and phase self-calibration loops, applying natural weighting (no amplitude self-calibration because there are only three KVN stations). An asymmetric and extended jet structure was revealed at 22 and 43 GHz by excess of fluxes in the dirty map and also by non-zero closure phases. However, the 86 and 129 GHz data did not show a clear signature of extended jet emission (see Fig. 2 in Lee et al. 2016 for typical visibility distributions and source images). We fitted a circular Gaussian to the self-calibrated visibilities using the Modelfit procedure in Difmap to estimate the total flux density (in Jy), the FWHM size (in mas), and the peak flux density (in mJy/beam) of the core. We estimated uncertainties in the model-fit parameters and practical resolution limit of the array by following Lee et al. (2016), accounting for the effect of the finite signal-to-noise ratio (S/N) that varies from session to session. At D band, the systematic flux uncertainty can be as large as 30% (Lee et al., 2016) because of large residual phase errors. Therefore, we take the 30% as a conservative flux uncertainty at 129 GHz. We also investigated possible amplitude loss at D band due to the decoherence by averaging the data over different timescales (from 2 s to 60 s) and measuring the peak intensity in the clean image. We found that the 10 s averaging can cause % of amplitude loss. This is not significant compared to the 30% flux uncertainty. Thus, we ignore the decoherence in the following discussions.
3 Results and analysis
3.1 Core model-fit properties
In Table 1 we show a summary of the observations and the results of the core flux measurements. We find that 45%, 65%, 76%, and 38% of all the model components are spatially resolved at K, Q, W, and D band, respectively. The mean FWHM sizes of the resolved components are , , , and mas at K, Q, W, and D bands, where the uncertainties correspond to the standard deviation of each distributions. Higher resolution VLBI observations show that the source consists of a more compact core and an extended, complex jet (Kovalev et al., 2007; Ly et al., 2007; Hada et al., 2016; Kim et al., 2016). Therefore, the KVN multi-frequency observations probe synchrotron emission from the mixed structure on scales smaller than mas (equivalently projected linear size).
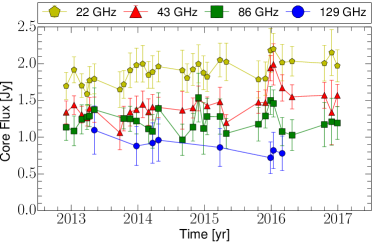
Our multi-frequency light curves are shown in Fig. 1. The core does not show significant flux variability over 1 during most of the observing epochs. However, we note that the core flux increased from Jy to Jy at 43 GHz and similarly at 22 and 86 GHz in the beginning of 2016. A study of this flux enhancement will be presented in a forthcoming publication. The time-averaged core flux (including both resolved and unresolved components) are , , , and Jy at K, Q, W, and D band, respectively. These values are broadly consistent with previously reported flux values of the M 87 nuclear region on a similar spatial scale. For instance, the KVN Q-band flux ( Jy) is comparable to the M 87 core flux measured within 1.2 mas from the intensity peak by the Very Long Baseline Array (VLBA) 43 GHz observations ( Jy; Acciari et al. 2009).
3.2 Synchrotron spectrum analysis
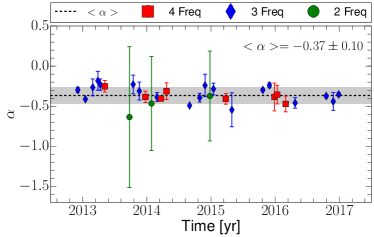
Based on the absence of a significant synchrotron peak between 22-129 GHz and given a total of four frequencies available, we modeled the core spectrum by a single power-law, that is, , where is the optically thin spectral index (negative for optically thin plasma). In each epoch, we used the core flux from as many available frequencies as possible. In Fig. 2 we show the spectral index light curve and in Fig. 3 the core flux versus the frequency. The spectral index shows some oscillatory pattern with a 1 yr timescale and a weak trend of spectral steepening over a longer period. By averaging the spectral index light curve, we obtained the mean spectral index , which corresponds to a mildly steep spectrum.
However, we note that the limited coverage of KVN could have a significant effect on the core spectral index measurement because of the different array sensitivity to extended emission at different frequencies. In order to study the effect of the coverage, we have performed a dedicated imaging simulation (see the appendix). We find that an artificial spectral steepening of could be possible for the M 87-like jet structure only due to the -coverage effect (equivalent to % of flux decrease from 22 to 129 GHz). Furthermore, M 87 has a substantially extended jet, whose spectrum is quite steep already at mas core separation (; Hovatta et al. 2014; Hada et al. 2016). Therefore, the structure blending effect could make the KVN M 87 core spectrum steeper even if the intrinsic spectrum is nearly flat. Considering the imaging simulation results, we conclude that the true spectrum of the jet base region is substantially flat up to 129 GHz.
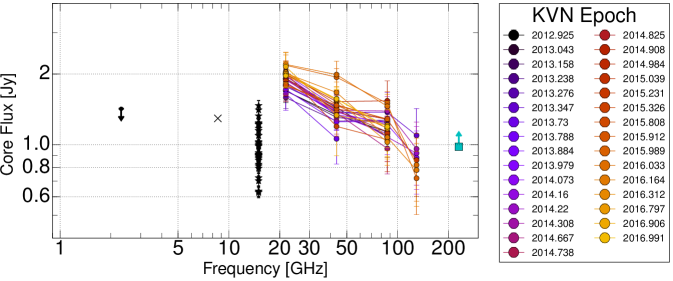
We verified this conclusion by comparing non-simultaneous M 87 core flux information that is available from earlier publications. Here we specifically paid attention to the different resolutions of different observations in order to compare the fluxes on a comparable angular resolution. First, Pushkarev & Kovalev (2012) reported an 8.6 GHz core flux of Jy and an FWHM size of mas. The authors also reported a 2.3 GHz core flux of Jy and an FWHM size of mas along the major axis of an elliptical Gaussian. Second, we made use of the M 87 core information provided by the MOJAVE program (Lister et al. 2016; 34 epochs of VLBA 15 GHz). The time-averaged core flux and the FWHM size are Jy and 0.260.04 mas, respectively. Finally, we refer to the 230 GHz EHT observations in epochs 2009 (Doeleman et al., 2012) and 2012 (Akiyama et al., 2015). At this frequency, an ultra-compact plasma (as) has a flux of Jy. We take the 2.3 GHz flux as the upper limit since the 2.3 GHz size is an order-of-magnitude larger with regard to the KVN results. For similar reasons, we regard the EHT flux as the lower limit at 230 GHz.
We find that the global radio spectrum of the core is considerably flat without a clear signature of inverted or steep spectra (Fig. 3). In particular, the long-term 15 GHz core flux is quite comparable to our four-year measurements made by the KVN at 86 and 129 GHz. Since the angular resolution of the KVN at short millimeter wavelengths is comparable to that of VLBA at 15 GHz, we can calculate a non-simultaneous but resolution-matched spectral index, finding between 15-129 GHz. Such a flat spectrum agrees with the 230 GHz flux lower limit constrained by the EHT observations. Although the 22 GHz KVN flux appears slightly high compared to the 15 GHz flux, we note that this is most likely due to the blending effect we mentioned in Sect. 3.1. The resolution-matched core flux between 5-22 GHz indeed shows a substantially flat spectrum within mas from the intensity peak (see Fig. 4 of Hada et al. 2012). Therefore, we conclude that the M 87 core on a submilliarcsecond scale has a substantially flat radio spectrum between 15-129 GHz and possibly up to 230 GHz.
4 Discussion
4.1 Comparison with theoretical predictions
It has been routinely considered that featureless flat spectra of extragalactic jet sources are made by inhomogeneous plasma consisting of multiple components with different turn-over frequencies (i.e., “cosmic conspiracy”; Cotton et al. 1980). Our KVN data do not allow for a reliable spectral decomposition because they lack spatial resolution. However, the flat spectrum up to at least 129 GHz suggests the coexistence of qualitatively different plasma with low (100 GHz) and high synchrotron peak frequencies (100 GHz). We can interpret the latter based on theoretical studies of energetics of relativistic plasma near the central engine of M 87. This connection is provided by the fact that synchrotron radiation from the core region of M 87 at short millimeter wavelengths originates from the vicinity of its central BH (Hada et al., 2011). In this regard, a peak frequency higher than 100 GHz supports the broadly investigated idea about a jet dominated by magnetic energy that is launched at the base of the M 87 jet (Broderick & Loeb, 2009; Kino et al., 2015; Punsly, 2017).
The underlying flat spectrum in the intermediate frequency range ( GHz) is also interesting. This cannot be easily explained by the expanding jet because the jet has a turn-over frequency below 24 GHz already at a core distance of mas (Hada et al., 2016). Interestingly, Kino et al. (2015) showed that a single, homogeneous, ultra-compact (as), and fully synchrotron self-absorbed (SSA) plasma at 230 GHz would cause problems for several reasons. The authors specifically demonstrated that the compact size and the high turn-over frequency imply a magnetic field strength of G. This value leads to an unrealistically great electromagnetic jet power and extremely short synchrotron cooling timescale, which contradicts observations (e.g., Doeleman et al. 2012). Based on this, the authors suggested that the jet base region consists of at least two zones with different levels of magnetization, which could produce another synchrotron peak in the intermediate-frequency regime.
4.2 Constraining the turn-over frequency of the magnetic energy dominated plasma
Because we lack direct flux measurements between 129 and 230 GHz, it is unclear whether the highest turn-over frequency can be even higher than 230 GHz or if the entire jet base becomes optically thin at 230 GHz. In the latter case, Kino et al. (2015) suggested the spectrum turn-over to be at 160 GHz (see Fig. 5 therein) and a very steep spectrum () between 160 and 230 GHz. In order to examine the latter case, we took the 129 GHz core flux of Jy from the KVN data as an upper limit for the 129 GHz flux on the EHT-scale region (as). We also assumed a flat spectrum between 129 and 160 GHz, but a steep spectrum between 160 and 230 GHz. This gives the 230 GHz flux upper limit at 230 GHz of 0.9 Jy Jy. Even a much more moderate steep spectral index predicts 0.9 Jy Jy at 230 GHz. These fluxes are not sufficient to explain the 230 GHz flux measured by the EHT observations. Therefore, we favor the former scenario.
5 Summary
In this letter, we have presented a study of the synchrotron spectrum of the nuclear region in M 87 by KVN VLBI monitoring observations that have been regularly performed over four years at 22, 43, 86, and 129 GHz. The KVN observations resolved the core at a projected linear size of mas. The KVN data constrained the core spectral index between 22-129 GHz. Other resolution-matched multi-frequency observations suggest the flat spectrum over a wider range of frequency (15-230 GHz). The flat spectrum extending up to short millimeter wavelengths implies a strong magnetization in the jet base, consistent with the theoretical predictions (e.g., Broderick & Loeb 2009; Kino et al. 2015). Therefore, we suggest a magnetically dominated jet-launching scenario for M 87.
Acknowledgements.
We thank the anonymous referee for the careful reading and valuable comments that helped us to improve the paper. J.-Y. Kim is supported for this research by the International Max Planck Research School (IMPRS) for Astronomy and Astrophysics at the University of Bonn and Cologne. J.-Y. Kim would like to thank Eduardo Ros, Manel Perucho, and Christian Fromm for fruitful discussions. S.-S. Lee was supported by the National Research Foundation of Korea (NRF) grant funded by the Korea government (MSIP) (No. NRF-2016R1C1B2006697). G.-Y. Zhao is supported by the Korea Research Fellowship Program through the National Research Foundation of Korea (NRF) funded by the Ministry of Science and ICT (NRF-2015H1D3A1066561). We are grateful to all staff members in KVN who helped to operate the array and to correlate the data. The KVN is a facility operated by KASI (Korea Astronomy and Space Science Institute). The KVN operations are supported by KREONET (Korea Research Environment Open NETwork) , which is managed and operated by KISTI (Korea Institute of Science and Technology Information). This research has made use of data from the MOJAVE database that is maintained by the MOJAVE team (Lister et al., 2009).References
- Acciari et al. (2009) Acciari, V. A., Aliu, E., Arlen, T., et al. 2009, Science, 325, 444
- Akiyama et al. (2015) Akiyama, K., Lu, R.-S., Fish, V. L., et al. 2015, ApJ, 807, 150
- Algaba et al. (2015) Algaba, J.-C., Zhao, G.-Y., Lee, S.-S., et al. 2015, Journal of Korean Astronomical Society, 48, 237
- Asada & Nakamura (2012) Asada, K. & Nakamura, M. 2012, ApJ, 745, L28
- Bird et al. (2010) Bird, S., Harris, W. E., Blakeslee, J. P., & Flynn, C. 2010, A&A, 524, A71
- Blandford & Payne (1982) Blandford, R. D. & Payne, D. G. 1982, MNRAS, 199, 883
- Blandford & Znajek (1977) Blandford, R. D. & Znajek, R. L. 1977, MNRAS, 179, 433
- Broderick & Loeb (2009) Broderick, A. E. & Loeb, A. 2009, ApJ, 697, 1164
- Cotton et al. (1980) Cotton, W. D., Wittels, J. J., Shapiro, I. I., et al. 1980, ApJ, 238, L123
- Doeleman et al. (2012) Doeleman, S. S., Fish, V. L., Schenck, D. E., et al. 2012, Science, 338, 355
- Fromm et al. (2013) Fromm, C. M., Ros, E., Perucho, M., et al. 2013, A&A, 557, A105
- Gebhardt et al. (2011) Gebhardt, K., Adams, J., Richstone, D., et al. 2011, ApJ, 729, 119
- Greisen (1990) Greisen, E. W. 1990, in Acquisition, Processing and Archiving of Astronomical Images, ed. G. Longo & G. Sedmak, 125–142
- Hada et al. (2011) Hada, K., Doi, A., Kino, M., et al. 2011, Nature, 477, 185
- Hada et al. (2014) Hada, K., Giroletti, M., Kino, M., et al. 2014, ApJ, 788, 165
- Hada et al. (2016) Hada, K., Kino, M., Doi, A., et al. 2016, ApJ, 817, 131
- Hada et al. (2012) Hada, K., Kino, M., Nagai, H., et al. 2012, ApJ, 760, 52
- Hodgson et al. (2016) Hodgson, J. A., Lee, S.-S., Zhao, G.-Y., et al. 2016, Journal of Korean Astronomical Society, 49, 137
- Hovatta et al. (2014) Hovatta, T., Aller, M. F., Aller, H. D., et al. 2014, AJ, 147, 143
- Kim et al. (2016) Kim, J.-Y., Lu, R.-S., Krichbaum, T., et al. 2016, Galaxies, 4, 39
- Kino et al. (2015) Kino, M., Takahara, F., Hada, K., et al. 2015, ApJ, 803, 30
- Kovalev et al. (2007) Kovalev, Y. Y., Lister, M. L., Homan, D. C., & Kellermann, K. I. 2007, ApJ, 668, L27
- Lee et al. (2015) Lee, S.-S., Oh, C. S., Roh, D.-G., et al. 2015, Journal of Korean Astronomical Society, 48, 125
- Lee et al. (2016) Lee, S.-S., Wajima, K., Algaba, J.-C., et al. 2016, ApJS, 227, 8
- Lister et al. (2009) Lister, M. L., Aller, H. D., Aller, M. F., et al. 2009, AJ, 137, 3718
- Lister et al. (2016) Lister, M. L., Aller, M. F., Aller, H. D., et al. 2016, AJ, 152, 12
- Ly et al. (2007) Ly, C., Walker, R. C., & Junor, W. 2007, ApJ, 660, 200
- Mertens et al. (2016) Mertens, F., Lobanov, A. P., Walker, R. C., & Hardee, P. E. 2016, A&A, 595, A54
- Punsly (2017) Punsly, B. 2017, ApJ, 850, 190
- Pushkarev & Kovalev (2012) Pushkarev, A. B. & Kovalev, Y. Y. 2012, A&A, 544, A34
- Shepherd et al. (1994) Shepherd, M. C., Pearson, T. J., & Taylor, G. B. 1994, in BAAS, Vol. 26, Bulletin of the American Astronomical Society, 987–989
- Walker et al. (2016) Walker, R. C., Hardee, P. E., Davies, F., et al. 2016, Galaxies, 4, 46
- Walsh et al. (2013) Walsh, J. L., Barth, A. J., Ho, L. C., & Sarzi, M. 2013, ApJ, 770, 86
- Yuan & Narayan (2014) Yuan, F. & Narayan, R. 2014, ARA&A, 52, 529
Appendix A Simulation of KVN visibilities and estimation of a systematic trend in the spectral index
The analysis of multi-frequency interferometric images is sensitive to the finite sampling of the source information in the visibility domain (e.g., Fromm et al. 2013). This issue can be particularly important for the KVN data because of the limited coverage of the array (see Fig. 2 of Lee et al. 2016). Therefore, we evaluated the effect of the frequency-dependent coverage on the accuracy of the spectral index measurement.
The main goal was to feed the simulator with exactly the same source model with a flat spectrum for different coverages (i.e., only different observing frequencies) and test if an absolutely flat spectral index can be recovered from the simulated data.
For this purpose, we prepared a ground-truth image of the M87 jet to simulate synthetic KVN observations. A full-track M87 VLBA 15 GHz data set was taken from the MOJAVE database (VLBA code BK145A), and we imaged the source structure using the Difmap task clean. The maximum baseline length of this observation was 440 M and provided an angular resolution of mas. In panel (A) of Fig. 4 we show the corresponding inner jet structure. This clean model was imported into the NRAO AIPS software (Greisen 1990) to be used as an input for the AIPS task UVCON. Then, we generated synthetic datasets using exactly the same input clean model for the four different KVN observing frequencies. The entire simulation was performed by following several specific steps.
-
1.
A full-track synthetic data set was created by using AIPS UVCON. We assumed one of the KVN observing frequencies (e.g., 22 GHz), the KVN station coordinates, and a 10 hr observing run. System temperatures and aperture efficiencies were chosen to be close to typical values in real observations. We note that the decoherence was not considered in the simulation.
-
2.
From session to session, KVN observed M 87 in snapshot mode at different baseline position angles. In order to account for this, we split the simulated full-track data into five subsets, each of which had the same 2 hr of on-source time (e.g., LST 6:00-8:00, 8:00-10:00, 10:00-12:00, 12:00-14:00, and 14:00-16:00).
- 3.
-
4.
The core flux estimate was repeated for all the five sub-datasets. Then, we took the average and standard deviation of the five different flux values to determine a characteristic flux value.
-
5.
Steps 1 to 4 were repeated for the synthetic data sets at observing frequencies of 22, 43, 86, and 129 GHz.
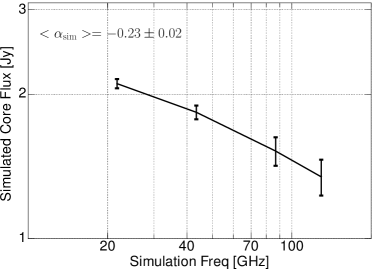
In Fig. 5 we show the artificial spectrum obtained by the simulation. We were not able to recover a completely flat spectral index and rather obtained of . Most likely, this is due to different level of the array sensitivity to extended emission at limited uv spacings. Therefore, the limited (u,v) coverage very likely causes similar systematic effects in the analysis of the real multi-frequency M 87 data as well.
After these considerations, we conclude that it is unlikely that the actual source spectrum is even slightly steep or inverted in our observing band.