Phase diagram and melting scenarios of two-dimensional Hertzian spheres
Abstract
We present computer simulations of a system of purely repulsive soft colloidal particles interacting via the Hertz potential and constrained to a two-dimensional plane. This potential describes the elastic interaction of weakly deformable bodies and can be a reliable model for qualitative description of behavior of soft macromolecules, like globular micelles and star polymers. We find a large number of ordered phases, including the dodecagonal quasicrystal, and analyze the melting scenarios of low density triangle and square phases. It is interesting that depending on the position on the phase diagram the system can melt both through the first order transition and in accordance with the Berezinskii-Kosterlitz-Thouless-Halperin-Nelson-Young (BKTHNY) scenario (two continuous transitions with the intermediate hexatic phase) and also in accordance with recently proposed two-stage melting with the first order hexatic-isotropic liquid transition and continuous solid-hexatic transition. We also demonstrate the possibility of the tricritical point on the melting line.
pacs:
61.20.Gy, 61.20.Ne, 64.60.KwI Introduction
Phase transitions in two-dimensional () systems are of great interest for many reasons. This is a field where usual intuition can lead to wrong conclusions. Firstly, as it was shown by Landau and Peierls lan ; p1 ; p2 there is no two-dimensional crystals as we understand the crystals in three dimensional () space. Two-dimensional crystal structures do not demonstrate long-range translational order. However, there is still long-range orientational order and quasi-long range translational order in crystals mermin ; pu2017 . As a result, the melting of crystalline phases can occur not only as the first order phase transition chui83 ; ryzhovJETP ; RT1 ; rto1 ; rto2 , like it always happens in , but a number of different scenarios are possible . In addition to the usual first order phase transition melting of the crystal can appear as two continuous transitions of Berezinskii-Kosterlitz-Thouless (BKT) type ber1 ; ber2 ; kosthoul72 ; kosthoul73 ; kost (Berezinskii-Kosterlitz-Thouless-Halpering-Nelson-Young (BKTHNY) scenario pu2017 ; kosthoul72 ; kosthoul73 ; kost ; halpnel1 ; halpnel2 ; halpnel3 ; keim1 ; zanh ; keim2 ; keim3 ; keim4 ). The BKTHNY scenario seems most popular now. According to this theory solids melt through dissociation of bound dislocation pairs. As a result, the long-ranged orientational order transforms into quasi-long-ranged order, and the quasi-long-ranged positional order becomes short-ranged. The new intermediate phase with quasi-long-range orientational order is called a hexatic phase (if melting of square crystal is considered then it is a tetratic phase). It has a zero shear rigidity and because of this it should be considered as a kind of ordered liquid. The hexatic phase transforms into an isotropic liquid phase having short-ranged orientational and positional orders through unbinding dislocations pairs. It should be noted, that the BKTHNY theory provides only limits of stability of the solid and hexatic phases.
Recently, the other melting scenario was proposed foh1 ; foh2 ; foh3 ; foh4 ; foh5 ; foh6 . In contrast to the BKTHNY theory, it was shown that the system can melt through a continuous BKT type solid-hexatic transition, but the hexatic-liquid transition is of first-order foh1 ; foh2 ; foh3 . In paper foh4 Kapfer and Krauth explored behavior of a soft disk system with potential . The system was shown to melt in accordance with the BKTHNY theory for , while for the two-stage melting transition took place with continuous solid-hexatic and the first-order hexatic-liquid transition.
Until recently it only triangular lattices were observed in two-dimensional systems in experiments and computer simulations. However, in the last decades there appeared a lot of experimental (for example, graphene, square ice si , square iron siron , etc.) and obtained from computer simulations nontrivial ordered structures, including triangular, square, honeycomb, Kagome, snub-square tiling, quasicrystals etc. str1 ; str2 ; str3 ; str4 ; str5 ; str6 ; str7 ; str8 ; str9 . This kind of behavior is characteristic for the core-softened potentials dfrt1 ; dfrt2 ; dfrt3 ; dfrt4 ; dfrt5 ; dfrt6 ; dfrt7 ; trus . The different forms of core-softened potentials are widely used for qualitative description of the anomalous water-like behavior, including density, structural and diffusion anomalies, liquid-liquid phase transitions, glass transitions, and melting maxima jcp2008 ; wepre ; we_inv ; we2011 ; RCR ; we2013-2 ; buld2009 ; fr1 ; fr2 ; fr3 ; fr4 ; barbosa ; barbosa1 ; barbosa2 ; barbosa3 ; buld2d ; scala ; prest2 ; prest1 .
Here we focus on the bounded soft potential - the Hertzian spheres. The Hertz potential describes the potential energy of two elastic spheres under an axial compression lanl . The potential can be written in the following form:
| (1) |
The parameters and define the energy and length scales and the exponent determines the steepness of the potential 111In some publications the potential is defined as . Although it does not affect the qualitative behavior of the system it leads to different energy scale and therefore in order to compare the results one needs to recalculate the temperatures. Strictly speaking, the potential (1) corresponds to slightly deformed elastic spheres and cannot be applied for very large compressions and densities. However, Hertz potential may be used as a model potential for soft particles that is bounded and has finite range. This potential can be used for qualitative description of behavior of soft uncharged macromolecules, like globular micelles and star polymers.
The phase diagram of Hertz system with was reported in the seminal work by Daan Frenkel and coauthors hertz3d . It was shown that this phase diagram includes numerous crystalline phases including non-cubic ones. Moreover, it was found that the fluid phase of the system demonstrates diffusion anomaly, i.e. the diffusion coefficient increases with density in some region of densities and temperatures. Later it was shown that this system also demonstrates structural anomaly rosbreak identified by excess entropy criterion strcriteria and that this system does not obey the Rosenfeld scaling ros ; ros1 of the diffusion coefficient rosbreak .
The phase diagram of the Hertz system was firstly reported in miller . Three values of were considered: , and and it was shown that the steepness of the potential crucially changes the phase diagram. In the particular case of the authors of Ref. miller found several triangular and square crystals and a phase of pentagons. Although the authors have observed the phase of pentagons they do not recognize the symmetry of this structure. Moreover, the work miller gives only rough preliminary investigation of the phase diagram without strict determination of the phase boundaries and melting scenarios.
The investigation of the phase diagram of Hertz system with different was continued in Ref. hertzqc . This paper presents an investigation of phases which appear in the Hertz system with varying from to at fixed temperature. Importantly, the sequence of the phases reported for is different from the one in Ref. miller . In Ref. hertzqc the authors recognize the phase of pentagons as dodecagonal quasicrystal (DDQC). They also find that DDQC transforms into stripe phase. At high density the system demonstrates rhombohedral phase. Both stripe and rhombohedral phases were not observed in miller .
Another important observation of Ref. hertzqc which is in agreement with Ref. miller is that the larger values of corresponds to the simpler phase diagrams. Complex crystalline or quasicrystalline structures appear only at low and as increases the number of different phases in the system decreases.
The melting scenario of the low density triangular phase of Hertz disks with was reported in Ref. hertzmelt . It was found that this phase demonstrates reentrant melting. The melting scenario of the low density branch (left branch) corresponds to the scenario proposed in Refs. foh1 ; foh2 ; foh3 ; foh4 ; foh5 ; foh6 , i.e. continuous transition from solid to hexatic phase and the first order one from hexatic to liquid. However, the melting scenario changes in the point of maximum of the melting line and melting of the high density branch (right) branch proceeds in accordance to the BKTHNY scenario, i.e. two continuous transitions. However, only the limits of stability of the liquid are shown in Ref. hertzmelt (see Fig. 1 of this publication). In order to make the phase diagram in the vicinity of the low density triangular phase complete one needs to add also the lines of transitions between the hexatic phase and the crystal.
Summing up the results from literature on the phase diagram of Hertzian disks with one can see that they are rather sporadic. Up to now there is no full phase diagram of the system. Also the melting scenario is determined only for the triangular phase with low density. At the same time not all lines of the transitions at the melting of triangular and square phases are reported.
The goal of the present paper is to perform a detailed study of the phase diagram of the Hertz disks with . We find the regions of stability of different ordered phases and discuss the melting scenarios of the low density triangular and square phases. We will also discuss the mechanism of transformation of the low density triangular phase into low density square phase.
II Systems and methods
In the present paper we study the Hertz disk system with . We use the reduced unit to represent all quantities in the study, i.e. we use and as the units of energy and length correspondingly. Following Ref. miller we consider the densities from up to . It is extremely wide region of densities. It is especially important since the density jumps in two-dimensional transitions is usually rather low - of the order of , therefore the regions of phase transitions are very narrow comparing to the total interval of the densities under consideration. Because of this we do the simulations in two steps.
At the first step we do rough estimation of the phase diagram. For doing this we simulate a small system of particles at densities from up to with the step . If we see that the system demonstrates different phases at some step in density we decrease the step and investigate this region in more details.
The system was simulated in a rectangular box. The initial configuration was set up to be a high temperature liquid configuration. Starting from this configuration the system was simulated by means of molecular dynamics method book_fs (LAMMPS package lammps ) in canonical ensemble (constant number of particles N, area S and temperature T) for steps with time step . The first were used for equilibration while during the last sampling of the system was performed.
In order to characterize the thermodynamic properties of the system we studied equations of state (eos), i.e. pressure as a function of the density along isotherms. If a first order phase transition takes place in the system one observes a Mayer-Wood loop. The transition points can be found by Maxwell construction. In case of the continuous transition the eos demonstrates a bend. Therefore, independently of the nature of the transition eos can be used as the first signal.
Having identified the regions of phase transitions from the eos we perform identification of the phases. For doing this we apply several methods. The most robust method involves the radial distribution functions . This method allows to distinguish different crystalline phases. However, in the case of two-dimensional systems it is not so efficient in distinguishing liquids and crystals, because the two-dimensional liquids usually demonstrate rather ordered behavior next to the melting line.
In order to investigate the melting of triangular and square crystals we used the orientational and translational order parameters.
The orientational order parameter (OOP) of triangular lattice is defined as halpnel1 ; halpnel2 ; dfrt5 ; dfrt6
| (2) |
where is the angle of the vector between particles and with respect to a reference axis and the sum over is counting nearest-neighbors of , obtained from the Voronoi construction. The global OOP can be calculated as an average over all particles:
| (3) |
The square lattice orientational order (and the global one ) is defined in the same way.
In accordance with the standard definitions halpnel1 ; halpnel2 ; dfrt5 ; dfrt6 , translational order parameter (TOP) has the form:
| (4) |
where is the position vector of particle and G is the reciprocal-lattice vector of the first shell of the crystal lattice.
We also calculate the correlation functions of OOP and TOP which contain information on the long-range or quasi-long-range ordering in the system. The orientational correlation function (OCF) is given by the following expression:
| (5) |
where is the pair distribution function. In the hexatic phase the long range behavior of has the form with halpnel1 ; halpnel2 .
In case of the triangular crystal there is long range orientational order and quasi-long-range translational order. It leads to flat shape of the orientational OCF, whilst OCF decays algebraically in the hexatic phase and exponentially in the isotropic liquid.
The translational correlation function (TCF) can be calculated as
| (6) |
where . In the solid phase the long range behavior of has the form with halpnel1 ; halpnel2 . In the hexatic phase and isotropic liquid decays exponentially.
Analogous correlation functions can be introduced for the square crystal by substituting by in the case of OCF and using the correlation function of for the square crystal . Unfortunately, there are no calculations of the exponents at which the square crystal transforms into tetratic phase and the tetratic phase into isotropic liquid. By analogy with the triangular crystal one can use and , but these values should be considered as the first guess rather then exact ones.
An important shortcoming of the order parameters introduced above is that they are applicable to a single crystal structure only. That is why if one finds a novel crystal structure with different symmetry the order parameters can be zero in this structure. That is why it can be difficult to find out the symmetry of the structure using the order parameters only. This problem can be solved by calculating the diffraction patterns. The diffraction patterns are the intensity maps of the static structure factor:
| (7) |
Combining the information obtained from radial distribution functions, orientational and translational order parameters and diffraction patterns we are able to identify the structures observed in the system.
III Results and discussion


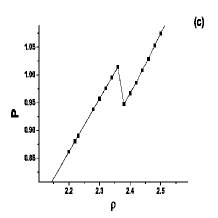


In order to perform a first estimation of the phase diagram of the system we study its isotherms. Fig. 1 shows the isotherm (panel (a)). Other panels enlarge the regions where we observe Mayer-Wood loops which indicate the first order phase transition. One can see numerous loops which mean that many phase transitions take place in the system.
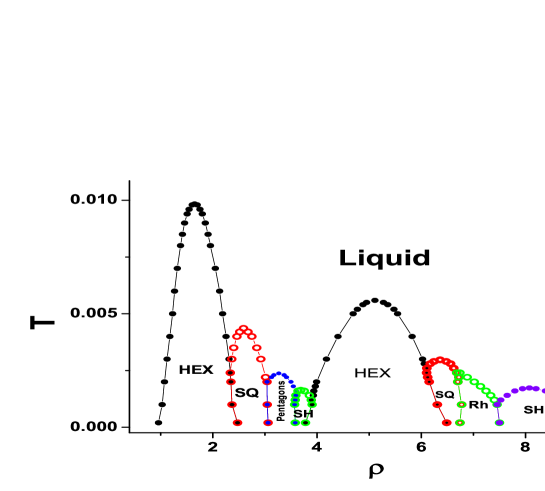
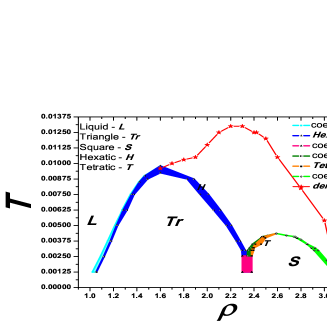
Using the equations of state along different isotherms we construct the phase diagram of the system. It is shown on Fig. 2. In agreement with the previous studies miller ; hertzqc the phase diagram is very complex. We find that the sequence of phases is different from Ref. miller and corresponds to Ref. hertzqc , i.e. in addition to the triangular and square phases we find also stretched triangular (SH) and rhombohedral phases. Moreover, since we extend our investigation to the densities up to which is above the upper density in Ref. hertzqc we find more phases in this high density region: the rhombohedral phase transforms into the second stretched triangular phase and the later transforms into high density triangular crystal.
We simulated the system at different temperatures in order to find out the full phase diagram which is shown on Fig. 2.
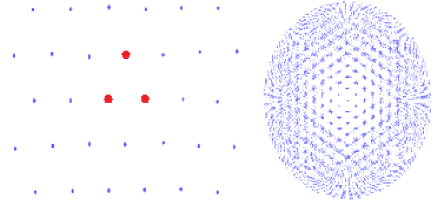
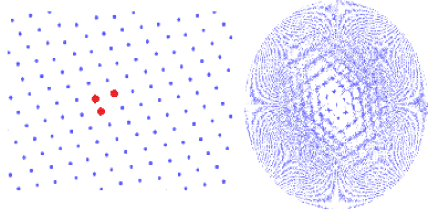
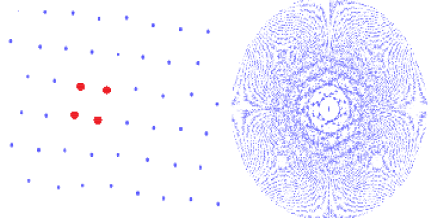
We start from triangular structure with low density. Fig. 3 shows a part of configuration of the triangular phase with low density (left panel) and the corresponding diffraction pattern.
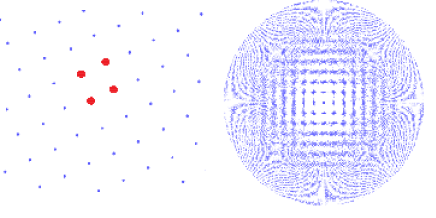
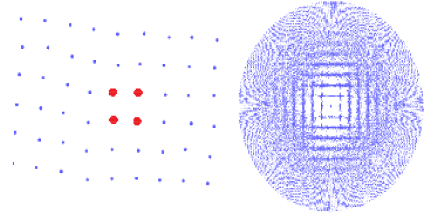
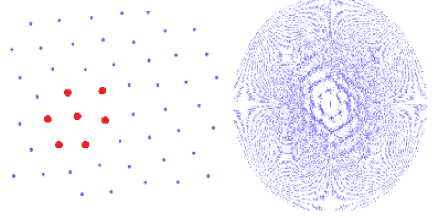
Analogously Fig. 4 shows an example of snapshot and diffraction pattern of square phase with low density.
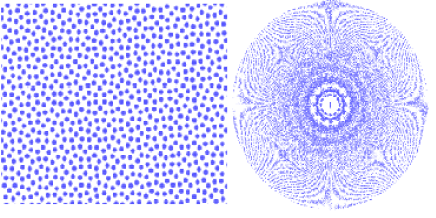
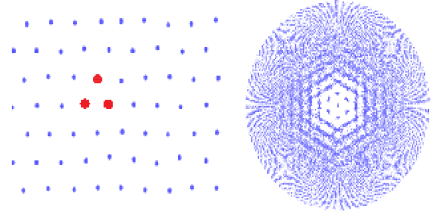
While the triangular and square phases are relatively easy to identify, the next phase is the one consisting of pentagons. In Ref. miller this structure was not identified. The authors proposed a very complex way of description of this structure by decomposing it into five sublattices. The authors of Ref. hertzqc defined this structure as dodecagonal quasicrystal. Our study confirms this finding. It can be realized from the diffraction pattern shown in Fig. 5 which clearly demonstrates 12-fold symmetry corresponding to the dodecagonal quasicrystal.
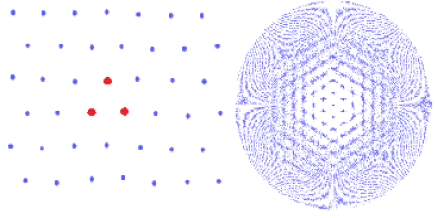
The next structure we identify as stretched triangular structure. This can be visible from the snapshot (Fig. 6). But most clearly it can be seen from the diffraction pattern given on the right panel of the same figure.
Further increase of the density leads to almost exact repetition of the sequence of phases, but the quasicrystalline phase changes to the rhombohedral crystal. The sequence of the phases becomes the following: triangular (Fig. 7), square (Fig. 8), rhombohedral (Fig. 9), stretched triangular (Fig. 10) and finally again triangular (Fig. 11). It is worth to note that the stretched triangular and rhombohedral structures do not look very obvious from snapshots and radial distribution functions, but the structure becomes apparent from the diffraction patters.
IV Low density part of the phase diagram
Now we consider in more details the low density part of the phase diagram, which includes the first two crystalline phases (triangular and square) and liquid.
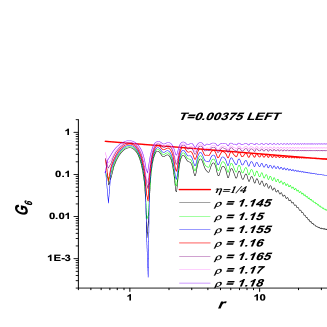
Fig. 12 (a) shows an example of equation of state at the low density branch of the melting line of the low-density triangular phase. One can see that the equation of state demonstrates a Mayer-Wood loop which means that a first order transition takes place. By analyzing the orientational and translational correlation functions shown in Figs. 12 (b) and (c), we conclude that the hexatic phase transforms into the isotropic liquid through first order transition. As higher densities there is a transition from hexatic phase into triangular solid. This kind of melting corresponds to the scenario proposed in Refs. foh1 ; foh2 ; foh3 ; foh4 ; foh5 ; foh6 and is in agreement with the results of Ref. hertzmelt .
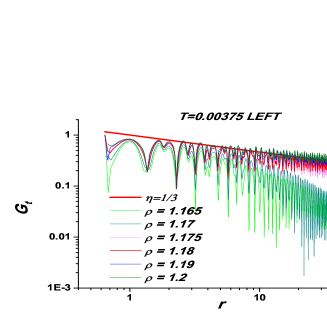
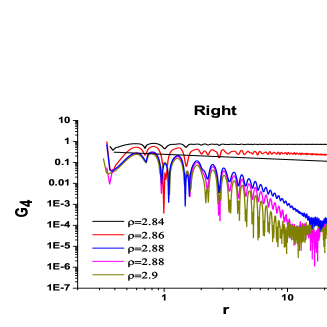
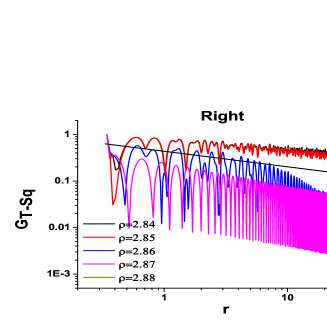
The next Fig. 13 (a)-(c) demonstrates the same analysis for the right branch of the melting line. No Mayer-Wood loop is observed here at high temperatures. By analyzing the equation of state and the correlation functions we conclude that the system melts in accordance to the BKTHNY scenario which is again consistent with Ref. hertzmelt .
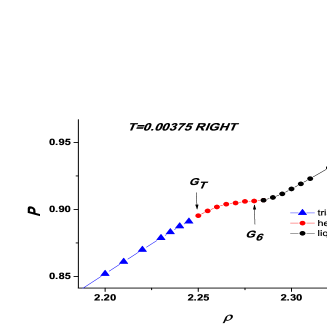
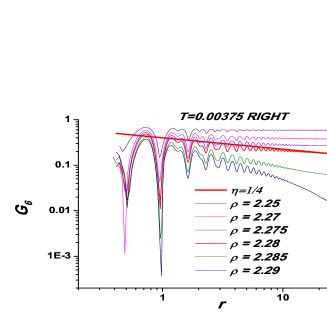
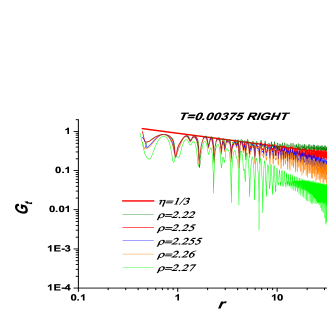
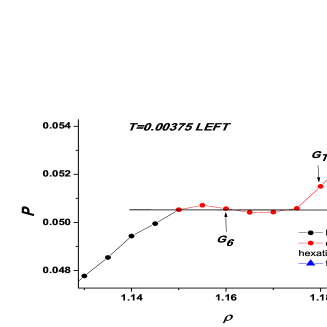
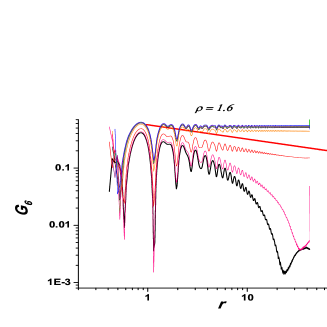
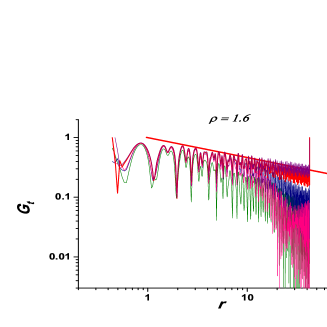
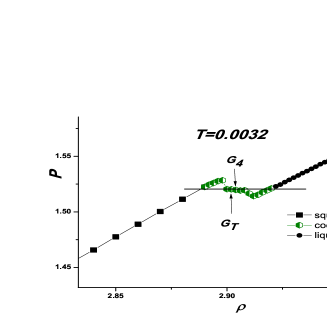
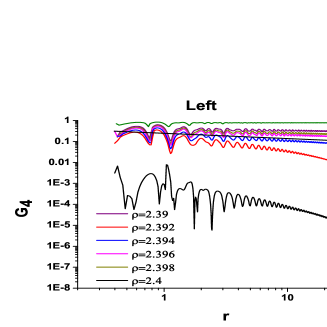
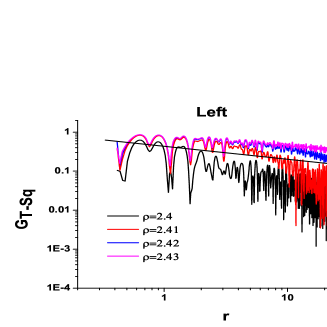
Unlike the Ref. hertzmelt we find that at the maximum on the melting line the melting still goes through the hexatic phase. Fig. 14 shows the behavior of the orientational and translational correlation functions at the maximum of the melting line. From these plots one can see that from the condition the transition from crystal into hexatic phase takes place at while from the condition the transition of the hexatic phase into isotropic liquid appears at .
Similar analysis was performed also for the square crystal. Fig. 15 shows the equation of state of Hertzian disks at and the densities interval crossing the square crystal. The qualitative behavior of the square crystal looks the same as the triangular one. At the left branch there is a Mayer-Wood loop between the isotropic liquid and tetratic phase and the tetratic phase itself transforms into crystal via a continuous transition. At the right branch we observe the Mayer-Wood loop and both and criteria fall into the region of the loop. It states that the system melts through the first order phase transition at the right branch of the melting curve of the square crystal.
Phase transformation of the tetratic phase into the square crystal which takes place at the left branch is a continuous transition. The location of this transition is determined by the and correlation functions shown in Figs. 16 (a)-(d). The resulting phase diagram which includes the melting lines of the triangular and square crystals is shown in Fig. 17.
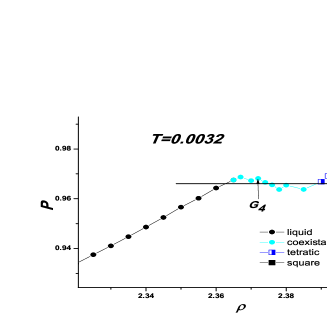
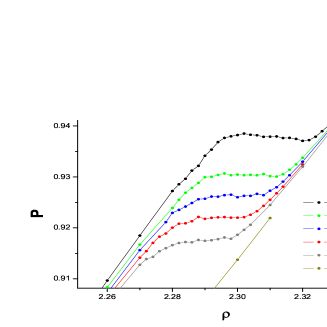
Special care should be taken in the vicinity of the triple point of liquid-hexatic-tetratic phases. Fig. 18 shows a set of isotherms in the vicinity of the triple point. One can see two important features of these equations of state. First of all, as the temperature increases the curves go down, i.e. the pressure decreases with temperature. This phenomenon is known as the density anomaly. We study the region of existence of the density anomaly and put it on the phase diagram (Fig. 17). The second is that at low temperatures the eos demonstrates the Mayer-Wood loop, while at the temperatures above the loop disappears. It leads to a conclusion that the melting scenario changes at . While above this temperature melting proceeds in accordance to BKTHNY scenario, below melting becomes the first order phase transition. The point at and density is a tricritical point of the system, where the BKT continuous hexatic-isotropic liquid transition (BKTHNY scenario) is replaced by the first-order hexatic-isotropic liquid transition (scenario, proposed in foh1 ; foh2 ; foh3 ; foh4 ; foh5 ; foh6 ).
V Conclusions
We present the computer simulation study of a two-dimensional system of purely repulsive soft colloidal particles interacting via the Hertz potential in a wide range of densities. This potential describes the elastic interaction of weakly deformable bodies and can be a reliable model for qualitative description of behavior of soft macromolecules, like globular micelles and star polymers. We find a large number of ordered phases, including the dodecagonal quasicrystal, and analyze the melting scenarios of low density triangle and square phases. It is interesting that depending on the position on the phase diagram the system can melt both through the first order transition and in accordance with the BKTHNY scenario and also in accordance with recently proposed two-stage melting with the first order hexatic-isotropic liquid transition and continuous BKT type solid-hexatic transition. It is found that in the liquid phase in the reentering melting region between the triangle and square lattices there is a water-like density anomaly. We also demonstrate the possibility of the tricritical point on the melting line of the triangle phase.
It should be also noted, that the nature of the first-order liquid-hexatic transition is not completely understood because conventional theories like the BKTHNY are not capable to describe the first-order liquid-hexatic transition. However, it is known that the BKT transition can be made first order by reducing the core energy of the corresponding topological defect (disclination) below some critical value fish94 ; ryz93 ; ryz94 ; ryz96 . Taking into account that the microscopic calculation of is not available now, one can conclude that the further investigations of the nature of first-order hexatic-isotropic liquid transition are necessary.
The authors are grateful to Daan Frenkel, S.M. Stishov, V.V. Brazhkin and E. E. Tareyeva for valuable discussions. This work was carried out using computing resources of the federal collective usage center ”Complex for simulation and data processing for mega-science facilities” at NRC ”Kurchatov Institute”, http://ckp.nrcki.ru, and supercomputers at Joint Supercomputer Center of the Russian Academy of Sciences (JSCC RAS). The work was supported by the Russian Science Foundation (Grant No 14-22-00093).
References
- (1) L. D.Landau, Phys. Z. Sowjetunion 11, 26 (1937).
- (2) R. E. Peierls, Helv. Phys. Acta 7, 81 (1934).
- (3) R. E. Peierls, Ann. Inst. Henri Poincar e 5, 177 (1935).
- (4) N. D. Mermin, Phys. Rev. 176, 250 (1968).
- (5) V. N. Ryzhov, E. E. Tareyeva, Yu. D. Fomin, E. N. Tsiok Physics-Uspekhi 60, 857 (2017) (DOI: 10.3367/UFNe.2017.06.038161).
- (6) S.T. Chui, Phys. Rev. B 28, 178 (1983).
- (7) V.N. Ryzhov, Zh. Eksp. Teor. Fiz. 100, 1627 (1991). [Sov. Phys. JETP 73, 899 (1991)].
- (8) V.N. Ryzhov and E.E. Tareyeva, Physica A 314, 396 (2002).
- (9) V.N. Ryzhov and E.E. Tareyeva, Phys. Rev. B 51 8789 (1995).
- (10) V.N. Ryzhov and E.E. Tareeva, Zh. Eksp. Teor. Fiz. 108, 2044 (1995) [J. Exp. Theor. Phys. 81, 1115 (1995)].
- (11) V. L. Berezinskii, Zhur. Eksp. Teor. Fiz. 59, 907 (1970); Sov. Phys. JETP 32, 493 (1970).
- (12) V. L. Berezinskii, Zhur. Eksp. Teor. Fiz. 61, 1144 (1971); Sov. Phys. JETP 34, 610 (1971).
- (13) J. M. Kosterlitz and D. J. Thouless, J. Phys. C: Solid St. Phys. 5, L124 (1972).
- (14) J. M. Kosterlitz and D.J. Thouless, J. Phys. C 6, 1181 (1973).
- (15) J. M. Kosterlitz, Rep. Prog. Phys. 79, 026001 (2016).
- (16) B.I. Halperin and D.R.Nelson, Phys. Rev. Lett. 41, 121 (1978).
- (17) D.R.Nelson and B.I. Halperin, Phys. Rev. B 19, 2457 (1979).
- (18) A.P. Young, Phys. Rev. B 19, 1855 (1979).
- (19) Urs Gasser, C. Eisenmann, G. Maret, and P. Keim, ChemPhysPhysChem, 11, 963 (2010).
- (20) K. Zahn and G. Maret, Phys. Rev. Lett. 85, 3656 (2000).
- (21) P. Keim, G. Maret, and H.H. von Grunberg, Phys. Rev. E 75, 031402 (2007).
- (22) S. Deutschlander, T. Horn, H. Lowen, G. Maret, and P. Keim, Phys. Rev. Lett. 111, 098301 (2013).
- (23) T. Horn, S. Deutschlander, H. Lowen, G. Maret, and P. Keim, Phys. Rev. E, 88, 062305 (2013).
- (24) E.P. Bernard and W. Krauth, Phys. Rev. Lett. 107, 155704 (2011).
- (25) M. Engel, J.A. Anderson, S.C. Glotzer, M. Isobe, E.P. Bernard, W. Krauth, Phys. Rev. E 87, 042134 (2013).
- (26) W. Qi, A. P. Gantapara and M. Dijkstra, Soft Matter 10, 5449 (2014).
- (27) S.C. Kapfer and W. Krauth, Phys. Rev. Lett. 114, 035702 (2015).
- (28) W.K. Qi, S.M. Qin, X.Y. Zhao, and Yong Chen, J. Phys.: Condens. Matter 20, 245102 (2008).
- (29) W. Qi and M. Dijkstra, Soft Matter 11, 2852 (2015) (DOI: 10.1039/c4sm02876g).
- (30) G. Algara-Siller, O. Lehtinen, F. C. Wang, R. R. Nair, U. Kaiser, H. A.Wu, A. K. Geim, I. V. Grigorieva, Nature 519, 443 (2015).
- (31) Jiong Zhao et al., Science 343, 1228 (2014).
- (32) Ronen Zangi and Alan E. Mark, Phys. Rev. Lett. 91, 025502 (2003).
- (33) P. Kumar, S. V. Buldyrev, F. W. Starr, N. Giovambattista, and H. Eugene Stanley, Phys. Rev. E 72, 051503 (2005).
- (34) Sungho Han, M. Y. Choi, Pradeep Kumar and H. Eugene Stanley, Nature Physics 6, 685 (2010).
- (35) Jessica C. Johnston, Noah Kastelowitz, and Valeria Molinero, J. Chem. Phys. 133, 154516 (2010).
- (36) Hamid Mosaddeghi, Saman Alavi, M. H. Kowsari, and Bijan Najafi, J. Chem. Phys. 137, 184703 (2012).
- (37) Ahmad M. Almudallal, Sergey V. Buldyrev, and Ivan Saika-Voivod, J. Chem. Phys. 137, 034507 (2012).
- (38) T. Dotera, T. Oshiro, P. Ziherl, Nature 509, 208 (2014).
- (39) H. Pattabhiramana and M. Dijkstra, J. Chem. Phys. 146, 114901 (2017).
- (40) Q. Meng, C. N. Varney, H. Fangohr, and E. Babaev , Phys. Rev. B 90, 020509(R) (2014).
- (41) D.E. Dudalov, Yu.D. Fomin, E.N. Tsiok, and V.N. Ryzhov, J. Phys.: Conference Series 510, 012016 (2014) (doi:10.1088/1742-6596/510/1/012016).
- (42) D.E. Dudalov, Yu.D. Fomin, E.N. Tsiok, and V.N. Ryzhov, J. Chem. Phys. 141, 18C522 (2014).
- (43) D.E. Dudalov, Yu.D. Fomin, E.N. Tsiok, and V.N. Ryzhov, Soft Matter 10, 4966 (2014).
- (44) E.S. Chumakov, Y.D. Fomin, E.L. Shangina, E.E. Tareyeva, E.N. Tsiok, V.N. Ryzhov, Physica A 432, 279 (2015).
- (45) E. N. Tsiok, D. E. Dudalov, Yu. D. Fomin, and V. N. Ryzhov, Phys. Rev. E 92, 032110 (2015).
- (46) E. N. Tsiok, Y. D. Fomin, V. N. Ryzhov, Physica A 490, 819 (2018).
- (47) N.P. Kryuchkov, S.O. Yurchenko, Yu. D. Fomin, E. N. Tsiok, and V. N. Ryzhov, arXiv:1712.04707.
- (48) William D. Pi eros, Michael Baldea, and Thomas M. Truskett, J. Chem. Phys. 145, 054901 (2016).
- (49) Y.D. Fomin, N.V. Gribova, V.N. Ryzhov, S.M Stishov, and D. Frenkel, J. Chem. Phys. 129, 064512 (2008).
- (50) N.V. Gribova, Y.D. Fomin, D. Frenkel, and V.N. Ryzhov, Phys. Rev. E 79 051202 (2009).
- (51) Y.D. Fomin, E.N. Tsiok, and V.N. Ryzhov, J. Chem. Phys. 135, 234502 (2011).
- (52) Y.D. Fomin, E.N. Tsiok, and V.N. Ryzhov, J. Chem. Phys. 135, 124512 (2011).
- (53) R.E. Ryltsev, N.M. Chtchelkatchev, and V.N. Ryzhov, Phys. Rev. Lett. 110, 025701 (2013).
- (54) Y.D. Fomin, E.N. Tsiok, and V.N. Ryzhov, Phys. Rev. E 87, 042122 (2013).
- (55) S.V. Buldyrev, G. Malescio, C.A. Angell, N. Giovambattista, S. Prestipino, F. Saija, H.E. Stanley, and L. Xu, J. Phys.: Condens. Matter 21, 504106 (2009).
- (56) P. Vilaseca and G. Franzese, Journal of Non-Crystalline Solids 357, 419 (2011).
- (57) G. Franzese, J. Mol. Liq. 136, 267 (2007).
- (58) Pol Vilaseca and Giancarlo Franzese, J. Chem. Phys. bf 133, 084507 (2010).
- (59) F. Leonia and G. Franzese, J.Chem.Phys. 141, 174501 (2014).
- (60) A. B. de Oliveira, P. A. Netz, T. Colla, and M. C. Barbosa, J. Chem. Phys. 124, 084505 (2006).
- (61) L.B. Krott and M.C. Barbosa, J. Chem. Phys. 138 084505 (2013).
- (62) L. B. Krott and M. C. Barbosa, Phys. Rev. E 89, 012110 (2014).
- (63) L. B. Krott, J. R. Bordin, and M.C. Barbosa, J. Phys. Chem. B 119, 291 (2015).
- (64) A.M. Almudallal, S.V. Buldyrev, and I. Saika-Voivod, J. Chem. Phys. 137 034507 (2012).
- (65) M.R. Sadr-Lahijany, A. Scala, S.V. Buldyrev, H.E. Stanley, Phys. Rev. Lett. 81, 4895 (1998).
- (66) S. Prestipino, F. Saija, and P.V. Giaquinta, J. Chem. Phys. 137, 104503 (2012).
- (67) S. Prestipino, F. Saija, and P.V. Giaquinta, Phys. Rev. Lett. 106, 235701 (2011).
- (68) L. D. Landau and E. M. Lifshitz, Theory of Elasticity, 3rd ed. (Pergamon, New York, 1986).
- (69) J. C. Pamies, A. Cacciuto, and D. Frenkel, J. Chem. Phys. 131 , 044514 (2009).
- (70) Yu. D. Fomin, V. N. Ryzhov, N. V. Gribova, Phys. Rev. E 81, 061201 (2010).
- (71) Yu. D. Fomin, V. N. Ryzhov, B. A. Klumov, and E. N. Tsiok, J. Chem. Phys. 141, 034508 (2014).
- (72) Ya. Rosenfeld, Phys. Rev. A 15, 2545 (1977).
- (73) Ya. Rosenfeld, J. Phys.: Condens. Matter 11, 5415 (1999).
- (74) Miller W.L., Cacciuto A. Two-dimensional packing of soft particles and the soft generalized thomson problem. Soft Matter 7, 7552 (2011).
- (75) M. Zu, P. Tan and N. Xu, Nature Comm. 8, 2089 (2017).
- (76) M. Zum J. Liu, H. Tong and N. Xu, Phys. Rev. Lett. 117, 085702 (2016).
- (77) Daan Frenkel and Berend Smit, Understanding molecular simulation (From Algorithms to Applications), 2nd Edition (Academic Press, 2002).
- (78) http://lammps.sandia.gov/
- (79) Y. Levin, X. Lee, M. E. Fisher, Phys. Rev. Lett. 93, 2716 (1994).
- (80) V. N. Ryzhov, E. E. Tareyeva, Phys. Rev. B 48, 12907 (1993).
- (81) V. N. Ryzhov, E. E. Tareyeva, Phys. Rev. B 49, 6162 (1994).
- (82) D. Y. Irz, V. N. Ryzhov, E. E. Tareyeva, Phys. Rev. B 54, 3051 (1996).