Photoevaporation Does Not Create a Pileup of Giant Planets at 1 AU
Abstract
The semimajor axis distribution of giant exoplanets appears to have a pileup near 1 AU. Photoevaporation opens a gap in the inner few AU of gaseous disks before dissipating them. Here we investigate whether photoevaporation can significantly affect the final distribution of giant planets by modifying gas surface density and hence Type II migration rates near the photoevaporation gap. We first use an analytic disk model to demonstrate that newly-formed giant planets have a long migration epoch before photoevaporation can significantly alter their migration rates. Next we present new 2-D hydrodynamic simulations of planets migrating in photoevaporating disks, each paired with a control simulation of migration in an otherwise identical disk without photoevaporation. We show that in disks with surface densities near the minimum threshold for forming giant planets, photoevaporation alters the final semimajor axis of a migrating gas giant by at most 5% over the course of 0.1 Myr of migration. Once the disk mass is low enough for photoevaporation to carve a sharp gap, migration has almost completely stalled due to the low surface density of gas at the Lindblad resonances. We find that photoevaporation modifies migration rates so little that it is unlikely to leave a significant signature on the distribution of giant exoplanets.
1 Introduction
Statistical analyses of the exoplanet mass/semimajor axis distribution suggest that disk-driven migration plays a critical role in forcing giant planets () into short-period orbits (Armitage, 2007; Kley & Nelson, 2012; Raymond & Cossou, 2014; Schlichting, 2014). Given that the timescale for Type II migration—in which a planet opens a tidal gap in the disk (Lin et al., 1996; Nelson et al., 2000; Kley & Nelson, 2012)—is much shorter than observed protostellar disk lifetimes (3 Myr; e.g. Haisch et al., 2001), torques from the disk should have ample time to modify the orbits of gap-opening planets (for gap-opening criteria, see Crida et al., 2006) before disk dissipation by photoevaporation (Hollenbach et al., 1993, 1994; Clarke et al., 2001; Font et al., 2004; Alexander et al., 2006b; Owen et al., 2011, 2012; Gorti et al., 2016). Indeed, planet semimajor axis histograms have sometimes been interpreted as showing a “pileup” of giant planets with semimajor axes of 1 AU, or similarly a planet “desert” inside 1 AU (Udry & Santos, 2007; Wright et al., 2009; Hasegawa & Pudritz, 2012; Beaugé & Nesvorný, 2013). In this paper we test the hypothesis that photoevaporation may create a pileup of giant exoplanets near 1 AU by modifying the disk’s surface density, and hence the migration rates of giant plants in the inner disk (Matsuyama et al., 2003; Alexander & Pascucci, 2012; Ercolano & Rosotti, 2015).
Before gas giants can begin Type II migration, they may form with the help of protoplanetary disk structures called “planet traps.” First, planetesimals may grow most easily in local pressure maxima that trap centimeter to meter-size pebbles, such as near the water ice line (Barge & Sommeria, 1995; Lovelace et al., 1999; Bryden et al., 2000; Ciesla & Cuzzi, 2006; Kretke & Lin, 2007; Johansen et al., 2009; Regály et al., 2013). With the help of mutual gravitational attraction, the planetesimals collide to form planetary embryos (e.g. Greenberg et al., 1978), which quickly become vulnerable to Type I migration (Goldreich & Tremaine, 1980; Ward, 1997). However, localized disk structures may develop that balance the migration torques, forming traps that allow embryos to grow into giant planet cores instead of falling into the star (Morbidelli et al., 2008; Sándor et al., 2011; Hasegawa & Pudritz, 2011). Planet cores that rapidly grow to may begin runaway gas accretion, forming giant planets and transitioning out of fast Type I migration by carving a tidal gap in the disk (Thommes et al., 2007; Crida & Bitsch, 2017). These giant planets’ final orbits will depend on their locations of formation relative to planet traps, which may leave a signature on the distribution of giant exoplanet locations.
Photoevaporation, in which high-energy radiation from the central star (or other nearby stars, though we don’t consider this case here) drives a disk wind, generates gaps in the inner few AU of gas disks before dissipating them completely (Clarke et al., 2001; Alexander et al., 2006b; Owen et al., 2011). Planets that migrate into the ever-widening gap will stop migrating as the disk disperses around them, possibly creating a pileup in the semimajor axis distribution of giant planets near the gap-opening radius of AU (Matsuyama et al., 2003; Johnstone et al., 2004; Alexander & Armitage, 2009; Alexander & Pascucci, 2012; Ercolano & Rosotti, 2015). The disk dissipation induced by photoevaporation therefore mimics a planet trap. Indeed, Monte Carlo population synthesis models of giant planets migrating in photoevaporating disks have been shown to roughly reproduce the observed distribution of giant planets (e.g. Alexander & Armitage, 2009). Alexander & Pascucci (2012) (hereafter AP12) use an extreme ultraviolet (EUV)-dominated photoevaporation model to synthesize a population of giant planets with a desert at 1-2 AU and pileups on either side (though they acknowledge the desert location depends sensitively on an uncertain planetary accretion model), while Ercolano & Rosotti (2015) (hereafter ER15) predict a giant planet pileup between 1 and 2 AU as a result of disk dispersal triggered by X-ray-dominated photoevaporation. However, neither AP12 nor ER15 present control simulations where they synthesize a semimajor axis distribution from migrating planets in non-photoevaporating disks, so the effects of photoevaporation cannot easily be disentangled from other parameter choices. While removing photoevaporation from the AP12 and ER15 simulated disks would prevent the disks from ever being completely dispersed, unless by some other mechanism such as magnetocentrifugal winds (e.g. Gressel et al., 2015), the planets’ migration rates would asymptotically approach zero due to the exponentially decreasing surface density, so non-photoevaporating control simulations could be constructed that would reveal how gradual gas depletion might affect the exoplanet semimajor axis distribution.
As our goal is to isolate the effects of photoevaporation on planet migration, we directly compare migration tracks of planets in photoevaporating disks with those of identical planets in otherwise identical, but non-photoevaporating disks.
This paper is organized as follows. In § 2, we briefly describe the models of disk photoevaporation that we test in our simulations. In § 3, we present an analytic comparison of the timescales for viscous disk evolution, planet migration, and photoevaporative clearing to demonstrate that giant planets have ample time to migrate before photoevaporation begins to sculpt the disk. In § 4, we describe the setup of our FARGO numerical simulations of planet migration in photoevaporating disks, as well as the control set of simulations without photoevaporation. We refer the reader to Appendix A for a summary of our modifications to the original FARGO 2-D code, and Appendix B for a table of our simulation parameters. In § 5, we summarize the results of our simulations and discuss the extent to which photoevaporation affects planet migration. Finally, in § 6, we present our conclusions and ideas for future work.
| Symbol | Definition |
|---|---|
| Adiabatic index of the gas disk | |
| Age of disk | |
| Bolometric luminosity of central star | |
| Bolometric luminosity of the sun | |
| Disk mass-loss rate due to photoevaporation | |
| Disk mass-loss rate due to stellar accretion | |
| Disk sound speed | |
| Disk surface density | |
| Disk temperature | |
| Disk viscosity | |
| Distance from central star | |
| Inner or outer radius of disk | |
| Keplerian orbital angular speed | |
| Mass of central star | |
| Mass of disk | |
| Mass of hydrogen molecule | |
| Photoevaporation timescale | |
| Radius of minimum photoevaporation timescale | |
| Rate of change of disk surface density due to photoevaporation | |
| Starting semimajor axis for migration simulations | |
| Surface density profile when photoevaporation begins to open a gap | |
| Viscosity parameter from Shakura & Sunyaev (1973) | |
| Viscous timescale | |
| X-ray luminosity of the central star |
2 Photoevaporation Models
In this section we briefly describe the prescriptions for gas removal by photoevaporation that we use as the basis for our analytic calculations and simulations. For a discussion of how different types of ionizing radiation drive disk clearing, see Owen et al. (2010) or Alexander et al. (2014). For a more detailed discussion of the physics of photoevaporation, we recommend § 5 of Armitage (2011).
Photoevaporation is driven by energetic radiation ( 6 eV) heating the upper layers of a disk atmosphere so that the sound speed exceeds the escape speed. A hydrodynamic flow is then launched near the gravitational radius, (Hollenbach et al., 1994). The hydrodynamic flow is often characterized by the wind-driven mass-loss rate per unit surface area, . When the local viscous accretion rate falls to , a gap begins to open in the disk. Eventually the gap chokes off the accretion flow that supplies gas to the inner disk (inside the gap), and the inner disk drains on the viscous timescale. The star then irradiates the interior wall of the outer disk (outside the original gap) directly, triggering dissipation on a timescale of years (“UV-switch” in the language of Clarke et al., 2001). This process is accelerated when a giant planet’s tidal gap and the would-be photoevaporated gap overlap, as the tidal gap and photoevaporation can both hinder gas accretion to the inner disk (Alexander & Armitage, 2009; Rosotti et al., 2013).
In our simulations we consider three photoevaporation models for which or an equivalent expression has been published. The expressions for used here only apply to disks that have not drained interior to the planet’s orbit (or any photoevaporated gap), i.e., they have not yet reached the UV-switch (or the equivalent rapid dissipation phase in the X-ray photoevaporation model). In Appendix A, we describe how we incorporated photoevaporation into the FARGO planet migration simulations.
-
1.
EUV: Hydrodynamic simulations with extreme ultraviolet (EUV) photoevaporation (Liffman, 2003; Font et al., 2004) show that that flows are actually launched from roughly (1/5) and the mass-loss rate profile tapers off quickly at larger radii, resulting in roughly 1/3 of the total mass-loss rate of the analytic prediction of Hollenbach et al. (1994). The EUV photoevaporation model of Font et al. (2004) is taken from a numerical fitting function provided in the appendix of Alexander & Armitage (2007).
-
2.
X-ray: Owen et al. (2010, 2011, 2012) use a similar hydrodynamic simulation, but consider X-ray, FUV, and EUV fluxes. They find X-ray photoevaporation to be the dominant driver of disk mass loss, so we include their X-ray photoevaporation model using the fitting function in the appendix of Owen et al. (2012).
-
3.
FUV: Gorti & Hollenbach (2009) took a different approach, self-consistently modeling the chemical structure of a disk irradiated by FUV, EUV, and X-ray fluxes, then using the temperature profile found to estimate photoevaporative mass-loss rates. They found FUV radiation to be the dominant driver of mass loss. To get their predicted photoevaporation rates , we digitized the solid line in Figure 2 of Gorti & Hollenbach (2009) using an online app111http://arohatgi.info/WebPlotDigitizer.
In the next section we present an analytic disk model that suggests planets will have ample time to migrate before photoevaporation can significantly affect their migration tracks.
3 Timescales for Photoevaporation and Giant Planet Migration: Evidence for a Long Migration Epoch
The essential reason photoevaporation cannot significantly affect giant planet migration is that migration and photoevaporative gap opening operate at different epochs of disk evolution. (Hollenbach et al., 1994; Clarke et al., 2001; Alexander et al., 2006b; see review by Armitage, 2011). Since the torque on a planet from any disk annulus is proportional to the surface density in that annulus, migration rates slow as the disk gas accretes onto the star. Yet photoevaporation only dominates over accretion as the mass-transport mechanism when the disk surface density has been heavily depleted. We find that while typical Type II migration timescales are approximately years (e.g. Lin et al., 1996; Ward, 1997; Nelson et al., 2000), it takes approximately years for a disk to deplete from planet-forming densities to low enough densities for photoevaporation to dominate mass transport, leaving ample time for newly-formed Jupiters to migrate unaffected by photoevaporation.
To estimate how much time giant planets have available for migration before photoevaporation opens a gap, we construct an analytic disk model that evolves due to viscous forces and photoevaporation. Our disk initially has roughly the minimum gas surface density required to form a Jupiter-mass planet (500 g cm-2 at 5 AU, see Lissauer et al., 2009 and references therein). We let the disk viscosity follow the -prescription, (Shakura & Sunyaev, 1973). Here is the viscous efficiency, is the sound speed, and is the Keplerian angular speed for an orbit at radius around a central star mass of : (all variables used in this section are defined in Table 1). Our disk is dynamically thin (, where is the pressure scale height) but optically thick, so the sound speed is the adiabatic sound speed, (where is the adiabatic index, is Boltzmann’s constant, is molecular mass, and is the local temperature). For simplicity, we assume the disk gas consists of hydrogen molecules only so and is the mass of a hydrogen molecule. At each radius , the disk has a blackbody temperature in equilibrium with the stellar radiation field (with bolometric luminosity ): . Combining our expressions for , , and , we can write the viscosity in terms of parameters , , , and fundamental physical constants:
| (1) |
This simple, physical model of -viscosity recovers the proportionality as suggested by Hartmann et al. (1998).
Next we want to find the surface density profile of a disk undergoing both viscous accretion and photoevaporation. Unlike Ruden (2004), who find the surface density evolution in the general case of any disk surface density profile and any photoevaporation mass loss profile, we assume a constant value for steady-state accretion onto the star, (Pringle, 1981; note this assumption makes our surface density profile differ from the similarity solution of Lynden-Bell & Pringle, 1974, but more closely resemble simulations with a fixed disk outer radius). We also assume , where is the photoevaporation mass-loss rate (time-independent as long as the high-energy radiation field is constant and the UV-switch or X-ray equivalent has not been triggered). Simulations of viscous, photoevaporating disks tend to exhibit these properties for the majority of the disk lifetime (e.g. Clarke et al., 2001; Alexander et al., 2006b; Owen et al., 2011). These simplifying assumptions give our analytic model a surface density profile proportional to : where is the surface density at 1 AU from the central star. Under these assumptions, we can write the total mass-loss rate of the disk in terms of the surface density draining rate :
| (2) |
where and are the inner and outer disk radii. Assuming , substituting the equation for steady-state accretion on the left-hand side of Equation 2, and solving the resulting differential equation for fully specifies the surface density profile :
| (3) |
Now we are able to calculate the critical time, , at which photoevaporation begins to contribute significant mass transport to a given disk annulus, causing surface density depletion that cannot be re-filled by viscous accretion. To do this we set the viscous timescale, (Pringle, 1981), equal to the photoevaporation timescale, , where is the photoevaporation-induced rate of change in surface density as a function of disk radius. Using our forms for viscosity (Equation 1) and surface density, substituting Equation 3 into gives us the critical time
| (4) |
First we analyze this expression by finding the earliest time that photoevaporation begins to dominate mass transport at any disk radius, or the absolute minimum of . The extremal values of occur at radii satisfying:
| (5) |
For the X-ray photoevaporation model in § 2, we verified graphically that Equation 5 has only one solution, so we can solve it with a simple root-finding algorithm. Once time advances to this absolute minimum value of , the condition is no longer valid everywhere in the disk and our assumption of steady-state accretion breaks down, making Equations 2 and 3 no longer self-consistent. However, it is instructive to note that for all photoevaporation models considered (see § 2), the mass-transport timescales found at () are much longer than the rate of change of (given by the inverse function of Equation 4) at the absolute minimum value of . In other words, is moving inward faster than photoevaporation can drain the disk at , so a photoevaporated gap does not form until the inward propagation of slows relative to the draining timescale . For all of the photoevaporating disk models we consider in the paper, we do not see the gap-opening criterion,
| (6) |
satisfied until moves into the inner few AU of the disk. The gap center then continues to move at the rate as the gap opens.
Using Equation 6, we now present an analytic estimate of the time available for planets to migrate before feeling the effects of photoevaporation. We consider our analytic disk model with parameters from the well-characterized disk surrounding TW Hydrae, an old (3-10 Myr; see Hoff et al., 1998; Vacca & Sandell, 2011) pre main-sequence star that still has a disk. This is one of the few disks with a detected photoevaporative wind emerging from it (Pascucci & Sterzik, 2009; Pascucci et al., 2011). For our model of TW Hydrae, we set the current age, mass and luminosity to be Myr, and (luminosity estimated from the stellar evolutionary tracks of D’Antona & Mazzitelli, 1994). Bergin et al. (2013) measure the mass and outer radius of the gas disk around TW Hydrae to be and 80 AU respectively. These disk parameters give a surface density of 850 g cm-2 at 5 AU in our model disk, which is roughly twice the gas density required to form Jupiter (Johansen et al., 2007; Lissauer et al., 2009). For the mass loss due to photoevaporation, we use the rates predicted by Owen et al. (2012), i.e. . Robrade & Schmitt (2006) find the X-ray luminosity of TW Hydrae to be erg s-1. We set =0.001, on the low end of the expected range from observations (0.01-0.001), to minimize the time until the photoevaporated gap opens and construct the most optimistic scenario for photoevaporation to carve out surface density gradients that alter the planet’s migration. With these model parameters we can write numerical forms for the viscosity law and surface density profile of TW Hydrae:
| (7) |
| (8) |
In Figure 1, we illustrate the gap-opening process for the disk around TW Hydrae by plotting the viscous timescale and photoevaporation timescale against radius for the present time, and up to 2.5 Myr in the past and in the future according to our analytic disk model. Under this model, the gap-moving timescale is approximately years when the photoevaporation timescale first drops below the viscous timescale, which happened roughly 0.6 Myr ago, near 70 AU. In contrast, the surface density evolution timescale is years at this time. The gap does not open until AU, which agrees well with disk simulations by Owen et al. (2011) using the same photoevaporation model, as well as other studies showing a photoevaporation gap-opening radius of 1-3 AU (Clarke et al., 2001; Alexander et al., 2006b).
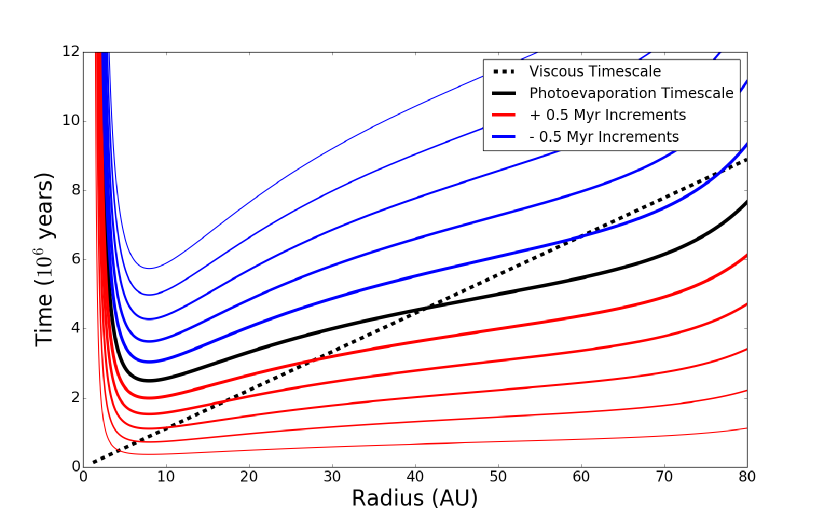
It should be noted that under this model, TW Hydrae’s present photoevaporation timescale is less than its accretion timescale in the outer disk (50 AU), meaning that the surface density profile in the outer disk may be significantly modified by photoevaporation. However, we expect that giant planets formed by core accretion will primarily grow and migrate in the inner disk. Therefore, to fully specify the time available for a newly-formed Jupiter to migrate unaffected by photoevaporation, we calculate the time when our model disk’s structure will be photoevaporation-dominated at 5 AU (). Using Equation 4 with the photoevaporation profile () from Owen et al. (2012) appendix B (model 2 in § 2 of this work), we find Myr, or 2.3 Myr after . This is more than four times the viscous timescale at 5 AU, which suggests that giant planets currently forming by core accretion in TW Hydrae’s inner disk will still have a long epoch of migration ahead, unimpeded by photoevaporation.
As a side note, Ingleby et al. (2013) measure the accretion rate of TW Hydrae to be , which corresponds to =0.0002 if we assume steady-state accretion. However, the presence of a giant planet in the inner disk would greatly suppress accretion and Andrews et al. (2016) found evidence of a narrow gap at 1 AU that could be formed by a giant planet. Our choice of =0.001 is probably a good estimate for this system.
Our analytic calculations suggest that giant planets should have ample time to migrate before photoevaporation can begin to sculpt the disk surface density profile, modifying their migration rates. We next verify our analytic results using numerical simulations with the FARGO code.
4 FARGO simulations
Having demonstrated that newly formed giant planets should migrate for several viscous timescales unimpeded by photoevaporation, we now assess how planets migrate once photoevaporation begins to sculpt the disk surface density profile. Simulations combining photoevaporation with giant planet migration have been performed in 1-D (Alexander & Armitage, 2009; Alexander & Pascucci, 2012; Ercolano & Rosotti, 2015). We use the FARGO 2-D code (Masset, 2000) instead of 1-D models because of the importance of non-axisymmetric flows in migration (Paardekooper, 2014). Though we use an axisymmetric prescription for photoevaporative mass loss , the relative surface density change induced by photoevaporation can be very high for the non-axisymmetric tidal tails and co-rotating horseshoe in the planet’s tidal gap because of their low densities compared to the surrounding disk. Simulations of giant planets migrating in 2-D photoevaporating disks have been performed using FARGO in previous studies (Moeckel & Armitage, 2012; Rosotti et al., 2013, 2015). Moeckel & Armitage (2012) study how planet orbital distributions from planet-planet scattering evolve during the gas disk phase and the n-body phase after the gaseous disk is dispersed by photoevaporation. In contrast to our work, they focus on multi-planet systems, where planet-planet resonance interactions tend to be more important for migration than planet-disk interactions. Rosotti et al. (2013, 2015) study how giant planets inhibiting disk accretion across their orbits leads to various shapes of transitional disks during photoevaporative clearing. To our knowledge, no previous simulations have been carried out in 2-D which attempt to discover how photoevaporation affects single giant-planet migration or the semimajor axis distribution of giant exoplanets.
We divide our FARGO 2-D simulations into 3 categories: Planet-Forming Disks, Fixed Orbits, and ER15 Comparisons/Extensions. In our Planet-Forming Disks we try to answer the question, if a Jupiter-mass planet forms as late as theoretically possible in a disk’s lifetime, when the disk is depleted beyond the minimum mass that will still support giant planet formation, will it still be migrating when photoevaporation can start to sculpt the disk surface density profile? (§ 4.1). A second set of simulations with fixed orbits allows for a high-resolution study of how photoevaporation affects non-axisymmetric flows inside the planet’s tidal gap (§ 4.2). Finally, ER15 Comparison simulations use similar parameters to the XEUV (X-ray + EUV photoevaporation) disk models in ER15, allowing a direct comparison of our methods and results to previous work (§ 4.3).
4.1 Planet-Forming Disks
We construct our Planet-Forming Disk simulations to reflect the circumstances under which giant planets survive until photoevaporation can sculpt surface density changes in the disk. Since giant planets which form early in the lifetime of disks may not survive (e.g. Kley & Nelson, 2012), we start our disks with a surface density profile,
| (9) |
which is roughly 1/3 to 1/5 of estimates of the lowest disk density that can still form a giant planet in the range of initial semimajor axis locations predicted by the Nice model (Tsiganis et al., 2005; Johansen et al., 2007; Lissauer et al., 2009). In contrast to our analytic disk models in §3, the disks we now label “planet-forming” have lost too much mass to keep forming giant planets by planetesimal accretion, but should still be capable of forming Neptune analogs. While our surface density in these models is lower than estimates of the minimum surface density needed to form Jupiter analogs, it differs significantly from the previous studies by AP12 and ER15 who consider surface densities all the way down to those found at the “disk clearing time” when photoevaporation quickly disperses the remaining disk. Alexander & Armitage (2009) explain that for gas giants to survive in their models, the gas giants must form in disks with surface densities at 5-10 AU of g cm-2, or 1.5 orders of magnitude less than predictions of the minimum densities required (Johansen et al., 2007; Lissauer et al., 2009). The semimajor axis distribution features predicted by AP12 and ER15 are enhanced by these late-forming Jupiters, which may not have any physical analogs. However, since all of the planets in AP12 and ER15 start at 5 AU, these late-forming Jupiters may be representative of planets that form much further out in the disk and migrate inward, reaching 5 AU as the disk is about to disperse. Pebble accretion may allow giant planets to form at much larger distances from the star than traditional planetesimal accretion (Lambrechts & Johansen, 2012; Morbidelli & Nesvorny, 2012; Levison et al., 2015; Bitsch et al., 2015), but pebble accretion models have so far focused on disks with g cm-2, more than three times as dense as our model disk. It seems possible that a combination of giant planet migration and viscous evolution of the disk may bring some giant planets formed by pebble accretion to 5 AU at late times. To allow a more direct comparison with AP12 and ER15, we simulate recently-formed Jupiters in much lower disk masses (§ 4.3), and discuss the results of those simulations in § 5.3.
In our Planet-Forming Disk simulations, we assume a blackbody temperature profile for our disks using a luminosity of , corresponding to a solar-mass star aged 5 Myr (D’Antona & Mazzitelli, 1994). This age is appropriate for a disk near in time to dispersal by photoevaporation (6 Myr in Alexander et al., 2006b), yet massive enough not to be very far past the giant planet formation epoch (see § 3). For turbulent viscosity we consider and , but devote much more computational time to because it results in faster accretion, allowing the simulations to reach lower disk densities and greater photoevaporative sculpting. The physical effects of the parameter are discussed more in § 5.2.
For the simulations with , each disk contains one Jupiter-mass (0.001 ) or Neptune-mass (0.00005 ) planet, and the accretion rate onto the planet is set to zero. We note, however, that accretion onto the planet can both alter the rate of migration by removing material from near the planet’s orbit, and reduce the mass transfer efficiency into the inner disk, triggering the UV-switch (D’Angelo et al., 2002; Bate et al., 2003; Alexander & Armitage, 2009; Ward & Canup, 2010; Alexander & Pascucci, 2012; Rosotti et al., 2013; Dürmann & Kley, 2017). For each planet mass, we test each of the three photoevaporation models described in § 2. For each photoevaporation model (EUV, X-ray, or FUV) and each planet mass (Jupiter or Neptune), we consider three starting locations: , , and , where is the disk radius with the minimum photoevaporation timescale, given by . We chose the three planet starting locations to capture the effects of (1) having only the planet’s outer Lindblad resonances in the photoevaporating gap, (2) all of the Lindblad resonances in the gap, and (3) only the inner Lindblad resonances in the gap. We also simulated the migration of Jupiter-mass planets in disks with =0.001, using the X-ray photoevaporation (model 2) with each corresponding value of . A summary of all simulation parameters can be found in Appendix B, Table 2.
For each planet mass, photoevaporation model, value of , and , we run a control simulation with the same planet mass, , and but no photoevaporation (42 simulations in total). We can then separate the effects of photoevaporation from the effects of other parameter choices. To mitigate the numerical effects of suddenly placing a giant planet into a disk, while still restricting the scope of our simulations to Type II migration, we first run each simulation for about 300 orbits with the planet’s migration turned off, then release the planet. This allows the system to stabilize and the planet’s tidal gap to form before it is allowed to migrate. Preliminary runs varying radial and azimuthal grid resolution suggested the code was stable and accurate for the chosen grid of 600 radial by 200 azimuthal zones spanning 1.7–200 AU for X-ray and FUV photoevaporation. We require 800 radial and 200 azimuthal zones spanning 0.3–200 AU for EUV photoevaporation, which forms a gap between 1 and 2 AU. The radial grid is equally spaced in , which provides 9 zones in a Jupiter-mass planet’s Hill radius, sufficient to resolve the corotation region (Masset, 2002; Paardekooper & Papaloizou, 2009).
Finally, we ran test simulations for Jupiter-mass planets in disks with both and , this time adding an exponential taper on the migration torque within the planet’s Hill sphere. While the value of and the inclusion of an exponential Hill torque taper did significantly alter the planet migration rates, they did not contradict our results that migration tracks in disks that are massive enough to form giant planets are mostly unchanged by photoevaporation (see discussion of results in § 5.1). For replication convenience, Table 3 gives our Planet-Forming Disk model parameters in the format of a FARGO parameter file.
4.2 Fixed Orbits
Since the planet’s tidal gap has lower surface density than the surrounding disk, the material within has some of the lowest photoevaporation timescales. The Fixed Orbits parameter study consists of high-resolution simulations of photoevaporation’s effect on the gas directly surrounding the planet. As the tidal gap structure may change with time due to both migration and photoevaporation, keeping the planet’s orbit fixed allows us to isolate the impact of photoevaporation on the gap structure. Fixing the planet’s orbital radius also permits a closer-in outer boundary, improving resolution and computational speed. We can therefore carry out a precise study of how planets’ tidal gaps are affected by photoevaporation without simulating the planets’ entire migration paths. We directly compare simulations where photoevaporation is on and off to quantify how photoevaporation affects the density within the planet’s tidal gap and hence the migration torques.
Here we use the same set of parameters as in our Planet-Forming Disk model except for the disk outer radii, which are reduced to 60 AU for FUV/X-ray and 10 AU for EUV photoevaporation simulations to give us a higher resolution in the tidal gap. We leave the aspect ratio, , profiles, and planet starting locations unchanged (see § 4.1). We include only Jupiter-mass planets since Neptune-mass planets do not carve tidal gaps. In order to study photoevaporation’s effect on the corotation torque—which can switch the migration direction from inward to outward for high-viscosity disks (Crida & Morbidelli, 2007)—we run each simulation using both and . In the disks, the higher viscosity makes it difficult for the planet to carve a deep tidal gap, resulting in 30 times higher surface density in the gap compared to the disks (Fung et al., 2014; Dürmann & Kley, 2015). Here the higher density in the tidal gap can generate corotation torques that can significantly alter the planet’s migration rate (unlike in the disks), but the tidal gap density is still much lower than in the rest of the disk.
Besides resolution, the only difference between these simulations and the Planet-Forming Disks is here we are keeping every planet’s orbit fixed: we update the disk density based on torque from the planet, and we calculate the migration torques but do not apply them to the planet. Once again, every photoevaporating disk is paired with a photoevaporation-off control simulation. We compare these simulations after 50 kyr, which is sufficient time for the planets’ tidal gaps to form, and for photoevaporation to deplete 10% of the disk mass in our FUV models, which have the greatest mass-loss rate. See Appendix B for specific simulation parameters. We note that keeping the planets’ orbits fixed does not conserve angular momentum, but the cumulative error this introduces is small in the simulations we present here. For example, in our disks undergoing FUV photoevaporation, the average torque the planet exerts on the disk is M⋆ AU2 yr-2, but the disks start out with a total angular momentum of 0.13 M⋆ AU2 yr-1, so the error in angular momentum after 50 kyr () is roughly .
4.3 ER15 Comparisons and Extensions
Previous numerical studies of how photoevaporation affects the semimajor axis distribution of exoplanets (AP12 and ER15) used 1-D population synthesis models. These models evolve disks using the 1-D viscous evolution equation for thin disks (Pringle, 1981), a 1-D prescription for planet migration (Lin & Papaloizou, 1986; Armitage et al., 2002), and a photoevaporation term (Clarke et al., 2001). The computational resources saved by moving from 2-D to 1-D disk models allow exploration of a larger parameter space. While AP12 and ER15 both include disks with surface densities comparable to our Planet-Forming Disks in their simulation sets, their analysis is statistical: they do not map individual outcomes to unique parameter combinations, making it difficult to see which part of their simulation parameter space generates their deserts and pileups. However, their models are very similar to previous 1-D models of giant planet migration in photoevaporating disks, which find that planets can only survive if they form in the last 10-20% of the disk lifetime (Armitage et al., 2002; Armitage, 2007; Alexander & Armitage, 2009). Hence it seems likely that the effects observed by AP12 and ER15 originated from lower disk masses at the time of planet formation, which we did not explore in our Planet-Forming Disk simulations (§ 4.1).
Our ER15 Comparisons are FARGO 2-D simulations with the same disk viscosity, aspect ratio, profile, profile, and planet starting locations as the “XEUV” disk models of ER15. Due to computational time constraints, we only simulate 3 planet masses (0.5, 1, and 2 ), while ER15 draw their planet masses from a 0.5-5 uniform distribution. Unlike ER15, who chose migration start times from a uniform distribution between 0.25 Myr and the disk-clearing time, we start all planets at the same time in disk evolution. We choose our start time so the disk has 1/10th of its original mass ( out of the initial in ER15), so photoevaporation will start to affect the surface density profile of the disk during each simulation. Using ER15’s viscous timescale of yr at 10 AU, we calculate for our simulations by assuming a blackbody heating temperature profile (see § 3) for the luminosity, appropriate for a star (D’Antona & Mazzitelli, 1994). For simplicity we will refer to as the rounded value in this paper. We use a 600 radial by 200 azimuthal zone grid with a 1 AU inner boundary. We also ran three test models with all parameters held equal except for using 800, 1000, and 1200 radial zones and a smaller inner boundary (0.3 AU) for 10 kyr for comparison, and found no significant differences. Planetary accretion is neglected as the planet is again assumed to have reached nearly terminal mass. (Note that both AP12 and ER15 find that accreting planets can reduce the mass flux through the gap, draining the inner disk, triggering the UV-switch, and halting their own migration by accelerating disk dissipation; we did not explore this scenario). The ER15 Extensions models are extensions of the ER15 Comparison parameter space to include high viscosity (=0.009545, hereafter referred to as the rounded value 0.01) and lower disk mass (reduced by another factor of 10 to ). High-viscosity models allow a more direct comparison to our Planet-Forming Disk migration tracks, and lower disk mass shows what happens in the extreme case when the disk is tenuous enough for photoevaporation to clear it in much less than the typical Type II migration timescale of 105 years. As in the Planet-Forming Disk models (§ 4.1), each photoevaporating disk is paired with a control simulation where photoevaporation is turned off. See Appendix B for specific simulation parameters.
In the next section, we describe the results of each simulation set, focusing specifically on the differences between the photoevaporating disks and the control simulations with photoevaporation turned off.
5 Results
Our simulations consistently indicate that photoevaporation has little effect on planet migration. In § 5.1, we confirm previous results showing that disks with enough mass to form giant planets have strong migration torques that are minimally affected by photoevaporation (Hasegawa & Ida, 2013), consistent with planet-forming disks being accretion-dominated as defined in § 3. In § 5.2, we present detailed calculations of migration torques, with and without photoevaporation, from our fixed-orbit models. Finally, in § 5.3 we demonstrate that even within the same parameter space of disk mass, viscosity, and photoevaporation model simulated by ER15, the only significant impact photoevaporation has on planet migration is to halt very slowly migrating planets by dissipating the gas disk.
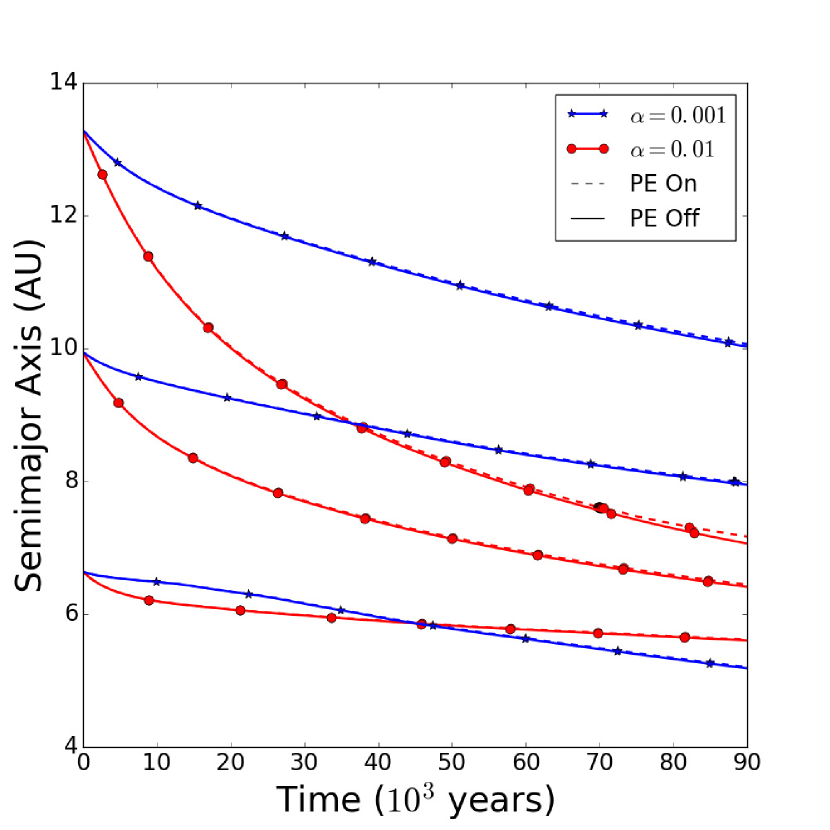
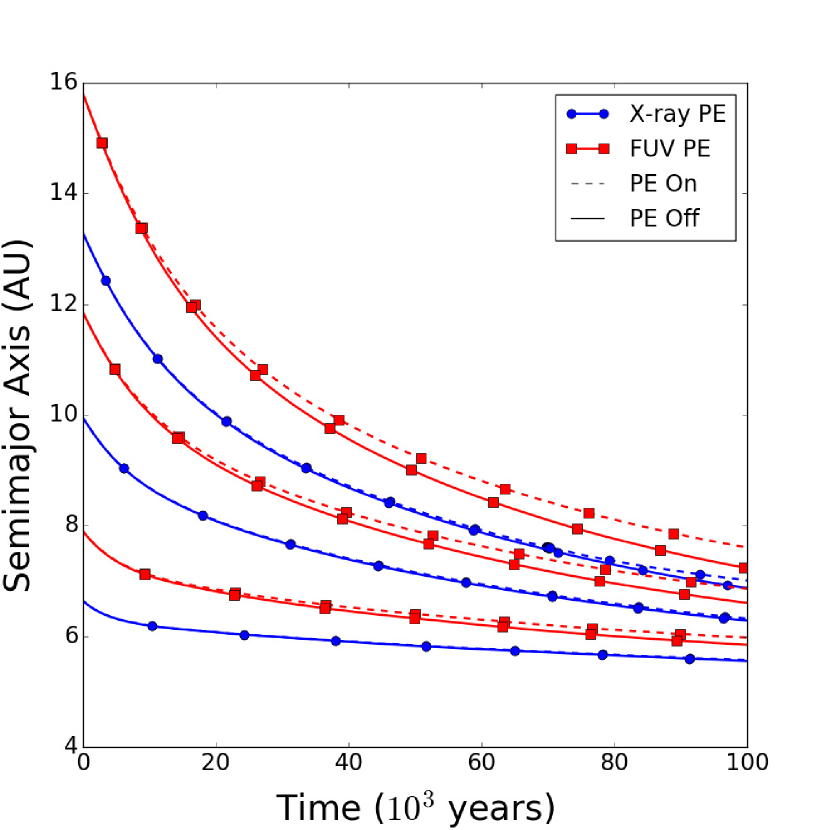
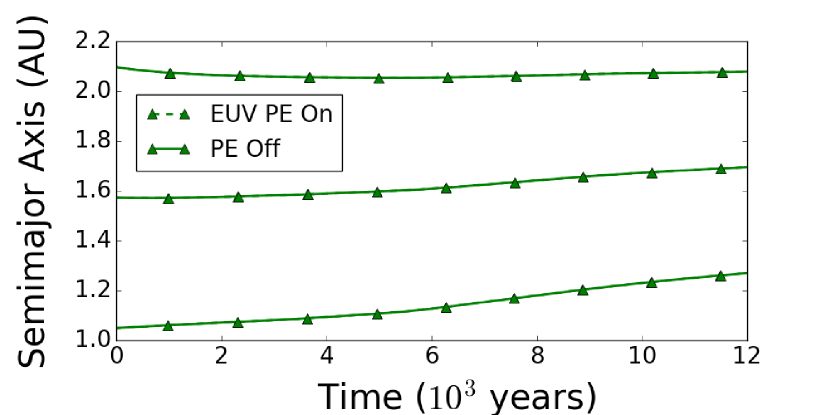
5.1 Planet-Forming Disks Results
Here we explore the effects of EUV, X-ray, and FUV photoevaporation (Font et al., 2004; Gorti & Hollenbach, 2009; Owen et al., 2011, see § 2) on Type II migration in disks recently capable of forming giant planets. Figures 2 and 3 show migration tracks for planets placed just interior to the nascent photoevaporated gap, in the middle of the gap, and just exterior to the gap, for all three profiles (dashed lines) and a disk with . Control simulations are conducted with no photoevaporation (solid lines). The migration tracks for planets in disks with and without photoevaporation are strikingly similar for the X-ray and FUV models (Figure 2); for the EUV case (Figure 3), the migration tracks in the photoevaporation on/off cases are identical. Despite the planets being placed near the location where the photoevaporation timescale is shortest, there is no indication that migration rates are significantly slowed due to a widening photoevaporation-induced gap. Instead, the photoevaporative mass loss merely lowers the migration torque slightly, slowing the planet so that its semimajor axis after 0.1 Myr of migration is a maximum of 5% higher than it would be in a non-photoevaporating disk. The only notable difference between the three profiles is the total predicted disk mass-loss rate, where a higher photoevaporation mass-loss rate (FUV model X-ray model EUV model) results in more slowing of migration due to disk depletion—though effects are almost negligible in all cases. Our results demonstrate that Jupiter-mass planets will have a period of migration unaffected by photoevaporation that lasts at least 0.1 Myr after their formation, consistent with the results of Hasegawa & Ida (2013).
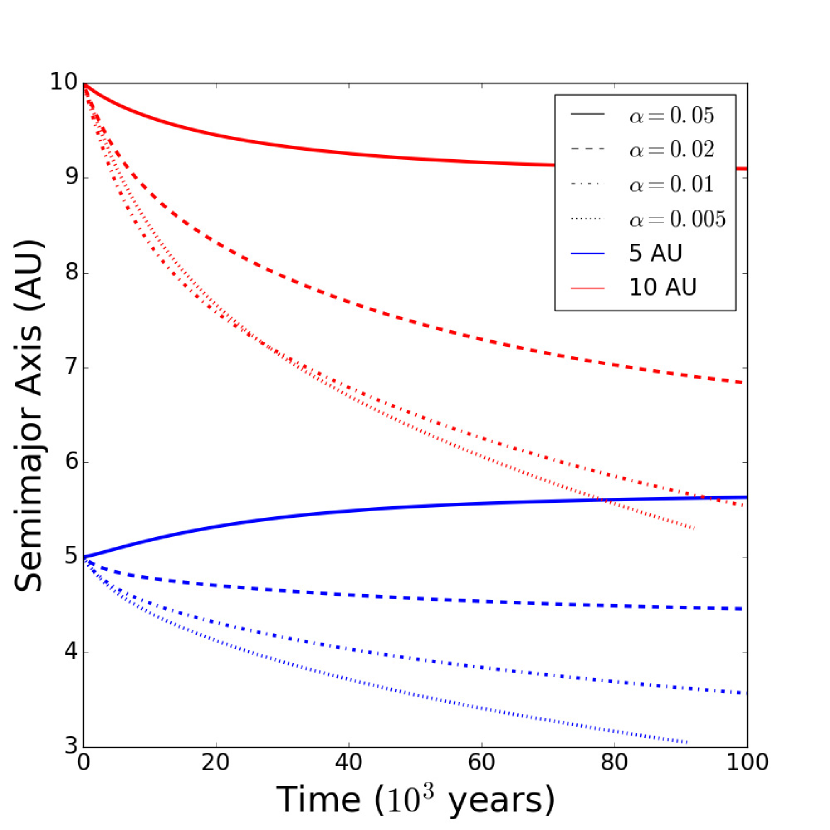
Despite the barely noticeable effect photoevaporation has on our migration tracks, the planets in our X-ray and FUV simulations (and their control simulations with no photoevaporation) all seem to converge at 6-8 AU. This is due to the corotation torque, which tends to push planets outward, and grows as planet mass and disk viscosity increase and as disk radius decreases (Masset, 2001). The relationships between disk viscosity, planet mass, and migration torque have been studied using disk simulations in 1-D, 2-D, and 3-D (e.g. Crida & Morbidelli, 2007; Matsumura et al., 2007; Bitsch et al., 2013). Since we use 2-D disk simulations like Crida & Morbidelli (2007), we can compare our results to theirs directly and extend the parameter space of their simulations. In Figure 4 we present nearly identical simulations to those of Crida & Morbidelli (2007) featuring planets migrating after formation at 5 AU in blue (see Appendix B for FARGO parameters). We extend the work of Crida & Morbidelli (2007) by adding a second set of migration tracks for planets formed at 10 AU in red. Figure 4 shows that two equal-mass planets in a disk with uniform turbulent efficiency can migrate in different directions, or in the same direction at different rates, depending on their initial orbital radii, which accounts for the planets placed at the outside of each photoevaporating region in Figure 2 “catching up” to the planets starting at smaller semimajor axes. Likewise, planets starting at the same location can migrate either inward or outward depending the strength of the corotation torque (Baruteau & Masset, 2008; Paardekooper & Papaloizou, 2008; Masset & Casoli, 2009; Kretke & Lin, 2012; Pierens et al., 2012). We find that the disk viscosity has a far stronger effect on migration tracks than photoevaporation in a disk with enough mass to have recently formed planets. Indeed, a set of simulations identical to those in Figure 2, except with instead of , finds much slower migration but still no substantial effects caused by photoevaporation (Appendix C, Figure 12).
Planet mass also plays an important role in determining migration tracks (Ward, 1997; Masset, 2002; Kley & Crida, 2008; Kley et al., 2009; Bitsch & Kley, 2011b). Figure 5 compares migration tracks of Neptune-mass planets and Jupiter-mass planets that start from the same orbital radii in the disk with (same as in Figure 2). Dashed lines show planets in disks being photoevaporated by X-ray radiation (model 2 in § 2), and solid lines show control simulations with no photoevaporation. The Neptune-mass planets are not massive enough to open a gap in the disk, so they experience Type I migration. Here, too, photoevaporation has a barely discernible effect on migration tracks. Variations in corotation torque are clearly the dominant force in shaping migration tracks in our Planet-Forming Disks, and we must conclude that the impact of photoevaporation on migration is negligible in the era directly following giant planet formation.
5.2 Fixed Orbits Results
In § 5.1 we showed that in a disk with , roughly 1/3 to 1/5 of the minimum surface density that allows Jupiter-mass planets to form near 5 AU (Johansen et al., 2007; Lissauer et al., 2009), photoevaporation has almost no effect on planet migration. Instead, migration speed and direction are primarily determined by the corotation torque, which in turn is a function of viscosity and planet mass (Baruteau & Masset, 2008; Paardekooper & Papaloizou, 2008). More recent 3-D simulations of accreting gas giants have shown that the corotation torque is much higher than predicted in 2-D, and may slow predicted migration rates by a factor of 3 (Fung et al., 2015). To discover how photoevaporation may modify corotation torque, we have carried out the set of simulations described in § 4.2, where we allow the planet to torque the disk and modify the disk’s density structure, but do not allow the disk to torque the planet. However, though we hold the planet on a fixed orbit, we calculate the torque the disk would exert on the planet at select time snapshots and pinpoint the locations where photoevaporation is modifying the migration torque. Even though we carried out identical Fixed Orbits simulations for all three photoevaportion models listed in § 2, we only present detailed results for the FUV photoevaporation model as it has the greatest photoevaporative mass-loss rate, making it an ideal candidate for visualizing how photoevaporation affects tidal gap structure. FUV-driven mass loss is mostly external to the planet’s orbit, but we find that the FUV photoevaporation model still causes greater depletion of the tidal gap after 50,000 years than either of the EUV or X-ray photoevaporation models. Outside the tidal gap, viscous forces dominate the gas surface density profile, so the photoevaporative mass-loss rate affects the surface density but the photoevaporation profile shape does not. The effects of FUV photoevaporation on tidal gap structure that we present here should be regarded simply as scaled-up versions of the effects of EUV and X-ray photoevaporation.
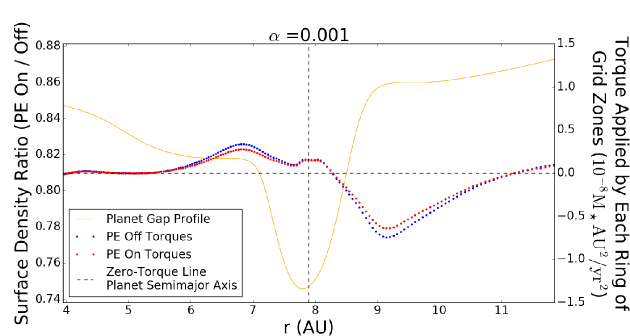
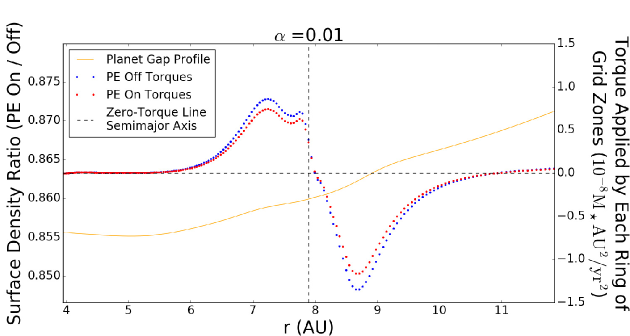
In Figure 6, we show migration torques after 50,000 years of disk evolution and FUV photoevaporation in disks with (top) and (bottom, same as in § 5.1). We fix the planet orbits at 8 AU, since a planet starting at AU migrates about 4 AU in 50,000 years in this model disk (Figure 2). We show migration torques in the photoevaporating (red) and non-photoevaporating (blue) disks. In orange, we over-plot , the ratio of surface density in the photoevaporating disk to surface density in the control, non-photoevaporating disk. Values below unity indicate areas depleted by photoevaporation. Note that the tidal gap opened by the planet is present in simulations both with PE on and PE off, so it will not show up in Figure 6 unless deepened by photoevaporation, as seen in the disk with . For both values of , photoevaporation depletes the global disk density by 13% after 50,000 years, reducing migration torque per annulus by roughly the same percentage. The extra depletion in the planet’s tidal gap in the disk with hardly alters the net migration torque, as the strongest torque comes from outside the tidal gap (recall that the corotation torque weakens in weakly turbulent disks; see § 5.1 and Figure 4). The fact that photoevaporation depletes the disk globally, instead of only in a narrow annulus, results from the photoevaporation timescale exceeding the viscous timescale throughout the disk, so viscous transport of disk material refills depleted regions faster than they can be carved out by photoevaporation. Migration torques are reduced over broad regions of the disk, but in a manner indistinguishable from other large-scale sources of disk depletion such as accretion onto the star—no surface density gradients steep enough to significantly alter migration tracks are formed as a result of photoevaporation.
We see a small localized effect in the planet’s tidal gap in the disk with , where the low disk density and long viscous timescale allow photoevaporation to deplete a narrow region by a further 10% on top of the overall 13% depletion in the entire plotted region. This depletion is removing material that would provide a positive (outward) torque, so the planet’s inward migration would speed up if we applied migration torques in this simulation set. However, after a short epoch of fast inward migration, the planet would move interior to the depleted annulus and its migration rate would slow down. A density reduction in the corotation region would create a burst of migration speed that forces the planet to quickly move into a less depleted region of the disk, becoming a self-limiting process: the deeper the depletion at corotation, the faster the planet moves into a denser region. Indeed, in Figure 8 in the next section, we see a slight initial speed-up in migration of the 1.0 MJ planet in an disk as photoevaporation has had a chance to clear out co-rotating material before we turn on the migration torques and “release” the planet (see § 4), but the long-term behavior is dominated by a slight slowing of migration due to global disk depletion.
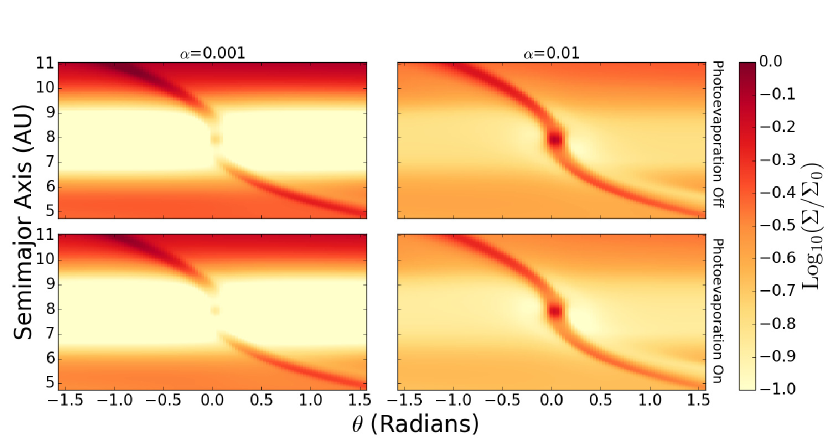
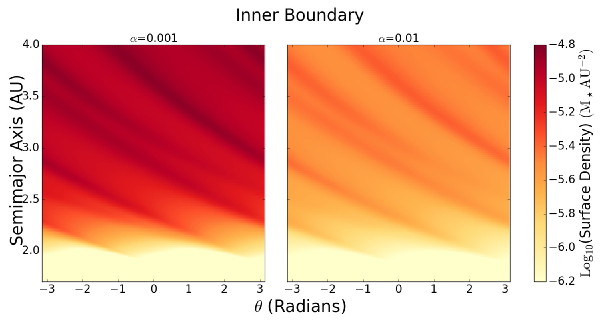
Two caveats about interpreting the azimuthally averaged surface density ratio, , in Figure 6 are (1) azimuthal averaging masks how photoevaporation is affecting non-axisymmetric tidal flows and (2) the density ratio does not, by itself, show the planet’s tidal gap structure. In Figure 7, we show pseudocolor plots of the tidal gap structure normalized to the , unperturbed surface density profile, , for years. The left column shows disks with and the right-hand column shows disks with ; disks in the top row experience no photoevaporation and disks in the bottom row are photoevaporating according to model 3 (FUV). Even with the extra 10% photoevaporation-induced surface density reduction in the tidal gap for the disk with , the functional form of the mass distribution inside the gap is relatively unaffected by photoevaporation. More severe changes to the mass distribution inside the gap may appear as the disk evolves beyond the 50,000 years of photoevaporation simulated here, but it seems that a disk that recently formed giant planets is massive enough, and the nascent photoevaporating gap is wide enough, that a 10-20% surface density depletion inside a giant planet’s tidal gap barely alters the migration torque balance. Our detailed torque analysis from the Fixed Orbit Simulations confirms our conclusion that newly-formed giant planets have a long migration epoch where they experience very little interference from photoevaporation.
 |
 |
5.3 ER15 Comparisons and Extensions Results
So far we have presented two sets of simulations in which photoevaporation has little effect on giant planet migration. Our results seem to point to a different conclusion from AP12 and ER15, who concluded that photoevaporation sculpts the semimajor axis distribution of giant planets. However, until now we have only considered planets that are formed in disks with significantly higher surface densities than the AP12 and ER15 disks that host surviving planets. Now we analyze whether or not photoevaporation can significantly affect giant planet migration tracks using a simulation set with disk parameters following ER15. To see how quickly planets may migrate near the disk clearing time, we also include extremely low-mass disks, in which photoevaporation creates strong surface density gradients much more quickly than the planets migrate. We also include disks with for comparison with our Planet-Forming Disk simulations (§ 5.1).
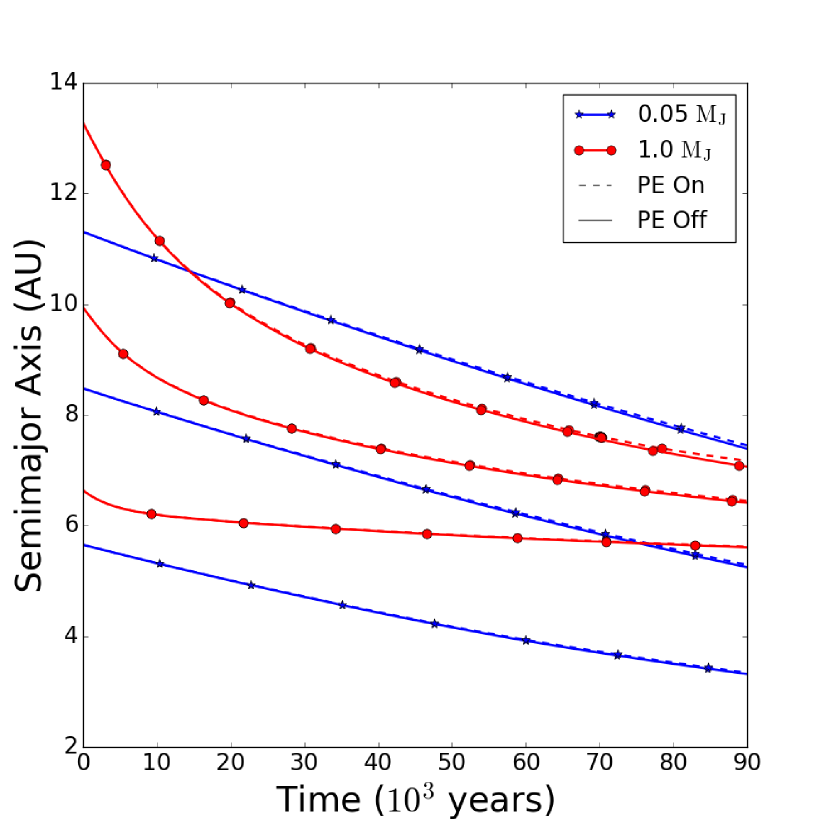
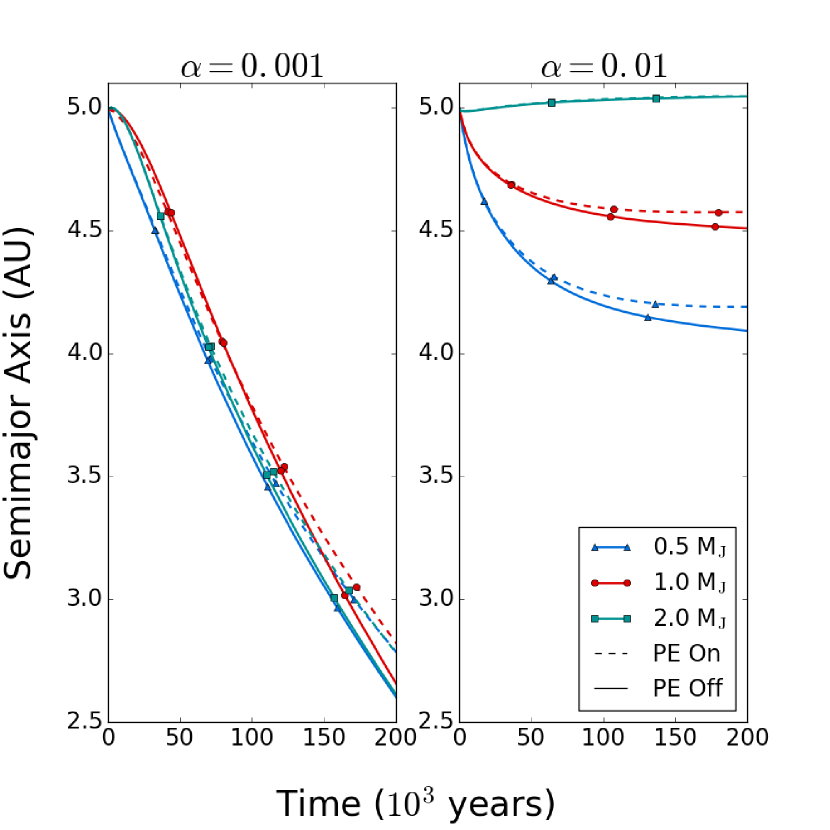
Figure 8 (left panel) shows our ER15 Comparison model featuring different planet masses. As in the Planet-Forming Disks (§ 5.1), we find that including photoevaporation changes the planets’ semimajor axes by at most 3% over the course of 200,000 years of migration. The left panel of Figure 8 demonstrates that the ER15 models’ lower viscosity results in less material in the gaps, weaker corotation torque, and hence faster migration than in the X-ray photoevaporating disks with plotted in Figure 2. We extend the ER15 Comparison parameter space to high viscosity in Figure 8 (right panel); all other disk parameters remain identical to those of ER15 (except we use 1/10th their initial disk mass to better match the conditions of their surviving planet population). The dependence of corotation torque on planetary mass (e.g. Crida & Morbidelli, 2007) is evident in the high- migration tracks as here there is enough material filling in the tidal gaps for corotation torque to dominate migration. Although the two sets of migration tracks shown in Figure 8 are very different, we do not see photoevaporation significantly affecting the planets’ migration in either set. As in the previous experiments presented in this paper, photoevaporation has little effect on the planets’ semimajor axes after 200,000 years of migration.
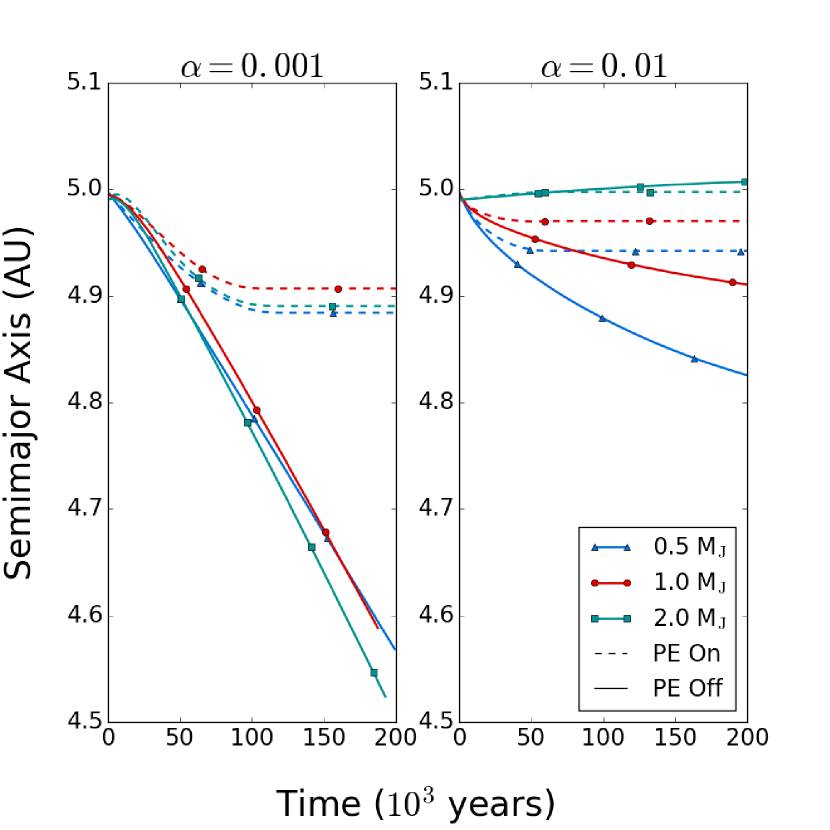
We further extend the ER15 Comparison parameter space to lower initial disk mass in Figure 9. Here we are simulating disks with , so we see sharp surface density gradients sculpted by photoevaporation. Initially, the planets in photoevaporating disks migrate at nearly the same rates as the planets in the control simulations. Then, between 50,000 and 100,000 years after the start of migration, photoevaporation dissipates almost all of the remaining disk gas. The planets hardly migrate at all after Myr as there is very little mass in the disk to torque them, as also found by Lyra et al. (2010) for planets with . A limitation of our ER15 Comparison/Extension results is that we do not directly simulate the gradual depletion that would turn the disks from Figure 8 () into the disks from Figure 9 (), or the planet migration during this depletion epoch. Due to computational time constraints, we may be missing an epoch in between the time periods studied in Figures 8 and 9 during which photoevaporation might gradually begin to slow giant planet migration. Still, these results suggest that the corotation torque, which acts during the entire migration epoch (100,000 yr - 2 Myr) for the planet/disk parameters simulated here (e.g. Crida & Morbidelli, 2007; Dürmann & Kley, 2015), has more influence on migration tracks than photoevaporation. Since photoevaporation only sculpts steep surface density gradients during the final 100,000 years before disk dispersal, by which time disk masses are low enough to have nearly halted migration, we find that photoevaporation may only modify final planet locations by perhaps a few tenths of an AU, even for very late-forming planets as in AP12 and ER15.
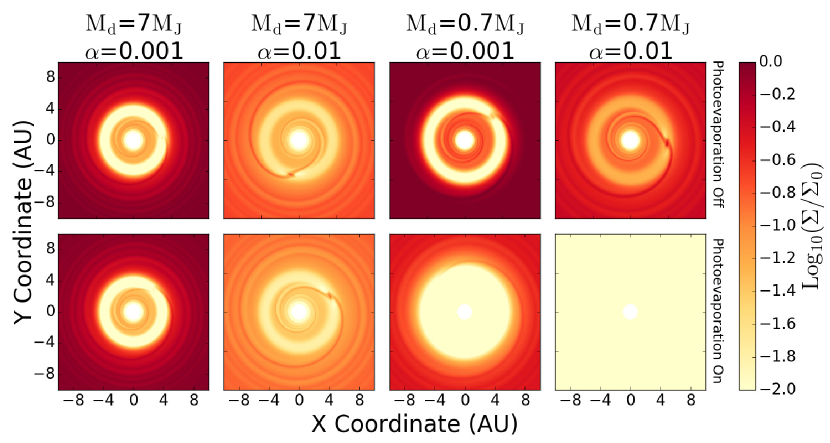
Since ER15 did not map individual migration tracks, we cannot be sure which part of their parameter space gave rise to the 1-2 AU planet pileup found in their models. The pileup they predict is likely due to the PIPE mechanism, where giant planets inhibit accretion across their tidal gaps, starving the interior disk of material and speeding up photoevaporative clearing by opening up the outer disk to the direct field (Alexander & Armitage, 2009; Alexander & Pascucci, 2012; Rosotti et al., 2013). To see why, we examine Figure 10, where we plot the ER15 Comparison and Extension models’ normalized surface density distributions, , at Myr (when the migration tracks in the left panel of Figure 9 flatten). In the disks with (), photoevaporation has little accumulated effect on the surface density distribution, even after 0.1 Myr of evolution. For disks with (), photoevaporation’s modifications to the surface density distributions are obvious. In the weakly turbulent disk with , almost all material interior to the tidal gap has evaporated or accreted onto the star without being replenished, as photoevaporation and the planet’s torque on the disk both inhibit material from accreting across the planet’s tidal gap and replenishing the inner disk. However, our simulations suggest that PIPE should have little effect on the planets’ overall migration: we find significant gas depletion well before the direct X-ray field would reach the disk exterior to the planet’s orbit (though we do not actually model the direct field), so the planets are hardly moving by the time the inner disk drains (note the small range of semimajor axes on the vertical axis of Figure 9).
In the disk with and , viscosity moves material from the outer to the inner disk more efficiently, helping photoevaporation to drain the entire modeled region within 0.1 Myr (Figure 10). Here, too, gas densities are too low to drive migration. Roughly speaking, the planet must interact with approximately its own mass in disk gas in order to migrate significantly; the plots in Figure 10 confirm the intuitive result that disks with less mass than the planets they host cannot drive migration.
6 Discussion and Conclusions
We have investigated the interaction between protoplanetary disk photoevaporation and giant planet migration using 2-D disk+planet models. In contrast to previous models claiming a photoevaporation-induced pileup of giant planets near 1 AU (Alexander & Pascucci, 2012; Ercolano & Rosotti, 2015), we directly compare simulations with photoevaporation on and off to assess its impact. Any interaction between photoevaporation and planet migration is expected to be too small to be visible in the current semimajor axis distribution of exoplanets based on our results:
-
1.
When disk densities get too low for giant planets to form, viscous forces continue to dominate planet-disk interactions over photoevaporation for 2 Myr.
-
2.
During the vast majority of a giant planet’s migration, photoevaporation does not create any time- or location-specific perturbations in its migration track.
-
3.
The highest photoevaporation-rate model we tested (3 M☉ yr-1; FUV) results in less than 5% change in final semimajor axis for a recently-formed Jupiter after 0.1 Myr of migration, which is entirely due to the extra disk mass loss.
-
4.
By the time photoevaporation can create steep enough gradients in the disk surface density to significantly perturb migration rates, migration is very slow, and may only continue for a few tenths of an AU before gas disk dissipation.
However, our conclusions come with the caveat that, due to limits on computing time, we did not sample the space of significant parameters (i.e. planet mass, planet formation location, disk viscosity, and disk mass) as fully as we would like to make conclusions about the entire population of giant exoplanets. While we were unable to find any cases of disk photoevaporation significantly altering Type II migration rates in our simulations, there may be pockets of parameter space with more significant interactions that we missed. Small effects such as depletion of co-rotating material in the tidal gaps of planets in low-viscosity disks (§ 5.2) may be more significant in the unexplored parameter space than we found in our simulations. Future work with more computational resources could further clarify the effects of photoevaporation on corotation torque.
Another caveat to our conclusions is that in 2-D, as opposed to 3-D, the vertical disk density profile is not modified by the presence of the giant planet or photoevaporation. Photoevaporation would almost certainly modify the vertical disk structure near the planet since it expels material that is highest above the midplane, and the most significant vertical density sculpting caused by photoevaporation would occur in the depleted co-orbital region due to its low surface density. Vertical density sculpting may alter the local disk temperature profile by changing the height above the midplane at which stellar radiation is absorbed (e.g. Jang-Condell, 2008; Jang-Condell & Turner, 2012, 2013), a process which we have not explored. By linking a photoevaporation model with a 3-D simulation of planet migration such as those performed by Fung et al. (2017) for small planets, one could explore the effects of photoevaporation on vertical disk structure near a planet, though such a simulation would be computationally expensive. Also, since the photoevaporation models we used assume a constant stellar UV/X-ray radiation field and were derived for disks without planets, our disk mass loss profile is azimuthally symmetric and does not vary over time. However, disk density structures such as a planet’s tidal gap, horseshoe region and tidal tails may significantly alter local photoevaporation rates.
Our 2-D simulations have the advantage over 1-D simulations by AP12 and ER15 in that we model the effects of photoevaporation on non-axisymmetric gas inside the planet’s tidal gap, especially corotating material. Furthermore, our 2-D simulations of viscous disks naturally include gas accretion across the planet’s tidal gap (Dürmann & Kley, 2015), forming tidal tails that allow stars that host planetary systems to still accrete gas (Dodson-Robinson & Salyk, 2011; Drabek-Maunder et al., 2016). Although the 1-D migration torque formula used by AP12 and ER15 treats the tidal gap walls as impermeable, AP12 and ER15 mimic a gas-permeable gap with an accreting planet by using coupled parameters that describe gap-crossing efficiency and planet accretion efficiency, and are functions of planet mass and disk viscosity (Veras & Armitage, 2004). In both studies, the efficiency parameters significantly affect the synthesized semimajor axis distributions. We do not consider planet accretion, which could reduce gas flow across the tidal gap (D’Angelo et al., 2002; Bate et al., 2003; Ward & Canup, 2010; Dürmann & Kley, 2017) and speed up viscous depletion of the inner disk. It is possible that the PIPE process (Rosotti et al., 2013) halts migration for many gas giants, an effect we have not captured here.
AP12 and ER15 do not include comparison simulations with photoevaporation off, so the exact effect of photoevaporation on their semimajor axis distributions is not known. However, AP12 convincingly argue that the deserts and pileups in their semimajor axis distributions are caused by planetary tidal gaps suppressing accretion to the inner disk, allowing it to drain quickly and triggering the UV-switch where direct-field EUV photoevaporation (Alexander et al., 2006a, b) quickly removes the outer disk (for a more detailed explanation of this mechanism, called PIPE, see Alexander & Armitage, 2009; Rosotti et al., 2013). ER15 use the same UV-switch, so features in their semimajor axis distributions are also probably due to the PIPE mechanism. The semi-major axis distributions predicted by AP12 and ER15 appear roughly consistent with our findings that a marginal effect of PIPE may be overshadowed by a long epoch of migration. The presence of a long migration epoch casts doubt on whether photoevaporation can leave a signature on the semimajor axis distribution of giant planets, as photoevaporation cannot affect giant planet migration at late times if migration has already stalled due to other processes. In high-viscosity disks, corotation torque can slow or even reverse migration (Crida & Morbidelli, 2007; Pepliński et al., 2008; Paardekooper & Papaloizou, 2009; Dittkrist et al., 2014; Paardekooper, 2014). Tidal circularization of giant planets can halt migration at very small radii (Plavchan & Bilinski, 2013). Traps for giant planet cores created by ice lines, dead zones, and heat transitions may determine giant planet formation locations, leaving more significant signatures on the final giant planet semimajor axis distribution (Masset et al., 2006; Kretke & Lin, 2007; Sándor et al., 2011; Hasegawa & Pudritz, 2011, 2012, 2013, 2014). In multi-planet systems, orbital migration from planet-planet scattering may dominate over migration due to planet-disk interactions (Ford et al., 2001; Ford & Rasio, 2008; Beaugé & Nesvorný, 2012; Moeckel & Armitage, 2012).
Finally, we note that the observed pileup in the semimajor axis distribution of exoplanets around 1 AU (Udry & Santos, 2007; Wright et al., 2009; Hasegawa & Pudritz, 2012; Beaugé & Nesvorný, 2013) loses much of its strong visual presence when the distribution is plotted on a linear semimajor axis scale. Considering the complex nature of planet migration and its many theorized halting mechanisms, we question the usefulness of plotting planet frequency on a log semimajor axis scale when testing migration theory. If photoevaporation does have a significant effect on the semimajor axis distribution of exoplanets, such an effect must exist outside of both the parameter space of our simulations and the known properties of confirmed exoplanets.
References
- Alexander et al. (2014) Alexander, R., Pascucci, I., Andrews, S., Armitage, P., & Cieza, L. 2014, Protostars and Planets VI, 475
- Alexander & Armitage (2007) Alexander, R. D., & Armitage, P. J. 2007, MNRAS, 375, 500
- Alexander & Armitage (2009) —. 2009, ApJ, 704, 989
- Alexander et al. (2006a) Alexander, R. D., Clarke, C. J., & Pringle, J. E. 2006a, MNRAS, 369, 216
- Alexander et al. (2006b) —. 2006b, MNRAS, 369, 229
- Alexander & Pascucci (2012) Alexander, R. D., & Pascucci, I. 2012, MNRAS, 422, L82
- Andrews et al. (2016) Andrews, S. M., Wilner, D. J., Zhu, Z., et al. 2016, ApJ, 820, L40
- Armitage (2007) Armitage, P. J. 2007, ApJ, 665, 1381
- Armitage (2011) —. 2011, ARA&A, 49, 195
- Armitage et al. (2002) Armitage, P. J., Livio, M., Lubow, S. H., & Pringle, J. E. 2002, MNRAS, 334, 248
- Barge & Sommeria (1995) Barge, P., & Sommeria, J. 1995, A&A, 295, L1
- Baruteau & Masset (2008) Baruteau, C., & Masset, F. 2008, ApJ, 672, 1054
- Bate et al. (2003) Bate, M. R., Lubow, S. H., Ogilvie, G. I., & Miller, K. A. 2003, MNRAS, 341, 213
- Beaugé & Nesvorný (2012) Beaugé, C., & Nesvorný, D. 2012, ApJ, 751, 119
- Beaugé & Nesvorný (2013) —. 2013, ApJ, 763, 12
- Bergin et al. (2013) Bergin, E. A., Cleeves, L. I., Gorti, U., et al. 2013, Nature, 493, 644
- Bitsch et al. (2013) Bitsch, B., Boley, A., & Kley, W. 2013, A&A, 550, A52
- Bitsch & Kley (2011a) Bitsch, B., & Kley, W. 2011a, A&A, 530, A41
- Bitsch & Kley (2011b) —. 2011b, A&A, 536, A77
- Bitsch et al. (2015) Bitsch, B., Lambrechts, M., & Johansen, A. 2015, A&A, 582, A112
- Bryden et al. (2000) Bryden, G., Różyczka, M., Lin, D. N. C., & Bodenheimer, P. 2000, ApJ, 540, 1091
- Ciesla & Cuzzi (2006) Ciesla, F. J., & Cuzzi, J. N. 2006, Icarus, 181, 178
- Clarke et al. (2001) Clarke, C. J., Gendrin, A., & Sotomayor, M. 2001, MNRAS, 328, 485
- Coleman & Nelson (2014) Coleman, G. A. L., & Nelson, R. P. 2014, MNRAS, 445, 479
- Crida & Bitsch (2017) Crida, A., & Bitsch, B. 2017, Icarus, 285, 145
- Crida & Morbidelli (2007) Crida, A., & Morbidelli, A. 2007, MNRAS, 377, 1324
- Crida et al. (2006) Crida, A., Morbidelli, A., & Masset, F. 2006, Icarus, 181, 587
- D’Angelo et al. (2002) D’Angelo, G., Henning, T., & Kley, W. 2002, A&A, 385, 647
- D’Antona & Mazzitelli (1994) D’Antona, F., & Mazzitelli, I. 1994, ApJS, 90, 467
- de Val-Borro et al. (2006) de Val-Borro, M., Edgar, R. G., Artymowicz, P., et al. 2006, MNRAS, 370, 529
- Dittkrist et al. (2014) Dittkrist, K.-M., Mordasini, C., Klahr, H., Alibert, Y., & Henning, T. 2014, A&A, 567, A121
- Dodson-Robinson & Salyk (2011) Dodson-Robinson, S. E., & Salyk, C. 2011, ApJ, 738, 131
- Drabek-Maunder et al. (2016) Drabek-Maunder, E., Mohanty, S., Greaves, J., et al. 2016, ApJ, 833, 260
- Dürmann & Kley (2015) Dürmann, C., & Kley, W. 2015, A&A, 574, A52
- Dürmann & Kley (2017) —. 2017, A&A, 598, A80
- Ercolano & Rosotti (2015) Ercolano, B., & Rosotti, G. 2015, MNRAS, 450, 3008
- Font et al. (2004) Font, A. S., McCarthy, I. G., Johnstone, D., & Ballantyne, D. R. 2004, ApJ, 607, 890
- Ford et al. (2001) Ford, E. B., Havlickova, M., & Rasio, F. A. 2001, Icarus, 150, 303
- Ford & Rasio (2008) Ford, E. B., & Rasio, F. A. 2008, ApJ, 686, 621
- Fung et al. (2015) Fung, J., Artymowicz, P., & Wu, Y. 2015, ApJ, 811, 101
- Fung et al. (2017) Fung, J., Masset, F., Lega, E., & Velasco, D. 2017, AJ, 153, 124
- Fung et al. (2014) Fung, J., Shi, J.-M., & Chiang, E. 2014, ApJ, 782, 88
- Goldreich & Tremaine (1980) Goldreich, P., & Tremaine, S. 1980, ApJ, 241, 425
- Gorti & Hollenbach (2009) Gorti, U., & Hollenbach, D. 2009, ApJ, 690, 1539
- Gorti et al. (2016) Gorti, U., Liseau, R., Sándor, Z., & Clarke, C. 2016, Space Sci. Rev., 205, 125
- Greenberg et al. (1978) Greenberg, R., Hartmann, W. K., Chapman, C. R., & Wacker, J. F. 1978, Icarus, 35, 1
- Gressel et al. (2015) Gressel, O., Turner, N. J., Nelson, R. P., & McNally, C. P. 2015, ApJ, 801, 84
- Haisch et al. (2001) Haisch, Jr., K. E., Lada, E. A., & Lada, C. J. 2001, ApJ, 553, L153
- Hartmann et al. (1998) Hartmann, L., Calvet, N., Gullbring, E., & D’Alessio, P. 1998, ApJ, 495, 385
- Hasegawa & Ida (2013) Hasegawa, Y., & Ida, S. 2013, ApJ, 774, 146
- Hasegawa & Pudritz (2011) Hasegawa, Y., & Pudritz, R. E. 2011, MNRAS, 417, 1236
- Hasegawa & Pudritz (2012) —. 2012, ApJ, 760, 117
- Hasegawa & Pudritz (2013) —. 2013, ApJ, 778, 78
- Hasegawa & Pudritz (2014) —. 2014, ApJ, 794, 25
- Hoff et al. (1998) Hoff, W., Henning, T., & Pfau, W. 1998, A&A, 336, 242
- Hollenbach et al. (1994) Hollenbach, D., Johnstone, D., Lizano, S., & Shu, F. 1994, ApJ, 428, 654
- Hollenbach et al. (1993) Hollenbach, D., Johnstone, D., & Shu, F. 1993, in Astronomical Society of the Pacific Conference Series, Vol. 35, Massive Stars: Their Lives in the Interstellar Medium, ed. J. P. Cassinelli & E. B. Churchwell, 26
- Ingleby et al. (2013) Ingleby, L., Calvet, N., Herczeg, G., et al. 2013, ApJ, 767, 112
- Jang-Condell (2008) Jang-Condell, H. 2008, ApJ, 679, 797
- Jang-Condell & Turner (2012) Jang-Condell, H., & Turner, N. J. 2012, ApJ, 749, 153
- Jang-Condell & Turner (2013) —. 2013, ApJ, 772, 34
- Johansen et al. (2007) Johansen, A., Oishi, J. S., Mac Low, M.-M., et al. 2007, Nature, 448, 1022
- Johansen et al. (2009) Johansen, A., Youdin, A., & Klahr, H. 2009, ApJ, 697, 1269
- Johnstone et al. (2004) Johnstone, D., Matsuyama, I., McCarthy, I. G., & Font, A. S. 2004, in Revista Mexicana de Astronomia y Astrofisica Conference Series, Vol. 22, Revista Mexicana de Astronomia y Astrofisica Conference Series, ed. G. Garcia-Segura, G. Tenorio-Tagle, J. Franco, & H. W. Yorke, 38–41
- Kley et al. (2009) Kley, W., Bitsch, B., & Klahr, H. 2009, A&A, 506, 971
- Kley & Crida (2008) Kley, W., & Crida, A. 2008, A&A, 487, L9
- Kley & Nelson (2012) Kley, W., & Nelson, R. P. 2012, ARA&A, 50, 211
- Kretke & Lin (2007) Kretke, K. A., & Lin, D. N. C. 2007, ApJ, 664, L55
- Kretke & Lin (2012) —. 2012, ApJ, 755, 74
- Lambrechts & Johansen (2012) Lambrechts, M., & Johansen, A. 2012, A&A, 544, A32
- Levison et al. (2015) Levison, H. F., Kretke, K. A., Walsh, K. J., & Bottke, W. F. 2015, Proceedings of the National Academy of Science, 112, 14180
- Liffman (2003) Liffman, K. 2003, PASA, 20, 337
- Lin et al. (1996) Lin, D. N. C., Bodenheimer, P., & Richardson, D. C. 1996, Nature, 380, 606
- Lin & Papaloizou (1986) Lin, D. N. C., & Papaloizou, J. 1986, ApJ, 309, 846
- Lissauer et al. (2009) Lissauer, J. J., Hubickyj, O., D’Angelo, G., & Bodenheimer, P. 2009, Icarus, 199, 338
- Lovelace et al. (1999) Lovelace, R. V. E., Li, H., Colgate, S. A., & Nelson, A. F. 1999, ApJ, 513, 805
- Lynden-Bell & Pringle (1974) Lynden-Bell, D., & Pringle, J. E. 1974, MNRAS, 168, 603
- Lyra et al. (2010) Lyra, W., Paardekooper, S.-J., & Mac Low, M.-M. 2010, ApJ, 715, L68
- Masset (2000) Masset, F. 2000, A&AS, 141, 165
- Masset (2001) Masset, F. S. 2001, ApJ, 558, 453
- Masset (2002) —. 2002, A&A, 387, 605
- Masset & Casoli (2009) Masset, F. S., & Casoli, J. 2009, ApJ, 703, 857
- Masset et al. (2006) Masset, F. S., Morbidelli, A., Crida, A., & Ferreira, J. 2006, ApJ, 642, 478
- Matsumura et al. (2007) Matsumura, S., Pudritz, R. E., & Thommes, E. W. 2007, ApJ, 660, 1609
- Matsuyama et al. (2003) Matsuyama, I., Johnstone, D., & Murray, N. 2003, ApJ, 585, L143
- Moeckel & Armitage (2012) Moeckel, N., & Armitage, P. J. 2012, MNRAS, 419, 366
- Morbidelli et al. (2008) Morbidelli, A., Crida, A., Masset, F., & Nelson, R. P. 2008, A&A, 478, 929
- Morbidelli & Nesvorny (2012) Morbidelli, A., & Nesvorny, D. 2012, A&A, 546, A18
- Nelson et al. (2000) Nelson, R. P., Papaloizou, J. C. B., Masset, F., & Kley, W. 2000, MNRAS, 318, 18
- Owen et al. (2012) Owen, J. E., Clarke, C. J., & Ercolano, B. 2012, MNRAS, 422, 1880
- Owen et al. (2011) Owen, J. E., Ercolano, B., & Clarke, C. J. 2011, MNRAS, 412, 13
- Owen et al. (2010) Owen, J. E., Ercolano, B., Clarke, C. J., & Alexander, R. D. 2010, MNRAS, 401, 1415
- Paardekooper (2014) Paardekooper, S.-J. 2014, MNRAS, 444, 2031
- Paardekooper & Papaloizou (2008) Paardekooper, S.-J., & Papaloizou, J. C. B. 2008, A&A, 485, 877
- Paardekooper & Papaloizou (2009) —. 2009, MNRAS, 394, 2283
- Pascucci & Sterzik (2009) Pascucci, I., & Sterzik, M. 2009, ApJ, 702, 724
- Pascucci et al. (2011) Pascucci, I., Sterzik, M., Alexander, R. D., et al. 2011, ApJ, 736, 13
- Pepliński et al. (2008) Pepliński, A., Artymowicz, P., & Mellema, G. 2008, MNRAS, 387, 1063
- Pierens et al. (2012) Pierens, A., Baruteau, C., & Hersant, F. 2012, MNRAS, 427, 1562
- Plavchan & Bilinski (2013) Plavchan, P., & Bilinski, C. 2013, ApJ, 769, 86
- Pringle (1981) Pringle, J. E. 1981, ARA&A, 19, 137
- Raymond & Cossou (2014) Raymond, S. N., & Cossou, C. 2014, MNRAS, 440, L11
- Regály et al. (2013) Regály, Z., Sándor, Z., Csomós, P., & Ataiee, S. 2013, MNRAS, 433, 2626
- Robrade & Schmitt (2006) Robrade, J., & Schmitt, J. H. M. M. 2006, A&A, 449, 737
- Rosotti et al. (2015) Rosotti, G. P., Ercolano, B., & Owen, J. E. 2015, MNRAS, 454, 2173
- Rosotti et al. (2013) Rosotti, G. P., Ercolano, B., Owen, J. E., & Armitage, P. J. 2013, MNRAS, 430, 1392
- Ruden (2004) Ruden, S. P. 2004, ApJ, 605, 880
- Sándor et al. (2011) Sándor, Z., Lyra, W., & Dullemond, C. P. 2011, ApJ, 728, L9
- Scargle et al. (2013) Scargle, J. D., Norris, J. P., Jackson, B., & Chiang, J. 2013, ApJ, 764, 167
- Schlichting (2014) Schlichting, H. E. 2014, ApJ, 795, L15
- Schneider et al. (2011) Schneider, J., Dedieu, C., Le Sidaner, P., Savalle, R., & Zolotukhin, I. 2011, A&A, 532, A79
- Shakura & Sunyaev (1973) Shakura, N. I., & Sunyaev, R. A. 1973, A&A, 24, 337
- Thommes et al. (2007) Thommes, E. W., Nilsson, L., & Murray, N. 2007, ApJ, 656, L25
- Tsiganis et al. (2005) Tsiganis, K., Gomes, R., Morbidelli, A., & Levison, H. F. 2005, Nature, 435, 459
- Udry & Santos (2007) Udry, S., & Santos, N. C. 2007, ARA&A, 45, 397
- Vacca & Sandell (2011) Vacca, W. D., & Sandell, G. 2011, ApJ, 732, 8
- Veras & Armitage (2004) Veras, D., & Armitage, P. J. 2004, MNRAS, 347, 613
- Ward (1997) Ward, W. R. 1997, Icarus, 126, 261
- Ward & Canup (2010) Ward, W. R., & Canup, R. M. 2010, AJ, 140, 1168
- Wright et al. (2009) Wright, J. T., Upadhyay, S., Marcy, G. W., et al. 2009, ApJ, 693, 1084
Appendix A Modifications to FARGO
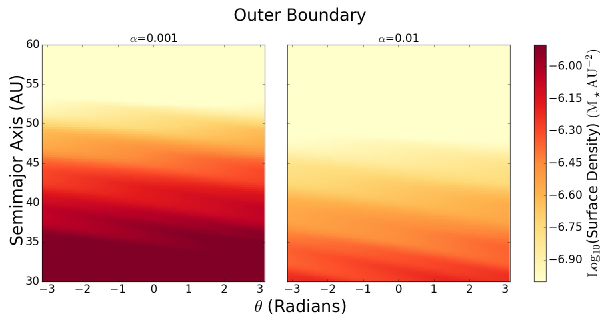
FARGO 2-D is a polar mesh hydro code that uses finite differencing to solve the Navier-Stokes equations for a Keplerian disk using a full viscous stress tensor. It considers the gravity of the central object as well as any number of planets, but no self-gravity of the disk. An isothermal equation of state is used with an arbitrary radial temperature profile. Advection is accomplished using the van Leer upwinding technique on a staggered mesh along with the FARGO (Fast Advection in Rotating Gaseous Objects) algorithm. We added “zero-torque” boundary conditions (Alexander et al., 2006b) to the inner and outer disk boundaries by setting the inner and outer zone surface densities to . To prevent negative densities from arising, we set the radial velocity to 0 for any empty zone at the disk boundary. We increase the von Neumann-Richtmyer viscosity constant, the number of zones over which shocks are spread, to 3.41 instead of the FARGO default of 1.41 in order to avoid crashes caused by discontinuities at the boundaries. Figure 11 shows how density waves produced by the planet interact with the inner (top) and outer (bottom) boundaries. If density waves were reflecting off the boundaries, we would expect to see a cross-hatching pattern in Figure 11 similar to Figure 19 in de Val-Borro et al. (2006). Instead, our zero-density boundary conditions swallow up potential density waves, allowing them to flow out of the disk, but preventing reflected waves from re-entering the disk as there is no material in the boundary zones to act as a wave source. As we do not find reflected wave patterns traveling back toward the planet’s orbit (e.g. as in de Val-Borro et al., 2006), we do not need to impose active wave-damping at the boundaries.
Previous studies combining photoevaporation with 2-D FARGO simulations (Moeckel & Armitage, 2012; Rosotti et al., 2013, 2015) use an ‘open’ boundary condition on the inner disk boundary where the disk surface density is set to its initial value. This open boundary condition limits viscous draining onto the star since the ring of zones just outside the boundary ring can lose material, but the boundary ring keeps being reset to the initial density value, resulting in a density gradient at the boundary that prevents accretion onto the star after 0.2 Myr or so. This difference in viscous disk draining makes it difficult to directly compare their disks’ dispersal with ours in detail, since our disks are still accreting onto the central star (in addition to being photoevaporated) even at very low disk masses.
Published prescriptions for photoevaporation are described in § 2. To implement them, we use an azimuthally symmetric array of values computed from each one of the published profiles. For each FARGO time step , the surface density subtracted from each zone is . To prevent negative density values and other numerical instabilities, we skip the density subtraction that represents photoevaporation in any zone where it would remove more than 10% of the surface density. In practice this condition is rarely met, as the disk surface density in a given zone must be extremely low for the density subtraction to be skipped. By the time our simulations reach such low densities, the photoevaporating radiation would be passing through an optically thin disk, rendering the published expressions for invalid.
Appendix B Simulation Parameters Tables
Disk Model PE Model [] [] [] Alpha [] [] H / draaEffective resolution: Disk scale height (H) divided by radial zone width (dr), evaluated at t=0 planet orbital radius. Planet Forming Disk EUV 0.07209 0.05bbNeptune-mass planets were simulated in disks with an aspect ratio of 0.0386 instead of 0.0546, an inner boundary of 0.3405 AU, and 400 radial grid zones., 1.0 1.049 0.01 0.3405 204.3 3.8 Planet Forming Disk EUV 0.07209 0.05bbNeptune-mass planets were simulated in disks with an aspect ratio of 0.0386 instead of 0.0546, an inner boundary of 0.3405 AU, and 400 radial grid zones., 1.0 1.573 0.01 0.3405 204.3 4.2 Planet Forming Disk EUV 0.07209 0.05bbNeptune-mass planets were simulated in disks with an aspect ratio of 0.0386 instead of 0.0546, an inner boundary of 0.3405 AU, and 400 radial grid zones., 1.0 2.132 0.01 0.3405 204.3 4.6 Planet Forming Disk X-ray 0.07161 1.0 6.640 0.001 1.703 204.3 8.1 Planet Forming Disk X-ray 0.07161 1.0 9.943 0.001 1.703 204.3 8.9 Planet Forming Disk X-ray 0.07161 1.0 13.28 0.001 1.703 204.3 9.6 Planet Forming Disk X-ray 0.07161 0.05bbNeptune-mass planets were simulated in disks with an aspect ratio of 0.0386 instead of 0.0546, an inner boundary of 0.3405 AU, and 400 radial grid zones., 1.0 6.640 0.01 1.703 204.3 8.1 Planet Forming Disk X-ray 0.07161 0.05bbNeptune-mass planets were simulated in disks with an aspect ratio of 0.0386 instead of 0.0546, an inner boundary of 0.3405 AU, and 400 radial grid zones., 1.0 9.943 0.01 1.703 204.3 8.9 Planet Forming Disk X-ray 0.07161 0.05bbNeptune-mass planets were simulated in disks with an aspect ratio of 0.0386 instead of 0.0546, an inner boundary of 0.3405 AU, and 400 radial grid zones., 1.0 13.28 0.01 1.703 204.3 9.6 Planet Forming Disk FUV 0.07161 0.05bbNeptune-mass planets were simulated in disks with an aspect ratio of 0.0386 instead of 0.0546, an inner boundary of 0.3405 AU, and 400 radial grid zones., 1.0 7.900 0.01 1.703 204.3 8.4 Planet Forming Disk FUV 0.07161 0.05bbNeptune-mass planets were simulated in disks with an aspect ratio of 0.0386 instead of 0.0546, an inner boundary of 0.3405 AU, and 400 radial grid zones., 1.0 11.85 0.01 1.703 204.3 9.3 Planet Forming Disk FUV 0.07161 0.05bbNeptune-mass planets were simulated in disks with an aspect ratio of 0.0386 instead of 0.0546, an inner boundary of 0.3405 AU, and 400 radial grid zones., 1.0 15.80 0.01 1.703 204.3 10.0 Fixed Orbit EUV 0.003490 1.0 1.049 0.001, 0.01 0.3405 10.22 7.2 Fixed Orbit EUV 0.003490 1.0 1.573 0.001, 0.01 0.3405 10.22 7.9 Fixed Orbit EUV 0.003490 1.0 2.097 0.001, 0.01 0.3405 10.22 8.5 Fixed Orbit X-ray 0.02347 1.0 6.640 0.001, 0.01 1.703 68.10 10.5 Fixed Orbit X-ray 0.02347 1.0 9.943 0.001, 0.01 1.703 68.10 11.6 Fixed Orbit X-ray 0.02347 1.0 13.28 0.001, 0.01 1.703 68.10 12.5 Fixed Orbit FUV 0.02347 1.0 7.900 0.001, 0.01 1.703 68.10 11.0 Fixed Orbit FUV 0.02347 1.0 11.85 0.001, 0.01 1.703 68.10 12.1 Fixed Orbit FUV 0.02347 1.0 15.80 0.001, 0.01 1.703 68.10 13.0 ER15 Comparison X-ray 0.007 0.5 5.0 0.0009545 1.022 68.10 8.6 ER15 Comparison X-ray 0.007 1.0 5.0 0.0009545 1.022 68.10 8.6 ER15 Comparison X-ray 0.007 2.0 5.0 0.0009545 1.022 68.10 8.6 ER15 Extension X-ray 0.007 0.5 5.0 0.009545 1.022 68.10 8.6 ER15 Extension X-ray 0.007 1.0 5.0 0.009545 1.022 68.10 8.6 ER15 Extension X-ray 0.007 2.0 5.0 0.009545 1.022 68.10 8.6 ER15 Extension X-ray 0.0007 0.5 5.0 0.0009545 1.022 68.10 8.6 ER15 Extension X-ray 0.0007 1.0 5.0 0.0009545 1.022 68.10 8.6 ER15 Extension X-ray 0.0007 2.0 5.0 0.0009545 1.022 68.10 8.6 ER15 Extension X-ray 0.0007 0.5 5.0 0.009545 1.022 68.10 8.6 ER15 Extension X-ray 0.0007 1.0 5.0 0.009545 1.022 68.10 8.6 ER15 Extension X-ray 0.0007 2.0 5.0 0.009545 1.022 68.10 8.6 Crida & Morbidelli Extension None 0.02371 1.0 5.0 0.005 1.022 68.10 8.6 Crida & Morbidelli Extension None 0.02371 1.0 5.0 0.01 1.022 68.10 8.6 Crida & Morbidelli Extension None 0.02371 1.0 5.0 0.02 1.022 68.10 8.6 Crida & Morbidelli Extension None 0.02371 1.0 5.0 0.05 1.022 68.10 8.6 Crida & Morbidelli Extension None 0.02371 1.0 10.0 0.005 1.022 68.10 10.2 Crida & Morbidelli Extension None 0.02371 1.0 10.0 0.01 1.022 68.10 10.2 Crida & Morbidelli Extension None 0.02371 1.0 10.0 0.02 1.022 68.10 10.2 Crida & Morbidelli Extension None 0.02371 1.0 10.0 0.05 1.022 68.10 10.2
| FARGO Parameter | Value |
|---|---|
| AspectRatio | 0.05455610099 |
| Sigma0 | 1.91549508e-4 |
| AlphaViscosity | 0.01 |
| SigmaSlope | 1.0 |
| FlaringIndex | 0.25 |
| ThicknessSmoothing | 0.6 |
| InnerBoundary | CustomaaSee Appendix A for the boundary conditions we implemented |
| OuterSourceMass | CustomaaSee Appendix A for the boundary conditions we implemented |
| Frame | Fixed |
| Nrad | 600 |
| Nsec | 200 |
| Rmin | 0.5bbNote the conversion between FARGO units and AU is |
| Rmax | 60.0bbNote the conversion between FARGO units and AU is |
| RadialSpacing | Logarithmic |
Appendix C Additional Migration Tracks