Present Address: ]Comprehensive Nuclear-Test-Ban Treaty Organization (CTBTO), Vienna, Austria Present Address: ]Department of Physics, United States Naval Academy, Annapolis, MD 21402, USA Present Address: ]Università degli Studi di Milano and INFN, Via Celoria 16, I-20133 Milano, Italy Present Address: ]GSI, Planckstraße 1, D-64291, Darmstadt, Germany Present Address: ]Department of Physics and Astronomy, University of North Carolina at Chapel Hill, Chapel Hill, NC 27559-3255, USA and TUNL, Duke University, Durham, NC, 27708-0308, USA
Understanding the Low-Energy Enhancement of the -ray Strength Function of 56Fe.
Abstract
A model-independent technique was used to determine the -ray Strength Function (SF) of 56Fe down to -ray energies less than 1 MeV for the first time with GRETINA using the reaction at 16 MeV. No difference was observed in the energy dependence of the SF built on and final states, supporting the Brink hypothesis. In addition, angular distribution and polarization measurements were performed. The angular distributions are consistent with dipole radiation. The polarization results show a small bias towards magnetic character in the region of the enhancement.
I Introduction
The -ray Strength Function (SF) describes the statistical -ray decay properties of nucleonic systems at high excitation energy and level density Bartholomew et al. (1973), and provides insight into the average reduced -ray transition probability for a given transition energy () and multipolarity. The SF is dominated by the giant electric dipole resonance (GEDR) Harakeh and van der Woude (2001), a collective motion of neutrons against protons, at energies above the neutron threshold. The low-energy tail of the GEDR often exhibits other structural features which shed light on the underlying excitations modes of the nucleus e.g. the pygmy Bracco et al. (2015); Savran et al. (2013), scissors Schiller et al. (2006), or spin-flip Heyde et al. (2010) resonances.
Statistical properties, such as the SF and Nuclear Level Density (NLD), are instrumental in describing photo-nuclear processes and neutron capture reaction rates Goriely (1998) as they are critical input parameters to the Hauser-Feshbach model for capture cross section calculations Hauser and Feshbach (1952). The SF strongly affects capture cross sections and has the potential for far reaching impact on nucleosynthesis processes Arnould and Goriely (2003); Arnould et al. (2007), nuclear waste transmutation Colonna et al. (2010), and nuclear fuel cycles Rep (2006). For instance, it has been shown that the presence of a Pygmy resonance Goriely (1998) or an enhanced low-energy -ray decay probability Larsen and Goriely (2010) can lead to order of magnitude deviations on the capture cross sections for nuclei that undergo the rapid neutron-capture process Burbidge et al. (1957). The SF and NLD have been shown to reliably reproduce results from directly measured Laplace et al. (2016); Kheswa et al. (2017) and Larsen et al. (2016) cross sections. Direct measurements are limited to reasonably long-lived targets and hence statistical properties will play an increasingly important role in determining many astrophysically relevant cross sections. Experimental efforts already focus on new techniques, utilizing beta decay Spyrou et al. (2014); Liddick et al. (2016) and surrogate reactions Kozub et al. (2012), with the goal to obtain cross sections for nuclei far from stability.
A low-energy enhancement ( MeV) in the SF of 56Fe was discovered in 2004 Voinov et al. (2004). This feature has been confirmed in a number of other light- and medium-mass nuclei, from 44Sc Larsen et al. (2007) to Cd isotopes Larsen et al. (2013a) using the Oslo method Guttormsen et al. (1987, 1996). Recently, the enhancement has also been reported in the heavier rare-earth Simon et al. (2016) and lanthanide regions Kheswa et al. (2015). Furthermore, the existence of the enhancement was independently confirmed using the Ratio Method in 95Mo Wiedeking et al. (2012), and these observations have spurred intense theoretical investigations. Shell-model calculations in the A90 region have suggested the enhancement to be due to a large strength for low-energy -rays which is caused by orbital angular momentum recoupling of high-j orbits Schwengner et al. (2013). Calculations in 56Fe Brown and Larsen (2014) and in 44Sc Sieja (2017) have further revealed that transitions, responsible for the enhancement, originate from 0 states. However, other theoretical approaches propose an strength to be responsible for the enhancement Litvinova and Belov (2013).
Despite its broad impact, very little is known about the excitation mode responsible for the emergence of the low-energy enhancement. While recent measurements have demonstrated that the enhancement is dominated by dipole radiation Larsen et al. (2013b, 2017); Simon et al. (2016), its electric or magnetic character remains an open question. A study on the total conversion coefficient of the -ray continuum in 163,163Yb formed in the 150Nd(20Ne, ) reaction indicated considerable contributions from radiation near keV. In addition, studies of capture reactions in 59Co Voinov et al. (2010) and 144Nd Voinov and Grimes (2015) have infered an nature. A direct measurement of the polariation is the crucial missing piece of information which would constrain models and provide for a full understanding of the low-energy enhancement. In this article, we report the first polarization measurement of photons originating from the low-energy enhancement in the SF.
II Experimental Method
The experiment was performed at the ATLAS facility at Argonne National Laboratory where a 16 MeV proton beam impinged upon a 1 mg/cm2 99.7 isotopically-enriched 56Fe target with an intensity of 0.50 pnA. The target was surrounded by GRETINA Paschalis et al. (2013) (Gamma-Ray Energy Tracking In-beam Nuclear Array), and the Washington University Phoswich Wall Sarantites et al. (2015). Eight GRETINA modules were positioned at a nominal distance of 18 cm around the target with one at 59∘, three at 90∘, and two at 121∘ and 147∘. The singles photopeak efficiency at 1.33 MeV was . The hardware event trigger required that a Phoswich Wall element fired in coincidence with GRETINA within a 500 ns gate. A narrow coincidence gate of 10 ns was applied in the offline analysis.
The Phoswich Wall consists of four 64-fold-pixelated photomultiplier tubes with 2.2 mm thick CsI(Tl) and 12 m thick fast-plastic scintillation detectors, having a total of 256 elements. To protect the detectors from the unreacted beam, their range of laboratory angles was chosen to be 32∘ , and the scintillators were covered with 100 m thick Sn absorbers. The latter were supported by masks that slightly reduced the area of each pixel. The combined energy (CsI(Tl)) and energy loss (fast-plastic) information was used for particle identification, and the detector geometry allowed the excitation energy of the recoiling 56Fe nuclei to be deduced from the kinematics of the scattered protons.
The experiment was designed to measure statistical feeding from the quasicontinuum in 56Fe to specific low-lying states. This was achieved with particle-- triple coincidence events. Excited states in the quasicontinuum were populated by the () reaction, and -rays originating from the quasicontinuum were identified by gating on the entrance excitation energy and on specific low-lying discrete transitions.
Any photon in coincidence with a proton and a discrete transition satisfying the energy difference , where is the energy of the low-lying state and the resolution in , has an unambiguous origin and destination. Thus the intensity of single-step feeding to individual levels can be extracted on an event-by-event basis.
The SF was extracted via the Ratio Method Wiedeking et al. (2012), briefly summarized here. The SF can be written as Bartholomew et al. (1973):
where is the average radiative width, the level density, and and the energy and multipolarity of the first -ray emitted in the de-excitation of 56Fe. Assuming dipole radiation dominates, the intensity of -rays populating a specific low-lying state can be expressed in terms of the SF:
where the term denotes the cross section for populating a specific level in the reaction.
Let and denote two primary -rays feeding separate states of the same spin-parity. For a given excitation energy, the ratio of feeding from states in the quasicontinuum to a pair of low-lying states is proportional to the ratio of the strength function evaluated at and :
By forming the ratio for discrete states of the same spin-parity, the dependence on the density of states in addition to other experimental systematic errors are removed, and the shape of the SF can be deduced.
III Analysis and Discussion
The data were sorted on a calorimeter condition requiring that the total energy measured in GRETINA was equal to the measured excitation energy of 56Fe. A total of 6 states had sufficient statistics to obtain ratios: four 2+ states (847, 2658, 2959, 3369 keV) and two states (2085, 3123 keV). These levels and their branching ratios have been identified in previous experiments Junde et al. (2011).
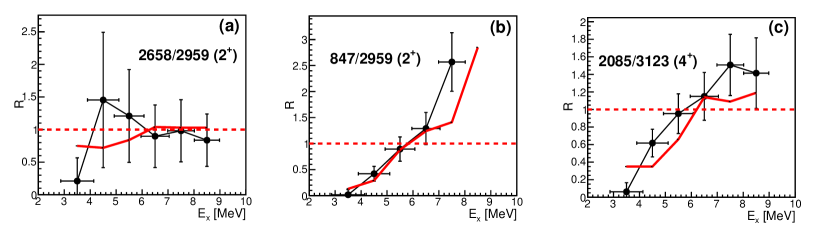
Three of the seven ratios are shown in Figure 1 for two pairs of states (Fig. 1 (a,b)) and the single pair of states (Fig. 1(c)). The uncertainty in the ratios is a combination of statistics and the error propagated from the resolution of the Phoswich Wall. The red curve represents the theoretical ratios obtained from a polynomial fit of the strength functions reported in previous measurements Voinov et al. (2004); Larsen et al. (2013b), and corresponds to the red curve in Figure 2. Good agreement with the Oslo method is observed Guttormsen et al. (1996, 1987); Larsen et al. (2013b).
For a given excitation energy, the energy difference between the pair of discrete states is equal to the distance between the two points on whose ratio is being measured. When the pair of discrete states is sufficiently close such that the strength function does not change quickly over their energy difference, it is expected that for all . This is what is observed in Figure 1 (a) where the two states are separated by only 300 keV. The ratio is consistent with unity for MeV. However, for the lowest point at MeV, it dips suddenly. This implies that the strength function is increasing rapidly between keV and keV, which is consistent with a large low-energy enhancement. Figures 1 (b,c), show a general trend of at low , and hence low , that monotonically increases past . This is indicative of a local minimum in the strength function.
The ratios can be translated to individual points on the strength function , however the normalization between excitation energy bins is unconstrained. For the purpose of comparison to previous data, the normalizations are minimized to a polynomial fit of the Oslo measurements Voinov et al. (2004); Larsen et al. (2013b) between 1.5 and 4.5 MeV, shown in Figure 2. The low-energy enhancement is evident and appears to continue to increase below 1 MeV.
In addition to the states, a pair of states had sufficient statistics to form ratios. They are given the same normalization for comparison, shown in Figure 2. The strength function obtained from final states agrees with that obtained from final states, which is consistent with the Brink hypothesis.
III.1 Angular Distributions and Polarization
Moving beyond the shape of the SF, the tracking capabilities of GRETINA allow one to obtain angular distribution and polarization information on the -rays in the region of the low-energy enhancement. The angular distributions are given by the intensity as a function of the lab angle, Mateosian and Sunyar (1974):
where are the Legendre polynomials of degree . The normalized angular-distribution coefficients are given by , where is the geometric attenuation of GRETINA, the coefficients for maximum alignment, and the attenuation due to partial alignment.
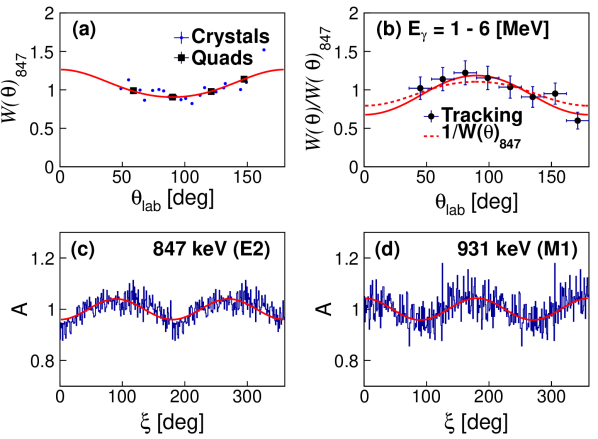
The angular distributions for the quasicontinuum can be found in Figure 3(b), where a cut is made between MeV. In order to remove systematics resulting from the triple-coincidence gate, the angular distributions are taken relative to the first-excited state in 56Fe (847 keV) with the same gating conditions. In order to extract the and coefficients, the ratio must be fit.
Using the measured values for the first-excited state of 56Fe (Fig. 3(a)), of and , the extracted and coefficients for this region of the quasicontinuum are , and , where the systematic uncertainties of the quasicontinuum are estimated from the uncertainty in the normalization.
The uncertainty is large, partly due to the fact that the distribution is a ratio, however the observed value for is consistent with a previous measurement at similar energies Larsen et al. (2013b). The absence of shows that the data are consistent with pure dipole transitions. It should be noted that in that work, the contributions from stretched quadrupole transitions were estimated to be around 10 Larsen et al. (2013b).
Polarization information can be obtained by measuring the angle between the reaction plane, defined by the direction of the photon and the beam-direction, and the Compton scattering plane, defined by the first two Compton scattering interactions in GRETINA. Electric polarization can be discerned from magnetic by constructing an asymmetry parameter defined as:
where and are the intensities as a function of the angle for the polarized -rays of interest and a source measurement. This technique is described in detail by Alikhani et al. Alikhani et al. (2012) and Ref. Wiens (2014). The effectiveness of GRETINA as a compton polarimeter is demonstrated with two photopeaks in 56Fe and 55Fe in Figure 3(c) and (d). The asymmetry can be expressed in terms of the analyzing power and the degree of linear polarization Alikhani et al. (2012):
where the is the analyzing power. The asymmetry is maximum when is maximum which occurs at and can be expressed in terms of the angular distribution – for an E2 transition Fagg and Hanna (1959):
Using the and values for the first-excited state of 56Fe, the maximum linear polarization is , giving an expected asymmetry of which agrees well with the observed value of , shown in the top two panels of Figure 3. In addition to being consistent with the observed angular distributions, magnetic polarization (931 keV, 55Fe) is clearly distinguished from electric (847 keV, 56Fe).
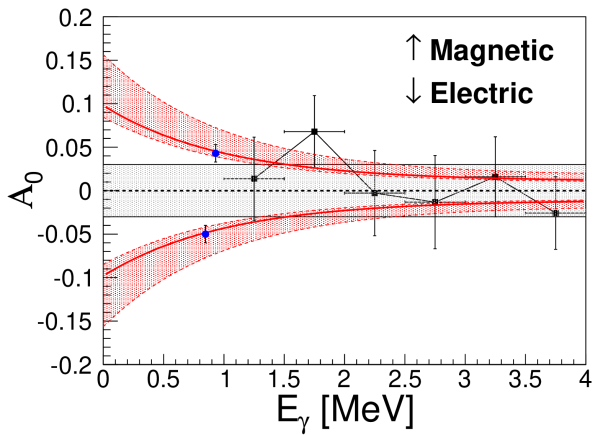
The polarization asymmetry as a function of primary -ray energy is shown in Figure 4, where a negative value indicates electric, and positive magnetic character. The observed asymmetry for the aforementioned and transitions are shown in blue with their respective uncertainties for comparison. The red curves show the maximum asymmetry given a linear polarization of , and the red band (dashed) shows the envelope for the maximum asymmetry given the uncertainty in . The polarization asymmetry for the statistical feeding is shown by the black points, where bin widths of 500 keV are taken. The error bars represent the statistical limits determined by a analysis, and the grey band shows the uncertainty in obtained by fitting poisson fluctions of a uniform distribution with identical statistics as the measurement.
At present, the uncertainties are too large to draw a firm conclusion about a pure electric or magnetic nature of the low-energy enhancement, however the data suggest a mixture, with a small magnetic bias at an observed asymetry of in the 1.5 - 2.0 MeV bin. The data are consistent with a uniform distribution within . A hypothesis test shows that this bin is inconsistent with the expected E1 amplitude ( = -0.03), within confidence, and that is not the opposite sign with confidence ( = -0.06).
Given the observed alignment of the reaction, the expected asymmetry at MeV is , which is too small to extract with the present data. In order to enhance the asymmetry it is necessary to probe lower energies where the sensitivity is improved.
IV Conclusions
In summary, the SF of 56Fe was measured using a reaction at 16 MeV, and extracted with the model-independent ratio method. The existence of a low-energy enhancement is confirmed and appears to increase below 1 MeV. In addition, the SFs constructed with and final states have identical shapes, consistent with the Brink hypothesis. The angular distribution is consistent with dipole radiation with an of . In addition, the polarization asymmetry suggests a mixture of electric and magnetic radiation with a small magnetic bias between 1.5 and 2.0 MeV, however the significance is weak. It will be critical for future experiments to extend polarization measurements to the lowest energies where the sensitivity is the greatest.
This material is based upon work supported by the U.S. Department of Energy, Office of Science, Office of Nuclear Physics under Contracts No. DE-AC02-05CH11231 (LBNL) , DESC0014442 (WU), DE-AC52-07NA27344 (LLNL), DENA0002905 (OU), and No. DE-AC02-06CH11357 (ANL) and the National Research Foundation of South Africa under Grants No. 92789 and 83867. This research used resources of ANL’s ATLAS facility, which is a DOE Office of Science User Facility. A.C.L. gratefully acknowledges funding from ERC-STG-2014 under Grant Agreement No 637686.
References
- Bartholomew et al. (1973) G. A. Bartholomew, E. D. Earle, A. J. Ferguson, J. W. Knowles, and M. A. Lone, in Adv. Nucl. Phys. 7, 229 (1973).
- Harakeh and van der Woude (2001) M. N. Harakeh and A. van der Woude, Oxford University Press, Oxford (2001).
- Bracco et al. (2015) A. Bracco, F. C. L. Crespi, and E. G. Lanza, The European Physical Journal A 51, 99 (2015).
- Savran et al. (2013) D. Savran, T. Aumann, and A. Zilges, Progress in Particle and Nuclear Physics 70, 210 (2013).
- Schiller et al. (2006) A. Schiller, A. Voinov, E. Algin, J. Becker, L. Bernstein, P. Garrett, M. Guttormsen, R. Nelson, J. Rekstad, and S. Siem, Physics Letters B 633, 225 (2006).
- Heyde et al. (2010) K. Heyde, P. von Neumann-Cosel, and A. Richter, Rev. Mod. Phys. 82, 2365 (2010).
- Goriely (1998) S. Goriely, Physics Letters B 436, 10 (1998).
- Hauser and Feshbach (1952) W. Hauser and H. Feshbach, Phys. Rev. 87, 366 (1952).
- Arnould and Goriely (2003) M. Arnould and S. Goriely, Physics Reports 384, 1 (2003).
- Arnould et al. (2007) M. Arnould, S. Goriely, and K. Takahashi, Physics Reports 450, 97 (2007).
- Colonna et al. (2010) N. Colonna, F. Belloni, E. Berthoumieux, M. Calviani, C. Domingo-Pardo, C. Guerrero, D. Karadimos, C. Lederer, C. Massimi, C. Paradela, R. Plag, J. Praena, and R. Sarmento, Energy Environ. Sci. 3, 1910 (2010).
- Rep (2006) Report of the Nuclear Physics and Related Computational Science R&D for Advanced Fuel Cycles Workshop, DOE Offices of Nuclear Physics and Advanced Scientific Computing Research. (August 2006).
- Larsen and Goriely (2010) A. C. Larsen and S. Goriely, Phys. Rev. C 82, 014318 (2010).
- Burbidge et al. (1957) E. M. Burbidge, G. R. Burbidge, W. A. Fowler, and F. Hoyle, Rev. Mod. Phys. 29, 547 (1957).
- Laplace et al. (2016) T. A. Laplace, F. Zeiser, M. Guttormsen, A. C. Larsen, D. L. Bleuel, L. A. Bernstein, B. L. Goldblum, S. Siem, F. L. B. Garotte, J. A. Brown, L. C. Campo, T. K. Eriksen, F. Giacoppo, A. Görgen, K. Hadyńska-Klȩk, R. A. Henderson, M. Klintefjord, M. Lebois, T. Renstrøm, S. J. Rose, E. Sahin, T. G. Tornyi, G. M. Tveten, A. Voinov, M. Wiedeking, J. N. Wilson, and W. Younes, Phys. Rev. C 93, 014323 (2016).
- Kheswa et al. (2017) B. V. Kheswa, M. Wiedeking, J. A. Brown, A. C. Larsen, S. Goriely, M. Guttormsen, F. L. Bello Garrote, L. A. Bernstein, D. L. Bleuel, T. K. Eriksen, F. Giacoppo, A. Görgen, B. L. Goldblum, T. W. Hagen, P. E. Koehler, M. Klintefjord, K. L. Malatji, J. E. Midtbø, H. T. Nyhus, P. Papka, T. Renstrøm, S. J. Rose, E. Sahin, S. Siem, and T. G. Tornyi, Phys. Rev. C 95, 045805 (2017).
- Larsen et al. (2016) A. C. Larsen, M. Guttormsen, R. Schwengner, D. L. Bleuel, S. Goriely, S. Harissopulos, F. L. Bello Garrote, Y. Byun, T. K. Eriksen, F. Giacoppo, A. Görgen, T. W. Hagen, M. Klintefjord, T. Renstrøm, S. J. Rose, E. Sahin, S. Siem, T. G. Tornyi, G. M. Tveten, A. V. Voinov, and M. Wiedeking, Phys. Rev. C 93, 045810 (2016).
- Spyrou et al. (2014) A. Spyrou, S. N. Liddick, A. C. Larsen, M. Guttormsen, K. Cooper, A. C. Dombos, D. J. Morrissey, F. Naqvi, G. Perdikakis, S. J. Quinn, T. Renstrøm, J. A. Rodriguez, A. Simon, C. S. Sumithrarachchi, and R. G. T. Zegers, Phys. Rev. Lett. 113, 232502 (2014).
- Liddick et al. (2016) S. N. Liddick, A. Spyrou, B. P. Crider, F. Naqvi, A. C. Larsen, M. Guttormsen, M. Mumpower, R. Surman, G. Perdikakis, D. L. Bleuel, A. Couture, L. Crespo Campo, A. C. Dombos, R. Lewis, S. Mosby, S. Nikas, C. J. Prokop, T. Renstrom, B. Rubio, S. Siem, and S. J. Quinn, Phys. Rev. Lett. 116, 242502 (2016).
- Kozub et al. (2012) R. L. Kozub, G. Arbanas, A. S. Adekola, D. W. Bardayan, J. C. Blackmon, K. Y. Chae, K. A. Chipps, J. A. Cizewski, L. Erikson, R. Hatarik, W. R. Hix, K. L. Jones, W. Krolas, J. F. Liang, Z. Ma, C. Matei, B. H. Moazen, C. D. Nesaraja, S. D. Pain, D. Shapira, J. F. Shriner, M. S. Smith, and T. P. Swan, Phys. Rev. Lett. 109, 172501 (2012).
- Voinov et al. (2004) A. Voinov, E. Algin, U. Agvaanluvsan, T. Belgya, R. Chankova, M. Guttormsen, G. E. Mitchell, J. Rekstad, A. Schiller, and S. Siem, Phys. Rev. Lett. 93, 142504 (2004).
- Larsen et al. (2007) A. C. Larsen, M. Guttormsen, R. Chankova, F. Ingebretsen, T. Lönnroth, S. Messelt, J. Rekstad, A. Schiller, S. Siem, N. U. H. Syed, and A. Voinov, Phys. Rev. C 76, 044303 (2007).
- Larsen et al. (2013a) A. C. Larsen, I. E. Ruud, A. Bürger, S. Goriely, M. Guttormsen, A. Görgen, T. W. Hagen, S. Harissopulos, H. T. Nyhus, T. Renstrøm, A. Schiller, S. Siem, G. M. Tveten, A. Voinov, and M. Wiedeking, Phys. Rev. C 87, 014319 (2013a).
- Guttormsen et al. (1987) M. Guttormsen, T. Ramsøy, and J. Rekstad, Nuclear Instruments and Methods in Physics Research Section A: Accelerators, Spectrometers, Detectors and Associated Equipment 255, 518 (1987).
- Guttormsen et al. (1996) M. Guttormsen, T. Tveter, L. Bergholt, F. Ingebretsen, and J. Rekstad, Nuclear Instruments and Methods in Physics Research Section A: Accelerators, Spectrometers, Detectors and Associated Equipment 374, 371 (1996).
- Simon et al. (2016) A. Simon, M. Guttormsen, A. C. Larsen, C. W. Beausang, P. Humby, J. T. Burke, R. J. Casperson, R. O. Hughes, T. J. Ross, J. M. Allmond, R. Chyzh, M. Dag, J. Koglin, E. McCleskey, M. McCleskey, S. Ota, and A. Saastamoinen, Phys. Rev. C 93, 034303 (2016).
- Kheswa et al. (2015) B. Kheswa, M. Wiedeking, F. Giacoppo, S. Goriely, M. Guttormsen, A. Larsen, F. B. Garrote, T. Eriksen, A. Görgen, T. Hagen, P. Koehler, M. Klintefjord, H. Nyhus, P. Papka, T. Renstrøm, S. Rose, E. Sahin, S. Siem, and T. Tornyi, Physics Letters B 744, 268 (2015).
- Wiedeking et al. (2012) M. Wiedeking, L. A. Bernstein, M. Krtička, D. L. Bleuel, J. M. Allmond, M. S. Basunia, J. T. Burke, P. Fallon, R. B. Firestone, B. L. Goldblum, R. Hatarik, P. T. Lake, I.-Y. Lee, S. R. Lesher, S. Paschalis, M. Petri, L. Phair, and N. D. Scielzo, Phys. Rev. Lett. 108, 162503 (2012).
- Schwengner et al. (2013) R. Schwengner, S. Frauendorf, and A. C. Larsen, Phys. Rev. Lett. 111, 232504 (2013).
- Brown and Larsen (2014) B. A. Brown and A. C. Larsen, Phys. Rev. Lett. 113, 252502 (2014).
- Sieja (2017) K. Sieja, Phys. Rev. Lett. 119, 052502 (2017).
- Litvinova and Belov (2013) E. Litvinova and N. Belov, Phys. Rev. C 88, 031302 (2013).
- Larsen et al. (2013b) A. C. Larsen, N. Blasi, A. Bracco, F. Camera, T. K. Eriksen, A. Görgen, M. Guttormsen, T. W. Hagen, S. Leoni, B. Million, H. T. Nyhus, T. Renstrøm, S. J. Rose, I. E. Ruud, S. Siem, T. Tornyi, G. M. Tveten, A. V. Voinov, and M. Wiedeking, Phys. Rev. Lett. 111, 242504 (2013b).
- Larsen et al. (2017) A. C. Larsen, M. Guttormsen, N. Blasi, A. Bracco, F. Camera, L. C. Campo, T. K. Eriksen, A. Görgen, T. W. Hagen, V. W. Ingeberg, B. V. Kheswa, S. Leoni, J. E. Midtbø, B. Million, H. T. Nyhus, T. Renstrøm, S. J. Rose, I. E. Ruud, S. Siem, T. G. Tornyi, G. M. Tveten, A. V. Voinov, M. Wiedeking, and F. Zeiser, Journal of Physics G: Nuclear and Particle Physics 44, 064005 (2017).
- Voinov et al. (2010) A. Voinov, S. M. Grimes, C. R. Brune, M. Guttormsen, A. C. Larsen, T. N. Massey, A. Schiller, and S. Siem, Phys. Rev. C 81, 024319 (2010).
- Voinov and Grimes (2015) A. V. Voinov and S. M. Grimes, Phys. Rev. C 92, 064308 (2015).
- Paschalis et al. (2013) S. Paschalis et al., Nucl. Instrum. Methods Phys. Res., Sect. A 709, 44 (2013).
- Sarantites et al. (2015) D. Sarantites, W. Reviol, et al., Nucl. Instrum. Methods Phys. Res., Sect. A 790, 42 (2015).
- Junde et al. (2011) H. Junde, H. Su, and Y. Dong, Nuclear Data Sheets 112, 1513 (2011).
- Mateosian and Sunyar (1974) E. D. Mateosian and A. Sunyar, Atomic Data and Nuclear Data Tables 13, 391 (1974).
- Alikhani et al. (2012) B. Alikhani, A. Givechev, A. Heinz, P. John, J. Leske, M. Lettmann, O. Möller, N. Pietralla, and C. Röder, Nuclear Instruments and Methods in Physics Research Section A: Accelerators, Spectrometers, Detectors and Associated Equipment 675, 144 (2012).
- Wiens (2014) A. Wiens, 4th Joint Meeting of the APS Division of Nuclear Physics and Physical Society of Japan (2014).
- Fagg and Hanna (1959) L. W. Fagg and S. S. Hanna, Rev. Mod. Phys. 31, 711 (1959).