Nodal superconductivity coexists with low-moment static magnetism in single-crystalline tetragonal FeS: A muon spin relaxation and rotation study
Abstract
We report muon spin relaxation and rotation (SR) measurements on hydrothermally-grown single crystals of the tetragonal superconductor FeS, which help to clarify the controversial magnetic state and superconducting gap symmetry of this compound. SR time spectra were obtained from 280 K down to 0.025 K in zero field (ZF) and applied fields up to 20 mT. In ZF the observed loss of initial asymmetry (signal amplitude) and increase of depolarization rate below 10 K indicate the onset of static magnetism, which coexists with superconductivity below . Transverse-field SR yields a muon depolarization rate that clearly shows a linear dependence at low temperature, consistent with nodal superconductivity. The -wave model gives the best fit to the observed temperature and field dependencies. The normalized superfluid densities versus normalized temperature for different fields collapse onto the same curve, indicating the superconducting gap structure is independent of field. The in-plane penetration depth (0) = 198(3) nm.
I introduction
The discovery of superconducting La(O1-xFx)FeAs Kamihara et al. (2008) has triggered extensive studies on iron-based superconductors (IBS) Chen et al. (2014); Dai (2015). Most of the IBS share the same common structural motif of Fe-As layers, and the highest value is up to 56 K Ren et al. (2008); Wu et al. (2009). Density functional theory (DFT) calculations showed similarities of Fermi-surface structure between Fe-As based superconductors and iron chalcogenides (FeSe, FeS and FeTe) Subedi et al. (2008). Iron chalcogenides have the simplest crystal structure (iron chalcogenide layers) of IBS, and therefore have attracted great interest Mizuguchi and Takano (2010). FeSe, the most studied iron chalcogenide, shows superconductivity below 8 K Hsu et al. (2008), relatively lower than iron arsenide superconductors. However, the superconducting transition temperature increases drastically under pressure Medvedev et al. (2009), by carrier doping Miyata et al. (2015), or by growing single-layer FeSe on a SrTiO3 substrate Wang et al. (2012); Ge et al. (2015). Nematic order Fernandes et al. (2014) occurs in bulk FeSe below K McQueen et al. (2009), and antiferromagnetic (AFM) order is absent Baek et al. (2015); Böhmer et al. (2015). This makes FeSe a clean platform to study the nature of Fe-based superconductivity. However, its superconducting gap structure remains controversial Khasanov et al. (2008); Dong et al. (2009); Song et al. (2011).
Recently, superconducting tetragonal FeS ( K) was successfully synthesized by Lai et al. Lai et al. (2015) using a hydrothermal method. It has the same structure as FeSe, simply by replacing selenium with sulfur. Many studies have been made to understand the magnetic state and superconducting gap symmetry of FeS. Notably, two superconducting domes were observed under pressure Zhang et al. (2017), posing challenges to understanding its pairing mechanism. Muon spin relaxation/rotation (SR) Schenck (1985); Brewer (1994); Yaouanc and De Reotier (2011) experiments on polycrystalline tetragonal FeS Holenstein et al. (2016); Kirschner et al. (2016) indicated fully-gapped superconductivity, and found low-moment disordered magnetism below K Holenstein et al. (2016). However, a nodal superconducting gap was observed in single-crystalline FeS by low temperature specific heat and thermal conductivity measurements Xing et al. (2016); Ying et al. (2016). Yang et al. Yang et al. (2016a) calculated the electronic structure of FeS using DFT and reported that the gap function is nodal/nodeless on the hole/electron Fermi pockets. Soon after, angle-resolved photoemission spectroscopy (ARPES) studies Miao et al. (2017) observed two hole-like and two electron-like Fermi pockets around the Brillouin zone center and corner, respectively. The authors attribute the controversies over the superconducting gap structure to the absence of a hole-like band, which had been observed in other IBS. As for the magnetic properties, Man et al. Man et al. (2017) concluded that FeS is a tetragonal paramagnet from elastic neutron scattering and transport measurements. This is consistent with a prediction of dynamical mean-field theory Tresca et al. (2017), but it contradicts the previous SR results Holenstein et al. (2016).
To help resolve these controversies we have performed SR experiments on single crystals of tetragonal FeS. Our zero-field (ZF) and longitudinal-field (LF)-SR measurements, made with ensemble muon polarization (and applied field if present) parallel to the crystal c axis, revealed low-moment disordered static magnetism in the plane below K. Transverse field (TF)-SR measurements in the superconducting state yield an in-plane penetration depth nm, and reveal a linear temperature dependence as , characteristic of an order parameter with line nodes. The temperature dependencies of the penetration depth measured at various applied fields are best described by a -wave model. The normalized superfluid densities versus normalized temperature collapse onto a universal curve, indicating that the superconducting gap structure of FeS is field-independent.
II experiments and results
Single-crystalline tetragonal FeS was prepared by de-intercalation of potassium cations from KxFe2-yS2 (, ) single crystals by hydrothermal reaction Borg et al. (2016); Lin et al. (2016). Elemental analysis, X-ray diffraction (XRD), scanning electron microscopy image, magnetic susceptibility and in-plane resistivity measurements were carried out, with results that are consistent with previously reported work Zhang et al. (2017); Ying et al. (2016). Two batches of single crystals were prepared, denoted as Sample A and Sample B. SR experiments were performed on the M15 and M20 spectrometers at TRIUMF, Vancouver, Canada. ZF- and LF-SR measurements were carried out over the temperature range 25 mK–280 K for fields up to 20 mT. TF-SR measurements were performed from 6 K down to 25 mK at various fields.
II.1 ZF-SR
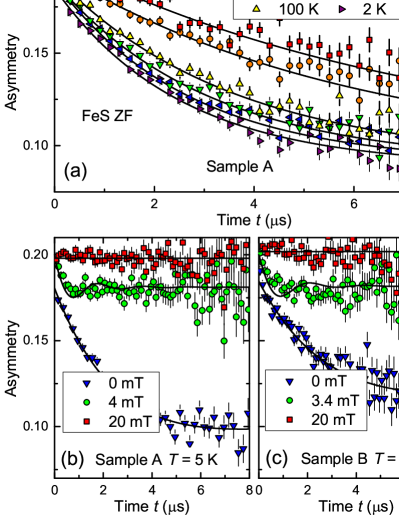
The evolution in time of the decay positron count asymmetry, which is proportional to the muon depolarization, is often called a SR spectrum. Representative ZF-SR spectra between 2 K and 280 K are presented in Fig. 1(a).
The muon depolarization is well described by a simple exponential decay function
| (1) |
at all temperatures. Here is the initial magnitude of the asymmetry signal and is the ZF muon depolarization rate. The constant fraction is the sum of two terms:
| (2) |
where is the fraction of muons that miss the sample and stop in the silver sample holder, and is the fraction of local-field component parallel to the initial muon spin. This local-field component causes no precession and hence no depolarization in the absence of dynamic spin relaxation. For randomly-oriented local fields , and for local fields perpendicular to the muon polarization .
In ZF these two contributions cannot be distinguished. In TF-SR, however, there is no analog to in Eq. (2). The observed values of and obtained from TF-SR data (Sec. II.2) are nearly the same, i.e., , consistent with internal fields at muon sites that are in the -plane. We note that the natural abundances and nuclear magnetic moments of both 57Fe and 33S are small Yaouanc and De Reotier (2011), and the Gaussian Kubo-Toyabe relaxation expected from their dipolar fields is negligible.
Simple exponential muon depolarization is usually caused either by motionally-narrowed dynamic relaxation, or a Lorentzian static field distribution Uemura et al. (1985); Yaouanc and De Reotier (2011). The muon depolarization for a randomly-oriented static local field distribution is described by a static Kubo-Toyabe (KT) function Kubo and Toyabe (1967); Hayano et al. (1979). An applied magnetic field mT, where MHz/T is the muon gyromagnetic ratio, “decouples” the local field Hayano et al. (1979); Uemura et al. (1985); Yaouanc and De Reotier (2011) (i.e., prevents muon precession). As shown in Figs. 1(b) and (c), at 5 K muon depolarization is completely suppressed in a field mT, indicating the local field is (quasi)static. The SR spectra for intermediate fields can be fitted by the LF KT function appropriate to a Lorentzian static field distribution Uemura et al. (1985) although, as noted above, the local fields are unlikely to be randomly oriented.
The temperature dependencies of and the sample initial asymmetry are given in Fig. 2 and its inset, respectively.
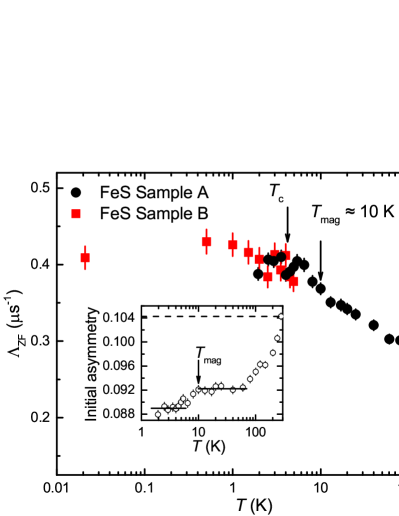
The decrease of initial asymmetry with decreasing temperature above 80 K is due to the onset of a strong local field in a fraction of the sample volume, so that muons in this volume are rapidly depolarized and do not contribute to the signal [See; e.g.; ]de1997muon. This “lost” volume fraction increases with decreasing temperature, to 12% at 80 K. Magnetic susceptibility and XRD measurements on our FeS single crystals show no signature of spurious impurity phases, indicating that their volume fraction is much less than 12%. A similar loss of initial asymmetry was observed in ZF-SR measurements on polycrystalline FeS samples Holenstein et al. (2016), where it was attributed to small grains of a ferromagnetic impurity phase. These produce stray fields that affect an increasing fraction of the sample with decreasing temperature. This observation in both single-crystal and polycrystal FeS samples suggests that a spurious ferromagnetic phase is a byproduct of hydrothermally grown FeS Holenstein et al. (2016); Kirschner et al. (2016).
The anomaly in (T) at 80 K (which was not reported in Ref. Holenstein et al. (2016)) is close to a structural transition temperature for FeSe McQueen et al. (2009), and is reminiscent of the possibility of nematic order Fernandes et al. (2014). However, neither a structural transition nor nematic order has been observed in FeS Man et al. (2017); Pachmayr et al. (2016). The lattice parameters of tetragonal FeS decrease with decreasing temperature above 100 K, and remain almost constant below 100 K with a change of less than 1% from the value at 300 K Pachmayr et al. (2016). Excluding these possibilities, the increase of (T) with decreasing temperature above 80 K is most probably due to increased local fields as discussed above. This in turn suggests a distribution of impurity-phase Curie temperatures .
Between 10 K and 80 K, the initial asymmetry is temperature independent. This is consistent with the anomaly in at 80 K, and suggests that 80 K is the minimum in the distribution of ; all impurity-phase grains are ferromagnetic below this temperature. The increase of with decreasing temperature below 80 K is then probably intrinsic to FeS and dynamic, due to slowing down of intrinsic magnetic moment fluctuations. Future LF-SR experiments will be necessary to determine separate static and dynamic contributions to in this temperature range.
From 10 K to the initial asymmetry decreases and increases further, indicating a second source of static magnetism with a distribution of ordering temperatures Dalmas de Réotier and Yaouanc (1997). The absence of oscillations in ZF-SR spectra [Fig. 1(a)] indicates that this static magnetism is disordered. The exponential form of the muon depolarization discussed in Sect. II.1 is expected in dilute spin glasses Uemura et al. (1985), where the required Lorentzian field distribution is a consequence of the spatial dependence of the dipolar local field, but a “Lorentzian” distribution can arise from aspects of the disorder other than dilution. Here the origin is probably low-moment short-range static magnetism Holenstein et al. (2016) with considerable inhomogeneity.
If we assume that the muon site in FeS is the same as calculated for isostructural FeSe Bendele et al. (2012), then s-1 corresponds to a Fe magnetic moment of the order of Holenstein et al. (2016). Such a small moment would be undetectable by neutron diffraction. It should be noted, however, that the calculated muon stopping site Bendele et al. (2012) possesses a high point symmetry, so that partial cancellation of local fields is possible if the short-range correlation is AFM. The above estimate does not take this into account, so that the actual Fe magnetic moment could be considerably higher.
Below saturates at , and the initial asymmetry is again constant. The fact that exponential relaxation characterizes 85% of the sample (Fig. 2 inset) shows that the low-moment static magnetism coexists with superconductivity without the competition observed in other IBS Drew et al. (2009); Bendele et al. (2010); Shermadini et al. (2011) where the volume fraction of magnetism is constant below .
II.2 TF-SR
In a type-II superconductor an applied magnetic field can induce a flux line lattice (FLL), in which the distribution of the field is determined by the magnetic penetration depth , the vortex core radius, and the structure of the FLL Brandt (1988). In a TF-SR setup, a field is applied perpendicular to the initial muon spin polarization. The distribution of precession frequencies in a FLL and resulting loss of ensemble muon spin polarization reflect the field inhomogeneity, and quantities such as can be extracted from the SR spectra Sonier et al. (2000); Yaouanc and De Reotier (2011).
For a perfect FLL the distribution of internal field is highly asymmetric, far from either a Gaussian or a Lorentzian field distribution. Weak random pinning slightly distorts the FLL so that the extrema of the field distribution fluctuate spatially; this often makes a Gaussian field distribution a good approximation Brandt (1988). The muon spin depolarization rate is related to the root-mean-square variation of the internal field in the FLL. In turn, is proportional to , which is often estimated from the relation
| (3) |
appropriate to an extreme type-II (London) superconductor with Ginzburg-Landau (GL) parameter Brandt (2003). Here = 2.06810-15 Wb is the magnetic flux quantum.
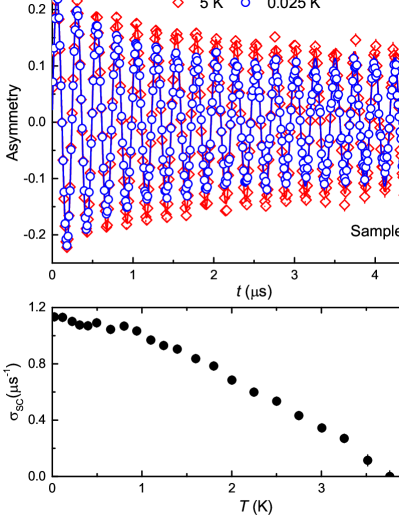
TF-SR data were taken after cooling from the normal state in constant field, since changing the field below produces spurious field inhomogeneity due to flux trapping. Figure 3(a) gives representative TF-SR spectra for FeS Sample B at H = 30 mT above and below .
These spectra are well described by the TF muon depolarization function
| (4) |
where is the depolarization rate due to static magnetism (in analogy to ), is the Gaussian depolarization rate due to the FLL, and and are the mean field and initial phase of the ensemble muon precession, respectively. The muon depolarization above is due only to static magnetism, and exhibits a simple exponential character (Fig. 1) similar to ZF data. Below is fixed to its value above (s-1 ), which is slightly larger than . This suggests that the applied field drives the in-plane local field slightly out of the plane.
Below a Gaussian muon depolarization is induced by the inhomogeneous field distribution due to the FLL. Fig. 3(b) shows the temperature dependence of the Gaussian depolarization rate .
The temperature dependence of , which is proportional to the superfluid density , is fitted by the relation Kim et al. (2002); Khasanov et al. (2007a, 2008):
| (5) |
where is the Fermi function. The gap symmetry enters this expression via the form of . For the -wave model , where the temperature dependence of the superconducting gap is estimated using Khasanov et al. (2007a, 2008)
| (6) |
For the -wave model, . In the recently-proposed orbital-selective state for iron selenides Nica et al. (2017), the intraband () and interband () nodal pairing terms add in quadrature. As a consequence, the quasiparticle excitation is fully gapped on the Fermi surface. A simplified model of the state gives Pang et al. (2016). Finally, for two weakly coupled superconducting bands (i.e., an band and a band), a linear combination of terms of the form of Eq. (5) can be applied Khasanov et al. (2007a); Kim et al. (2002):
| (7) |
Fits of -wave, -wave, -wave, and orbital-selective models to our data are shown in Fig. 4.
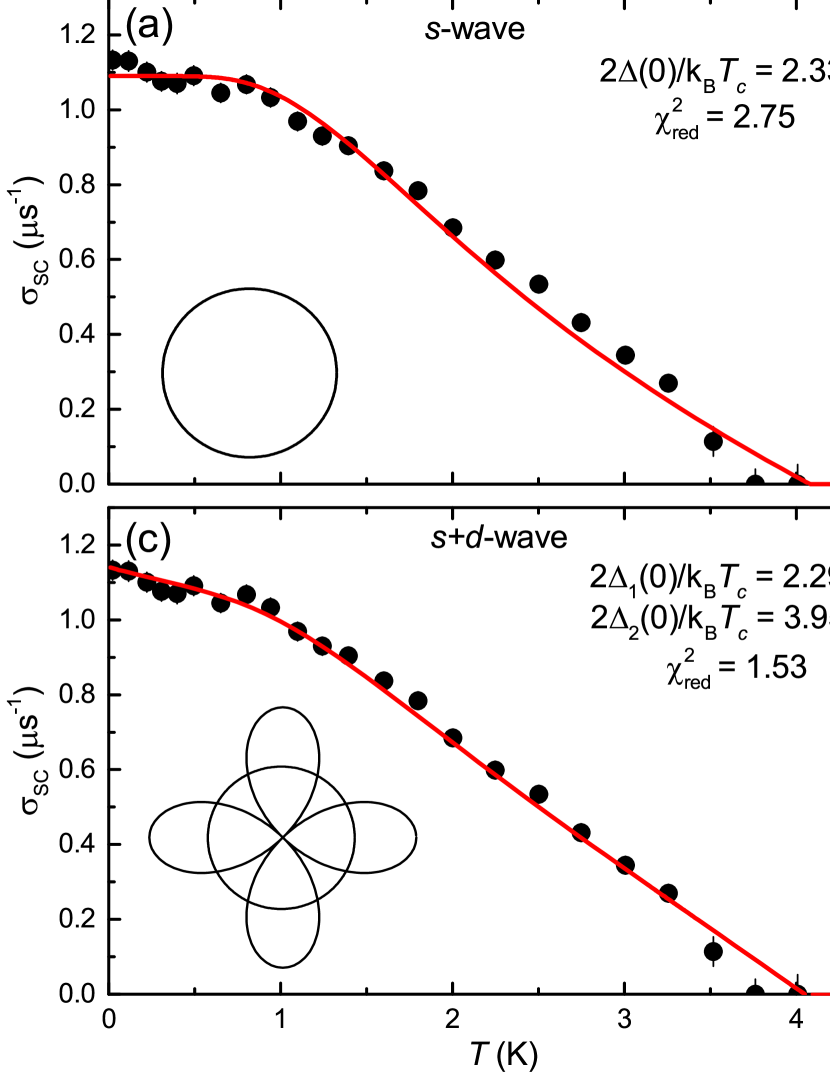
The angular dependencies of the gaps are shown schematically in the insets. We use the reduced chi-square of the fits to evaluate the goodness of fit Khasanov et al. (2008). It is obvious that the single -wave and -wave models do not describe the temperature dependence of accurately, and both -wave and models describe the data well. However, the -wave model gives a better description of the low-temperature data. Fit parameters and for these two models are shown in Table 1.
| Model | (mT) | (K) | (0) (meV) | (0) (meV) | 1- | ||||
|---|---|---|---|---|---|---|---|---|---|
| -wave | 7.5 | 4.21 | 0.48 | 0.50 | 2.64 | 0.71 | 0.50 | 3.91 | 1.05 |
| -wave | 30 | 4.05 | 0.4 | 0.43 | 2.29 | 0.69 | 0.57 | 3.95 | 1.53 |
| -wave | 75 | 3.62 | 0.37 | 0.47 | 2.37 | 0.64 | 0.53 | 4.10 | 1.95 |
| -state | 7.5 | 4.15 | 0.17 | 0.95 | 0.71 | 3.97 | 1.15 | ||
| -state | 30 | 4.05 | 0.16 | 0.92 | 0.64 | 3.67 | 1.54 | ||
| -state | 75 | 3.58 | 0.14 | 0.91 | 0.58 | 3.76 | 1.81 |
Thus our results suggest an -wave pairing state with multi-band and nodal superconductivity. Table 1 shows that the band and the band make comparable contributions to the superfluid density (), which is consistent with similar from fits by single -wave and -wave models [Figs. 4(a) and 4(b)]. Table 1 also shows that for one gap is less than BCS value of 3.54 and is larger for the other gap. This is consistent with the theoretical constraints Saito et al. (2013), and has been observed in many IBS as summarized by Adamski et al. Adamski et al. (2017).
For some high- cuprates such as La1.83Sr0.17CuO4, the ratio of superfluid densities from different bands is very sensitive to the external field Khasanov et al. (2007a). To investigate the field dependence of superconducting properties of tetragonal FeS, and also to give a better estimation of the absolute value of , we performed TF-SR measurements at a number of applied fields.
Figure 5 gives the temperature dependence of for H = 7.5 mT, 30 mT, and 75 mT.
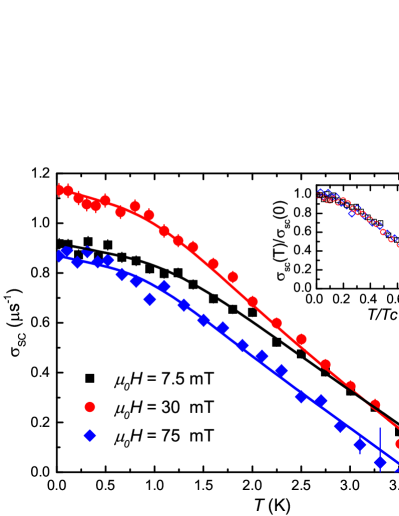
The theoretical curves are from the -wave model, with fitting parameters shown in Table 1 (the superconducting gaps and are free parameters in all fits). The ratio of -wave to -wave contribution is almost independent of field. Therefore the normalized superfluid densities versus normalized temperature collapse onto a universal curve, indicating that the superconducting gap structure is independent of field in FeS. The values of are close for different fields as shown in Table 1, indicating the self-consistency of the fit.
As shown in Fig. 5, has a maximum value at mT, consistent with the properties of the ideal GL vortex lattice Brandt (2003). From the value of at = 30 mT and Eq. (3), we estimate the in-plane penetration depth nm. However, this approximation is good only for large , and only for near the maximum of Brandt (2003). To obtain a better estimation we use the Abrikosov solution of the linearized GL theory Brandt (2003), which yields
| (8) |
here is the normalized field. The upper critical field for FeS is T for Ying et al. (2016); Lin et al. (2016). This gives a more accurate value nm, with a resulting .
III discussion
Previous SR experiments on polycrystalline FeS by Holenstein et al. Holenstein et al. (2016) revealed a low-moment magnetism below K, whereas no intrinsic static magnetism was observed by other SR experiments Kirschner et al. (2016) or by neutron scattering or transport experiments Man et al. (2017). Our ZF-SR experiments on single crystalline FeS confirm the onset of low-moment static magnetism in the plane below a lower K, which coexists with superconductivity below . The present results and those of Ref. Holenstein et al. (2016) for the temperature dependencies of and the initial asymmetry are more or less consistent, although Holenstein et al. do not report an anomaly at 80 K.
We note that the muon depolarization functions are different between our ZF-SR spectra and those of Ref. Holenstein et al. (2016): these authors report “root exponential” relaxation , whereas we observe simple exponential relaxation. The difference is consistent with our conclusion that the low-moment static magnetism is in the -plane as in FeSe Bendele et al. (2012), since then the local field would be more disordered in randomly-oriented polycrystalline samples. The root exponential function, which signals a broad distribution of exponential rates Johnston (2006) (i.e., even broader than a Lorentzian distribution), would then be a better description for ZF-SR spectra of polycrystalline FeS.
The ZF-SR study of polycrystalline FeS by Kirschner et al. Kirschner et al. (2016) used a sum of two simple exponential functions to describe the muon depolarization. The authors reported a slow relaxation in 85% volume fraction, attributed to intrinsic magnetic moments of the iron in FeS, and a fast relaxation with 15% volume fraction attributed to a magnetic impurity phase. The difference between this result and the root-exponential relaxation reported in Ref. Holenstein et al. (2016) may not be primarily in the data, but instead a consequence of the fact that a fit to data of a relaxation function that is a sum of exponentials often does not determine the coefficients in the sum (or the distribution function in an integral) well; the problem is ill-conditioned [See; e.g.; ]PTVF92. A two-exponential function is difficult to distinguish from a “stretched exponential” unless the two amplitudes are comparable and the rates are very different.
Our TF-SR measurements suggest the -wave superconducting pairing symmetry, demonstrating a nodal and multi-band superconductivity, which is different from the previous SR results Holenstein et al. (2016); Kirschner et al. (2016). A similar situation arose in early TF-SR penetration depth measurements on high- cuprates YBa2Cu3O7-δ (YBCO). Experiments on polycrystal materials as well as first available single crystals indicated an isotropic -wave order parameter Harshman et al. (1989); Pümpin et al. (1990). Nodal superconductivity was observed only after experiments on good single-crystalline YBCO showing a linear low temperature dependence of penetration depth Hardy et al. (1993). The origin of the controversy in this case was that the in-plane penetration depth was estimated by measuring of polycrystalline samples, assuming that the temperature dependence of penetration depth is isotropic along different crystal orientations Fesenko et al. (1991). However, experimental results showed that the temperature dependence of is significantly different from that of and in YBCO Khasanov et al. (2007b), i.e., the superconducting gap symmetry is different for different crystal orientations. The difference between SR results for the gap symmetry in FeS might have the same origin, and could be resolved by measuring in single crystals.
The fits of (T) suggest the presence of weakly-coupled -wave (nodeless) and -wave (nodal) bands, consistent with other results. ARPES measurements Miao et al. (2017) observed two hole-like and two electron-like Fermi pockets around the Brillouin zone center and corner, respectively, where the gap function is nodal/nodeless on the hole/electron Fermi pockets Yang et al. (2016a). Scanning tunneling microscopy (STM) experiments Yang et al. (2016b) showed a V-shaped spectrum, which is best described by both anisotropic -wave and s+-wave model. The weight factor and energy gaps of -wave model fit for the STM spectra are close to our fitting results. Nodal gap behavior is also inferred from low temperature heat capacity and thermal conductivity measurements Xing et al. (2016); Ying et al. (2016).
IV conclusions
In summary, we have studied the magnetic and superconducting properties of FeS single crystal samples by SR. Low-moment in-plane disordered static magnetism is found below K. A significant -linear dependence of the in-plane penetration depth is observed at low temperatures, indicating a nodal superconducting gap. The temperature dependencies of the superfluid density are best described by the multi-band and nodal superconductivity of the -wave model. The normalized temperature dependencies of normalized superfluid density collapse on a universal curve for different fields, suggesting that the superconducting gap structure is field independent. The absolute value of the in-plane penetration depth is estimated to be 198(4) nm.
Acknowledgements.
We are grateful to G. D. Morris, B. Hitti, and D. Arsenau of the TRIUMF CMMS for assistance during the experiments. This research is supported by the National Key Research and Development Program of China (Nos. 2017YFA0303104 and 2016YFA0300503), and the National Natural Science Foundation of China under grant nos. 11474060 and 11774061. Work at CSULA was funded by the U.S. NSF DMR/PREM-1523588. Research at CSU Fresno was supported by NSF DMR-1506677. Research at U. C. Riverside was supported by the UC Riverside Academic Senate.References
- Kamihara et al. (2008) Y. Kamihara, T. Watanabe, M. Hirano, and H. Hosono, J. Am. Chem. Soc. 130, 3296 (2008).
- Chen et al. (2014) X. Chen, P. Dai, D. Feng, T. Xiang, and F. Zhang, Nat. Sci. Rev. 1, 371 (2014).
- Dai (2015) P. Dai, Rev. Mod. Phys. 87, 855 (2015).
- Ren et al. (2008) Z. Ren, W. Lu, J. Yang, W. Yi, X. Shen, G. Che, X. Dong, L. Sun, F. Zhou, and Z. Zhao, Chinese Physics Letters 25, 2215 (2008).
- Wu et al. (2009) G. Wu, Y. Xie, H. Chen, M. Zhong, R. Liu, B. Shi, Q. Li, X. Wang, T. Wu, Y. Yan, J. Ying, and X. Chen, J. Phy. 21, 142203 (2009).
- Subedi et al. (2008) A. Subedi, L. Zhang, D. J. Singh, and M. H. Du, Phys. Rev. B 78, 134514 (2008).
- Mizuguchi and Takano (2010) Y. Mizuguchi and Y. Takano, J. Phys. Soc. Jpn. 79, 102001 (2010).
- Hsu et al. (2008) F. C. Hsu, J. Y. Luo, K. W. Yeh, T. K. Chen, T. W. Huang, P. M. Wu, Y. C. Lee, Y. L. Huang, Y. Y. Chu, D. C. Yan, et al., Proc. Natl. Acad. Sci. 105, 14262 (2008).
- Medvedev et al. (2009) S. Medvedev, T. M. McQueen, I. A. Troyan, T. Palasyuk, M. I. Eremets, R. J. Cava, S. Naghavi, F. Casper, V. Ksenofontov, G. Wortmann, and C. Felser, Nat. Mater. 8, 630 (2009).
- Miyata et al. (2015) Y. Miyata, K. Nakayama, K. Sugawara, T. Sato, and T. Takahashi, Nat. Mater. 14, 775 (2015).
- Wang et al. (2012) Q. Wang, Z. Li, W. Zhang, Z. Zhang, J. Zhang, W. Li, H. Ding, Y. Ou, P. Deng, K. Chang, J. Wen, C. Song, K. He, J. Jia, S. Ji, Y. Wang, L. Wang, X. Chen, X. Ma, and Q. Xue, Chin. Phys. Lett. 29, 037402 (2012).
- Ge et al. (2015) J. Ge, Z. Liu, C. Liu, C. Gao, D. Qian, Q. Xue, Y. Liu, and J. Jia, Nat. Mater. 14, 285 (2015).
- Fernandes et al. (2014) R. M. Fernandes, A. V. Chubukov, and J. Schmalian, Nature Phys. 10, 97 (2014).
- McQueen et al. (2009) T. M. McQueen, A. J. Williams, P. W. Stephens, J. Tao, Y. Zhu, V. Ksenofontov, F. Casper, C. Felser, and R. J. Cava, Phys. Rev. Lett. 103, 057002 (2009).
- Baek et al. (2015) S. H. Baek, D. V. Efremov, J. M. Ok, J. S. Kim, J. Van, and B. B chner, Nat. Mater. 14, 210 (2015).
- Böhmer et al. (2015) A. E. Böhmer, T. Arai, F. Hardy, T. Hattori, T. Iye, T. Wolf, H. V. Löhneysen, K. Ishida, and C. Meingast, Phys. Rev. Lett. 114, 027001 (2015).
- Khasanov et al. (2008) R. Khasanov, K. Conder, E. Pomjakushina, A. Amato, C. Baines, Z. Bukowski, J. Karpinski, S. Katrych, H. H. Klauss, H. Luetkens, A. Shengelaya, and N. D. Zhigadlo, Phys. Rev. B 78, 220510 (2008).
- Dong et al. (2009) J. Dong, T. Guan, S. Zhou, X. Qiu, L. Ding, C. Zhang, U. Patel, Z. Xiao, and S. Li, Phys. Rev. B 80, 024518 (2009).
- Song et al. (2011) C. Song, Y. Wang, P. Cheng, Y. Jiang, W. Li, T. Zhang, Z. Li, K. He, L. Wang, J. Jia, H. Hung, C. Wu, X. Ma, X. Chen, and Q. Xue, Science 332, 1410 (2011).
- Lai et al. (2015) X. Lai, H. Zhang, Y. Wang, X. Wang, X. Zhang, J. Lin, and F. Huang, J. Am. Chem. Soc. 137, 10148 (2015).
- Zhang et al. (2017) J. Zhang, F. Liu, T. Ying, N. Li, Y. Xu, L. He, X. Hong, Y. Yu, M. Wang, J. Shen, W. Yang, and S. Li, npj Quantum Mat. 2, 49 (2017).
- Schenck (1985) A. Schenck, Muon Spin Rotation: Principles and Applications in Solid State Physics (Hilger, Bristol, Boston, 1985).
- Brewer (1994) J. Brewer, Encyclopedia of Applied Physics: Muon Spin Rotation/Relaxation/Resonance (VCH Publishers, NewYork, 1994).
- Yaouanc and De Reotier (2011) A. Yaouanc and P. D. De Reotier, Muon spin rotation, relaxation, and resonance: applications to condensed matter, Vol. 147 (Oxford University Press, 2011).
- Holenstein et al. (2016) S. Holenstein, U. Pachmayr, Z. Guguchia, S. Kamusella, R. Khasanov, A. Amato, C. Baines, H. Klauss, E. Morenzoni, D. Johrendt, and H. Luetkens, Phys. Rev. B 93, 140506 (2016).
- Kirschner et al. (2016) F. K. K. Kirschner, F. Lang, C. V. Topping, P. J. Baker, F. L. Pratt, S. E. Wright, D. Woodruff, S. J. Clarke, and S. J. Blundell, Phys. Rev. B 94, 134509 (2016).
- Xing et al. (2016) J. Xing, H. Lin, Y. Li, S. Li, X. Zhu, H. Yang, and H. Wen, Phys. Rev. B 93, 104520 (2016).
- Ying et al. (2016) T. Ying, X. Lai, X. Hong, Y. Xu, L. He, J. Zhang, M. Wang, Y. Yu, F. Huang, and S. Li, Phys. Rev. B 94, 100504 (2016).
- Yang et al. (2016a) Y. Yang, W. Wang, H. Lu, Y. Xiang, and Q. Wang, Phys. Rev. B 93, 104514 (2016a).
- Miao et al. (2017) J. Miao, X. Niu, D. Xu, Q. Yao, Q. Chen, T. Ying, S. Li, Y. Fang, J. Zhang, S. Ideta, K. Tanaka, B. Xie, D. Feng, and F. Chen, Phys. Rev. B 95, 205127 (2017).
- Man et al. (2017) H. Man, J. Guo, R. Zhang, R. Schönemann, Z. Yin, M. Fu, M. B. Stone, Q. Huang, Y. Song, W. Wang, et al., npj Quantum Mat. 2, 14 (2017).
- Tresca et al. (2017) C. Tresca, G. Giovannetti, M. Capone, and G. Profeta, Phys. Rev. B 95, 205117 (2017).
- Borg et al. (2016) C. K. H. Borg, X. Zhou, C. Eckberg, D. J. Campbell, S. R. Saha, J. Paglione, and E. E. Rodriguez, Phys. Rev. B 93, 094522 (2016).
- Lin et al. (2016) H. Lin, Y. Li, Q. Deng, J. Xing, J. Liu, X. Zhu, H. Yang, and H. Wen, Phys. Rev. B 93, 144505 (2016).
- Uemura et al. (1985) Y. J. Uemura, T. Yamazaki, D. R. Harshman, M. Senba, and E. J. Ansaldo, Phys. Rev. B 31, 546 (1985).
- Kubo and Toyabe (1967) R. Kubo and T. Toyabe, in Magnetic Resonance and Relaxation, edited by R. Blinc (North-Holland, Amsterdam, 1967) pp. 810–823.
- Hayano et al. (1979) R. S. Hayano, Y. J. Uemura, J. Imazato, N. Nishida, T. Yamazaki, and R. Kubo, Phys. Rev. B 20, 850 (1979).
- Dalmas de Réotier and Yaouanc (1997) P. Dalmas de Réotier and A. Yaouanc, J. Phys. Cond. Matter 9, 9113 (1997).
- Pachmayr et al. (2016) U. Pachmayr, N. Fehn, and D. Johrendt, Chem. Commun. 52, 194 (2016).
- Bendele et al. (2012) M. Bendele, A. Ichsanow, Y. Pashkevich, L. Keller, T. Strässle, A. Gusev, E. Pomjakushina, K. Conder, R. Khasanov, and H. Keller, Phys. Rev. B 85, 064517 (2012).
- Drew et al. (2009) A. J. Drew, C. Niedermayer, P. J. Baker, F. L. Pratt, S. J. Blundell, T. Lancaster, R. H. Liu, G. Wu, X. H. Chen, I. Watanabe, V. K. Malik, A. Dubroka, M. Rossle, K. W. Kim, C. Baines, and C. Bernhard, Nat. Mater. 8, 310 (2009).
- Bendele et al. (2010) M. Bendele, A. Amato, K. Conder, M. Elender, H. Keller, H. H. Klauss, H. Luetkens, E. Pomjakushina, A. Raselli, and R. Khasanov, Phys. Rev. Lett. 104, 087003 (2010).
- Shermadini et al. (2011) Z. Shermadini, A. Krzton-Maziopa, M. Bendele, R. Khasanov, H. Luetkens, K. Conder, E. Pomjakushina, S. Weyeneth, V. Pomjakushin, O. Bossen, and A. Amato, Phys. Rev. Lett. 106, 117602 (2011).
- Brandt (1988) E. H. Brandt, Phys. Rev. B 37, 2349 (1988).
- Sonier et al. (2000) J. E. Sonier, J. H. Brewer, and R. F. Kiefl, Rev. Mod. Phys. 72, 769 (2000).
- Brandt (2003) E. H. Brandt, Phys. Rev. B 68, 054506 (2003).
- Kim et al. (2002) M. S. Kim, J. A. Skinta, T. R. Lemberger, W. N. Kang, H. J. Kim, E. Choi, and S. Lee, Phys. Rev. B 66, 064511 (2002).
- Khasanov et al. (2007a) R. Khasanov, A. Shengelaya, A. Maisuradze, F. L. Mattina, H. A. Bussmann, H. Keller, and K. A. Muller, Phys. Rev. Lett. 98, 057007 (2007a).
- Nica et al. (2017) E. M. Nica, R. Yu, and Q. Si, npj Quantum Mat. 2, 24 (2017).
- Pang et al. (2016) G. M. Pang, M. Smidman, J. L. Zhang, L. Jiao, Z. F. Weng, E. M. Nica, Y. Chen, W. B. Jiang, Y. J. Zhang, H. S. Jeevan, P. Gegenwart, F. Steglich, Q. Si, and H. Q. Yuan, ArXiv e-prints (2016), arXiv:1605.04786 [cond-mat.supr-con] .
- Saito et al. (2013) T. Saito, S. Onari, and H. Kontani, Phys. Rev. B 88, 045115 (2013).
- Adamski et al. (2017) A. Adamski, C. Krellner, and M. Abdel-Hafiez, Phys. Rev. B 96, 100503 (2017).
- Johnston (2006) D. C. Johnston, Phys. Rev. B 74, 184430 (2006).
- Press et al. (1992) W. H. Press, S. A. Teukolsky, W. T. Vetterling, and B. P. Flannery, “Numerical recipes in C,” (Cambridge University Press, 1992) Chap. 18, 2nd ed.
- Harshman et al. (1989) D. R. Harshman, L. F. Schneemeyer, J. V. Waszczak, G. Aeppli, R. J. Cava, B. Batlogg, L. W. Rupp, E. J. Ansaldo, and D. L. Williams, Phys. Rev. B 39, 851 (1989).
- Pümpin et al. (1990) B. Pümpin, H. Keller, W. Kündig, W. Odermatt, I. M. Savić, J. W. Schneider, H. Simmler, P. Zimmermann, E. Kaldis, S. Rusiecki, Y. Maeno, and C. Rossel, Phys. Rev. B 42, 8019 (1990).
- Hardy et al. (1993) W. N. Hardy, D. A. Bonn, D. C. Morgan, R. Liang, and K. Zhang, Phys. Rev. Lett. 70, 3999 (1993).
- Fesenko et al. (1991) V. I. Fesenko, V. N. Gorbunov, and V. P. Smilga, Physica C 176, 551 (1991).
- Khasanov et al. (2007b) R. Khasanov, S. Strässle, D. Di Castro, T. Masui, S. Miyasaka, S. Tajima, H. A. Bussmann, and H. Keller, Phys. Rev. Lett. 99, 237601 (2007b).
- Yang et al. (2016b) X. Yang, Z. Du, G. Du, Q. Gu, H. Lin, D. Fang, H. Yang, X. Zhu, and H. Wen, Phys. Rev. B 94, 024521 (2016b).