A new relativistic component of the accretion disk wind in PDS 456.
Abstract
Past X-ray observations of the nearby luminous quasar PDS 456 (at ) have revealed a wide angle accretion disk wind (Nardini et al., 2015), with an outflow velocity of . Here we unveil a new, relativistic component of the wind through hard X-ray observations with NuSTAR and XMM-Newton, obtained in March 2017 when the quasar was in a low flux state. This very fast wind component, with an outflow velocity of , is detected in the iron K band, in addition to the wind zone. The relativistic component may arise from the innermost disk wind, launched from close to the black hole at radius of gravitational radii. The opacity of the fast wind also increases during a possible obscuration event lasting for 50 ks. We suggest that the very fast wind may only be apparent during the lowest X-ray flux states of PDS 456, becoming overly ionized as the luminosity increases. Overall, the total wind power may even approach the Eddington value.
Subject headings:
galaxies: active — quasars: individual (PDS 456) — X-rays: galaxies — black hole physics1. Introduction
Outflows are an important phenomenon in Active Galactic Nuclei (AGN) and can play a key role in the co-evolution of the massive black hole and the host galaxy (Di Matteo et al., 2005; King, 2010). Black holes grow by accretion and strong nuclear outflows can quench this process by shutting off their supply of matter, thereby setting the relation that is seen today (Ferrarese & Merritt, 2000; Gebhardt, 2000). A number of high column density ( cm-2), fast () outflows have now been found in luminous AGN (Tombesi et al., 2010; Gofford et al., 2013), through detections of blue-shifted Fe K absorption, at rest-frame energies greater than 7 keV. These ultra fast outflows may be the missing link in the galactic feedback process, by driving massive molecular outflows out to large ( kpc) scales in galaxies (Tombesi et al., 2015; Feruglio et al., 2015).
A prototype ultra fast outflow occurs in the nearby () quasar, PDS 456. With a bolometric luminosity of erg s-1, PDS 456 is the most luminous QSO in the local Universe (Torres et al., 1997; Simpson et al., 1999; Reeves et al., 2000) and the radio-quiet analogue of 3C 273. However, PDS 456 is most notable for its powerful and fast () X-ray wind. Indeed, since its initial detection in 2001 with XMM-Newton (Reeves et al., 2003), the presence of the ultra fast outflow in PDS 456 has now been established through over a decade’s worth of X-ray observations (Reeves et al., 2009; Behar et al., 2010; Gofford et al., 2014; Nardini et al., 2015; Hagino et al., 2015; Matzeu et al., 2016, 2017; Parker et al., 2018). Intriguingly, Hamann et al. (2018) recently claimed a fast UV counterpart to the X-ray wind.
In a series of five XMM-Newton and NuSTAR observations of PDS 456 in 2013–2014, Nardini et al. (2015) detected a persistent P-Cygni-like profile from highly ionized (He or H-like) iron, blueshifted to 9 keV in the quasar rest frame. The broad P-Cygni profile established the wide-angle character of the outflow, while the wind variability provided a robust estimate of the wind radial distance, on the scale of the AGN accretion disk. From this, the large mass outflow rate inferred, of yr-1, implied that the wind power is at least 15% of the Eddington luminosity. This is more than sufficient to provide the feedback required by models of black hole and host galaxy co-evolution (Hopkins & Elvis, 2010), which likely plays a critical role in black hole growth and feedback in the early Universe.
2. Observations and Data Reduction
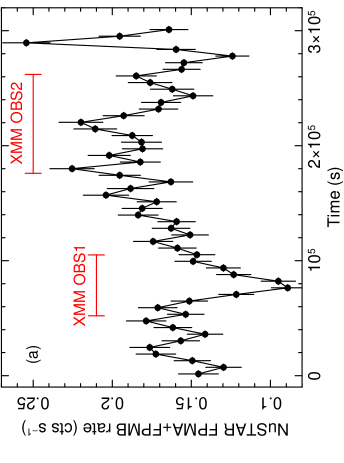
PDS 456 was subsequently observed with NuSTAR from March 23–26, 2017, with a total duration of 305 ks. This coincided with two simultaneous XMM-Newton observations, hereafter OBS 1 and OBS 2, taken over two consecutive satellite orbits (see Table 1) and both in Large Window mode for EPIC-pn. All data were processed using the nustardas v1.7.1, XMM-Newton sas v16.0 and heasoft v6.20 software. NuSTAR source spectra were extracted using a 50′′ circular region centered on the source and background from a 65′′ circular region clear from stray light. XMM-Newton EPIC-pn spectra were extracted from single and double events, using a 30′′ source region and background regions on the same chip. All spectra are binned to at least 50 counts per bin, while the background rates are % of the net source rates. The 3-40 keV NuSTAR lightcurve is shown in Figure 1, where OBS 1 coincided with a pronounced dip in the source count rate ks into the NuSTAR observation.
Note that outflow velocities are given in the rest-frame of PDS 456 at , after correcting for relativistic Doppler shifts. Errors are quoted at 90% confidence for one interesting parameter (or ).
3. Spectral Analysis
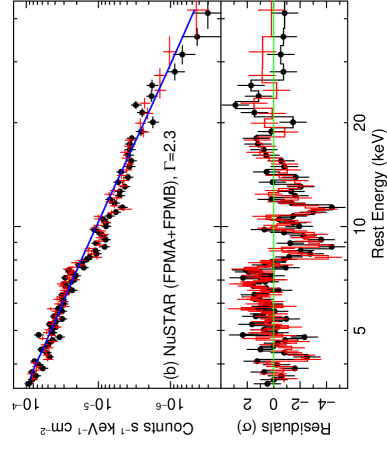
Initially we analyzed the time-averaged NuSTAR spectrum. The count rate spectra from the FPMA+FPMB modules are shown in Figure 1, where the cross normalizations of FPMA and FPMB agree to within % of each other. This is compared to a power-law of photon index of and corrected for Galactic absorption, where cm-2, (Kalberla et al., 2005). PDS 456 has a low flux throughout the 2017 observations, where the mean 2-10 keV flux of erg cm-2 s-1 is at the low end of the range measured in previous observations by Nardini et al. (2015) and Matzeu et al. (2017).
While the hard X-ray continuum is well described by a power-law, the overall fit is very poor, with , rejected with a null hypothesis probability of . Two strong absorption profiles are present in the residuals of both detectors between keV. Modeling these with Gaussian profiles gave rest frame centroid energies of keV and keV, with equivalent widths of eV and eV respectively. The addition of both lines significantly improved the fit by and . The lower energy line is consistent with the energy of the Fe K absorption profile measured previously in PDS 456 (Nardini et al., 2015; Matzeu et al., 2017), however the second line appears at a substantially higher energy. The lines are broadened and were fitted with a common velocity width, of km s-1, corresponding to eV at 8.93 keV, consistent with the width measured by Nardini et al. (2015) previously.
If we associate the two lines with the Ly and Ly transitions from H-like Fe at 6.97 keV and 8.27 keV respectively, then the inferred outflow velocities are inconsistent, with and . Note it would also be unusual for a higher order line to have such a high equivalent width as is observed here. Alternatively, the higher energy feature may be associated with an Fe K absorption edge. This gave a threshold energy of keV, resulting in an acceptable fit. However, the velocity inferred from the edge is also inconsistent; e.g. for H-like Fe, a K-shell edge (at 9.27 keV) blue-shifted to 10.7 keV gives , while the Fe xxvi Ly line (at 6.97 keV) blue-shifted to 8.9 keV gives . The velocities are also inconsistent if the two features instead arise from He-like iron.
Given the lack of a plausible identification at a self consistent velocity, the two absorption lines are likely to arise from two outflowing systems with different velocities. If they are both associated with Fe xxvi Ly, then the outflow velocities are and (with slightly higher velocities inferred for He-like Fe). Thus while the lower energy line is consistent with the outflow velocities usually measured at iron K in PDS 456 (Nardini et al., 2015; Matzeu et al., 2017), which are typically , the higher energy feature may originate from a new, very fast component of the wind.
3.1. Photoionization Modelling
To test this, we fitted the NuSTAR spectrum with a self consistent xstar photoionization model, which accounts for any weak higher order lines and edges in addition to the strong resonance absorption. We adopt the same absorption model grids used in Nardini et al. (2015), where the optical to X-ray SED of PDS 456 was used as the input continuum, which has an ionizing (1-1 000 Ryd) luminosity of erg s-1. A turbulence velocity width of 15 000 km s-1 was used, consistent with the Gaussian line width. Solar abundances of Grevesse & Sauval (1998) were used throughout. As the FPMA and FPMB spectra were consistent within errors, these were combined using mathpha into a single mean NuSTAR spectrum to maximize S/N. The response files were combined using equal weightings for both modules, while the source to background area (backscal) scaling factors were propagated through to the combined spectrum.
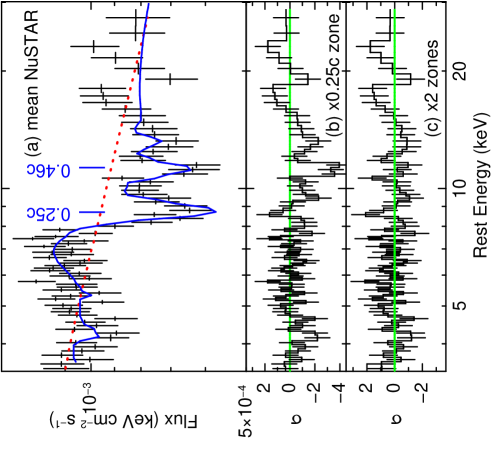
The best-fit xstar model fitted to the mean PDS 456 spectrum is shown in Figure 2 (panel a). Two outflowing absorption zones are required, one slower zone with and the faster zone with ; see Table 1 for details. These velocities are consistent with the Gaussian analysis and the high ionization parameter of the absorbers () is consistent with the absorption lines arising from H-like iron (Fe xxvi Ly). Figure 2 (panel b) shows the residuals against a model including only the slower zone, which leaves significant residuals around 11 keV and can then only be modeled by the fast zone (see panel c). Indeed, both absorption zones are required at % confidence (with , slow zone and , fast zone), resulting in an acceptable fit statistic of . As a final consistency check, we attempted to model the high energy feature with a lower ionization partial coverer, having the same velocity as the zone, but where the K-shell edge is blueshifted to higher energies. This single velocity absorber is rejected as the fit statistic is worse by (for ) compared to the two velocity model.
The spectrum shows significant excess emission, observed redwards of the absorption lines between keV (see Figure 2). This was first measured by Nardini et al. (2015), who resolved the broad P-Cygni profile at Fe K from PDS 456. As per Nardini et al. (2015), the emission was modeled with an additive xstar emission grid and convolved with a Gaussian profile of width keV (or km s-1). The high equivalent width of the emission, with eV, is consistent with the wide angle wind characterized by Nardini et al. (2015).
3.2. The XMM-Newton Observations
The spectra obtained from the two XMM-Newton observations, OBS 1 and OBS 2, were also analyzed. Simultaneous NuSTAR spectra were extracted using identical good time intervals and then fitted jointly with their corresponding XMM-Newton spectra. The combined FPMA and FPMB spectra were used after first checking that the two modules were consistent. During the OBS 1 spectrum, PDS 456 was caught at an even lower flux ( erg cm-2 s-1) coincident with the dip in the lightcurve. Note this may correspond to a short-lived absorption event, which will be discussed in a forthcoming paper on the broad band spectra.
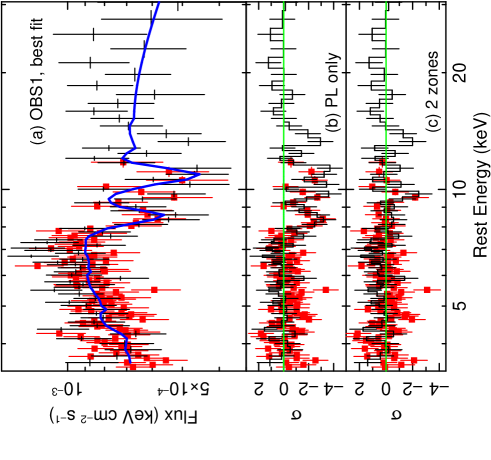
The best-fit spectrum from OBS 1 is shown in Figure 3 and is well fitted by the dual velocity absorber. Both absorption lines are detected at % confidence, while the equivalent width of the high energy line is slightly stronger than the mean value, with eV. Note that the high energy feature is also independently detected in both the NuSTAR and XMM-Newton spectra, as the bandpass of the latter extends to 12 keV in the QSO rest frame. For ease of comparison, we assumed a constant ionization across the mean, OBS 1 and OBS 2 spectra; see Table 1 for parameters. The column density of the fast zone is slightly higher in OBS 1 ( cm-2), when compared to the mean ( cm-2), to account for the increased depth of the high energy feature. The OBS 2 spectrum is consistent with the mean and the faster zone appears somewhat weaker compared to the lowest flux OBS 1 spectrum.
4. Discussion
Low flux observations of PDS 456, obtained with NuSTAR and XMM-Newton in March 2017, have revealed a new relativistic component of the fast wind in this quasar, with . Compared to studies of fast winds in other local, predominantly radio-quiet AGN (Tombesi et al., 2010; Gofford et al., 2013), this is the fastest wind detected to date in a nearby AGN. Perhaps the only other AGN with such an extreme fast wind is the high redshift () BAL QSO, APM 08279+5255, where the outflow velocity may reach (Saez et al., 2009; Chartas et al., 2009; Saez & Chartas, 2011). Note, Hagino et al. (2017) subsequently claimed the outflow velocity in APM 08279+5255 may be somewhat lower, with .
Here, the high velocity absorber appears considerably faster than all of the previous Fe K wind measurements in PDS 456. Matzeu et al. (2017) studied all twelve previous X-ray observations of PDS 456, observed with either XMM-Newton, NuSTAR or Suzaku. They showed the wind velocity in PDS 456 varies within the range , while the strong positive correlation observed between the outflow velocity and X-ray luminosity was interpreted as possible evidence for a radiatively driven wind. The mean X-ray luminosity in 2017, of erg s-1, lies at the low luminosity end of the range observed by Matzeu et al. (2017), with erg s-1 and the velocity of the slower zone, with is consistent with the trend between velocity and luminosity.
| Mean | OBS 1 | OBS 2 | |
|---|---|---|---|
| Observations:- | |||
| Telescope | NuSTAR | XMM-Newton | XMM-Newton |
| Detector | FPMA+FPMB | EPIC-pn | EPIC-pn |
| OBSID | 60201020002 | 0780690201 | 0780690301 |
| Start date | 2017/03/23 | 2017/03/23 | 2017/03/25 |
| Start time | 05:31:09 | 19:25:01 | 06:27:09 |
| Exposurea | 157.0 | 39.6 | 64.9 |
| Net rate (s-1)b | |||
| Slower Zone:- | |||
| c | |||
| d | |||
| 80.3 | 24.0 | 42.2 | |
| Faster Zone:- | |||
| c | |||
| d | |||
| 29.1 | 23.6 | 10.4 | |
| Continuum:- | |||
| e | 2.58 | 1.84 | 2.54 |
The fast, component of the wind is not apparent in the past observations of PDS456, e.g. Nardini et al. (2015) and see Matzeu et al. (2017), Figure 1. To confirm this, we checked all the previous NuSTAR observations of PDS 456 for any significant higher energy absorption above 10 keV, in addition to the persistent, but slower, wind component. However, aside from the 2017 observation, none was found. The most stringent constraint comes from the first NuSTAR observation of PDS 456 in 2013 (hereafter, OBS A, Nardini et al. 2015), where an upper-limit of eV is placed on any Gaussian absorption line profile above 10 keV. Here the 2-10 keV X-ray luminosity is erg s-1, more than higher than in 2017. The upper limit on the column density of the fast zone during this high luminosity observation is cm-2 for a given ionization of , significantly lower than for the low flux 2017 observations (see Table 1).
The fast component may arise from an inner stream-line of an accretion disk wind (Proga & Kallman, 2004; Sim et al., 2010), launched from very close to the black hole. Magneto-hydrodynamical mechanisms are also capable of accelerating winds up to these velocities, especially if the illuminating X-ray continuum is steep (Fukumura et al., 2010), as is the case here with . For a radiatively accelerated wind, the launch radius is:-
| (1) |
where is the wind launch radius in gravitational units (), is the terminal velocity and is the force multiplier factor. In PDS 456, with , and for a modest multiplier of , then (or cm for a black hole mass of ). The maximum likely radial distance of the absorber can be derived under the assumption that , for a given wind streamline. For an ionizing luminosity of erg s-1, cm-2 and , then cm This is consistent with the radial distance of cm estimated by Nardini et al. (2015), from the wind variability timescale in PDS 456.
If the fast wind component is launched from close to the black hole and is fully exposed to the central X-ray source, then its ionization state will likely be very high. At these distances and for iron not to become fully ionized (where ), this requires densities of cm-3 and which could be associated to matter lifted off the surface of the inner accretion disk. Given that this very fast wind component is detected during a low flux observation of PDS 456, while it appears absent at higher fluxes (such as during OBS A in 2013), this may suggest that an inner wind zone would only be detected when its ionization state is low enough for the gas to not be fully ionized. Alternatively the innermost wind may be shielded by denser gas near the launch point, which could arise from the high column partial covering gas often seen in the lower flux X-ray spectra of PDS 456 (Matzeu et al., 2016).
Nonetheless, the fast zone may have important implications for the overall wind energetics. For the wind in PDS 456, Nardini et al. (2015) estimated the kinetic power and mass outflow rate to be % and % of Eddington respectively. As the power goes as , then the zone could require the wind power to be a factor of higher. Then the total kinetic power could reach Eddington, if the overall mass outflow rate of the fastest zone is similar to the slower one. In reality, it may be likely that we are observing a structured wind, with multiple velocity components, which are launched at different disk radii. Future high resolution X-ray calorimeter observations, with XARM and Athena, will be able to further reveal the velocity structure in high velocity winds such as PDS 456.
5. Acknowledgements
JR acknowledges financial support through grants NNX17AC38G, NNX17AD56G and HST-GO-14477.001-A. AL acknowledges support via the STFC consolidated grant ST/K001000/1. EN is funded by the EU Horizon 2020 Marie Sklodowska-Curie grant no. 664931. Based on observations obtained with XMM-Newton, an ESA science mission with instruments and contributions directly funded by ESA Member States and NASA.
References
- Behar et al. (2010) Behar, E., Kaspi, S., Reeves, J., et al. 2010, ApJ, 712, 26
- Chartas et al. (2002) Chartas, G., Brandt, W. N., Gallagher, S. C., & Garmire, G. P. 2002, ApJ, 579, 169
- Chartas et al. (2009) Chartas, G., Saez, C., Brandt, W. N., Giustini, M., & Garmire, G. P. 2009, ApJ, 706, 644
- Di Matteo et al. (2005) Di Matteo, T., Springel, V., & Hernquist, L. 2005, Nature, 433, 604
- Ferrarese & Merritt (2000) Ferrarese L., Merritt D., 2000, ApJ, 539, 9
- Feruglio et al. (2015) Feruglio C., et al., 2015, A&A, 583, 99
- Fukumura et al. (2010) Fukumura, K., Kazanas, D., Contopoulos, I., & Behar, E. 2010, ApJ, 723, L228
- Gebhardt (2000) Gebhardt K., 2000, ApJ, 539, 13
- Gofford et al. (2013) Gofford J., Reeves J. N., Tombesi F., et al., 2013, MNRAS, 430, 60
- Gofford et al. (2014) Gofford, J., Reeves, J. N., Braito, V., et al. 2014, ApJ, 784, 77
- Grevesse & Sauval (1998) Grevesse N., Sauval A. J., 1998, SSRv, 85, 161
- Hagino et al. (2015) Hagino, K., Odaka, H., Done, C., et al. 2015, MNRAS, 446, 663
- Hagino et al. (2017) Hagino, K., Done, C., Odaka, H., Watanabe, S., & Takahashi, T. 2017, MNRAS, 468, 1442
- Hamann et al. (2018) Hamann, F., Chartas, G., Reeves. J., & Nardini, E., 2018, MNRAS, accepted
- Hopkins & Elvis (2010) Hopkins P. F., Elvis M., 2010, MNRAS, 401, 7
- Kalberla et al. (2005) Kalberla, P. M. W., Burton, W. B., Hartmann, D., et al. 2005, A&A, 440, 775
- King (2010) King A. R., 2010, MNRAS, 402, 1516
- Matzeu et al. (2017) Matzeu, G. A., Reeves, J. N., Braito, V., et al. 2017, MNRAS, 472, L15
- Matzeu et al. (2016) Matzeu, G. A., Reeves, J. N., Nardini, E., et al. 2016, MNRAS, 458, 1311
- Nardini et al. (2015) Nardini, E., Reeves, J. N., Gofford, J., et al. 2015, Science, 347, 860
- Parker et al. (2018) Parker, M. L., Reeves, J. N., Matzeu, G. A., Buisson, D. J. K., & Fabian, A. C. 2018, MNRAS, 474, 108
- Proga & Kallman (2004) Proga D., Kallman T. R., 2004, ApJ, 616, 688
- Reeves et al. (2000) Reeves, J. N., O’Brien, P. T., Vaughan, S., et al. 2000, MNRAS, 312, L17
- Reeves et al. (2003) Reeves, J. N., O’Brien, P. T., & Ward, M. J. 2003, ApJ, 593, L65
- Reeves et al. (2009) Reeves, J. N., O’Brien, P. T., Braito, V., et al. 2009, ApJ, 701, 493
- Reeves et al. (2014) Reeves, J. N., Braito, V., Gofford, J., et al. 2014, ApJ, 780, 45
- Saez et al. (2009) Saez, C., Chartas, G., & Brandt, W. N. 2009, ApJ, 697, 194
- Saez & Chartas (2011) Saez, C., & Chartas, G. 2011, ApJ, 737, 91
- Sim et al. (2010) Sim S. A., Proga D., Miller L., Long K. S., Turner T. J., 2010, MNRAS, 408, 1396
- Simpson et al. (1999) Simpson, C., Ward, M., O’Brien, P., & Reeves, J. 1999, MNRAS, 303, L23
- Tombesi et al. (2010) Tombesi, F., Cappi, M., Reeves, J. N., et al. 2010, A&A, 521, A57
- Tombesi et al. (2015) Tombesi, F., Meléndez, M., Veilleux, S., et al. 2015, Nature, 519, 436
- Torres et al. (1997) Torres, C. A. O., Quast, G. R., Coziol, R., et al. 1997, ApJ, 488, L19