A combined multiwavelength VLA/ALMA/Chandra study unveils the complex magnetosphere of the B-type star HR5907
Abstract
We present new radio/millimeter measurements of the hot magnetic star HR 5907 obtained with the VLA and ALMA interferometers. We find that HR 5907 is the most radio luminous early type star in the cm-mm band among those presently known. Its multi-wavelength radio light curves are strongly variable with an amplitude that increases with radio frequency. The radio emission can be explained by the populations of the non-thermal electrons accelerated in the current sheets on the outer border of the magnetosphere of this fast rotating magnetic star. We classify HR 5907 as another member of the growing class of strongly magnetic fast rotating hot stars where the gyro-synchrotron emission mechanism efficiently operates in their magnetospheres. The new radio observations of HR 5907 are combined with archival X-ray data to study the physical condition of its magnetosphere. The X-ray spectra of HR 5907 show tentative evidence for the presence of non-thermal spectral component. We suggest that non-thermal X-rays originate a stellar X-ray aurora due to streams of non-thermal electrons impacting on the stellar surface. Taking advantage of the relation between the spectral indices of the X-ray power-law spectrum and the non-thermal electron energy distributions, we perform 3-D modeling of the radio emission for HR 5907. The wavelength-dependent radio light-curves probe magnetospheric layers at different heights above the stellar surface. A detailed comparison between simulated and observed radio light-curves leads us to conclude that the stellar magnetic field of HR 5907 is likely non-dipolar, providing further indirect evidence of the complex magnetic field topology of HR 5907.
keywords:
stars: early-type – stars: chemically peculiar – stars: individual: HR 5907 – stars: magnetic fields – radio continuum: stars – X-rays: stars.1 Introduction
At the top of the main sequence, magnetism has an incidence rate of about (Grunhut et al., 2012b; Fossati et al., 2015). The study of the magnetic fields of early-type stars has received extraordinary attention in the form large legacy programs, like the Magnetism in Massive Stars (MiMeS) project (Wade et al., 2016) and the B-Fields in OB Stars (BOB) collaboration (Morel et al., 2014, 2015). The overall field topology of the hot magnetic stars is usually shaped like a dipole, and in many cases, the polar field strength reaches the kiloGauss (kG) level. The existence of strong magnetic fields in hot stars can significantly affect the circumstellar environment. In fact, the early-type main sequence stars are hot enough to give rise to a radiatively driven stellar wind (Lucy & Solomon, 1970; Castor, Abbott & Klein, 1975). A strong stellar magnetic field can force the ionized wind component to flow along the magnetic field lines. In the magnetic equator, the field lines are closed and the wind plasma can accumulate (Walborn, 1974; Shore et al., 1987; Shore & Brown, 1990), whereas at the higher magnetic latitudes the stellar wind freely propagates (Shore, 1987; Leone, 1993).
The interactions between stellar winds and magnetospheres of early-type stars were described by the magnetically confined wind shock (MCWS) model (Babel & Montmerle, 1997). In the framework of MCWS, the wind streams arising from the two opposite stellar hemispheres collide close to the magnetic equatorial plane, giving rise to shocks that produce plasma heating and consequent X-rays emission (see ud-Doula & Nazé, 2016 and references therein).
If the stellar magnetic field is strong enough, the thermal plasma that accumulates at low magnetic latitudes is forced to rigidly co-rotate with the star, well-described by the Rigidly Rotating Magnetosphere (RRM) model (Townsend & Owocki, 2005). Moreover, magnetohydrodynamics (ud-Doula, Townsend & Owocki, 2006; ud-Doula, Owocki & Townsend, 2008) and rigid-field hydrodynamics (Townsend, Owocki & ud-Doula, 2007) simulations confirm the formation of a stable disk, as predicted by the RRM model. The prototype of a hot magnetic star with a RRM is Ori E (Groote & Hunger, 1997; Townsend, Owocki & Groote, 2005). Several Ori E analogues since discovered are: Ori C (Leone et al., 2010); HD 176582 (Bohlender & Monin, 2011); HR 5907 (Grunhut et al., 2012a); HR 7355 (Rivinius et al., 2013); HD 23478 (Eikenberry et al., 2014; Sikora et al., 2015); HD 345439 (Eikenberry et al., 2014; Wisniewski et al., 2015; Hubrig et al., 2017); HD 35502 (Sikora et al., 2016); HD 164492C (Wade et al., 2017).
The plasma in an RRM is mainly subjected to two opposing forces: gravitational and the centrifugal. The first drives the plasma to infall toward the star, whereas the latter is outward. Rotation supplies the centrifugal support to the co-rotating plasma. Stellar rotation is thus the key parameter to produce large centrifugal magnetospheres (CM) (Maheswaran & Cassinelli, 2009; Petit et al., 2013). There are presumably other forces acting on the magnetospheric plasma (e.g. radiative driving and the Lorentz force), but these are neglected in the RRM model. Far from the star, close to the Alfvén radius, the magnetic confinement ceases, and the trapped thermal plasma breaks the magnetic field lines giving rise to current sheets where electrons can be accelerated to relativistic energies. This non-thermal electron population, moving toward the star, travels through magnetospheric regions with increasing field strength and radiates a continuum radio spectrum via the incoherent gyro-synchrotron emission mechanism (Drake et al., 1987; Linsky et al., 1992; Leone, Trigilio & Umana, 1994). As a consequence, the radio emission from stable co-rotating magnetospheres varies as a function of the stellar rotation (Leone, 1991; Leone & Umana, 1993). Multi-wavelength radio light curves for the total intensity and for the fraction of the circularly polarized radio emission have been successfully simulated using a 3D model that, sampling the space surrounding the star, numerically solves the radiative transfer equation for the gyro-synchrotron emission (Trigilio et al., 2004; Leto et al., 2006).
Such a model provides a powerful tool to investigate the physical conditions in stellar magnetospheres. In particular, we conducted radio observations, using the Karl G. Jansky Very Large Array (VLA), of a representative sample of magnetic hot stars. The sample stars are characterized by different physical properties, such as the geometry of their magnetospheres, the strength of their magnetic fields, and the stellar rotation speed. The first object analyzed from the radio point-of-view was HR 7355 (Leto et al., 2017a). In that case the synergistic radio and X-ray diagnostic techniques led to a scenario in which all the data could be understood within a single model realization. In particular the X-ray spectrum of HR 7355 showed indication of a non-thermal component that was explained as the signature of the non-thermal electron population that impacted with the stellar surface, close to the polar caps, to produce X-ray auroral emission by thick target bremsstrahlung emission. The same electron population could explain the radio data.
The subject of this paper, HR 5907, is the twin of HR 7355. Both stars have almost the same spectral type and similar rotation periods. The two stars basically differ only by the magnetic topology, that presumably affect their magnetospheres. Similar to HR 7355, the X-ray spectrum of HR 5907 gives an indication of the existence of non-thermal X-ray radiation, which provides constraints for the model free parameters that control the stellar radio emission. The opportunity to measure and model the radio light curves of HR 5907 at many frequencies give us the capability to probe the physical conditions of the magnetosphere and to obtain hints of its magnetic field topology.
In Section 2 we summarize the properties of HR 5907 that are already known. Section 3 describes the radio (VLA), millimeter (ALMA), and X-ray (Chandra) observations. The radio/millimeter and X-ray properties of HR 5907 are developed in Sections 4 and 5. The results from modeling of the HR 5907 radio emission is detailed in Section 6. The effect on the radio emission of an equatorial thin ring of cold thermal plasma, within the magnetosphere of HR 5907, is presented in Section 7.1. Section 7.2 outlines an alternative scenario that involves the possible contribution of the auroral radio emission from HR 5907. The effect of a magnetic field topology more complex than a simple dipole for the radio/millimeter emission is discussed in Section 7.3. The results of this work are summarized in Section 8.
| Parameter | Symbol | ref. | |
|---|---|---|---|
| Spectral and Peculiarity Type | B2.5V | 1 | |
| Distance [pc] | 2 | ||
| Reddening [mag] | 0.14 | 3 | |
| Mass [M⊙] | 3 | ||
| Equatorial Radius [R⊙] | 3 | ||
| Effective Temperature [K] | 3 | ||
| Rotational Period [days] | 3 | ||
| Polar Field [Gauss] | 3 | ||
| Rot. Axis Inclination [degree] | 3 | ||
| Mag. Axis Obliquity [degree] | 3 |
2 The magnetic early B-type star HR 5907
HR 5907 (HD 142184) is a main sequence B2.5V star, showing evidence of photometric and spectroscopic variability with a period of 0.508276d (Grunhut et al., 2012a). HR 5907 is also characterized by a strong magnetic field that is variable with the same period. Among the currently known magnetic early-type stars, HR 5907 has the shortest rotation period. The high rotation speed makes this star oblate, in fact the ratio between polar and equatorial radii is (Grunhut et al., 2012a). HR 5907’s variability has been explained in the framework of the Oblique Rotator Model (ORM), where the star is characterized by a mainly dipolar magnetic field topology, having the magnetic dipole axis tilted with respect to the rotational axis (Babcock, 1949; Stibbs, 1950).
The longitudinal magnetic field component of HR 5907, given by the average over the whole visible disc of the magnetic field vector components along the line of sight, also defined as the effective magnetic field (), ranges from to Gauss (Grunhut et al., 2012a). The values were derived from the analysis of the Stokes stellar spectrum by using the Least-Squares Deconvolution (LSD) technique (Donati et al., 1997). The main stellar parameters of HR 5907 are listed in Table 1.
The magnetic curve of HR 5907 was modeled assuming a simple dipole (polar magnetic field strength kG) slightly misaligned with respect to the stellar rotation axis (). On the other hand, the Bayesian analysis of the Stokes profile gives the indication of a lower polar field strength ( kG) (Grunhut et al., 2012a). The authors also noted considerable differences between the values obtained by the line profile fitting process of the individual observations (range 4–25 kG, dipole axis still almost aligned with the rotation axis). This suggests a surface magnetic field with contributions from higher-order multipolar components.
HR 5907 has detectable radio emission in the centimeter/millimeter frequency range. The star is listed in the NRAO VLA Sky Survey (NVSS) (Condon et al., 1998), with a flux density at 1.4 GHz ( cm) of , and was also detected in the AT20G survey (Murphy et al., 2010) using the Australian Telescope Compact Array. The fluxes of HR 5907 reported by the AT20G survey are respectively: mJy at 5 GHz ( cm), mJy at 8 GHz ( cm), and mJy at 20 GHz ( cm). HR 5907 was further detected by the Korean VLBI Network (KVN) at 43 GHz ( mm) (Petrov et al., 2012). The reported 43 GHz fluxes measured by the KVN are mJy and mJy, as a function of the projected baseline length. The two measured fluxes are consistent within the reported errors, indicating that HR 5907 is unresolved at the resolution of the KVN ( mas).
3 Observations and data reduction
Radio observations of the magnetic early-type stars are currently limited mainly to centimeter wavelengths. Magnetic star spectra at the millimeter range are largely unknown. To our knowledge, mm flux measurements of early-type magnetic stars have been reported only by Leone et al. (2004). Those results were obtained with the IRAM interferometer at 87.7 GHz. Owing to poor signal-to-noise, only two targets were clearly detected. In this paper, we present the combined radio (range of wavelengths from the centimeter to the millimeter) and X-ray analysis of what is currently the fastest rotating hot magnetic star, HR 5907.
3.1 VLA
The radio measurements of HR 5907 analyzed in this paper were performed using the Karl G. Jansky Very Large Array (VLA) radio interferometer, operated by the National Radio Astronomy Observatory111The National Radio Astronomy Observatory is a facility of the National Science Foundation operated under cooperative agreement by Associated Universities, Inc. (NRAO). The observations were carried out during two epochs, using the full array configuration, and cyclically varying the observing frequency. Details regarding these radio measurements are listed in Table 2.
The standard calibration pipeline, working on the Common Astronomy Software Applications (CASA), was used by the NRAO staff to calibrate the interferometer measurements. The calibrated data were imaged using the CASA task CLEAN, providing the radio maps of each observing scan for the Stokes and parameters of the sky region around HR 5907. The flux density of the source, for each observing frequency and for each scan, was measured by fitting a two-dimensional gaussian at the source position in the Stokes and cleaned maps. The target is located in the center of the field. The error of the bidimensional gaussian fitting procedure, and the map rms, measured in a field area without other field radio sources, were summed in quadrature to estimate the uncertainty of the single measurement. The radio measurements are listed in Table 6. On average the uncertainty of the total flux density measurements for each observing band are respectively: at 6 and 10 GHz; at 15 GHz; at 22 GHz; and at 33 and 44 GHz.
The array was in configuration ‘B’ during the two observing runs of HR 5907. The corresponding minimum synthesized beam size was [arcsec2], obtained at the maximum observed frequency of 44 GHz. The size of a Gaussian fit to HR 5907 in the image is consistent with the synthesized beam, indicating that the source is unresolved at the maximum resolution obtained.
| Bandwidth | Epoch | Flux cal | Phase cal | |
|---|---|---|---|---|
| (GHz) | (GHz) | |||
| 6/10/15 | 2 | 2015-Mar-09 | 3C286 | 15222730 |
| 22/33/44 | 8 | 2015-Mar-09 | 3C286 | 16252527 |
| 6/10/15 | 2 | 2015-Mar-16 | 3C286 | 15222730 |
| 22/33/44 | 8 | 2015-Mar-16 | 3C286 | 16252527 |
3.2 ALMA
HR 5907 was included in the observatory’s “Weak Source Survey” (WSS) for potential gain calibrators (ALMA Partnership, 2015, §4.3), and was observed on 2015-Aug-02. HR 5907 was included in the survey based on the previously mentioned 20 GHz flux density of (AT20G, Murphy et al., 2010). The WSS was designed as a dual band survey, observing each source with consecutive scans covering 87–103 and 277–293 GHz (Bands 3 and 7, respectively, using a common photonic LO frequency of 95 GHz for both bands). The photometry from the survey is available publicly in the ALMA Source Catalogue, which is served from the ALMA Science Portals. Due to its strong variability, HR 5907 has then been flagged in the catalogue as an unsuitable calibrator. The measurements for HR 5907 can be retrieved from the link reported in footnote222https://almascience.eso.org/sc/rest/measurements?catalogue=5&name=J1553-2358. In this case the observation was made with the ACA correlator using 11 7m and 3 12m antennas.
HR 5907 was observed in two pairs of scans separated by 39 minutes. We have re-reduced the data333ASDM UID uid://A002/Xa73e10/X3061 to produce fluxes per scan. The ALMA receivers are able to detect the linear orthogonal polarizations (X and Y) of the electromagnetic wave. The correlation products of the X and Y components can be used to build the circular polarization state of the wave. Due to a combination of two technical issues that independently affected linearity correction in three of four basebands and all correlation products with the Y polarization, only one baseband (2 GHz bandwidth) and the XX correlation product have been used. Due to these issues, the circular polarization information of the electromagnetic wave measured by ALMA could not be extracted. The centre frequencies of the two basebands were 102.04 and 291.97 GHz in the Band 3 and 7, respectively. The corresponding wavelengths are respectively and . The ALMA measurements are listed in Table 7. An absolute flux calibration uncertainty of 5% has been added in quadrature with the noise-based uncertainty.


3.3 Chandra
HR 5907 was observed by Chandra on 2012-06-18 for 25 ks (ObsID 13624, Nazé et al., 2014). We retrieved and analyzed these archival X-ray data. The ACIS-S detector was operated in the “very faint” mode. Data were retrieved and reduced using the most recent calibration files. The spectrum was extracted using standard procedures from a region with diameter . The spectrum was grouped such that there is at least 10 counts in each energy bin. The background area was chosen in a nearby area free of X-ray sources. To analyze the spectra we used the standard X-ray spectral fitting software xspec (Arnaud, 1996). The abundances were set to solar values according to Asplund et al. (2009). The adopted distance to the star and interstellar reddening are listed in Table 1.
4 The radio/millimeter emission of HR 5907
4.1 The multi-wavelength light curves
HR 5907 was detected by the VLA and ALMA interferometers in each observing band. The measurements were phase folded using the ephemeris for heliocentric Julian date as given by Grunhut et al. (2012a):
| (1) |
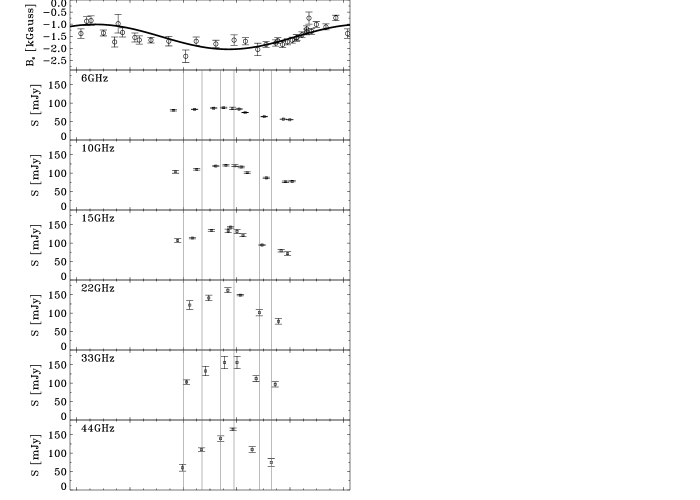
displayed in Fig. 1 and listed in Tables 6 and 7. The reference heliocentric Julian date (HJD0) refers to the maximum of the H equivalent width. For comparison with the multi-wavelength radio light curves of the total intensity (Stokes , respectively Right plus Left Circular Polarization state), the magnetic field curve of HR 5907 (ORM parameters listed in Table 1) is also shown in the top panel of Fig. 1 superimposed to the measurements (Grunhut et al., 2012a).
The radio measurements were collected by the VLA in two different observing epochs separated by about 7 days ( stellar rotations). Measurements from the two sets of data performed at the same rotational phases merge perfectly. Even though the stellar rotational period was not fully covered at the VLA observing bands (fraction of covered phases ), HR 5907 exhibits a clear rotational modulation of its radio emission. The amplitudes of the radio emission variability grow as the observing frequency increases. This is made more clear when looking at the spectral dependence of the standard deviations () of the measurements performed at the same frequency (see bottom panel of Fig. 2). In this analysis the statistical parameter was used as index of the flux density variability. This analysis has been performed for the VLA data only, because the standard deviation of the measurements at the two ALMA observing bands are unreliable as variability indices due to the small number of measurements available.
The temporal variations of radio/millimeter light-curves of HR 5907 can be explained by the gyro-synchrotron emission from a population of mildly relativistic electrons moving inside the stellar magnetosphere. This model explains the enhancement of the measured radio emission when the stellar rotational phases are close to the maxima of the effective magnetic field curve, as commonly observed in the hot magnetic stars (Trigilio et al., 2004; Bailey et al., 2012; Leto et al., 2006, 2012, 2017a).
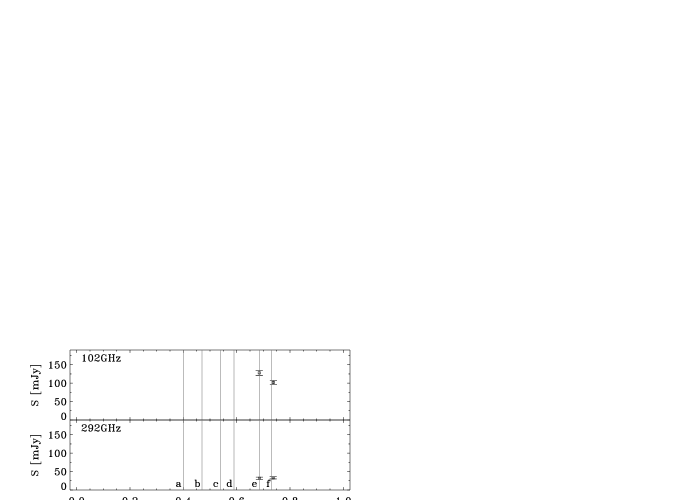
The measured radio emission at 44 GHz shows a clear maximum related with the most negative extremum of the stellar magnetic curve ( Gauss). At the lowest radio frequencies (6 and 10 GHz) this maximum is also present, but less prominent. At 102 GHz there is statistically significant variation between the two scans, in good agreement with the VLA measurements (see Fig 1). Even if the two ALMA measurements performed at 102 GHz show a clear rotational variability, the poor phase sampling prevents us from reaching a reliable conclusion regarding the possible existence and phase location of the maximum detected at the lowest frequencies. At the still higher observing frequency, the ALMA measurements at 292 GHz are noise-limited and do not show significant variation.
4.2 The spectra
To highlight the multi-wavelength temporal evolution of the radio emission for the total intensity (Stokes ) of HR 5907, the source radio spectra were obtained almost at the same rotational phases. Due to the most rapid temporal variation of the radio emission at GHz (see Fig. 1), the spectra were collected at the phases coinciding with the highest radio frequency measured by the VLA, or with the available ALMA measurements. These selected phases are marked by the vertical lines displayed in Fig. 1. The flux densities at the other frequencies were obtained from interpolating the data. The so derived radio spectra of the total intensity are displayed in Fig. 3. Unfortunately the ALMA measurements do not cover the same large range of phases sampled by the VLA. The spectra of HR 5907 that include the available ALMA measurements are the (e) and (f) spectra. The two rotational phases sampled by ALMA follow the phase of maximum 44 GHz emission, (d) spectrum.
The VLA dynamic spectra indicates a clear temporal evolution of the HR 5907 radio spectrum in the frequency range 6–44 GHz. In fact, as the measured radio flux density enhances, the peak of the spectrum also moves toward the higher frequencies. Looking at Fig. 3 it is clear that the spectra frequency peak () continuously increases approaching to the maximum 44 GHz emission, measured at : spectrum (d) displayed in the right panel of Fig. 3. At this particular rotational phase the radio spectrum does not changes its slope between 6 and 44 GHz. However, could be at higher frequency since observations at frequencies beyond 44 GHz are not available at this particular stellar rotational phase. In the framework of the gyro-synchrotron radio emission mechanism from a co-rotating stellar magnetosphere, the frequency of the peak in the radio spectrum is a function of the magnetic field strength of the magnetospheric layer that mainly contributes to the emission at that frequency (Dulk & Marsh, 1982). The observed increase of suggests that the stellar rotation reveals magnetospheric regions with quite high local magnetic field strength.
For the spectra obtained at phases following the 44 GHz maximum emission (spectra (e) and (f) displayed in the right panel of Fig. 3) the measurements at the ALMA frequencies are available. These spectra highlight that the HR 5907 emission at 102 GHz has a flux level higher than the corresponding 44 GHz emission, whereas the 292 GHz measurements indicate that the HR 5907 emission steeply decreases approaching at the sub-millimeter wavelengths. These ALMA data indicate that the magnetospheric layers where the 102 GHz emission is generated have a dominant contribution to the HR 5907 gyro-synchrotron emission, at least for these particular rotational phases.
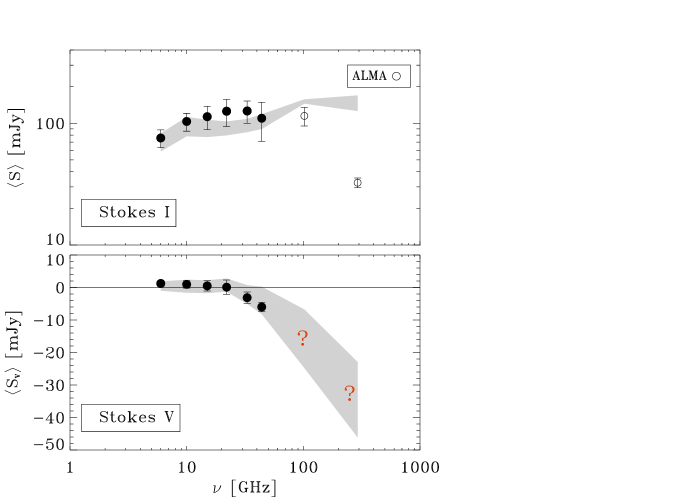
Radio spectra from all the collected data were averaged and are displayed in the top panel of Fig. 2. The spectral index of the mean radio spectrum of HR 5907 is quite flat (spectral index , estimated between 6 and 102 GHz). The spectral index calculated within the two ALMA measurements (102 and 292 GHz) is instead very steep (spectral index ).
Scaling for the stellar distance ( pc), the absolute radio luminosity of HR 5907 is about [erg s-1Hz-1]. This was calculated in the frequency range where the source spectrum is almost flat averaging all the radio flux density measurements performed between 6 and 102 GHz. This radio luminosity makes HR5907 about 2 times brighter than either Ori E (Linsky, Drake & Bastian, 1992) or HR 7355 (Leto et al., 2017a). At the present HR 5907 has the highest published luminosity in the cm-mm band for a non-degenerate magnetic massive star.
4.3 The circularly polarized emission
The fractional circular polarization (, where Stokes , respectively Right minus Left Circular Polarization) is also variable for HR 5907. The values of as a function of the rotational phase are shown in the bottom panel of Fig. 4; in the top panel the magnetic curve of HR 5907 is shown for reference. The error bars of the measurements were not displayed so that the rotational modulation of the fraction of the circular polarization could be seen more clearly. The average uncertainties of for each observing frequency are respectively: 0.3% at 6 GHz, 0.2% at 10 GHz, 0.3% at 15 GHz, 0.4% ant 22 GHz, 0.6% at 33 GHz, and 1.1% at 44 GHz. The estimated error levels are low enough to consider the amplitudes of the rotational modulations observed at each radio frequency as significant. In fact the observed amplitudes of the variations are from to 14 times higher than the uncertainties.
HR 5907 shows a frequency-dependent effect of the measured fraction of the circularly polarized radio emission. The sign of the polarized radio emission changes as the radio frequency increases. At the sampled rotational phases, the sign of is always positive at 6 GHz, but reverses its sign at intermediate frequencies (, 15, and 22 GHz) as the star rotates. On the other hand, is always negative at higher frequencies ( and 44 GHz); see the bottom panel of Fig. 4. The VLA measurements highlight that the absolute magnitude of the polarized emission is stronger at the highest observing frequency ( GHz).
The overall behavior of the circularly polarized emission of HR 5907 can be analyzed averaging all the measurements performed at the same frequency. The variability index calculated for the Stokes emission (also shown in the bottom panel of Fig. 2) indicates that the amplitude of the Stokes rotational modulation does not significantly vary with radio frequency, in contrast to what is observed for Stokes . The Stokes mean spectrum is displayed in the middle panel of Fig. 2. The frequency-dependent behavior of the circularly polarized emission of HR 5907, already mentioned by analyzing the light curves of , is now more clearly highlighted. On average the circularly polarized emission at 6 and 10 GHz is positive, at 15 and 22 GHz is null, and at 33 and 44 GHz is negative. This indicates that, on average, the left-handed circularly polarized radio emission of HR 5907 prevails at high frequencies, whereas at the low frequencies the right-handed circularly polarized emission is slightly stronger.
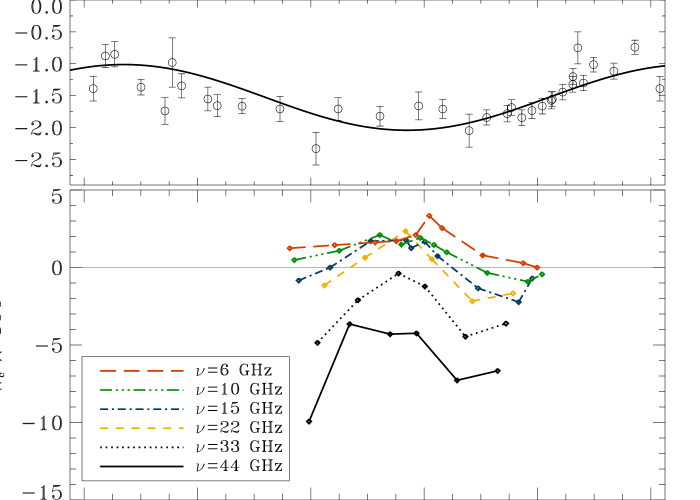
In the case of the gyro-synchrotron emission mechanism, the polarization sign relates to the average spatial orientation of the magnetic field vectors in the regions where the radio emission at a given frequency mainly originates. Consequently the circularly polarized radio emission and the effective magnetic field sign are correlated. When the northern magnetic hemisphere (magnetic field lines mainly oriented toward the observer) is visible, the radio emission shows right-handed circular polarization (Stokes positive). On the other hand the radio emission is left handed circularly polarized (Stokes negative) when the southern hemisphere is visible. This correlation was clearly observed in the cases of CU Vir (Leto et al., 2006), Ori E (Leto et al., 2012), and HR 7355 (Leto et al., 2017a). that are all three well-known hot magnetic stars characterized by a dominant dipolar magnetic field and well described by the ORM, even if the magnetic curve shape of CU Vir (Kochukhov et al., 2014) and Ori E (Oksala et al., 2012, 2015) evidence that these stars possess a quadrupolar component that is not-negligible at the stellar surface.
In the case of HR 5907 the circularly polarized emission at GHz is left handed circularly polarized, in accordance with the measured sign of the effective magnetic field. The polarization sign of the radio emission at the lower frequencies is instead anti-correlated with respect to the sign of , as clearly shown in Fig. 4.
5 The X-ray emission of HR 5907
HR 5907 is a known relatively hard X-ray source which was detected by the ROSAT All Sky Survey (Oskinova et al., 2011), and more recently observed by the Chandra X-ray telescope (see Section 3.3). Chandra exposure time covered about a half of stellar rotation period. To check for possible X-ray variability, we extracted an X-ray light curve in 0.3–10.0 keV energy band. Statistical tests did not reveal X-ray variability or systematic changes in the X-ray light curve. New, longer observations are required to fully investigate possible X-ray variability associated with stellar rotation.
Similar to its twin, HR 7355, HR 5907 strongly violates the empiric Guëdel-Benz relation between the X-ray and radio luminosities of coronal main sequence stars Hz (Guëdel & Benz, 1993; Benz & Guëdel, 1994). The above relation holds for stars covering a wide Sp range, from the F to the early type M. For HR 5907, this ratio is more than 3 orders of magnitude lower, highlighting that the physical processes responsible for the radio and X-ray generation in magnetic B-type stars are distinct from the mechanisms working in the coronae of the late-type stars.

The Chandra ACIS-S spectrum of HR 5907 is shown in Figure 5. It could be well fitted (reduced ) by a two-temperature thermal plasma model (see also Nazé et al., 2014). The temperature of the hottest plasma component is well constrained ( keV or MK, Table 3). It is clear that the presence of such hot plasma cannot be explained in the framework of the MCWS model. In fact, from the Rankine-Hugoniot condition for the strong shock (), to reach the temperature of 75 MK the wind of HR 5907 should have velocity of km s-1. Even if the fast rotation can increase the wind velocity (Bard & Townsend, 2016), the above estimated velocity is not physical for a B2.5V star – empirically estimated terminal wind velocities of the main sequence B-type stars do not exceed 1000 km s-1 (Prinja, 1989; Oskinova et al., 2011). Such low wind velocity is sufficient to explain only the presence of the cooler plasma component ( keV or MK, Table 3).
As a next step, by analogy with HR 7355, we fitted the X-ray spectrum of HR 5907 using a spectral model that combines thermal and non-thermal (power-low) components. The quality of fit is similar to the two temperature model (reduced ). Figure 5 shows the observed and the fitted model, while the model parameters are listed in Table 3. In this spectral model, the thermal plasma component has a temperature of MK (1 keV), follow that the wind velocity is plausible for a B2.5V star ( km s-1, using the Equation 10 reported in ud-Doula et al., 2014).
| [ cm-2] | |
|---|---|
| Two temperature thermal model | |
| [keV] | |
| [ cm-3] | |
| [keV] | |
| [ cm-3] | |
| [keV] | 6.1 |
| Fluxb [ erg cm-2 s-1] | 6.0 |
| Thermal plus power-law () model | |
| [keV] | |
| [ cm-3] | |
| [photons keV-1 cm-2 s-1 at 1 keV] | |
| Fluxb [ erg cm-2 s-1] | 6.3 |
| [erg s-1] | |
| [Hz] | |
-
a
exceeds the ISM hydrogen column density
-
b
dereddened; in the 0.2–10 keV band
Formally, the X-ray spectrum of HR 5907 can also be well fitted by the power-low model only (, reduced ) or single temperature model only ( keV, reduced ). Nevertheless, we favor the combined, thermal and non-thermal plasma model as better motivated physically.
By analogy with HR 7355, the non-thermal X-rays in the HR 5907 spectrum could be explained as bremsstrahlung emission from a non-thermal electron population. These non-thermal electrons are also responsible for the gyro-synchrotron stellar radio emission. When they impact the stellar surface, X-rays are radiated by thick-target bremsstrahlung emission. This physical process is well understood, in particular, the spectral index , of the non-thermal photons, can be related to the spectral index , of the non-thermal electron population, by the simple relation (Brown, 1971). Then, using the best fit to HR 5907’s X-ray spectrum, the spectral index of the non-thermal electron energy distribution is .
| Symbol | Range | Simulation step | Number of simulations | |
|---|---|---|---|---|
| Alfvén radius [R∗] | – | 13 | ||
| Thickness of the middle magnetosphere [R∗] | – | 23 | ||
| Non thermal electron density [cm-3] | – | 30 | ||
| Thermal electron density at the stellar surface [cm-3] | – | 20 |
Interestingly, a similar mechanism is also acting in the case of the magnetized planet – Jupiter. The continuously injected non-thermal electrons, with energies higher than keV, precipitate towards the Jovian atmosphere giving rise to auroral X-ray emission recognized in the XMM-Newton X-ray spectrum of Jupiter (Branduardi-Raymont et al., 2007, 2008).
We suggest that the non-thermal X-ray emission of HR 5907 is also of auroral origin, whereas the thermal plasma component with the temperature MK is produced via MCWS mechanism. This is the scenario already proposed for HR 7355. For clarity, this is summarized again in the Appendix B and pictured in Fig. 13.
6 Modeling HR 5907’s Radio Emission
6.1 The model
In order to investigate the physical conditions of the magnetosphere of a typical hot magnetic star, we developed a model of its non-thermal radio continuum emission (Trigilio et al., 2004; Leto et al., 2006). The model was developed under the simplified hypothesis of a magnetic topology described by a dipole field, in the framework of the ORM.
Accordingly to the MCWS model, the stellar wind is channeled by the closed field lines and accumulates at low magnetic latitudes, “inner-magnetoshere”. As a first approximation, the temperature of the plasma linearly increases as a function of radial distance from the star, whereas density decreases outward as (Babel & Montmerle, 1997). In our model, the plasma temperature at the stellar surface was assumed equal to the effective temperature (). The resulting plasma pressure can be assumed as roughly constant within the inner-magnetosphere.
The spatial surface that locates the region where the magnetic energy density equals the plasma one is the Alfvén surface. The last closed magnetic field line intercepts the magnetic equatorial plane at the Alfvén radius (). In the case of a simple dipole, the magnetic field line is defined by the equation: (where is the magnetic latitude). The size of the magnetospheric cavity (“middle-magnetosphere”) located just outside the Alfvén surface, where the non-thermal electrons are efficiently generated, is defined by the length () of the acceleration region. In our magnetospheric model, the density of the thermal plasma within the middle-magnetosphere was assumed equal to the density of the freely escaping stellar wind.
The relativistic electrons are characterized by a power-law energy spectrum (), and the directions of their velocity vectors are isotropically distributed with respect to the local magnetic field vector. The fraction of the non-thermal electrons moving toward the stellar surface travels through layers with increasing magnetic field strength. As a consequence of the balance between the reducing magnetic flux tube section and the magnetic mirroring effect, the density of the non-thermal electrons can be assumed constant within the middle-magnetosphere.
The relativistic electron population freely propagates within the middle magnetosphere and radiates an incoherent non-thermal radio continuum by the gyro-synchrotron emission mechanism, that is a function of the local magnetic field strength and orientation, and of the density of the ambient ionized medium. For the calculation of the gyro-synchrotron emission and absorption coefficients the general expressions given by Ramaty (1969) at the low harmonic numbers (, where is the local gyro-frequency) have been used, whereas at the higher harmonic numbers the approximate expressions given by Klein (1987) have been adopted. Both calculation approaches take into account the presence of the ionized ambient medium.
The ionized medium affects the gyro-synchrotron radiation through the frequency-dependent suppression mechanism known as the Razin effect. The Razin effect operates on each propagation mode, but with a different magnitude between the ordinary (O) and the extraordinary (X) modes. The radio wave propagation within the magneto-active circumstellar plasma requires, also, knowledge of the refractive indices and of the polarization coefficients, respectively for the ordinary (O-mode) and extraordinary (X-mode) magneto-ionic modes (Klein & Trotter, 1984). The frequency-dependent absorption effects (Dulk, 1985) of the thermal ionized plasma trapped within the inner-magnetosphere has also been taken into account.
The stellar magnetospheric volume is then sampled by using a 3D cartesian grid, and all the physical quantities, needed for the calculation of the gyro-synchrotron absorption and emission coefficients, are calculated for each grid point, that is assumed as a homogeneous radio source. Following, the radiative transfer equation can be numerically solved along the directions coinciding with the line of sight; this is done separately for the two magneto-ionic modes. Finally, for a given magnetospheric geometry, by varying the stellar rotational phase, we are able to simulate the rotational modulation of the gyro-synchrotron stellar radio emission, for the Stokes and , and the corresponding brightness spatial distribution. For details see Trigilio et al. (2004) and Leto et al. (2006).
6.2 The numerical simulations
To reproduce the multi-wavelengths radio light curves of HR 5907 measured between 6 and 44 GHz, we performed an extensive set of model simulations. Many of the fixed stellar parameters required as input by the model are listed in Table 1. These are the distance of the star, the radius, the effective temperature, the strength of the polar magnetic field, and the geometry of the ORM. The other fixed parameters are the spectral index () of the power-law energy spectrum of the non-thermal electrons, and their low-energy cutoff. The spectral index was fixed using the constraint achieved by the fit of the HR 5907 X-ray spectrum. From the analysis discussed in Sec. 5, was adopted. The low-energy cutoff of the non-thermal electrons was fixed at 100 keV (corresponding to a Lorentz factor ) like the case of the near-twin star HR 7355, that was the subject of a similar study (Leto et al., 2017a).
The model free parameters are the Alfvén radius (), the length of the acceleration region for the non-thermal electrons, the number density of these electrons, and the density at the stellar surface of the thermal plasma trapped within the inner magnetosphere. The ranges of the simulated parameters, with the corresponding steps, are listed in Table 4. The value of is a function of the radiatively driven stellar wind parameters, in particular of the wind mass-loss rate , which is unknown in the case of HR 5907. Once is defined, the wind parameters and consequently the plasma density within the middle-magnetosphere are determined (see Leto et al., 2006 for details).
To simulate the radio emission of HR 5907 as a function of the rotational phase, the simulations were performed for six different values of . Taking into account the variation of the rotational phase and the values of the free parameters listed in Table 4, more than simulations were carried out. For the simulations of the HR 5907 radio emission a three-dimensional cartesian grid with variable sampling step was adopted. The grid points at distances higher than 12 R∗ are spaced every 1 R∗; at the intermediate distance (range 8–12 R∗) the grid spacing is equal to 0.3 R∗; whereas close to the star (distance lower than 8 R∗), a denser sampling grid was used (step 0.1 R∗).
6.3 Comparison with the observations
After exploring a broad space of free parameters, listed in Table 4, we were not able to find a combination to reproduce simultaneously the multi-wavelength radio light curves of HR 5907 for both Stokes and . In a previous paper, using the same 3D model and the same simulation approach, we successfully simulated the multi-wavelength radio light curves of HR 7355 (a twin of HR 5907), simultaneously for the total intensity and the circularly polarized radio emission (Leto et al., 2017a). Both stars have similar radio and X-ray luminosities. The radio spectra of the two stars are almost flat in the spectral range observed by the VLA, even if the spectral slope of HR 5907 is slightly positive (), while the slope measured in the case of HR 7355 is slightly negative (). The average radio luminosity measured at the lowest observed frequency (6 GHz) is quite similar for the two stars, respectively: [erg s-1 Hz-1] for HR 5907; [erg s-1 Hz-1] for HR 7355. These two stars are expected to have nearly twin magnetospheres. The main difference between the two stars is the dipole axis misalignment, that in the case of HR 5907 is almost parallel to the rotation axis (7 degrees), whereas HR 7355 is characterized by a large dipole axis misalignment (, Rivinius et al., 2013).
To take advantage of the close similarity between HR 5907 and HR 7355, we exploit the free parameters that were fixed by the HR 7355 radio emission modeling to simulate synthetic radio light curves corresponding for the geometry of HR 5907. In particular, we derive for HR 7355 the thermal electron density at the stellar surface that is able to reproduce the observed rotational modulation of its radio emission: 2–5 [cm-3] (Leto et al., 2017a).
| [km s-1] | 900 | from the X-ray spectrum fit |
|---|---|---|
| from the X-ray spectrum fit | ||
| [cm-2] | from the Stokes at 6 GHz | |
| [R∗] | 15.5–17.5 | with 2–5 [cm-3] † |
| [M⊙ yr-1] | ||
| [MK] | ||
| [ cm-3] | ||
| [M⊙ yr-1] |
-
The thermal electron density used to simulate the HR 5907 radio emission has been fixed on the basis of the results achieved with the analysis of HR 7355 (Leto et al., 2017a)
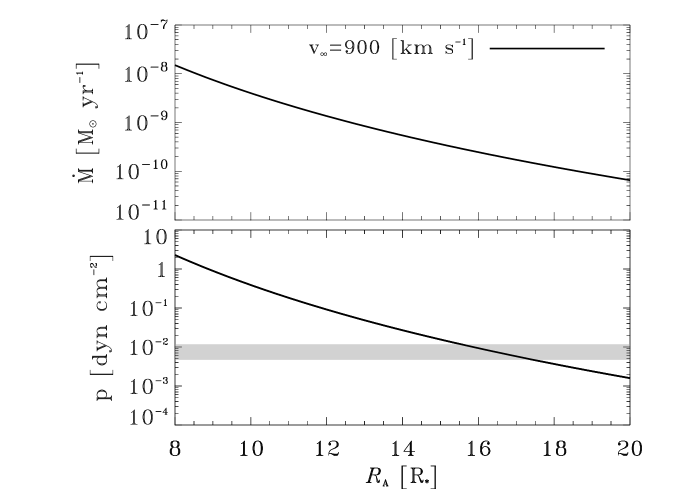
In the case of a simple dipole, the equatorial value of the Alfvén surface, , can be located from equating the wind energy density, radial plus centrifugal, with the magnetic energy density. In this simplified case, the energy balance equation can be solved (Trigilio et al., 2004), making it possible to directly relate the value of with the stellar wind parameters: mass-loss rate () and terminal velocity (). On the other hand, the wind parameters and the trapped plasma parameters must be physically compatible together. In fact, the pressure of the thermal plasma trapped within the inner-magnetosphere must be lower than the wind ram pressure, so that the plasma is contained within the Alfvén surface deduced from the stellar wind.
The plausible terminal wind velocity is km s-1. Given the density of the trapped plasma at the stellar surface, the range of the Alfvén radii for which the wind ram pressure is compatible with the pressure of the thermal plasma trapped within the inner-magnetosphere can be deduced. The dependence of the wind mass-loss rate of HR 5907 as a function of is displayed in the top panel of Fig. 6, whereas the corresponding wind ram pressure is pictured in the bottom panel of the same figure. By comparing the wind ram pressure with the pressure of the trapped thermal plasma, the range of values of that are physically plausible is uniquely defined. The so derived range of and the corresponding average wind mass-loss rate, temperature of the trapped plasma, and emission measure, are listed in Table 5. The radiative wind from HR 5907 can freely propagate from the northern and southern polar caps only. The polar cap areas can be calculated from intersecting the magnetic field line passing through at the magnetic equatorial plane with the stellar surface. The rate of mass actually lost () from HR 5907 is also listed in Table 5.
The column density of the non-thermal electrons, required to reproduce the observed flux level at 6 GHz of HR 5907, is higher than the corresponding value obtained from the simulations of the multi-wavelength radio light curves of HR 7355 (Leto et al., 2017a). In detail, for HR 5907 the average column density of the relativistic electrons is cm-2 (listed in Table 5), the corresponding value for HR 7355 is cm-2.
The case of a reduced polar field strength (Grunhut et al., 2012a) has been also taken into account. We performed simulations of the gyro-synchrotron emission from a dipole shaped magnetosphere using the stellar parameters listed in Table 1, but using Gauss (Grunhut et al., 2012a). In this case, to reproduce the flux level of HR 5907 measured at 6 GHz, we need to enhance the column density of the relativistic electrons. On the average the relativistic electron density has to be increased by a factor . Apart this, there are no significant differences between these new simulations and those performed using Gauss.
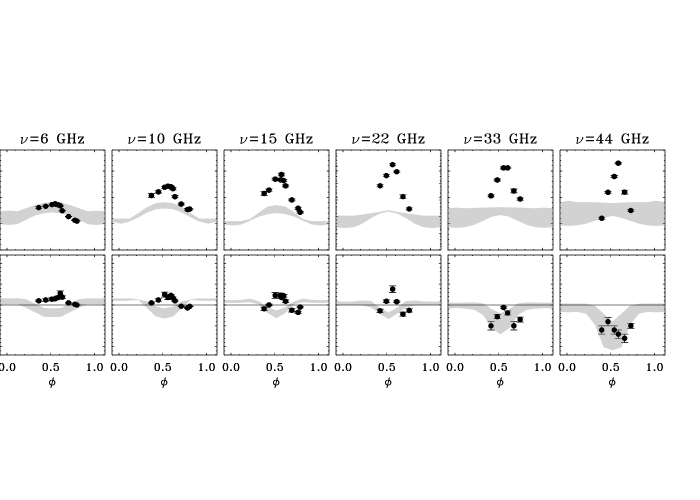
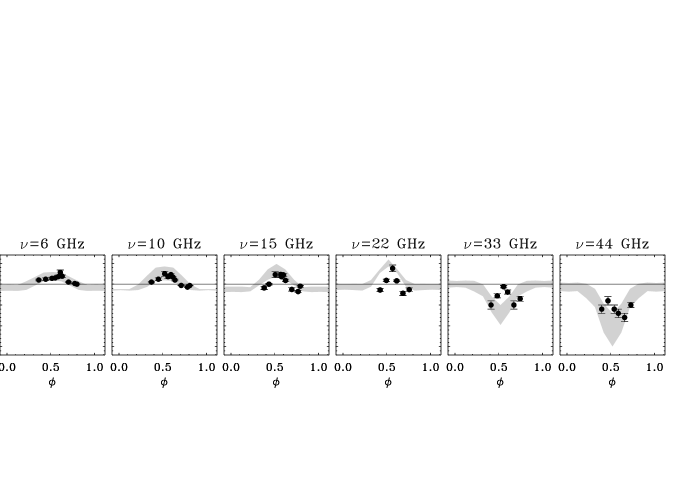
The Stokes and synthetic radio light curves of HR 5907, calculated using the model parameters listed in Table 5 and the stellar parameters listed in Table 1, are compared to the observed ones in Fig. 7. In the top panels of Fig. 7, the shaded areas superimposed with the radio measurements represent the envelope of the simulated radio light curves for the total intensity radio emission. It is clear from the figure that the simulations well reproduce the observations only at the lower observed radio frequency (6 GHz). As the radio frequency increases, the discrepancy between observations and simulations grows dramatically. In particular, the HR 5907 flux level measured at GHz is about 50% higher than the simulated one. Furthermore, using the HR 5907 geometry, the radio emission modulation predicted for a simple dipole is not compatible with the observed one.
The comparison between the simulated radio light curves for the circularly polarized emission with the observed ones (bottom panels of Fig. 7) demonstrates that the field topology for HR 5907, derived from the effective magnetic field measurements, is able to well reproduce the left-handed circularly polarized emission measured at 44 GHz, roughly reproduce the average flux level of the Stokes emission at 33 GHz, and totally fails to reproduce the Stokes emission at the lower frequencies. In particular, regarding the comparison of the simulations with the measured Stokes emission at GHz, we observe that the model simulates circularly polarized radio emissions of opposites sign with respect to the observed ones.
In summary, the model of the HR 5907 magnetosphere is not able to reproduce the high-frequency flux level measured at certain stellar rotational phases, the wide rotational modulation of the radio light curves of the total intensity at GHz, nor the sign of the circularly polarized emission at the lowest frequencies. In the next sections we explore possible additional effects that could help to explain the discrepancy between the model and the observations.
7 Discussion
7.1 Effect of the cold plasma around HR 5907
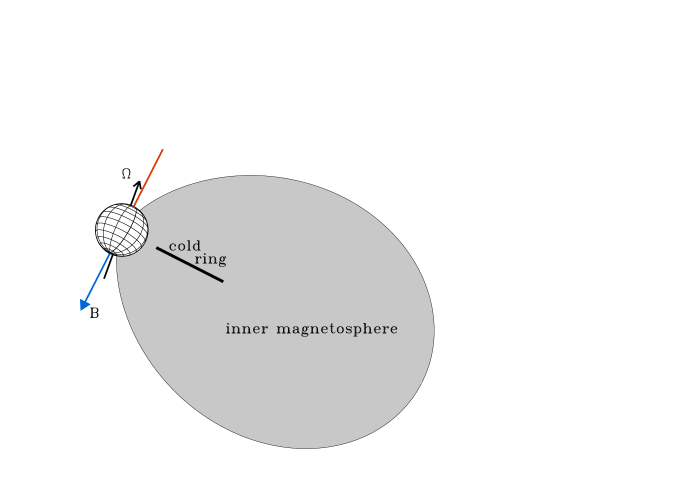
Similarly to HR 7355, the magnetosphere of HR 5907 is likely to trap clouds of dense and cold material (Grunhut et al., 2012a; Rivinius et al., 2013). For both stars, these plasma clouds have linear extensions comparable with their stellar radii. Hence, the stellar magnetospheres might be more inhomogeneous than has been assumed in the model (Sec. 6.1). In particular, the RRM semi-analytic model of Townsend & Owocki (2005) predicts the formation of an equatorial thin warped disk rigidly co-rotating with the star, extending beyond the Kepler coronation radius for several stellar radii. The Kepler radius (defined by the relation: , where is the gravitational constant, the angular velocity of the star, and the stellar mass, whose value for HR 5907 is reported in Table 1) locates the equatorial region where the outward centrifugal force is balanced by the inward gravitational force. In the case of the highly magnetized stars is lower than the Alfvén radius, leading to the formation of a centrifugal magnetosphere (Petit et al., 2013). For HR 5907 R∗ versus R∗ (Table 5), that is compatible with the building of a CM. The accumulation of cold plasma in the CM could be a source of anisotropic thermal free-free absorption, that further affects the non-thermal radio continuum emission. The CM should have essentially no material between the star and (Petit et al., 2013), hence this can be easily modeled like a ring with inner radius equal to .
To explain the observed behavior of the HR 5907 radio emission, we analyze the effect that an equatorial ring of cold and dense thermal plasma could have on the radio emission from the stellar magnetosphere. The scale height of this cold ring decreases asymptotically outward. In the case of an almost aligned dipole (like HR 5907) the asymptotic scale height can be derived by using the relation (Townsend & Owocki, 2005), where is the Boltzmann constant and is the mean molecular weight (assumed equal to half proton mass for a fully pure hydrogen gas). The temperature of the plasma ring has been fixed to K, according to the temperature estimation of the cold plasma located inside the magnetosphere of HR 5907 (Grunhut et al., 2012a). In the case of HR 5907 R∗.
In the synthetic model, that describes a typical magnetosphere of the early-type magnetic stars (pictured in Fig. 13) an equatorial ring of cold plasma, assumed with a constant thickness, has been added. The thickness of this cold ring has been conservatively assumed equal to 0.3 R∗, that is ten times the asymptotic scale height above estimated. The spatial resolution of the finest grid spacing (0.1 R∗, see Sec. 6.2) is then able to sample the assumed ring thickness with at least 3 grid points. Following Grunhut et al. (2012a), who studied the rotational modulation of the H features measured in the HR 5907 spectra (due to the presence of this cold circumstellar material), the outer radius of the ring has been chosen equal to 4.4 R∗, whereas the inner radius has ben fixed equal to the Kepler coronation radius. The adopted number density was set at cm-3. The adopted density and the outer radius are the maximal values given by Grunhut et al. (2012a), for which the analysis assumes a temperature of K.
The linear extension of the thin dense equatorial ring can be compared with the size of the inner-magnetosphere by looking at Fig. 8. The rotation axis inclination and the magnetic axis obliquity displayed in the figure are those assumed for HR 5907, listed in Table 1.
The simulations performed adding also a thin and dense cold ring within the deep magnetospheric layers of HR 5907 are indistinguishable from the simulations performed without it. We conclude that, for the assumed magnetospheric geometry of HR 5907, an equatorial ring of dense and cold plasma (with an inner radius equal to 1.5 R∗ and an outer radius equal to 4.4 R∗) does not yield a significant effect on the simulated multiwavelength radio light curves, neither for the total intensity (Stokes ) nor for the circularly polarized emission (Stokes ).
7.2 Auroral radio emission from HR 5907?
The scenario that is able to simultaneously explain the gyro-synchrotron radio emission and the non-thermal X-ray emission from the early type magnetic stars (summarized in Appendix B) predicts that along with the X-ray aurora, auroral radio emission should also be present. The auroral radiation is a coherent radio emission powered by the electron cyclotron maser (ECM) mechanism, that amplifies the radiation in the directions almost perpendicular to the local magnetic field vector direction. The ECM is driven by some type of unstable electron energy distribution, in particular, the loss-cone (Wu & Lee, 1979; Melrose & Dulk, 1982) or the horseshoe (Winglee & Pritchett, 1986) distributions, that can be developed by the fast electrons moving along the converging field lines of a density-depleted magnetospheric cavity. In the case of hot magnetic stars, the cavity coincides with the “middle-magnetosphere” (see Fig. 13). This coherent emission mechanism mainly amplifies the extraordinary magneto-ionic mode giving rise to fully polarized emission, with the polarization sense depending on the magnetic field vector orientation ( for emission from the northern side of the magnetosphere, for emission from the southern side).
In the framework of the tangent plane beaming model, the coherent auroral radio emission is mainly amplified tangentially to the cavity wall where it forms (Louarn & Le Queau, 1996a, b). This is the case of the Earth’s Auroral Kilometric Radiation (AKR) (Mutel, Christopher & Pickett, 2008; Menietti et al., 2011). The resulting auroral radio emission will be constrained within a narrow beam pattern giving rise to fully polarized broadband pulses, like a radio light-house.
Leto et al. (2016) developed a 3D-model of the stellar auroral radio emission that was able to successfully reproduce the observed features of the CU Vir auroral pulses. This model has also been used to simulate the multi-wavelength auroral pulses of the Ultra Cool Dwarf (M8.5) TVLM 513-46546 (Hallinan et al., 2007), allowing us to constrain the overall topology of its magnetosphere (Leto et al., 2017b).
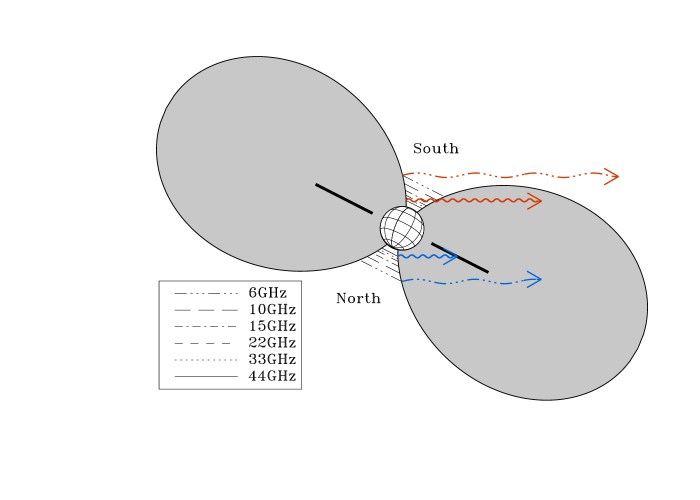
The auroral radio emission at a fixed frequency arises from rings located above the magnetic poles, at a height that depends on the local value of the gyro-frequency , which is a function of the magnetic field strength: GHz. In the case of a magnetosphere shaped by a simple dipole the phase occurrence of the auroral pulses falls at phases almost coinciding with the nulls of the effective magnetic field curve. This was observed in the case of the two already known hot magnetic stars characterized by auroral radio emission: CU Vir (A0Vp) (Trigilio et al., 2000, 2008, 2011; Ravi et al., 2010; Lo et al., 2012); and HD 133880 (B8IVp) (Chandra et al., 2015; Barnali, Chandra & Wade, 2018). In the case of HR 5907 its effective magnetic field curve is always negative (Grunhut et al., 2012a), but the ORM geometry of this star predicts that, at certain stellar rotational phases, the magnetic field axis is almost perpendicular to the line of sight. In principle the auroral radio emission of HR 5907 should be detectable.
To test if the peculiar multi-wavelength radio light curves of HR 5907 are affected by the contribution of the stellar auroral radio emission, we modeled the shape of the synthetic auroral radio light curves arising from the magnetosphere of HR 5907. The magnetospheric size was fixed at R∗, according to the average of the Alfvén radii listed in Table 5. The auroral rings within the HR 5907 magnetosphere, tuned at the observed VLA radio frequencies, are pictured in Fig. 9. The parameters that control the auroral beam pattern are the ray path deflection and the beaming angle, the latter centered on the plane tangent to the auroral ring and containing the local magnetic field vector (see Leto et al., 2016 for details). These two angles are assumed as free parameters. We performed model simulations increasing the auroral beam size from the case of emission constrained within a narrow beam (auroral beam size equal to ) up to auroral radio emission radiated isotropically. The deflection angle of the auroral ray path, with respect to the direction of the local magnetic field vector, was assumed variable in the range –.
As a result of our simulations, we highlight that this elusive coherent phenomenon could be detectable also for the HR 5907 geometry. To be detectable, the auroral radio emission from HR 5907 has to be radiated within a large beaming pattern (auroral beam size larger than ). The simulated fraction of the circularly polarized emission is comparable with the observed ones, % (see bottom panel of Fig. 4), but this is possible only in the case of an absolutely symmetric auroral emission from the two opposite hemispheres. This is realized if the auroral radio emission is radiated in directions exactly orthogonal to the local magnetic field vector orientation, both from the northern and southern side of the HR 5907 magnetosphere. This ideal condition takes place if the stellar magnetic field topology is a pure dipole, to satisfy the required symmetry between the two hemispheres of opposite magnetic orientation, and if the auroral radio emission does not suffer any ray path deflection.
As already discussed (Leto et al., 2016), the auroral radio emission gives rise to features that are strongly circularly polarized if the ECM ray path is not perfectly perpendicular to the local magnetic field vector orientation. This could be a consequence of the intrinsic nature of the elementary coherent emission mechanism, like the loss-cone driven ECM emission, that amplifies the radiation within a hollow cone with an aperture that is a function of the electron energy (Wu & Lee, 1979; Melrose & Dulk, 1982), or due to the presence of thermal plasma trapped inside the stellar magnetosphere that refracts the ECM rays traveling through (Trigilio et al., 2011), or both.
On the basis of the accepted scenario that describes the magnetosphere of the early-type magnetic stars, the inner-magnetosphere of such kind of stars is expected to be filled by thermal plasma. It is then plausible to expect that the plasma trapped within the inner magnetosphere of HR 5907 has refracting/absorbing effects on the auroral radiation traveling through it. In the case of HR 5907 further frequency dependent blocking effects could be due to the presence of the equatorial ring of cold and dense plasma that accumulates within the deep regions of its magnetosphere. As previously discussed (Sec. 7.1) such cold plasma has negligible effects to the simulated incoherent stellar radio emission, but in the case of the coherent auroral radio emission its effects are not negligible. The auroral radio emission at a given radio frequency, if present, originates from well defined auroral ring above the magnetic poles. Looking at Fig. 9 it is clear that the auroral radio emission from HR 5907 is not likely to be symmetric about the magnetic equator owing to path length and differential refractive effects. For the geometry of HR 5907, the ray path length within the magnetospheric plasma is longer for the auroral radiation arising from the northern hemisphere, as made clear in Fig. 9. This could give rise to refractive/absorbing effects for the component of the HR 5907 ECM emission, with consequent lost of symmetry with the component, that arises from the southern hemisphere.
In the case of HR 5907 there are also hints that its magnetic field topology is not a simple dipole (Grunhut et al., 2012a). This gives rise to asymmetric physical conditions between the two stellar hemispheres of opposite magnetic field orientation, that could significantly affect the elementary amplification mechanism responsible of the stellar auroral radio emission. As an example, in the case of CU Vir, the prototype of a star radiating auroral radio emission, the existence of a non-dipolar magnetic field topology (Kochukhov et al., 2014) has been ascribed to explain the detection of ECM emission from the northern hemisphere only (Trigilio et al., 2000, 2011).
7.3 The effects of a non-dipolar magnetic field on HR 5907’s radio emission
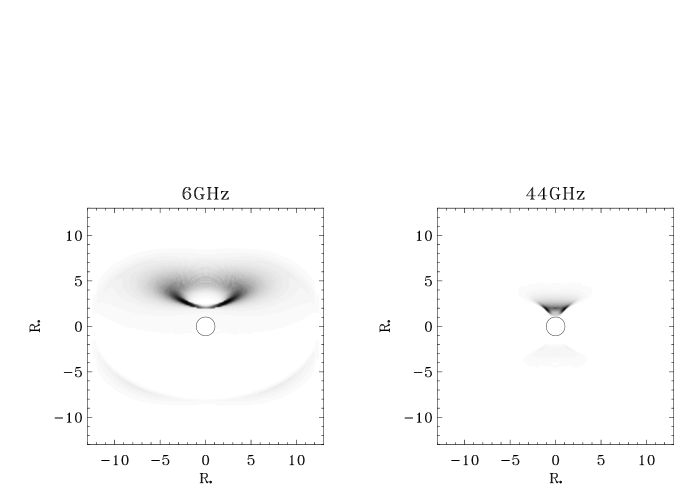
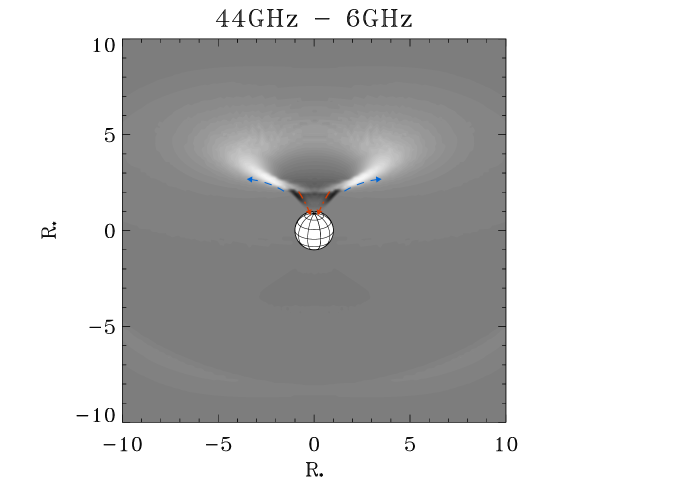
The gyro-synchrotron emission mechanism is strongly sensitive to the magnetic field strength, which varies with the distance from the star. Consequently, the radiation at a specific radio frequency band will be emitted mainly in a well localized region of the magnetosphere. The high-frequency radio emission originates close to the stellar surface, where the field strength is strong, while the lower frequencies probe regions farther out. To highlight the different spatial location of the magnetospheric region where the radio emission at a fixed frequency band originates, we generated synthetic radio maps of HR 5907 at the two extremes of the radio frequency range measured by the VLA, respectively 6 and 44 GHz. The HR 5907 orientation corresponds to the extremum of the effective magnetic field curve. The simulated maps at these two frequencies are pictured in the top panels of Fig. 10. The synthetic maps were created using our 3D model assuming a dipolar field topology. The parameters that define the stellar magnetic field are listed in Table 1; the adopted model parameters are listed in Table 5.
As is clear from Fig. 10, the 44 GHz emission originates close to the star, whereas the 6 GHz radio emission forms over a larger, more extended volume. This confirms how the gyro-synchrotron radio emission is able to probe the physical conditions of the stellar magnetosphere at different depths. To further highlight the different spatial locations of the regions where the 6 and 44 GHz radio emission originates, the difference map between the two synthetic maps is also shown in the bottom panel of Fig. 10. The 6 GHz emission arises from the large conical shaped region far from the star ( R∗ above the stellar surface), pictured in white, whereas the magnetospheric regions that mainly contributes to the 44 GHz radio emission are the two filamentary black regions close to the star, at about 1 R∗ above the stellar surface. The high-frequency radio emission is then strongly sensitive to the magnetospheric conditions close to the stellar surface, like the non-thermal electron density, the magnetic field strength, and its topology.
The radial dependence of the multi-polar magnetic field components are well known. In particular the magnetic field strength of a quadrupole decrease outward more steeply than a dipole, with versus . On the basis of the above relations, a quadrupole magnetic field mainly affects the field strength close to the stellar surface, whereas the layers far from the stellar surface are dominated by the simple dipole. The “hybrid” magnetic field topology is the vector sum of the dipole plus the quadrupole field. The spatial dependence of the hybrid magnetic field strength is then a function of the strength at the stellar surface of the two field components (dipole plus quadrupole), but is also a function of the orientation of the mutual magnetic moments.
In the case of a hybrid field topology, the radial dependence of the magnetic field strength could significantly differ from the case of a simple dipole. For a non-dipolar magnetic field topology, it is then plausible to expect that the non-thermal electrons moving toward the stellar surface could meet magnetospheric layers where the local magnetic field strength is higher than the value expected in the case of a simple dipole. As a consequence, the magnetospheric regions where the high order components of the magnetic field cannot be neglected will be a brighter source of incoherent gyro-synchrotron emission. This could qualitatively explain why the HR 5907 total intensity at 6 GHz is well reproduced by the simple dipolar model, whereas the highest radio frequencies are not reproduced (see top panels of Fig. 7).
To determine whether the presence of a multipolar magnetic field component can explain the HR 5907 flux level at GHz (higher than compared to the simulated ones), we performed new model simulations of the HR 5907 gyro-synchrotron emission increasing by 50% the strength of the magnetic dipole moment. Our model is not able to account for a complex magnetic field topology, but we followed this procedure to simulate the effect of the increased magnetic field strength in the magnetospheric layers where the radio emission at GHz originates. As a justification for a stronger magnetic field than the estimated one, we quote some papers that discuss the validity of the assumption that Stokes profiles are equal to the first derivative of Stokes profiles for fast rotators (Scalia et al., 2017; Leone et al., 2017), an hypothesis that is at the basis of the measurements of the longitudinal component of magnetic fields. Moreover, there are indication that chemical elements are not homogeneously distributed on the stellar surface (Grunhut et al., 2012a), a condition that gives rise to a series of considerations regarding the recovered magnetic field strength (Stift, Leone & Cowley, 2012; Stift & Leone, 2017a, b). At any rate, determination of the true magnetic field configuration of HR 5907 is beyond the scope of this paper. These new simulations are only an exercise to help us understand how the magnetic field influences the incoherent gyro-synchrotron emission from the stellar magnetosphere.
The new model simulations are compared with the observed average spectrum of HR 5907, Fig. 11 top panel. As a result of this exercise, we confirm that increasing the magnetic field strength enhances the radio emission. The simulations performed using the amplified magnetic field strength highlights that the gyro-synchrotron emission model is able to well reproduce the measured fluxes levels, at least up to 102 GHz (see top panel of Fig. 11). In fact, the simulated flux level at GHz is closer to the observed ones.
The shapes of the simulated light curves remain basically unchanged (flat light curves), like those pictured in the top panels of Fig. 7. This is a further hint that the magnetosphere of HR 5907 strongly deviates from the pure-dipolar topology in the layers close to the stellar surface. The large rotational modulation of the flux density observed at the high frequencies is a clear indication that, as the star rotates, the magnetosphere of HR 5907 unveils some anisotropic magnetic structures characterized by local enhancement of the magnetic field strength.
Even if the rotational modulation of the HR 5907 gyro-synchrotron emission at 102 and 292 GHz is basically unknown, the average fluxes measured at the two ALMA bands are displayed in the top panel of Fig. 11. The average simulated flux density at 102 GHz is about 150 mJy, higher but reasonably close to the average of the measured fluxes listed in Table 7 (115 mJy). The differences between the simulations and the observations become dramatic at 292 GHz. The average simulated emission at 292 GHz is about mJy, versus an observed average flux of 32.5 mJy.
The flux drop measured at 292 GHz could be related to the true density radial profile of the non-thermal electrons within the magnetospheric flux tubes where they freely propagate. In fact, the radiative and collisional loss effects could significantly affect the density of the non-thermal electrons very close to the stellar surface, where the emission at 292 GHz is expected to arise.
The puzzling nature of the HR 5907 radio emission is further complicated by the behavior of its circularly polarized emission, quantified by the Stokes parameter. As already discussed, the Stokes sign is correlated with the sign of the effective magnetic field, as an example positive Stokes is produced in regions with the magnetic field vector mainly oriented toward the observer (). The measured HR 5907 effective magnetic field is always negative (Grunhut et al., 2012a). The magnetic field vectors are then mainly oriented toward the star, thus the expected signs of the Stokes measurements will be negative. As already discussed in Sec. 4.3, the HR 5907 radio emission at GHz is anti-correlated with the sign of the effective magnetic field.
To try to explain the anomalous behavior of the HR 5907 circularly polarized radio emission, we have arbitrarily changed the magnetic field topology as a function of the height above the stellar surface. The regions where the radio emission in the range 6–22 GHz originates are assumed characterized by magnetic field vectors mainly oriented toward the observer, whereas the regions close to the star maintain the original orientations of the magnetic field vectors. The arrows superimposed on the difference map (spatial brightness distribution at 44 GHz minus brightness at 6 GHz, bottom panel of Fig. 10) are used to visualize such a complicated magnetic field topology. The vectors pictured by the dot dashed line (in red in the online color version of the Fig. 10) are oriented toward the stellar surface, and are in accordance with the effective magnetic field measurements (negative ), the vectors pictured using the dashed line have instead opposite orientations (in blue in the online color version of the Fig. 10).
New model simulations at , 10, 15 and 22 GHz have now been performed flipping the dipole axis orientation. The simulated total intensity and magnitude of the circularly polarized emission remain unchanged, whereas the sign of the simulated Stokes reverses. In this way, the overall behavior of the rotational modulation of the circularly polarized emission of HR 5907 is better reproduced by the simulations, see Fig. 12. The agreement between observations and simulations is also highlighted by comparing the average spectral dependence of the measured Stokes V emission with the observed ones, see bottom panel of Fig. 11. We want to remember that the assumed magnetic filed topology is purely empirical. This exercise was only used to obtain indirect indications regarding the true magnetic field topology of HR 5907, that is surely much more complex than a simple dipole. In fact, the model reproduces the overall Stokes reversal as a function of the frequency, but is not able to reproduce the detailed behavior observed at 33 and 44 GHz (see the two right panels of Fig. 12). In particular, a simple dipolar topology predicts the maximum fraction of the circularly polarized emission coinciding with the rotational phase where the maximum effective magnetic field reaches its maximum strength (), this is not evidenced by the 33 and 44 GHz measurements.
The model predictions at the ALMA bands have been also performed. These simulations extend the expected spectrum of the circularly polarized emission from HR 5907 close to the sub-millimeter wavelength range, Fig. 11 bottom panel. The simulated circularly polarized emission at the two ALMA frequencies is about 10% at 102 GHz and 20% at 292 GHz. But no comparison with the observations can be done due to the missing information of the measured fraction of the circularly polarized emission.
8 Summary and Conclusions
The radio emission of the early B-type magnetic star HR 5907 measured at many frequencies, from 6 up to 292 GHz, combined with X-ray spectroscopy provides us with the opportunity to probe the physical conditions of its magnetosphere.
The fluxes at the frequencies from 6 to 44 GHz were measured by the VLA interferometer. These radio observations cover a large fraction of the stellar rotational phases, showing that the gyro-synchrotron radio emission of HR 5907 is strongly variable as a consequence of the stellar rotation, in accordance with a RRM shaped like an Oblique Rotator. This is the accepted scenario that well explains the rotational modulation of the radio emission observed in many hot magnetic stars.
In this paper we report the first measurements of HR 5907 with the millimeter/submillimeter ALMA interferometer. ALMA clearly detected HR 5907 at 102 and 292 GHz, allowing to constrain the source spectrum up to the boundary of the sub-millimeter wavelength range. The gyro-synchrotron emission mechanism is strongly sensitive to the magnetic field strength and orientation. Consequently, the radiation within a specific radio frequency band is emitted mainly in a well-localized layer of the magnetosphere. Higher frequency emissions are generated close to the stellar surface, where the field strength is higher, whereas lower frequencies probe regions farther out.
The behavior of the gyro-synchrotron emission at the millimeter and sub-millimeter spectral range is poorly studied for this kind of star. The detection of HR 5907 at the millimeter wavelengths indicates that in this star the population of non-thermal electrons, that radiate for gyro-synchrotron emission mechanism, efficiently penetrates to the magnetospheric layers very close to the stellar surface.
The radio/millimeter observations of HR 5907 were complemented by the X-ray spectroscopy. The Chandra ACIS-S spectrum of HR 5907 was well fitted by a spectral model that combined a thermal and non-thermal components. Following the MCWS model, the thermal component originates from plasma heated up to 10 MK. On the other hand, the non thermal emission component is best explained as auroral X-ray emission induced by the non-thermal electrons that impact with the stellar surface close to the polar caps.
We have previously realized a 3D model able to simulate the gyro-synchrotron radiation arising from the RRM of the hot magnetic stars. The physical parameters derived from the X-ray spectrum fitting have been used to constrain the model free parameters needed to simulate the non-thermal radio emission of HR 5907. However, we were not able to successfully reproduce all the features observed at the radio/millimeter wavelengths.
To explain the disagreement between observations and simulation we considered the presence of an equatorial ring of dense and cold plasma within the magnetosphere of HR 5907. We concluded that for the geometry of HR 5907 this ring has no effect on the radio emission propagation. We also analyzed the case of a possible contribution to the radio emission of HR 5907 of the coherent auroral radio emission. This hypothesis has also been discarded.
Then we performed a semi-quantitative analysis on the effects of a magnetic field topology more complex than a simple dipole to the radio emission from the HR 5907 magnetosphere. This analysis highlights that the magnetic field has a key role in explaining the observed features at the radio wavelengths. Even if we are not able to quantify the true topology and strength of the HR 5907 magnetic field, we provide an indirect confirmation of the suggested existence of a multipolar magnetic field component (Grunhut et al., 2012a).
We point out that the radio emission from the hot magnetic stars studied so far are seen to be time stable, indicating that the physical mechanisms causing them are in steady state, making these magnetospheres ideal laboratories for the study of the plasma processes responsible for the phenomena detected from the radio to the X-rays. These phenomena have also been detected in the magnetospheres of totally different objects, such as the magnetized planets of the solar system and the brown dwarfs. From this point of view the measurements of the millimeter and sub-millimeter light curves of the hot magnetic stars provide strong constraints on the physical conditions in the deep magnetospheric layers, where the auroral X-ray emission also originates.
Acknowledgments
We thank the referee for their very constructive comments that helped to improve the paper. LMO acknowledges support by the DLR grant 50 OR 1508. The National Radio Astronomy Observatory is a facility of the National Science Foundation operated under cooperative agreement by Associated Universities, Inc. This work has extensively used the NASA’s Astrophysics Data System, and the SIMBAD database, operated at CDS, Strasbourg, France. Part of the scientific results reported in this article are based on data obtained from the Chandra Data Archive. This paper makes use of the following ALMA data: ADS/JAO.ALMA#2011.0.00001.CAL. ALMA is a partnership of ESO (representing its member states), NSF (USA) and NINS (Japan), together with NRC (Canada), MOST and ASIAA (Taiwan), and KASI (Republic of Korea), in cooperation with the Republic of Chile. The Joint ALMA Observatory is operated by ESO, AUI/NRAO and NAOJ.
Appendix A List of the radio measurements
The radio measurements of HR 5907 presented in this paper are listed in Table 6, column 3 total intensity (Stokes ) and column 4 circularly polarized intensity (Stokes ), with the corresponding uncertainty. The average HJD of each observing scan (column 1) and the corresponding rotational phase (column 2) have been also reported. The millimeter measurements performed with the ALMA interferometer are listed in Table 7. The phases of the periodic variability are computed according to the ephemeris given by Eq. 1.
| HJD | S | SV | |
|---|---|---|---|
| 2457000+ | (mJy) | (mJy) | |
| GHz | |||
| 90.8973 | 0.5510 | 88 () | 1.5 () |
| 90.9382 | 0.6317 | 74.6 () | 1.9 () |
| 90.9746 | 0.7032 | 63.6 () | 0.50 () |
| 91.0110 | 0.7748 | 56.6 () | 0.16 () |
| 91.0235 | 0.7993 | 55.0 () | 0.00 () |
| 97.9175 | 0.3628 | 80 () | 1.0 () |
| 97.9578 | 0.4421 | 83.1 () | 1.2 () |
| 97.9941 | 0.5136 | 86 () | 1.4 () |
| 98.0305 | 0.5852 | 86 () | 1.8 () |
| 98.0426 | 0.6090 | 84 () | 2.8 () |
| GHz | |||
| 90.9017 | 0.5598 | 121 () | 1.8 () |
| 90.9423 | 0.6397 | 101 () | 1.0 () |
| 90.9787 | 0.7113 | 87 () | () |
| 91.0151 | 0.7829 | 77 () | () |
| 91.0279 | 0.8081 | 78 () | () |
| 97.9216 | 0.3709 | 104 () | 0.5 () |
| 97.9619 | 0.4502 | 110 () | 1.2 () |
| 97.9982 | 0.5217 | 119 () | 2.5 () |
| 98.0346 | 0.5932 | 120 () | 2.3 () |
| 98.0467 | 0.6171 | 117 () | 1.7 () |
| GHz | |||
| 90.9060 | 0.5682 | 133 () | () |
| 90.9341 | 0.6236 | 122 () | () |
| 90.9705 | 0.6952 | 95 () | 0.26 () |
| 91.0069 | 0.7667 | 79 () | 1.1 () |
| 91.0192 | 0.7909 | 72 () | 1.6 () |
| 97.9255 | 0.3786 | 107 () | 2.3 () |
| 97.9527 | 0.4340 | 114 () | 1.9 () |
| 97.9900 | 0.5056 | 135 () | 0.9 () |
| 98.0264 | 0.5771 | 143 () | 0.40 () |
| 98.0387 | 0.6013 | 132 () | () |
| GHz | |||
| 90.9290 | 0.6136 | 149 () | 0.8 () |
| 90.9654 | 0.6851 | 101 () | () |
| 91.0018 | 0.7567 | 78 () | () |
| 97.9486 | 0.4240 | 120 () | () |
| 97.9849 | 0.4955 | 141 () | 0.9 () |
| 98.0213 | 0.5670 | 162 () | 3.8 () |
| GHz | |||
| 90.9228 | 0.6013 | 160 () | () |
| 90.9592 | 0.6729 | 112 () | () |
| 90.9955 | 0.7444 | 97 () | () |
| 97.9423 | 0.4117 | 103 () | () |
| 97.9787 | 0.4832 | 130 () | () |
| 98.0150 | 0.5548 | 160 () | () |
| GHz | |||
| 90.9153 | 0.5865 | 165 () | () |
| 90.9516 | 0.6580 | 110 () | () |
| 90.9880 | 0.7296 | 75 () | () |
| 97.9348 | 0.3969 | 60 () | () |
| 97.9711 | 0.4684 | 110 () | () |
| 98.0075 | 0.5400 | 140 () | () |
| HJD | S | HJD | S | ||
| 2457000+ | (mJy) | 2457000+ | (mJy) | ||
| mm ( GHz) | mm ( GHz) | ||||
| 237.3487 | 0.6847 | 128 () | 237.3491 | 0.6854 | 32 () |
| 237.3756 | 0.7377 | 102 () | 237.3752 | 0.7369 | 33 () |
Appendix B Radio and X-ray emission from the early-type magnetic stars
The scenario able to explain the radio and the X-ray emission from a dipolar shaped magnetosphere of a typical hot magnetic star is pictured in Fig. 13. The wind plasma streams, arising from the two opposite hemispheres, move along the dipolar magnetic field lines and collide at the magnetic equator. This gives rise to a shock that heats the plasma, making this hot plasma able to radiate thermal X-rays (pictured in Fig. 13 by using the dark gray area close to the magnetic equatorial plane). At the higher magnetic latitudes, the wind plasma accumulates remaining trapped within the inner magnetospheres (the light gray area in Fig. 13). At the distance equal to the Alfvén radius () the magnetic field strength is not able to confine this thermal plasma and the co-rotation breakdown takes place. The equatorial regions outside the Alfvén surface are site of magnetic reconnection events, with consequents generation of fast electrons. These non-thermal electrons freely propagate toward the star radiating at the radio wavelengths by incoherent gyro-synchrotron emission mechanism. The dipolar cavity where the radio emission originates is named middle magnetosphere. The fast electrons streams that collide with the stellar surface radiate non-thermal X-rays by thick-target bremsstrahlung emission. The non-thermal electron population outward reflected could then develop the unstable loss-cone energy distribution. These electrons are then responsible of the highly beamed stellar auroral radio emission due to the coherent electron cyclotron maser emission mechanism.
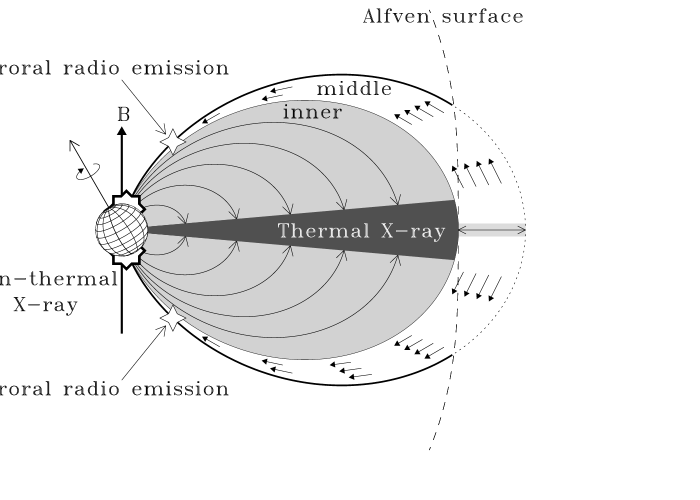
References
- ALMA Partnership (2015) ALMA Partnership, Fomalont E.B., et al., 2015, ApJ, 808L, 1
- Arnaud (1996) Arnaud K.A., 1996, ASPC, 101, 17
- Asplund et al. (2009) Asplund M., Grevesse N., Sauval A.J., Scott P., 2009, ARA&A, 47, 481
- Babcock (1949) Babcock H.W., 1949, Observatory, 69, 191
- Babel & Montmerle (1997) Babel J., Montmerle T., 1997, A&A, 323, 121
- Bailey et al. (2012) Bailey J.D. et al., 2012, MNRAS, 423, 328
- Bard & Townsend (2016) Bard C., Townsend R.H.D., 2016, MNRAS, 462, 3672
- Barnali et al. (2018) Barnali D., Chandra P., Wade G.A., 2018, MNRAS, 474, L61
- Benz & Guëdel (1994) Benz A.O., Guëdel M., 1994, A&A, 285, 621
- Bohlender & Monin (2011) Bohlender D.A., Monin D., 2011, AJ, 141, 169
- Branduardi-Raymont et al. (2007) Branduardi-Raymont G. et al., 2007, A&A, 463, 761
- Branduardi-Raymont et al. (2008) Branduardi-Raymont G., Elsner R.F., Galand M., Grodent D., Cravens T.E., Ford P., Gladstone G.R., Waite J.H., 2008, J. Geophys. Res., 113, A2202
- Brown (1971) Brown J.C., 1971, Sol. Phys, 18, 489
- Castor et al. (1975) Castor J.I., Abbott D.C., Klein R.I., 1975, ApJ, 195, 157
- Chandra et al. (2015) Chandra P. et al., 2015, MNRAS, 452, 1245
- Condon et al. (1998) Condon J.J, Cotton W.D., Greisen E.W., Yin Q.F., Perley R.A., Taylor G.B., Broderick J.J., 1998, AJ, 115, 1693
- Donati et al. (1997) Donati J.-F., Semel M., Carter B.D., Rees D.E., Collier Cameron A., 1997, MNRAS, 291, 658
- Drake et al. (1987) Drake S.A., Abbot D.C., Bastian T.S., Bieging J.H., Churchwell E., Dulk G., Linsky J.L, 1987, ApJ, 322, 902
- Dulk & Marsh (1982) Dulk G.A., Marsh K.A., 1982, ApJ, 259, 350
- Dulk (1985) Dulk G.A., 1985, ARA&A, 23, 169
- Eikenberry et al. (2014) Eikenberry S.S. et al., 2014, ApJ, 784, L30
- Fossati et al. (2015) Fossati L., et al., 2015, A&A, 582, 45
- Groote & Hunger (1997) Groote D., Hunger K., 1997, A&A, 319, 250
- Grunhut et al. (2012a) Grunhut J.H. et al. 2012a, MNRAS, 419, 1610
- Grunhut et al. (2012b) Grunhut J.H., Wade G.A., and the MiMeS Collaboration, 2012b, ASPC, 465, 42
- Guëdel & Benz (1993) Guëdel M., Benz A.O., 1993, ApJ, 405, L63
- Hallinan et al. (2007) Hallinan G. et al., 2007, ApJ, 663, L25
- Hoffleit & Jaschek (1991) Hoffleit D., Jaschek C., 1991, The Bright Star Catalogue (New Haven, CT: Yale Univ. Observatory)
- Hubrig et al. (2015) Hubrig S., et al., 2015, A&A, 578, L3
- Hubrig et al. (2017) Hubrig S., Kholtygin A.F., Schöller M., Ilyin I., 2017, MNRAS, 467, L81
- Klein & Trotter (1984) Klein K.L., Trotter G., 1984, A&A, 141, 67
- Klein (1987) Klein K.L., 1987, A&A, 183, 341
- Kochukhov et al. (2014) Kochukhov O., Lülftinger T., Neiner C., Alecian E., and the MiMeS collaboration, 2014, A&A, 565, 83
- Leone (1991) Leone F., 1991, A&A, 252, 198
- Leone & Umana (1993) Leone F., Umana G., 1993, A&A, 268, 667
- Leone (1993) Leone F., 1993, A&A, 273, 509
- Leone et al. (1994) Leone F., Trigilio C., Umana G., 1994, A&A, 283, 908
- Leone et al. (2004) Leone F., Trigilio C., Neri R., Umana G., 2004, A&A, 423, 10
- Leone et al. (2010) Leone F., Bohlender D.A., Bolton C.T., Buemi G., Catanzaro G., Hill G.M., Stift M.J., 2010, MNRAS, 401, 2739
- Leone et al. (2017) Leone F., Scalia C., Gangi M., Giarrusso M., Munari M., Scuderi S., Trigilio C., Stift M.J., 2017, ApJ, 848, 107
- Leto et al. (2006) Leto P., Trigilio C., Buemi C.S., Umana G., Leone F., 2006, A&A, 458, 831
- Leto et al. (2012) Leto P., Trigilio C., Buemi C.S., Leone F., Umana G., 2012, MNRAS, 423, 1766
- Leto et al. (2016) Leto P., Trigilio C., Buemi C.S., Umana G., Ingallinera A., Cerrigone L., 2016, MNRAS, 459, 1159
- Leto et al. (2017a) Leto P. et al., 2017a, MNRAS, 467, 2820
- Leto et al. (2017b) Leto P., Trigilio C., Buemi C.S., Umana G., Ingallinera A., Cerrigone L., 2017b, MNRAS, 469, 1949
- Linsky, Drake & Bastian (1992) Linsky J.L., Drake S.A., Bastian S.A., 1992, ApJ, 393, 341
- Lo et al. (2012) Lo K.K. et al., 2012, MNRAS, 421, 3316
- Louarn & Le Queau (1996a) Louarn P., Le Queau D., 1996a, P&SS, 44, 199
- Louarn & Le Queau (1996b) Louarn P., Le Queau D., 1996b, P&SS, 44, 211
- Lucy & Solomon (1970) Lucy L.B., Solomon P.M., 1970, ApJ, 159, 879
- Maheswaran & Cassinelli (2009) Maheswaran M., Cassinelli J.P., 2009, MNRAS, 394, 415
- Melrose & Dulk (1982) Melrose D.B., Dulk G.A., 1982, ApJ, 259, 844
- Menietti et al. (2011) Menietti J.D., Mutel R.L., Christopher I.W., Hutchinson K.A., Sigwarth J.B, 2011, J. Geophys. Res., 116, A12219
- Morel et al. (2014) Morel T. et al., 2014, The Messenger, 157, 27
- Morel et al. (2015) Morel T. et al., 2015, IAUS, 307, 342
- Murphy et al. (2010) Murphy T. et al., 2010, MNRAS, 402, 2403
- Mutel et al. (2008) Mutel R.L., Christopher I.W., Pickett J.S., 2008, GeoRL, 35, L07104.
- Nazé et al. (2014) Nazé Y., Petit V., Rinbrand M., Cohen D., Owocki S., ud-Doula A., Wade G.A., 2014, ApJS, 215, 10
- Oksala et al. (2012) Oksala M.E., et al., 2012, MNRAS, 419, 959
- Oksala et al. (2015) Oksala M.E., et al., 2015, MNRAS, 451, 2015
- Oskinova et al. (2011) Oskinova L.M., Todt H., Ignace R., Brown C.J., Cassinelli J.P., Hamann W.-R., 2011, MNRAS, 416, 1456
- Petit et al. (2013) Petit V. et al., 2013, MNRAS, 429, 398
- Petrov et al. (2012) Petrov L. et al., 2012, AJ, 144, 150
- Prinja (1989) Prinja K.P., 1989, MNRAS, 241, 721
- Ramaty (1969) Ramaty R., 1969, ApJ, 158, 75
- Ravi et al. (2010) Ravi V. et al., 2010, MNRAS, 408, L99
- Rivinius et al. (2013) Rivinius Th., Townsend R.H.D., Kochukhov O., Štefl S., Baade D., Barrera L., Szeifert Th., 2013, MNRAS, 429, 177
- Scalia et al. (2017) Scalia C., Leone F., Gangi M., Giarrusso M., Stift M.J., 2017, MNRAS, 472, 3554
- Shore (1987) Shore S.N., 1987, AJ, 94, 73
- Shore et al. (1987) Shore S.N., Brown D.N., Sonneborn G., 1987, AJ, 94, 737
- Shore & Brown (1990) Shore S.N., Brown D.N., 1990, ApJ, 365, 665
- Sikora et al. (2015) Sikora J. et al., 2015, MNRAS, 451, 1928
- Sikora et al. (2016) Sikora J. et al., 2016, MNRAS, 460, 1811
- Stibbs (1950) Stibbs D.W.N., 1950, MNRAS, 110, 395
- Stift et al. (2012) Stift M.J., Leone F., Cowley C.R., 2012, MNRAS, 419, 2912
- Stift & Leone (2017a) Stift M.J., Leone F., 2017a, MNRAS, 465, 2880
- Stift & Leone (2017b) Stift M.J., Leone F., 2017b, ApJ, 834, 24
- Townsend & Owocki (2005) Townsend R.H.D., Owocki S.P., 2005, MNRAS, 357, 251
- Townsend, Owocki & Groote (2005) Townsend R.H.D., Owocki S.P., Groote D., 2005, ApJ, 630, 81
- Townsend, Owocki & ud-Doula (2007) Townsend R.H.D., Owocki S.P., ud-Doula A., 2007, MNRAS, 382, 139
- Trigilio et al. (2000) Trigilio C., Leto P., Leone F., Umana G., Buemi C., 2000, A&A, 362, 281
- Trigilio et al. (2004) Trigilio C., Leto P., Umana G., Leone F., Buemi C.S., 2004, A&A, 418, 593
- Trigilio et al. (2008) Trigilio C., Leto P., Umana G., Buemi C.S., Leone F., 2008, MNRAS, 384, 1437
- Trigilio et al. (2011) Trigilio C., Leto P., Umana G., Buemi C.S., Leone F., 2011, ApJ, 739, L10
- ud-Doula, Townsend & Owocki (2006) ud-Doula A., Townsend R., Owocki S., 2006, ApJ, 640, L191
- ud-Doula, Owocki & Townsend (2008) ud-Doula A., Owocki S., Townsend R., 2008, MNRAS, 385, 97
- ud-Doula et al. (2014) ud-Doula A. Owocki S., Townsend R., Petit V., Cohen D., 2014, MNRAS, 441, 3600
- ud-Doula & Nazé (2016) ud-Doula A., Nazé Y., 2016, AdSpR, 58, 680
- van Leeuwen (2007) van Leeuwen F., 2007, A&A, 474, 653
- Wade et al. (2016) Wade G.A. et al., 2016, MNRAS, 456, 2
- Wade et al. (2017) Wade G.A., Shultz M., Sikora J., Bernier M.-É., Rivinius Th., Alecian E., Petit V., Grunhut J.H., 2017, MNRAS, 465, 2517
- Walborn (1974) Walborn, N.R., 1974, ApJ, 191, L95
- Winglee & Pritchett (1986) Winglee R.M., Pritchett P.L., 1986, J. Geophys. Res., 91, 13531
- Wisniewski et al. (2015) Wisniewski J.P. et al., 2015, ApJ, 811, L26
- Wu & Lee (1979) Wu C.S., Lee L.C., 1979, ApJ, 230, 621