Quantum ferroelectric instabilities in superconducting SrTiO3
Abstract
We examine the effects of strain and cation substitution on the superconducting phase of polar semiconductors near a ferroelectric quantum phase transition with a model that combines a strong coupling theory of superconductors with a standard microscopic framework for displacive polar modes coupled to strain degrees of freedom. Our calculations reveal that the superconducting transition temperature is enhanced by proximity to the ferroelectric instability from the disordered side, while it is generally suppressed in the ordered phase due to its increase in dielectric stiffness and a reduction of critical fluctuations from dipolar induced anisotropies. The condensation of the pairing phonon excitations generates a kink in at a charge density that is generally lower than that of the quantum critical point (QCP) and where both superconducting and ferroelectric orders set in. We apply our model to SrTiO3 and find that the antiadiabatic limit places the kink nearly at its QCP. As the QCP is pushed to higher charge densities with either tuning parameter, we find that the dome narrows and sharpens. Our model is in qualitative and fair quantitative agreement with the recent observation of overlapping ferroelectric-like and superconducting instabilities in n-doped Sr1-xCaxTiO3 and strain tuning of in n-doped SrTiO3. We compare our results to previous models invoking order-disorder lattice dynamics to describe the pairing excitations.
I Introduction
Strontium titanate (STO) is the first superconducting (SC) oxide to be discovered more than half a century ago Schooley et al. (1964). Upon doping, it exhibits dome-shaped superconductivity Schooley et al. (1965); Koonce et al. (1967); Binnig et al. (1980); Suzuki et al. (1996) similar to the well-known cuprates at unusually low charge carrier concentrations (cm-3) Eagles (1986); Eagles et al. (1989); Tainsh and Andrikidis (1986); Eagles (2016), dubbing STO as “the most dilute superconductor” Lin et al. (2013). Since its observation, the origin of the pairing mechanism between its charge carriers has posed a long-standing problem in condensed matter physics, as the conventional Bardeen-Cooper-Schrieffer theory of superconductors requires the so-called adiabatic limit of electron-phonon coupling in which the characteristic energy scale of the charge carriers (the Fermi temperature ) is much larger than that of the phonons (the Debye temperature ) Carbotte (1990). STO is unusual in that it is outside this limit as K Lin et al. (2013) and K Burns (1980). Though several models have been put forward Gor’kov (2016); Ruhman and Lee (2016); Takada (1980); Edelman and Littlewood (2017), and experiments have constrained possible pairing mechanisms between its charge carriers Swartz et al. (2018), there is still no consensus on a theory of superconductivity in dilute polar semiconductors such as doped STO Collignon et al. (2018).
Somewhat recently, Rowley et al. Rowley et al. (2014) have suggested a connection between quantum criticality and superconductivity in STO, and Edge et al. Edge et al. (2015) have put forward a concrete model. Within this framework, a QCP that separates competing ferroelectric (FE) and paraelectric (PE) ground states generates highly collective low energy phonon excitations which induce an instability in the metallic phase and pair the charge carriers to form Cooper pairs. A dome arises because the quantum FE fluctuations pair up the charge carriers at low doping levels, though there are not enough of them to provide a robust superconductivity. As the density increases, so does until the fluctuations become ineffective at pairing due to screening by the carriers themselves. Though STO is not within the adiabatic limit, the model provides a good description of its SC dome, and it has received recent experimental support Rischau et al. (2017); Stucky et al. (2016); Herrera et al. (2018).
In conventional FEs, the relevant low energy lattice excitations are zone-center transverse optic (TO) phonons which break spatial inversion symmetry and trigger a phase with a spontaneous, reversible polarization upon condensation. In pure STO, such a transition is aborted by quantum fluctuations of the polarization order parameter Müller and Burkard (1979) and, instead, incipient FE behavior is observed in which the dielectric constant grows enormously () and the phonon frequencies soften down to lowest observed temperatures without condensing Yamada and Shirane (1969). Long-range FE order has been induced by tensile stress Uwe and Sakudo (1976), oxygen isotope exchange Itoh et al. (1999), or cation substitution Bednorz and Müller (1984). At the QCP, the phonon excitations become gapless, and at finite temperatures above it but well below Chandra et al. (2017), quantum criticality sets in generating unusual behavior, such as a dependence in the dielectric susceptibility distinct from that of the neighboring PE and FE phases Rowley et al. (2014).
To model the pairing excitations between carriers, one-dimensional transverse Ising models with short-range interactions have been invoked and solved within a mean field approximation Edge et al. (2015); Kedem et al. (2016); Dunnett et al. (2018a). However, the soft collective vibrational excitations described by such models are not normal modes of the lattice but rather unstable pseudospin waves with relaxational dynamics, which are typical of order-disorder (OD) FEs such as potassium dihydrogen phosphate (KH2PO4) Lines and Glass (2001). STO, on the other hand, is a perovskite with a low temperature tetragonal PE phase which exhibits displacive behavior with a resonant soft TO mode that fully accounts for the dielectric constant and remains undamped down to the lowest observed temperatures Rowley et al. (2014); Yamada and Shirane (1969); Inoue (1983), even when the lattice instability is approached by oxygen isotope substitution where it has been suggested that the effects of an OD component may become important Blinc et al. (2005); Takesada et al. (2006); *Taniguchi2007a; *Yagi2009a. Moreover, FE transitions in perovskites are generally understood as resulting from the competition between a PE state favored by short-range repulsive forces and a FE phase favored by long-ranged and anisotropic dipole interactions that arise from their mixed covalent-ionic bonding character. Rabe et al. (2007) The aim of this paper is to describe the SC phase that emerges from a pairing excitation that corresponds to a displacive soft TO phonon.
We use a self-consistent phonon approximation (SCPA) to study the quantum statistical mechanics of our model Hamiltonian which includes local thermal and quantum fluctuations of the order parameter. This allows us to self-consistently calculate the doping and strain dependence of , as well the FE transition temperature , phonon energies and polarization order parameter. We neglect the effects of band narrowing due to polaron formation, which could have strong effects on the correlations Gabay and Triscone (2017); *Wang2016a; *Marel2011a; *Devreese2010a; *Meevasana2010a; *Mechelen2008a.
We find that proximity to the QCP favors superconductivity from the PE side, but decreases on the ordered side due to a reduction of the critical fluctuations from dipolar induced anisotropies and the dielectric stiffening by the spontaneous polarization. This generates a kink in the SC dome at a characteristic charge density that is generally lower than that of the QCP and where the SC and FE orders set in. As the QCP is pushed to higher charge densities with cation substitution or tensile strain so the FE phase increasingly overlaps with the SC phase, the dome narrows and sharpens. Though we do not make any a-priori assumptions that the pairing fluctuations are quantum critical, we find that the antiadiabatic limit places the kink nearly at the QCP and within the QC region. While our results are in qualitative agreement with the essentials of the OD models, there are significant qualitative differences. Though our model produces a dome which is narrower than the observed one, its phase diagram is in overall agreement with recent experiments in n-doped Sr1-xCaxTiO3 (STO:Ca-) Rischau et al. (2017) and the observed strain tuning of in n-doped STO Rowley et al. (2018); Pfeiffer and Schooley (1970); Herrera et al. (2018)
II Model
Following Ref. [Edge et al., 2015], our starting point is the McMillian formula McMillan (1968) for the SC coupling constant,
where is the electron-phonon coupling, , is the spectral density at frequency , and is the phonon energy at wave vector . Generally, it is not expected that charge carriers couple to long-wavelength TO phonons. Giustino (2017) For perovskite lattices such as that of STO, this is indeed the case but only when is along a principal axis. Away from such special directions, coupling occurs due to cubic anisotropy. Wölfle and Balatsky (2018) While such finite coupling still depends on , we make the simplifying assumption that is independent of it. Thus,
| (1) |
where the sum over runs over the entire Brillouin zone. We note that despite this assumption does not diverge: The largest contributions occur at the FE transition where the TO phonons become gapless and have a dispersion [see Eq.(5b) below]. By taking the continuum limit of Eq. (1) over a sphere of wave vector cutoff radius , we find that .
is calculated from the strong-coupling theory, Edge et al. (2015)
| (2) |
where is the electron density of states near the Fermi level , and .
We now need a model for the phonon excitations. We consider a standard model Hamiltonian for displacive FEs with normal mode coordinates that describe local displacements in the unit cell that are associated with the soft TO mode, the condensation of which is driven by the dipolar force and leads to the FE transition Lines and Glass (2001). We also consider elastic strains coupled to the displacements . We write the components of the strain tensor in the usual Voigt notation: , , , , and .
The Hamiltonian is as follows Pytte (1972),
| (3) |
where,
| (4a) | ||||
| (4b) | ||||
| (4c) | ||||
Here, is the conjugate momentum of , and () is the dipolar interaction tensor with Fourier transform where and and are constants that depend on the lattice structure Aharony and Fisher (1973). is the lattice stiffness; and are coefficients of the isotropic and anisotropic cubic anharmonicities, respectively. and are coupling constants between the polar and strain degrees of freedom; () is the elastic constant tensor in the cubic phase, and is a hydrostatic pressure, both in units of energy (the usual elastic constants and homogeneous stresses are given by and where Å is the lattice constant of the cubic structure). We consider fictitious negative hydrostatic pressures as a simple way to model the effects of tensile strain on the superconducting dome. Tensile strains are of course the experimentally relevant cases Uwe and Sakudo (1976). We study the quantum statistical mechanics of the Hamiltonian (3) within SCPA Pytte (1972). We consider the PE and FE phases separately.
II.1 PE phase
For simplicity, we will assume that the PE phase is cubic. Above , there is therefore a doubly degenerate TO phonon and a singlet longitudinal optic (LO) mode with isotropic dispersions Arce-Gamboa and Guzmán-Verri (2017),
| (5a) | ||||
| (5b) | ||||
where is the TO mode at the zone center. As expected Strukov and Levanyuk (1998), the effect of the dipole force is to lift the triply degenerate mode of the cubic phase by gapping out the LO phonons.
Within SCPA, is given as follows Pytte (1972),
| (6) |
where , is the frequency of a purely harmonic model and is the largest Fourier component of the dipole interaction; are local fluctuations of polarization with and is the volume strain. denotes thermal average.
According to Eqs. (1) and (5), we therefore have,
| (7) |
Note that the largest contributions to come from the critical mode , as is gapped out by the large depolarizing field.
We now parametrize the model parameters in order to describe the effects of doping and cation substitution on the phonon excitations. In the OD models Edge et al. (2015); Kedem et al. (2016); Dunnett et al. (2018a), the quantum tunneling energy between FE ground states with opposite polarization is chosen for such parametrization, as the effects of quantum fluctuations become important when is comparable to the well-depth between such states. For displacive models, however, quantum fluctuations must be comparable to the structural differences between competing PE and FE ground states and generate zero-point energies comparable to the classical energy reduction Zhong and Vanderbilt (1996). We therefore choose to parametrize such energy barrier, which in our model is proportional to at K. For simplicity, we keep fixed and assume that all changes occur in as follows,
| (8) |
where are model parameters that will be fitted to experiments. is the Ca concentration above which STO:Ca- enters a glassy phase which we do not aim to describe here Bednorz and Müller (1984). This parametrization is constructed based on (i) the observation that doping destabilizes the FE phase Rischau et al. (2017); Edge et al. (2015) while cation substitution stabilizes it; and (ii) the restriction that our model should generate simultaneous physically reasonable values for and as well as in the relevant doping range. We will show below that Eq. (8) accomplishes this at the expense of narrowing the SC dome compared to the observed one. We have attempted to use the polynomial parametrization of the OD models, and while we can find a set of model parameters that fit the observed SC dome, we could not obtain physical values for and . Clearly, this highlights the need for a theory to model these effects Wölfle and Balatsky (2018).
II.2 FE phase
The observed FE order in STO:Ca has orthorhombic symmetry Bednorz and Müller (1984). Such states, however, appear as saddle points in the free energy of the the Hamiltonian (3) Cowley (1980). Thus, we will assume that the FE ground state has a noncentrosymmetric tetragonal symmetry with an order parameter along the saxis. Below , the LO frequency becomes anisotropic, while the degenerate PE TO phonon gives rise to two distinct modes,
| (9a) | ||||
| (9b) | ||||
| (9c) | ||||
where . , and are zone-center TO phonons for given as follows Pytte (1972),
| (10a) | ||||
| (10b) | ||||
| (10c) | ||||
are local fluctuations of polarization with , , and are volume and deviatoric strains, respectively. Equation (9) shows that the phase volume of critical fluctuations in the FE phase is reduced by the dipolar force.
According to Eq. (1), we therefore have,
| (11) |
Similarly to the PE phase, the critical isotropic TO phonons make the largest contributions to .
III Results and Discussion
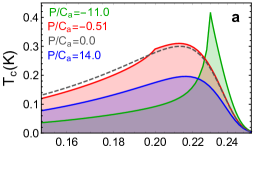
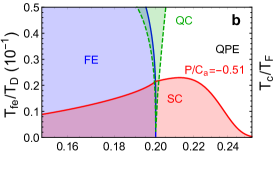
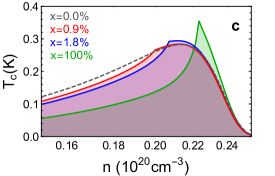
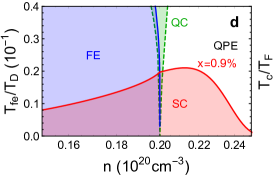
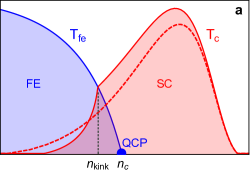
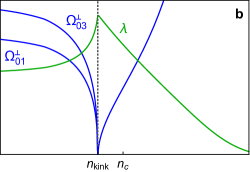
Figure 1 (a) shows a schematic phase diagram calculated from our model. In the absence of strain or cation substitution, the pairing excitations are PE at all charge densities and we find a dome-shaped similar to the OD models. When long-range polar order is induced by either tuning parameter, we find that it coexists with superconductivity up to a charge density where the FE phase is terminated at the QCP. is enhanced on the PE side whereas it quickly decreases on the FE phase. A kink appears at a charge density , where . Figure 1 (b) shows this is where the TO phonon condenses, which maximizes the coupling constant, as as it is shown by the sharp peak in .
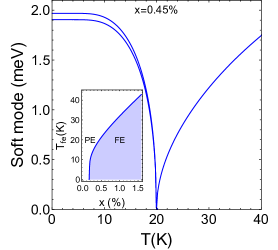
We now apply our model to n-doped STO:Ca. The model parameters are obtained by fitting to the observed phonon frequencies Rischau et al. (2017); Samara (1971); Yamada and Shirane (1969), FE phase diagram, Bednorz and Müller (1984) and Debye temperature Burns (1980) of STO:Ca without doping. The elastic constants were taken from Ref. [Carpenter, 2007]. As it is usual, we take the continuum limit and replace the summations in Eqs. (7) and (11) by integrals over a sphere of wave-vector cutoff radius Arce-Gamboa and Guzmán-Verri (2017). Typical results are shown in Fig. 2 and reproduce well the observed behavior. The parameters , and are chosen to match the observed QCP in n-doped STO:Ca- at cm-3 Rischau et al. (2017) and the maximum (K) for n-doped STO at ambient pressure Koonce et al. (1967). The values are the following: meV, meV3, meV3, meV Å-1, meV, meV , , , meV1/4, meV2, meV2, meV meV.
We first discuss our results for applied hydrostatic pressures. Figure 3 (a) shows the calculated SC domes for several positive and negative pressures. At zero pressure, there is a SC dome shown by the dashed line. Hydrostatic compression pushes the system away from the QCP by hardening the frequency of the TO phonons, therefore decreasing as well as . For negative pressures, a QCP is induced within the dome and slightly increases on the PE side while it decreases on the FE side except very near the kink. By increasing negative pressure, the QCP is pushed to higher densities and the dome narrows and sharpens. Figure 3 (b) shows the phase diagram for doped STO under a fixed negative pressure (). and are shown, respectively, in units of and to show that and that the kink lies within the QC region Rowley et al. (2014). Thus, for STO, we find that the pairing fluctuations near the kink are quantum critical.
We find similar results when the QCP is induced by cation substitution. Figure 3 (c) shows the SC domes for several Ca concentrations. Inducing a QCP with also generates a kink at a characteristic charge density . For , increases, while it decreases for except very near the FE transition. Increasing narrows and sharpens the dome. Figure 3 (d) shows the phase diagram for . We find again that the kink occurs nearly at the QCP and lies within the QC fan.
We now compare our results to those of previous OD models. Edge et al. (2015); Kedem et al. (2016); Dunnett et al. (2018a). At the static and qualitative level considered here, our results agree with the essentials of such models in the absence of cation substitution or stress. However, we find that when a FE transition is induced with these tuning parameters, OD models predict a broadening of SC dome and a sharp peak in . This is in stark contrast with our results.
We now compare our results to recent experiments. Our phase diagram is in overall qualitative and fair quantitative agreement with recent experiments in STO:Ca- Rischau et al. (2017). While an enhancement in is observed near the QCP, the existing data Rischau et al. (2017) is too sparse to determine whether there is a kink. Our results are also in qualitative agreement with the observed reduction in with hydrostatic pressure in n-doped STO Rowley et al. (2018); Pfeiffer and Schooley (1970) and the very recent observation of enhanced superconductivity with tensile stress Herrera et al. (2018). Our calculated dome tends to be narrower than the observed one. Schooley et al. (1965); Koonce et al. (1967); Binnig et al. (1980); Suzuki et al. (1996) This is a consequence of our choice of the parametrization given in Eq. (8) for which a theory is clearly needed Wölfle and Balatsky (2018).
IV Conclusions
In summary, by combining a standard model for displacive FEs with a strong-coupling theory of superconductivity, we have studied the effects of a FE quantum phase transition on the SC phase of polar semiconductors and applied it to STO. We have shown that superconductivity is favored by the FE instability from the disordered side, while the increase in dielectric stiffness and dipolar induced anisotropies in the pairing excitations decrease . A kink signature in the dome is generated by the condensation of the phonons when both SC and FE orders set in and when the coupling constant peaks. This generally occurs at charge densities below that of the QCP. When we apply our model to doped STO, we find that the antiadiabatic limit places the kink nearly at its QCP. Our model is in qualitative and fairly quantitative agreement with the recent observation of overlapping FE-like and superconducting instabilities in n-doped STO:Ca- and the strain tuning of in n-doped STO. At the qualitative and static level considered here, we find that while these results agree with the essentials of previous work invoking OD models to describe the pairing excitations in STO, there are significant differences.
The theoretical framework presented here and its extensions could provide insight into the intriguing role of spatial inversion symmetry breaking in two-dimensional superconductivity at the interface of STO-based heterostructures, Pai et al. (2018); *Gariglio2016a gated KTaO3 Ueno et al. (2011), FeSe monolayers on STO Lee et al. (2014), as well as possible pairing mechanisms with new collective excitations originated by multiferroic QCPs Morice et al. (2017); *Narayan2017a; *Dunnett2018b.
Finally, to further explore the possible role of quantum structural transitions on electronic degrees of freedom, we speculate that it may be worthwhile to chemically or electrostatically dope other material candidates near structural QCPs such as the ionic insulators ScF3 Handunkanda et al. (2015) (as recently suggested Herrera et al. (2018)) and the mercurus halide Hg2I2 Occhialini et al. (2017).
V Acknowledgments
We wish to thank Peter Littlewood and Gilbert Lonzarich for useful discussions. Work at the University of Costa Rica is supported by the Vice-rectory for Research under project no. 816-B7-601, and work at Argonne National Laboratory is supported by the U.S. Department of Energy, Office of Basic Energy Sciences, Materials Science Division under contract no. DE-AC02-06CH11357. G.G.G.V. acknowledges Churchill College, the Department of Materials Science and Metallurgy and the Cavendish Laboratory at the University of Cambridge where part of this work was done.
References
- Schooley et al. (1964) J. F. Schooley, W. R. Hosler, and M. L. Cohen, “Superconductivity in semiconducting SrTiO3,” Phys. Rev. Lett. 12, 474 (1964).
- Schooley et al. (1965) J. F. Schooley, W. R. Hosler, E. Ambler, J. H. Becker, M. L. Cohen, and C. S. Koonce, “Dependence of the superconducting transition temperature on carrier concentration in semiconducting SrTi,” Phys. Rev. Lett. 14, 305 (1965).
- Koonce et al. (1967) C. S. Koonce, M. L. Cohen, J. F. Schooley, W. R. Hosler, and E. R. Pfeiffer, “Superconducting transition temperatures of semiconducting SrTiO3,” Phys. Rev. 163, 380 (1967).
- Binnig et al. (1980) G. Binnig, A. Baratoff, H. E. Hoenig, and J. G. Bednorz, “Two-band superconductivity in Nb-doped SrTi,” Phys. Rev. Lett. 45, 1352 (1980).
- Suzuki et al. (1996) Hiroshi Suzuki, Hiroshi Bando, Youiti Ootuka, Isao H. Inoue, Tetsuya Yamamoto, Kazuhiko Takahashi, and Yoshikazu Nishihara, “Superconductivity in single-crystalline Sr1-xLaxTiO3,” J. Phys. Soc. Jpn. 65, 1529 (1996).
- Eagles (1986) D. M. Eagles, “Superconductivity at very low carrier concentrations and indications of a charged bose gas in SrTi0.97Zr0.03O3,” Solid State Comm. 60, 521 (1986).
- Eagles et al. (1989) D. M. Eagles, R. J. Tainsh, and C. Andrikidis, “Evidence for pairing without superconductivity from resistance between 130 mK and 70 mK in a specimen of ceramic Zr-doped SrTiO3,” Physica C 157, 48 (1989).
- Tainsh and Andrikidis (1986) R. J. Tainsh and C. Andrikidis, “Superconducting transitions from states with low normal conductivity in ceramic SrTi0.97Zr0.03O3,” Solid State Comm. 60, 517 (1986).
- Eagles (2016) D. M. Eagles, “Comment on two papers claiming records for the lowest carrier concentration at which superconductivity has been observed,” arXiv:1604.05660 (2016).
- Lin et al. (2013) X. Lin, Z. Zhu, B. Fauqué, and K. Behnia, “Fermi surface of the most dilute superconductor,” Phys. Rev. X 3, 021002 (2013).
- Carbotte (1990) J. P. Carbotte, “Properties of boson-exchange superconductors,” Rev. Mod. Phys. 62, 1027 (1990).
- Burns (1980) G. Burns, “Comment on the low temperature specific heat of ferroelectrics, antiferroelectrics, and related materials,” Solid State Comm. 35, 811 (1980).
- Gor’kov (2016) L. P. Gor’kov, “Phonon mechanism in the most dilute superconductor n-type SrTiO3,” Proc. Natl. Acad. Sci. 113, 4646 (2016).
- Ruhman and Lee (2016) J. Ruhman and P. A. Lee, “Superconductivity at very low density: the case of strontium titanate,” Phys. Rev. B 94, 224515 (2016).
- Takada (1980) Y. Takada, “Theory of superconductivity in polar semiconductors and its application to n-type semiconducting SrTiO3,” J. Phys. Soc. Jpn. 49, 1267–1275 (1980).
- Edelman and Littlewood (2017) A. Edelman and P. B. Littlewood, “A41.00011 : Polaron-plasmon superconductivity in strontium titanate,” APS March Meeting (2017).
- Swartz et al. (2018) A. G. Swartz, H. Inoue, T. A. Merz, Y. Hikita, S. Raghu, T. P. Devereaux, S. Johnston, and H. Y. Hwang, “Polaronic behavior in a weak-coupling superconductor,” Proc. Nat. Acad. Sci. 115, 1475 (2018).
- Collignon et al. (2018) C. Collignon, X. Lin, C. W. Rischau, B. Fauqué, and K. Behnia, “Metallicity and superconductivity in doped strontium titanate,” arXiv:1804.07067 (2018).
- Rowley et al. (2014) S. E. Rowley, L. J. Spalek, R. P. Smith, M. P. M. Dean, M. Itoh, J. F. Scott, G. G. Lonzarich, and S. S. Saxena, “Ferroelectric quantum criticality,” Nat. Phys. 10, 367 (2014).
- Edge et al. (2015) J. M. Edge, Y. Kedem, U. Aschauer, N. A. Spaldin, and A. V. Balatsky, “Quantum critical origin of the superconducting dome in SrTiO3,” Phys. Rev. Lett. 115, 247002 (2015).
- Rischau et al. (2017) C. W. Rischau, X. Lin, C. P. Grams, D. Finck, S. Harms, J. Engelmayer, T. Lorenz, Y. Gallais, B. Fauque, J. Hemberger, and K. Behnia, “A ferroelectric quantum phase transition inside the superconducting dome of Sr1-xCaxTiO3-δ,” Nat. Phys. 13, 643 (2017).
- Stucky et al. (2016) A. Stucky, G. W. Scheerer, Z. Ren, D. Jaccard, J.-M. Poumirol, C. Barreteau, E. Giannini, and D. van der Marel, “Isotope effect in superconducting n-doped SrTiO3,” Sci. Rep. 6, 37582 (2016).
- Herrera et al. (2018) C. Herrera, J. Cerbin, K. Dunnett, A. V. Balatsky, and I. Sochnikov, “Strain-engineered interaction of quantum polar and superconducting phases,” arXiv:1808.03739 (2018).
- Müller and Burkard (1979) K. A. Müller and H. Burkard, “SrTi: An intrinsic quantum paraelectric below 4 K,” Phys. Rev. B 19, 3593 (1979).
- Yamada and Shirane (1969) Y. Yamada and G. Shirane, “Neutron scattering and nature of the soft optical phonon in SrTiO3,” J. Phys. Soc. Jpn. 26, 396 (1969).
- Uwe and Sakudo (1976) H. Uwe and T. Sakudo, “Stress-induced ferroelectricity and soft phonon modes in SrTiO3,” Phys. Rev. B 13, 271–286 (1976).
- Itoh et al. (1999) M. Itoh, R. Wang, Y. Inaguma, T. Yamaguchi, Y-J. Shan, and T. Nakamura, “Ferroelectricity induced by oxygen isotope exchange in strontium titanate perovskite,” Phys. Rev. Lett. 82, 3540 (1999).
- Bednorz and Müller (1984) J. G. Bednorz and K. A. Müller, “Sr1-xCaxTiO3: An xy quantum ferroelectric with transition to randomness,” Phys. Rev. Lett. 52, 2289 (1984).
- Chandra et al. (2017) P. Chandra, G. G. Lonzarich, S. E. Rowley, and J. F. Scott, “Prospects and applications near ferroelectric quantum phase transitions,” Rep. Prog. Phys. 80, 112502 (2017).
- Kedem et al. (2016) Y. Kedem, J.-X. Zhu, and A. V. Balatsky, “Unusual superconducting isotope effect in the presence of a quantum criticality,” Phys. Rev. B 93, 184507 (2016).
- Dunnett et al. (2018a) K. Dunnett, A. Narayan, N. A. Spaldin, and A. V. Balatsky, “Strain and ferroelectric soft-mode induced superconductivity in strontium titanate,” Phys. Rev. B 97, 144506 (2018a).
- Lines and Glass (2001) M. E. Lines and A. M. Glass, Principles and Applications of Ferroelectrics and Related Materials (Oxford University Press, 2001).
- Inoue (1983) K. Inoue, “Study of structural phase transitions by the hyper-Raman scattering,” Ferroelectrics 52, 253–262 (1983).
- Blinc et al. (2005) R. Blinc, B. Zalar, V. V. Laguta, and M. Itoh, “Order-disorder component in the phase transition mechanism of 18O Enriched strontium titanate,” Phys. Rev. Lett. 94, 147601 (2005).
- Takesada et al. (2006) M. Takesada, M. Itoh, and T. Yagi, “Perfect softening of the ferroelectric mode in the isotope-exchanged strontium titanate of studied by light scattering,” Phys. Rev. Lett. 96, 227602 (2006).
- Taniguchi et al. (2007) H. Taniguchi, M. Itoh, and T. Yagi, “Ideal soft mode-type quantum phase transition and phase coexistence at quantum critical point in -Exchanged ,” Phys. Rev. Lett. 99, 017602 (2007).
- Yagi et al. (2009) T. Yagi, M. Takesada, M Taniguchi, and M. Itoh, “Soft-mode dynamics in the ferroelectric phase transition of quantum paraelectric SrTiO3,” Ferroelectrics 379, 168 (2009).
- Rabe et al. (2007) K. Rabe, Ch. H. Ahn, and J.-M. Triscone, eds., Physics of Ferroelectrics: A Modern Perspective (Springer-Verlag, Berlin, 2007).
- Gabay and Triscone (2017) M. Gabay and J.-M. Triscone, “Ferroelectricity woos pairing,” Nat. Phys. 13, 624 (2017).
- Wang et al. (2016) Z. Wang, S. McKeown Walker, A. Tamai, Y. Wang, Z. Ristic, F. Y. Bruno, A. de la Torre, S. Riccò, N. C. Plumb, M. Shi, P. Hlawenka, J. Sánchez-Barriga, A. Varykhalov, T. K. Kim, M. Hoesch, P. D. C. King, W. Meevasana, U. Diebold, J. Mesot, B. Moritz, T. P. Devereaux, M. Radovic, and F. Baumberger, “Tailoring the nature and strength of electron-phonon interactions in the SrTiO3 (001) 2D electron liquid,” Nat. Mat. 15, 835 (2016).
- van der Marel et al. (2011) D. van der Marel, J. L. M. van Mechelen, and I. I. Mazin, “Common Fermi-liquid origin of resistivity and superconductivity in -type SrTiO3,” Phys. Rev. B 84, 205111 (2011).
- Devreese et al. (2010) J. T. Devreese, S. N. Klimin, J. L. M. van Mechelen, and D. van der Marel, “Many-body large polaron optical conductivity in ,” Phys. Rev. B 81, 125119 (2010).
- Meevasana et al. (2010) W. Meevasana, X. J. Zhou, B. Moritz, C-C. Chen, R. H. He, S-I. Fujimori, D. H. Lu, S-K. Mo, R. G. Moore, F. Baumberger, T. P. Devereaux, D. van der Marel, N. Nagaosa, J. Zaanen, and Z-X. Shen, “Strong energy-momentum dispersion of phonon-dressed carriers in the lightly doped band insulator SrTiO3,” New J. Phys. 12, 023004 (2010).
- van Mechelen et al. (2008) J. L. M. van Mechelen, D. van der Marel, C. Grimaldi, A. B. Kuzmenko, N. P. Armitage, N. Reyren, H. Hagemann, and I. I. Mazin, “Electron-phonon interaction and charge carrier mass enhancement in ,” Phys. Rev. Lett. 100, 226403 (2008).
- Rowley et al. (2018) S. E. Rowley, C. Enderlein, J. Ferreira de Oliveira, D. A. Tompsett, E. Baggio Saitovitch, S. S. Saxena, and G. G. Lonzarich, “Superconductivity in the vicinity of a ferroelectric quantum phase transition,” arXiv:1801.08121 (2018).
- Pfeiffer and Schooley (1970) E. R. Pfeiffer and J. F. Schooley, “Effect of stress on the superconducting transition temperature of SrTiO3,” J. Low Temp. Phys. 2, 333 (1970).
- McMillan (1968) W. L. McMillan, “Transition temperature of strong-coupled superconductors,” Phys. Rev. 167, 331 (1968).
- Giustino (2017) F. Giustino, “Electron-phonon interactions from first principles,” Rev. Mod. Phys. 89, 015003 (2017).
- Wölfle and Balatsky (2018) P. Wölfle and A. V. Balatsky, “Superconductivity at low density near a ferroelectric quantum critical point: Doped SrTiO3,” Phys. Rev. B 98, 104505 (2018).
- Pytte (1972) E. Pytte, “Theory of perovskite ferroelectrics,” Phys. Rev. B 5, 3758 (1972).
- Aharony and Fisher (1973) A. Aharony and M. E. Fisher, “Critical behavior of magnets with dipolar Interactions. I. Renormalization group near four dimensions,” Phys. Rev. B 8, 3323 (1973).
- Arce-Gamboa and Guzmán-Verri (2017) J. R. Arce-Gamboa and G. G. Guzmán-Verri, “Random electric field instabilities of relaxor ferroelectrics,” npj Quantum Materials 2, 28 (2017).
- Strukov and Levanyuk (1998) B. A. Strukov and A. P. Levanyuk, Ferroelectric Phenomena in Crystals: Physical Foundations (Springer, Berlin, 1998).
- Zhong and Vanderbilt (1996) W. Zhong and D. Vanderbilt, “Effect of quantum fluctuations on structural phase transitions in and ,” Phys. Rev. B 53, 5047 (1996).
- Cowley (1980) R. A. Cowley, “Structural phase transitions I. Landau theory,” Adv. Phys. 29, 1 (1980).
- Samara (1971) G. A. Samara, “The Grüneisen parameter of the soft ferroelectric mode in the cubic perovskites,” Ferroelectrics 2, 177 (1971).
- Carpenter (2007) M. Carpenter, “Elastic anomalies accompanying phase transitions in (Ca,Sr)TiO3 perovskites: Part I. Landau theory and a calibration for SrTiO3,” Am. Mineral. 92, 309 (2007).
- Pai et al. (2018) Y.-Y. Pai, A. Tylan-Tyler, P. Irwin, and J. Levy, “Physics of SrTiO3-based heterostructures and nanostructures: a review,” Rep. Prog. Phys. 81, 036503 (2018).
- Gariglio et al. (2016) S. Gariglio, M. Gabay, and J.-M. Triscone, “Research update: conductivity and beyond at the LaAlO3/SrTiO3 interface,” APL Materials 4, 060701 (2016).
- Ueno et al. (2011) K. Ueno, S. Nakamura, H. Shimotani, H. T. Yuan, N. Kimura, T. Nojima, H. Aoki, Y. Iwasa, and M. Kawasaki, “Discovery of superconductivity in KTaO3 by electrostatic carrier doping,” Nat. Nanotech. 6, 408 (2011).
- Lee et al. (2014) J. J. Lee, F. T. Schmitt, R. G. Moore, S. Johnston, Y.-T. Cui, W. Li, M. Yi, Z. K. Liu, M. Hashimoto, Y. Zhang, D. H. Lu, T. P. Devereaux, D.-H. Lee, and Z.-X. Shen, “Interfacial mode coupling as the origin of the enhancement of in FeSe films on SrTiO3,” Nature 515, 245 (2014).
- Morice et al. (2017) C. Morice, P. Chandra, S. E. Rowley, G. Lonzarich, and S. S. Saxena, “Hidden fluctuations close to a quantum bicritical point,” Phys. Rev. B 96, 245104 (2017).
- Narayan et al. (2017) A. Narayan, A. V. Balatsky, and N. A. Spaldin, “Multiferroic quantum criticality,” arXiv:1711.07989 (2017).
- Dunnett et al. (2018b) K. Dunnett, J. X. Zhu, N. A. Spaldin, V. Juricic, and A. V. Balatsky, “Dynamic multiferroicity of a ferroelectric quantum critical point,” arXiv:1808.05509 (2018b).
- Handunkanda et al. (2015) S. U. Handunkanda, E. B. Curry, V. Voronov, A. H. Said, G. G. Guzmán-Verri, R. T. Brierley, P. B. Littlewood, and J. N. Hancock, “Large isotropic negative thermal expansion above a structural quantum phase transition,” Phys. Rev. B 92, 134101 (2015).
- Occhialini et al. (2017) C. A. Occhialini, S. U. Handunkanda, A. Said, S. Trivedi, G. G. Guzmán-Verri, and J. N. Hancock, “Negative thermal expansion near two structural quantum phase transitions,” Phys. Rev. Materials 1, 070603 (2017).