Anti-margination of microparticles and platelets in the vicinity of branching vessels
Abstract
We investigate the margination of microparticles/platelets in blood flow through complex geometries typical for in vivo vessel networks: a vessel confluence and a bifurcation. Using 3D Lattice-Boltzmann simulations, we confirm that behind the confluence of two vessels a cell-free layer devoid of red blood cells develops in the channel center. Despite its small size of roughly one micrometer, this central cell-free layer persists for up to 100 m after the confluence. Most importantly, we show from simulations that this layer also contains a significant amount of microparticles/platelets and validate this result by in vivo microscopy in mouce venules. At bifurcations, however, a similar effect does not appear and margination is largely unaffected by the geometry. This anti-margination towards the vessel center after a confluence may explain in vivo observations by Woldhuis et al. [Am. J. Physiol. 262, H1217 (1992)] where platelet concentrations near the vessel wall are seen to be much higher on the arteriolar side (containing bifurcations) than on the venular side (containing confluences) of the vascular system.
Introduction
Red blood cells (RBCs) fill up to 45 volume percent of human blood [67, 70, 58, 35, 28] and thus represent by far the major cellular blood constituent. Due to their high deformability, RBCs flowing through a cylindrical channel or blood vessel prefer the low-shear rate region in the center of the channel. By hydrodynamic interactions with the red blood cells stiffer particles such as platelets, white blood cells or artificial drug delivery agents are thus expelled towards the wall. This separation of red blood cells and stiffer particles is known as margination and is essential for the ability of blood platelets to quickly stop bleeding or for drug delivery agents to closely approach the endothelial wall. One of the first observations of margination studied white blood cells in vivo as well as an in vitro model system containing disks and spheres already in 1980 [75]. Interestingly, an in vivo study by Woldhuis et al. [94] demonstrated a striking difference between the platelet distribution in arterioles and venules, with significantly more margination occurring on the arteriolar side of the vascular system. Since then, more detailed insights were gained by experimental studies [19, 42, 11, 12, 63, 91, 52, 26, 16, 17, 9, 21], computer simulations [57, 27, 45, 98, 83, 99, 46, 24, 30, 73, 48, 22, 61, 89, 88, 40, 62, 33, 44, 56, 79] as well as theoretical modeling [85, 13, 41, 72, 71]. These studies all deal with margination in spatially constant geometries such as shear flow, pipes with cylindrical or rectangular cross-section or plane-Couette systems.
In contrast, in living organisms blood vessels form a hierarchical structure where large arteries branch all the way down to microcapillaries in a series of bifurcations followed by a reversed series of confluences leading up to larger and larger vessels on the venular side. The typical distance between two bifurcations lies within 0.4 mm up to 1 mm in the microvascular system [70, 35]. Despite their importance, studies on RBC distribution and margination using spatially varying geometries are surprisingly scarce. Platelets have been studied by 2D simulations in the vicinity of an aneurysm [60, 95] and in the recirculation zone behind a sudden expansion of a channel [100]. Near a vessel constriction the locally varying distribution of RBCs [20, 31, 90] and rigid microparticles in suspension with RBCs have been investigated [93, 78, 97, 8]. In ref. [8] a local increase in microparticle concentration in front of the constriction has been reported. On a technical side, microchannels including bifurcations are investigated as a possible basis for microdevices separating blood plasma [53, 86]. In asymmetric branches the Zweifach-Fung effect [82, 32] describes an asymmetric red blood cell distribution, i.e. a larger hematocrit in the large flow rate branch [68, 69]. Under certain circumstances even an inversion of the Zweifach-Fung effect may occur [77]. Combining experiments and simulations in a rectangular channel with bifurcation [51] and for a diverging and converging bifurcation using 2D simulations [92] a cell-depleted zone right after the confluence has been reported. Downstream a bifurcation an asymmetry of red blood cell distribution has been seen [51, 5, 53, 65]. Ref. [64] reported margination of hardened RBCs while flowing through branching vessels. Balogh and Bagchi [3] investigated transient behavior of red blood cell motion in more complex networks [3, 4]. Besides the red blood cell behavior it is important to consider suspended particles like blood platelets or synthetic particles, since possible influences of bifurcations and confluences may play a major role in medical applications. Nevertheless, systematic studies covering particle blood suspensions in networks are scare. White blood cell motion in asymmetric bifurcations has been studied experimentally in the context of a branched vessel geometry [96] while Sun et al. [81] investigated the interaction of six red blood cells flowing behind a white blood cell in the vicinity of vessel junctions.
In this report, we study margination of stiff spherical particles suspended among red blood cells in the vicinity of a vessel confluence and bifurcation. This allows us first to confirm and investigate quantitatively the previously observed cell-depleted layer of red blood cells after a confluence. Second, we provide results on the influence of network geometries on stiff particle margination. Our generic stiff particles are a model for artificial drug delivery agents, but also serve as a reasonable approximation for blood platelets. We investigate two cylindrical branches either bifurcating from or forming a confluence into a larger vessel by means of 3D Lattice-Boltzmann simulations. In order to realize simulations of these systems we implement inflow and outflow boundary conditions to the Lattice-Boltzmann/Immersed-Boundary algorithm similar to a dissipative particle dynamics based approach by Lykov et al. [55]. Behind a vessel confluence, we observe a RBC-free layer in the center of the channel persisting for up to 100 m after the confluence. Importantly, this central cell-free layer is not only devoid of red blood cells, but in addition contains a significant amount of anti-marginated microparticles/platelets. Using fluorescent microparticles in mouse microvessels we consistently observe this anti-margination also in vivo. At bifurcations, no equivalent effect occurs. Our findings may explain in vivo observations of Woldhuis et al. [94], who found that in the vascular system platelet margination is strongly present at the arteriolar side with bifurcations, but less at the venular side with confluences. Similarly, recent observations show that thrombi formed in arterioles contain significantly more platelets than thrombi formed in venules [10] which is another indication of increased platelet margination on the arteriolar side. By considering the axial distribution of microparticles along the flow direction we furthermore reveal the site of confluence as a spot with locally increased concentration. The paper is organized as follows: we first introduce the simulation and experimental methods and then report two-dimensional and one-dimensional concentration profiles first in the system with vessel confluence including the experimental results then in the system with a bifurcation. Finally, we investigate the influence of larger hematocrit as well as microparticle distribution in an asymmetric bifurcation.
Methods
Lattice-Boltzmann/Immersed Boundary Method
Fluid flow in the confluence/bifurcation geometry is modeled using a 3D Lattice-Boltzmann method (LBM) which calculates fluid behavior by a mesoscopic description [80, 18, 1]. We use the implementation of LBM in the framework of the simulation package ESPResSo [54, 74, 2]. Red blood cells and particles are modeled using the immersed boundary method (IBM) [66, 59, 33, 8].
In order to mimic realistic conditions of blood flow we assign the blood plasma density and viscosity . Due to the large size of red blood cells and microparticles we expect the temperature to hardly affect collective flow behavior of cells and particles and thus neglect the effect of thermal fluctuations. A typical fluid grid of the present simulations contains 170x110x58 nodes for a bifurcation and 288x110x58 nodes for a confluence. The time step is chosen as with the time of a typical simulation being about .
Red blood cells and microparticles are realized by an infinitely thin elastic membrane interacting with the fluid. For the calculation of elastic forces imposed on the fluid, the membrane is discretized by nodes that are connected by triangles. A red blood cell possesses 1280 triangles and 642 nodes and has a diameter of . The averaged distance between neighboring nodes is about one LBM grid cell. Nodes transfer forces to the fluid and are themselves convected with the local fluid velocity. Interpolation between membrane nodes and fluid nodes is done using an eight-point stencil. The viscosity contrast of the cells is , i.e. the fluid inside and outside the cells has the same viscosity. The elastic properties of a red blood cell are achieved by applying the Skalak model [6, 28, 15] with a shear modulus and an area dilatation modulus . Additional bending forces are computed on the basis of the Helfrich model using a bending modulus [28, 38, 37]. For the calculation the algorithm denoted method A in [38] is used with the bending energy being proportional to the angle of adjacent triangles and the actual forces being computed by analytically differentiating the energy with respect to node position. This somewhat simplistic approach is appropriate for the present work where we focus on collective rather than detailed single cell behavior and where especially the behavior of the microparticles is of interest.
Microparticles are modeled in a similar fashion as the red blood cells with 320 triangles and 162 nodes. The microparticles are chosen to have half the size of RBCs (), which has been reported to show strong margination [61]. In contrast to the RBCs the microparticles contain an additional inner grid to ensure the stiffness and (approximate) non-deformability of the microparticles [33]. The inner grid is linked to the membrane nodes by a harmonic potential. Elastic properties of microparticles are chosen 1000 times larger than for RBCs. For the purpose of numerical stability we apply an empirical volume conservation potential [44] as well as a short ranged soft-sphere repulsion, which decays with the inverse fourth power of the distance and with a cut-off radius equal one grid cell. The latter potential acts between all particles and between the particles and the channel wall.
Stability and accuracy of our simulation method are extensively validated in [33, 38] and in the Supplemental Information. The shapes of isolated red blood cells in cylindrical and rectangular channels have been validated to agree with methodically very different Dissipative Particle Dynamics [25] and Boundary-Integral [39] simulations.
Channel geometry
The systems of interest, a confluence and a bifurcation, are shown in figure 1 a). Both geometries are constructed in the same way: a main cylindrical channel of radius branches into two symmetric daughter channels of radius . In order to obtain a smooth boundary, i.e., the boundary itself and the first derivative is continuous, the transition between main channel and the branches is modeled by third order polynomials: one polynomial, , describes the bifurcating centerline, another, , describes the upper/lower boundary. By rotation around the centerline with radius we obtain a circular cross-section for each forming the bifurcation along the flow direction. Where the cross-sections of the two branches overlap the boundary is left out.
a)

b)
Inflow/outflow boundary condition for IBM-LBM
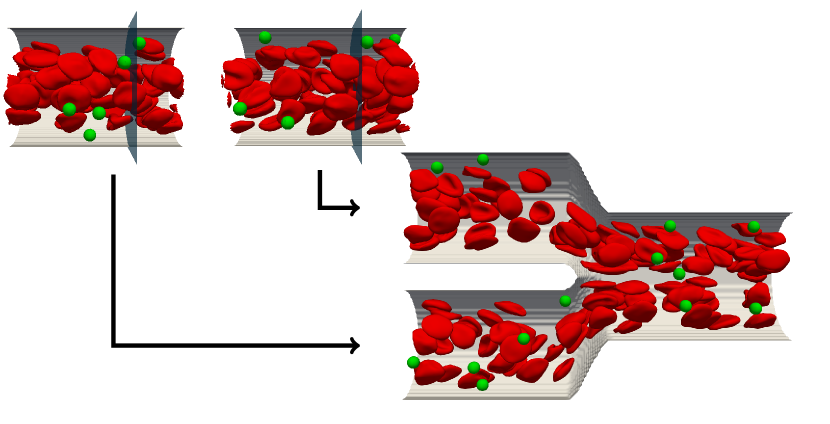
In order to investigate a confluence and a bifurcation as displayed in figure 1 a) periodic boundary conditions cannot be employed. (Joining both geometries into one very large system would be computationally far too expensive due to the very long-ranged influence of bifurcations/confluences as will be detailed in the course of this work.) At the same time, at the entrance of the branches in figure 1 a) left as well as at the entrance of the main channel in figure 1 a) right, we do not want the microparticles and red blood cells to enter in a randomly distributed fashion, but instead obey a marginated configuration in order to match with the well-known behavior in a long tube. The purpose behind this inflow condition is to bring out clearly how the behavior of the marginated fraction of microparticles is influenced by the confluence/bifurcation.
To meet these requirements we implemented inflow and outflow boundary conditions to our IBM-LBM algorithm similar to a recent work using Dissipative Particle Dynamics [55]. We start by simulating straight cylinders with periodic boundaries and a body force driving the flow as depicted at the top of figure 1 b). These feeding simulations yield a time dependent sequence which then serves for particle inflow in the complex system of interest. During the simulation of the complex system we check a frame of the feeding sequence for cells and particles crossing a certain (arbitrary) plane. Particles crossing this plane, are then inserted at the same radial position with the same shape into the complex system as illustrated also in figure 1 b). For crossing of the plane the center-of-mass serves as criterion similar to [55]. The inflow velocity is chosen to match the flow rate prescribed in the straight cylinder. In order to prevent overlap of cells during inflow we sometimes increase the flow rate slightly (about 10%). As a result we obtain a marginated pattern at the entrance of our complex systems as proven by the cross-sectional concentration profiles shown in the Supplemental Information.
Since azimuthal motion of the dilute microparticles in the feeding channels is extremely slow, even a very long feeding simulation would lead to a biased distribution of microparticles upon entering the complex channel. This is prevented by applying a small angular random force to the microparticles in the feeding channel thus guaranteeing an azimuthally homonegenous, yet well marginated distribution of microparticles. We furthermore show in the Supplemental Information that after a first filling of the system the cell and particle number in the system reaches a plateau and slightly fluctuates around a constant value.
For the fluid, in order to prescribe a distinct flow rate we assign a constant velocity to all fluid LBM nodes at the beginning of the simulation box. The same is done at the end of the box taking into account the different cross-sections of main channel and branches, thus matching fluid inflow and outflow. About 15 grid cells behind the inflow the flow profile matches tube flow. This region with evolving flow profile is skipped for particle inflow and in data analysis.
Analysis
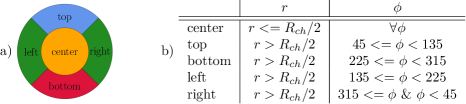
In our work, we employ different concentration profiles at given positions along the channel. First, we compute cross-sectionally averaged concentrations leading to 1D concentration profiles as a function of position along the flow direction . Some of these profiles consider only a certain fraction of cells or particles entering the channel in specific regions which are labeled as a function of their lateral (,) position in polar coordinates at the entrance of the system. Corresponding concentrations are calculated taking into account only this particular fraction of cells or particles. The labeling is illustrated by the color code in figure 2 a) and by the criteria for and in figure 2 b).
Second, we use three types of two dimensional concentration profiles. For microparticle concentrations, 2D radial projections in the plane are calculated which reflect the radial symmetry of the main and the branch channels. Such projections, however, are not appropriate to understand non-radially symmetric effects occuring near confluences or bifurcations. We thus employ in addition, mainly for red blood cell concentrations, planar projections of the 3D concentrations on the plane by integrating the concentration over the direction perpendicular to the plane of the paper. Finally, in order to get further insight into cell and particle distributions perpendicular to the flow direction, we calculate cross-section profiles within the plane.
All concentration profiles are averaged over the whole simulation time starting from the moment at which the number of cells and particles does not vary significantly.
Preparation of dorsal skinfold chamber and in vivo imaging
Animals The in vivo experiments were performed in 10-12 week old male C57BL/6 mice (n = 3) with a body weight of 23-26 g. The animals were bred and housed in open cages in the conventional animal husbandry of the Institute for Clinical & Experimental Surgery (Saarland University, Germany) in a temperature-controlled environment under a 12 h/12 h light-dark cycle and had free access to drinking water and standard pellet food (Altromin, Lage, Germany). The experiment was approved by the local governmental animal care committee (approval number 06/2015) and was conducted in accordance with the German legislation on protection of animals and the NIH Guidelines for the Care and Use of Laboratory Animals (Institute of Laboratory Animal Resources, National Research Council, Washington, USA).
Dorsal skinfold chamber model Microvessels were analyzed in the dorsal skinfold chamber model, which provides continuous microscopic access to the microcirculation of the striated skin muscle and the underlying subcutaneous tissue [49]. For the implantation of the chamber, the mice were anesthetized by i.p. injection of ketamine (75 mg/kg body weight; Ursotamin®; Serumwerke Bernburg, Bernburg, Germany) and xylazine (15 mg/kg body weight; Rompun®; Bayer, Leverkusen, Germany). Subsequently, two symmetrical titanium frames (Irola Industriekomponenten GmbH & Co. KG, Schonach, Germany) were implanted on the extended dorsal skinfold of the animals, as described previously in detail [50]. Within the area of the observation window, one layer of skin was completely removed in a circular area of 15 mm in diameter. The remaining layers (striated skin muscle, subcutaneous tissue and skin) were finally covered with a removable cover glass. To exclude alterations of the microcirculation due to the surgical intervention, the mice were allowed to recover for 48 h.
In vivo microscopy In vivo microscopic analysis was performed, as previously described [7]. In detail, the mice were anesthetized and a fine polyethylene catheter (PE10, 0.28 mm internal diameter) was inserted into the carotid artery for application of the plasma marker 5 % fluorescein isothiocyanate (FITC)-labeled dextran 150,000 (Sigma-Aldrich, Taufkirchen, Germany) and microspheres (Fluoresbrite Plain YG 1.0 m; Polysciences, Warrington, PA, USA). Then, the animals were put in lateral decubital position on a plexiglas stage and the dorsal skinfold chamber was attached to the microscopic stage of an upright microscope (Axiotech; Zeiss, Jena, Germany) equipped with a LD EC Epiplan-Neofluar 50x/0.55 long-distance objective (Zeiss) and a 100 W mercury lamp attached to a filterset (excitation 450-490 nm, emission > 520 nm). The microscopic images were recorded using a CMOS video camera (Prime 95B, Photometrics, Tucson, AZ, USA) at an acquisition speed of 415 images per second controlled by a PC-based acquisition software (NIS-Elements, Nikon, Tokyo, Japan).
Trajectory analysis The recorded video sequence was analyzed using a single particle tracking algorithm. Hereby, the intensity profile of each frame was adjusted to have both the top and bottom 1% of all pixels saturated, correcting for changes in illumination and exposure time. With the aid of a tailored MATLAB script, all spherical (round) objects were detected and interconnected among all frames by cross-correlating consecutive images. To only detect microspheres (and not red blood cells), we set a threshold of 0.9 as a lower limit in normalized intensity values, since they are fluorescent. Further, we defined a minimal diameter for the detected particles (0.7 µm), causing a trajectory to end if the measured value falls below this value. Combining the coordinates of all classified microspheres in this way over the whole video sequence, we derived the respective trajectories.
Channel confluence
We first investigate the system with two branches of radius merging into one main channel of radius as depicted in figure 1 a) left. The centerlines of the two branches are separated by and the transition zone from the end of the branches to the beginning of the main channel is about . We choose the mean velocity at the entrance of our system to be about . Simulations are first performed for a physiologically realistic hematocrit (red blood cell volume fraction) of . Results for a higher are qualitatively similar and are presented at the end of this contribution. The Reynolds number calculated from the centerline velocity, the red blood cell radius , and the kinematic viscosity of the fluid is .
Cell and particle distribution
a) b)
c) d)
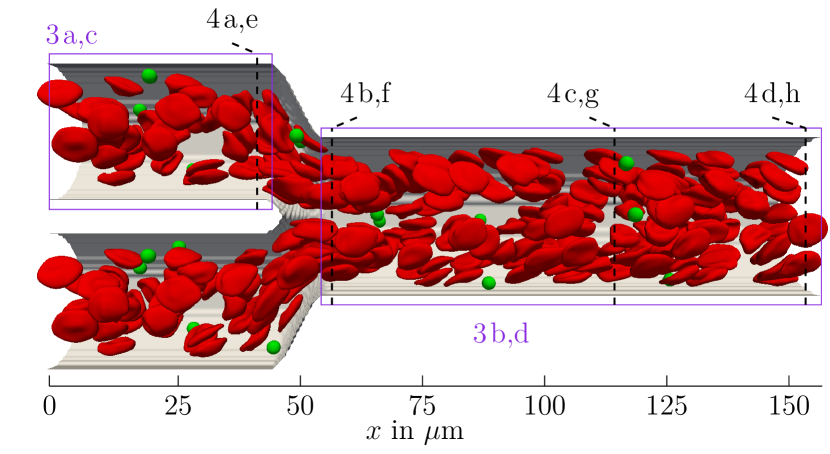
We start by considering 2D concentration profiles along flow direction in figure 3. In the two small branches and far away from the confluence we observe a homogeneous distribution of red blood cells around the center and the cell-free layer with vanishing concentration [23, 29, 43] near the wall as can be seen by figure 3 a). The microparticle concentration in figure 3 c) exhibits the typical margination peak near the wall. The state of full and azimuthally homogeneous margination is confirmed by the cross-sections at channel entrance shown in the Supplemental Information. This behavior is the same as in a straight channel.
Approaching the confluence we observe an asymmetric cell-free layer: near the inner boundary of the branch the cell-free layer decreases, near the outer boundary it increases. The asymmetry becomes more pronounced towards the end of the branches () stemming from cells flowing towards the main channel. However, the motion of red blood cells towards the main channel already initiates at , i.e., about before the end of the branches. This also affects microparticle behavior as can be seen by the two separate peaks in the radially projected concentration in figure 3 c). These two peaks stem from the particles near the inner and the outer boundary, respectively: the microparticles near the inner boundary remain close to the wall, while the particles near the outer boundary migrate away from the wall due the flow profile towards the main channel and the increased cell-free layer.
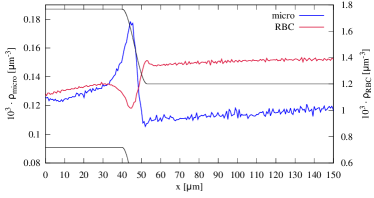
Entering the main channel we observe a decreased cell-free layer near the upper and lower boundary in figure 3 b) right at the beginning. An interesting feature of the RBC concentration is the additional cell-free layer which develops in the channel center after the confluence. This agrees well with the findings of ref. [51] that a cell-depleted zone behind the apex of a confluence develops. We confirm that finding by considering the concentration and in addition highlight the long-range stability of the central cell-free layer.
Most remarkably, this central cell-free layer contains, just as its classical near-wall counterpart, a significant amount of microparticles as can clearly be seen in the radially projected microparticle concentration of figure 3 d).
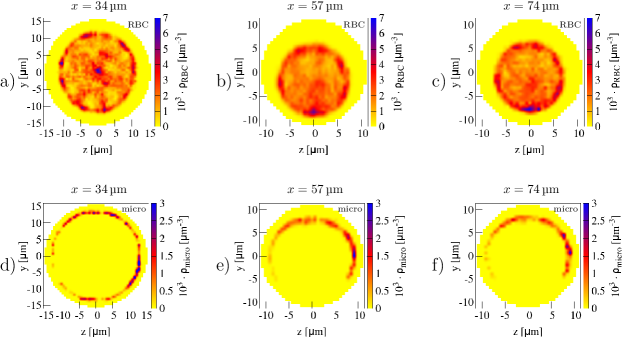
Before investigating further this central cell-free layer, we consider cross-sectional concentration profiles in figure 4. In figure 4 a), we observe how the circular pattern of red blood cells is shifted towards the inner boundary at the end of the branches. This corresponds to the asymmetric cell-free layer in figure 3 a). Entering the main channel the pattern of red blood cell concentration possesses two flattened and asymmetric spots (figure 4 b)) clearly separated by the central cell-free layer which shows vanishing concentration. At the left and right of the main channel an additional large cell-free spot is obtained. This central-cell-free layer stems from the cells flowing out of the upper and lower branch competing for the channel center.
Microparticles in the two branches remain well marginated until the end of the branches as shown in 4 e). After the confluence, however, figure 4 f) shows how a notable fraction of microparticles is now located very near the channel center. This can be understood by the original location of the microparticles inside the branches: those microparticles that are located near the inner boundary of the branch enter the main channel in the center. This location is favorable due to the additional central cell-free layer observed in figure 4 b). In the Supplemental Information we show the anti-margination also for platelet-shaped microparticles. Thus, the present geometry leads to a re-distribution of microparticles from a near-wall marginated position before the confluence to a near-center anti-marginated position after the confluence.
Lifetime of the central-cell-free layer, anti-margination, and physiological consequences
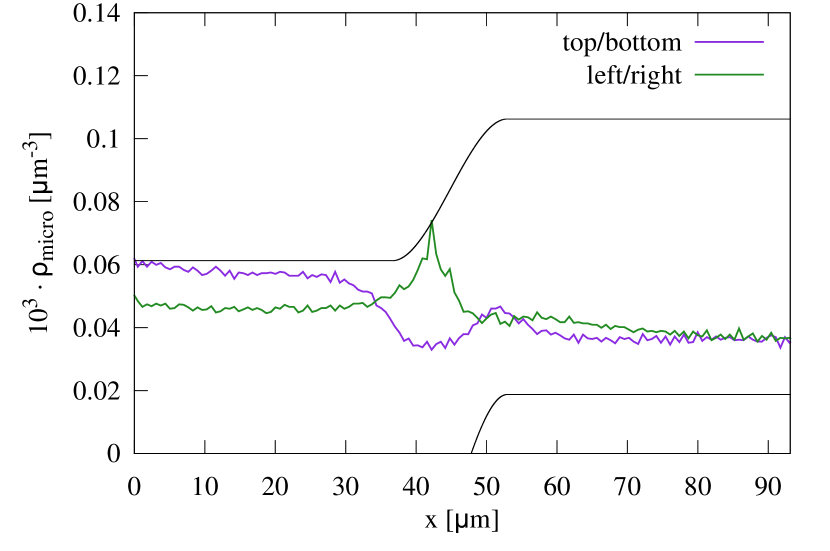
An interesting question is the stability of the RBC-depleted central cell-free layer and the corresponding anti-marginated microparticles as the flow continues away from the confluence location along the main channel. Figure 3 b) shows that the central-cell-free layer is surprisingly stable, being visible all along the main channel and only becoming slightly blurred towards the end. The same trend can be observed in the cross-sectional concentration at three sites along the main channel in figure 4 b),c),d). Although it starts to become blurred after 60 m in figure 4 c), the central cell-free layer and especially the cell-free spot left and right is visibly present until at least 100 m behind the confluence as shown in figure 4 d). Similarly, the corresponding microparticle concentration in figure 4 f),g),h) shows that microparticles are located in the center all along the main channel. Thus, a confluence of two channels influences microparticle behavior over distances which are much longer than the channel diameter.
To gain a more mechanistic insight into this long-time stability of the central CFL, we calculate the (shear-induced) diffusion coefficient [87, 34, 98, 47, 99, 36, 43] of red blood cells in the center. For this, we compute the time-dependent mean squared displacement (MSD) which is shown in the Supplemental Information. By modeling the increase in MSD with time by the theoretical expectation for normal diffusion we extract a diffusion coefficient for the red blood cells of in the case of = 12%. This value is of the same order as previous results in experiments with red blood cells [87, 34, 36] and simulations of spheres and platelets [98, 99]. By assuming a thickness of m and a flow speed of 2.5 mm/s we calculate a distance of 100 m required to bridge the central cell-free layer. This length scale agrees well with the observation in the concentration profiles that the central cell-free layer starts to become blurred after 100 m. We calculate in the same way the shear-induced diffusion coefficient of the microparticles . Ref. [87] reports for platelets in a perfusion chamber m2/s for a shear rate of 1/s and unknown hematocrit. Ref. [98] and [99] obtain a diffusivity a factor 2 smaller in simulations of plane-Couette flow with . Considering not only the gap of the central cell-free layer to be closed, but the larger spot left/right (assuming a distance of m to be bridged) we can estimate a distance of 1.1 mm for red blood cell redistribution, which is comparable to the estimation of by Katanov et al. [43]. When we estimate the length scale required to migrate towards the channel wall, i.e. to marginate, we get about 5 mm. Comparing this to the typical distance between successive confluences of about 0.4-1 mm [70, 35] we conclude that full margination cannot be regained. This in turn may explain in vivo observations that on the venular side of the vascular system margination is much less pronounced than on the arterioral side [94, 10].
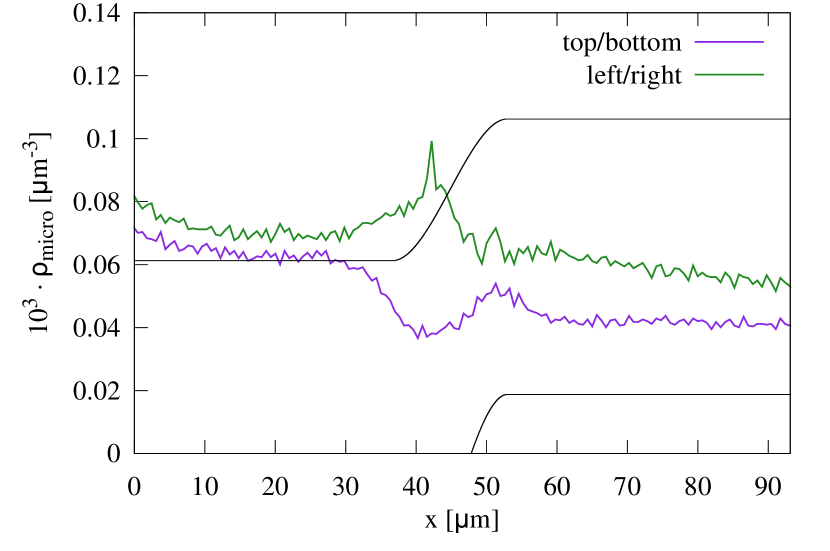
Furthermore, we want to address the question how strong the effect of anti-margination is. Therefore, we calculate the fraction of particles that are not located directly next to the wall, i.e. we consider particles that are more than one particle radius away from the vessel wall. For the concentration profiles in fig. 4 we obtain the fractions 0 at m, 0.158 at m, 0.138 at m, and 0.135 at m. We find that the fraction decreases very slowly with increasing distance from the confluence because of marginating microparticles (most likely those located left/right).
Axial concentration
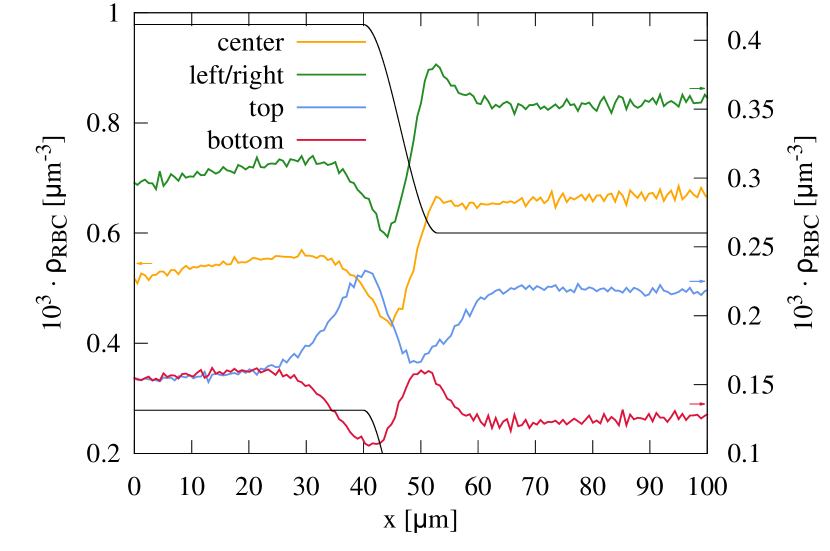
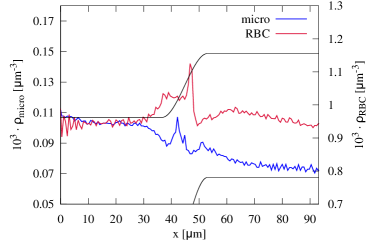
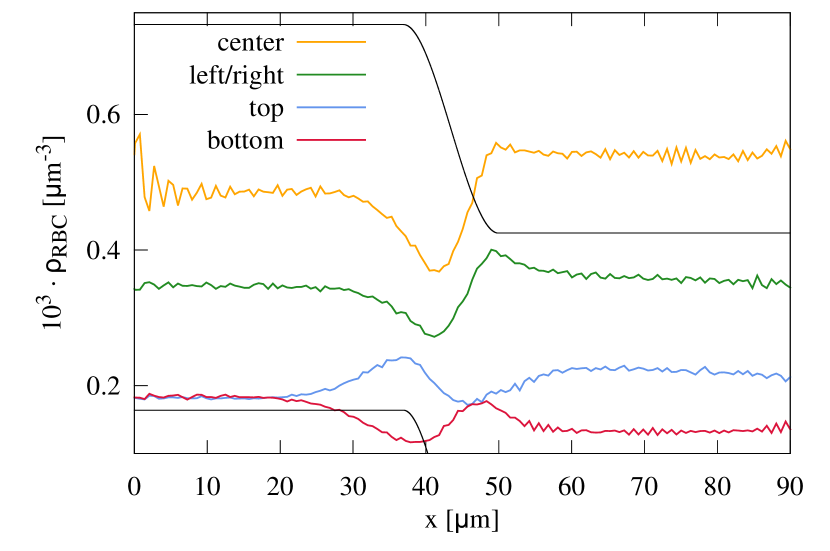
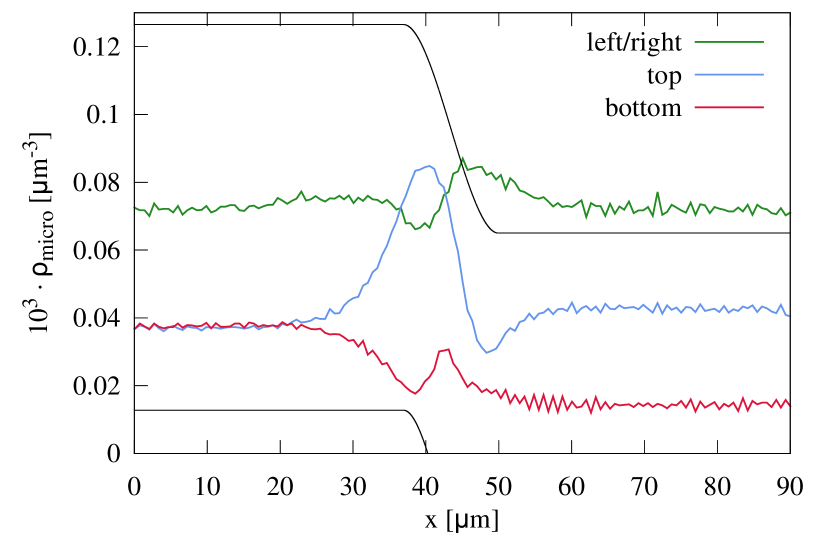
Further insight can be gained by considering 1D axial cell and particle concentration profiles in figure 5. The overall red blood cell concentration exhibits two plateaus inside the main channel and inside the branches, respectively. Inside the branches the concentration is lower than in the main channel in agreement with the Fahraeus effect [76]. Right at the confluence, we observe a zone where the RBCs become slightly depleted. The microparticle concentration along the branches first increases slightly and right at the confluence a strong peak develops. In the main channel the microparticles have a nearly constant concentration.
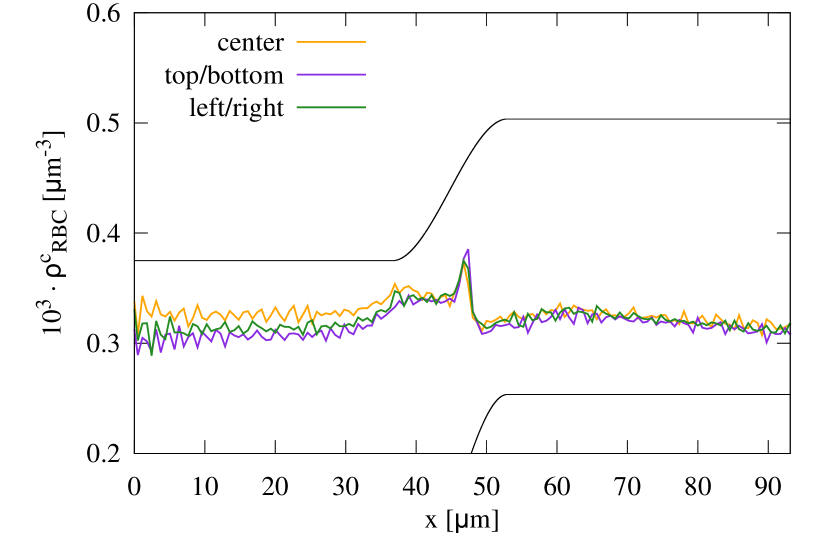
In order to elucidate red blood cell behavior further and, especially, in order to explain the peak in microparticle concentration we label the cells/particles while entering the branches as explained in the Methods section. The concentrations for the labeled cells and particles are shown in figure 6.
a)
 b)
b)
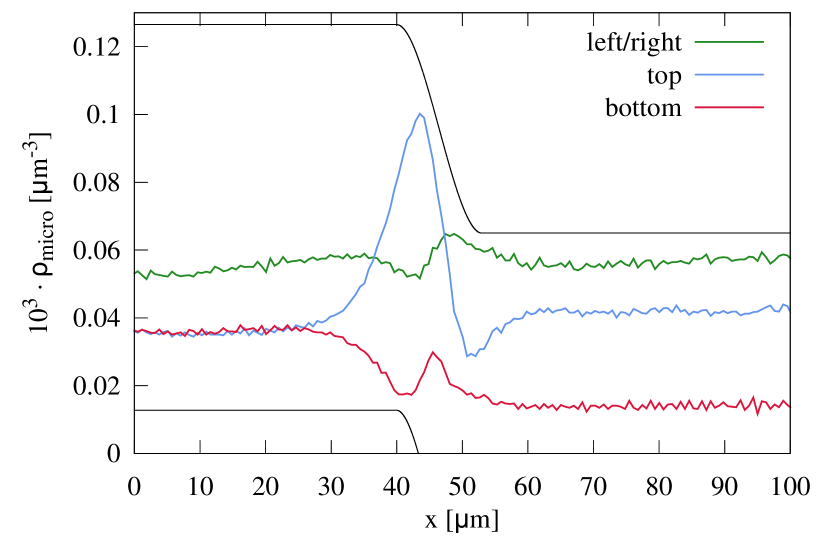
The red blood cells in the center, those left/right and those at the bottom of the branches behave in a similar fashion: at the end of the branches they are accelerated and thus have a decreased concentration. After a small peak, they quickly reach a constant concentration in the main channel. Only the cells arriving at the top exhibit a slightly increasing concentration at the end of the branches, but are depleted, as well, at the site of the confluence. Microparticles arriving left/right or at the bottom show a similar concentration profile as the corresponding red blood cells and thus do not cause the peak in overall concentration in figure 5. We note that these concentration profiles can be understood by passive tracer particles similar as in constricted channels [8] and as detailed in the Supplemental Information. From figure 6 b) we are thus able to conclude that the peak stems from the microparticles flowing at the top of the branches. The concentration of these microparticles increases more than two-fold compared to the branches and the main channel. Due to the margination the microparticles are located right besides the wall. Also the concentration profile of the microparticles at the top can be reproduced by passive tracer particles as done in the Supplement Information. Thus, the local increase in microparticle concentration can be understood by the underlying flow profile.
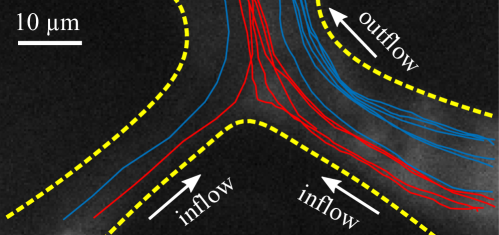
In vivo observation of microparticle anti-margination
To demonstrate the relevance of the anti-margination observed in our simulations, we inject fluorescent beads into living mice and image their behavior when flowing through a microvessel confluence. In figure 7 we show a set of trajectories obtained from the video microscopy images (a corresponding movie is included as Supplemental Information). In agreement with the predictions of our numerical simulations, beads which are initially marginated at the outer walls (blue lines in figure 7) remain marginated whereas beads located initially at the inner walls (red lines in figure 7) undergo anti-margination and end up near the channel center after passing through the confluence.
Channel bifurcation
Next, a bifurcation is investigated as depicted in figure 1 a) right. The suspension of red blood cells and microparticles flows through a straight channel of radius branching into two daughter channels of radius . Main channel and the combined branches have the same cross-sectional area and the centerlines of the two branches are separated by . The transition zone from the end of the main channel to the beginning of the branches is about .
a) b)
c) d)
Cell and particle distribution
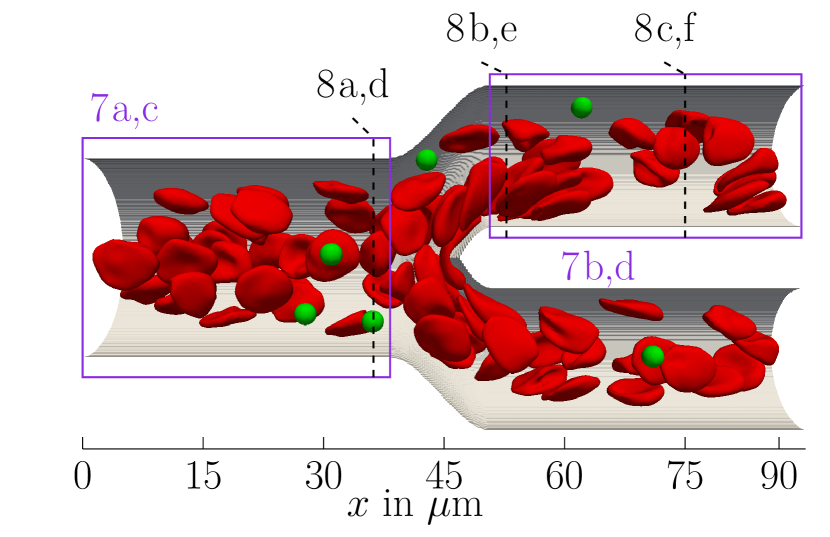
In figure 8 we first investigate the two-dimensional concentration of red blood cells and microparticles along the flow direction. At the very beginning around we again observe a homogeneous red blood cell distribution (figure 8 a)) around the center and the cell-free layer with vanishing red blood cell concentration near the wall. Approaching the bifurcation the cell-free layer decreases. The decrease in cell-free layer is of the same amount at both locations near the upper boundary and near the lower boundary. It can be straightforwardly explained by the bifurcating geometry which causes the red blood cells to flow upwards/downwards into the daughter channels. This motion into the daughter channels starts already about 10 m before the end of the main channel and makes the cells migrate towards the outer wall.
An asymmetry in the cell-free layer occurs inside the daughter channels (figure 8 b)) as also observed in recent work [53, 65]. The asymmetry is especially pronounced at the beginning of the branches stemming from cells flowing in the center of the main channel, which enter either the upper or lower branch near the inner wall. We observe a strongly decreased cell free layer near the inner boundary right at the beginning of the daughter branches. The thickness of the cell-free layer near the outer boundary increases correspondingly. After about 10 m the inner and outer cell-free layers both reach a constant value, which is similar to the length scale for the re-establishment of the outer cell-free layer after the confluence. Interestingly, the inner and outer cell-free layers do remain asymmetric and retain this asymmetry until the very end of our channel about 50 m behind the bifurcation.
Although the cell-free layer decreases at the end of the main channel hardly an effect is observed on microparticle behavior. Entering the branches the microparticle concentration peak only becomes more blurred because of the microparticles located near the upper boundary entering the larger cell-free layer inside the branch.
The asymmetries in cell and particle distribution can be seen in more detail in the 2D cross-section profiles in figure 9. At the end of the main channel in figure 9 a) the red blood cell distribution is still circular with only small deviations corresponding to the decrease in cell-free layer seen in figure 8 a). At the beginning of the branch the circular red blood cell concentration is strongly shifted towards the inner boundary in figure 9 b) and a less pronounced, but still clearly visible asymmetry is still present at the end of the branch in figure 9 c). Furthermore, a local spot with increased red blood cell concentration is observed near the inner boundary.
While the microparticles are hardly affected at the end of the main channel (figure 9 d)) a notable effect is the vanishing concentration of microparticles near the inner boundary of the branches in figure 9 e) and f). Over an angle-range of about 90 degrees at the bottom of figure 9 e) and f) the microparticle concentration vanishes completely. The vanishing microparticle concentration can be understood by the radial distribution in the main channel due to margination: in order to reach positions near the lower boundary of the branch the microparticles would have to be located near the center of the main channel, which is not the case because of margination. Thus, we report a region within the branches that posses vanishing microparticle concentration in comparison to a simple straight channel.
Axial concentration
As for the confluence, we now investigate the behavior of cells and particles along the varying geometry by 1D axial concentration profiles in figure 10. After a constant plateau inside the main channel both red blood cells and microparticles show a clear peak ahead of the apex of the bifurcation. Inside the branches the red blood cells take the same concentration as in the main channel while the microparticle concentration decreases. The latter can be explained by the intrinsic velocity profile: flowing besides the boundary the stiff microparticles cover a certain ring of tube diameter along the boundary. Due to the fixed particle size this ring has the same diameter in the main channel and within the branches. Assuming a Poiseuille flow and averaging over such a ring around the boundary leads to a higher flow rate inside the branches, since they cover a larger part of the steep velocity profile. Thus, within the branch the microparticles experience a larger velocity, leading to lower residence time thereby causing a decreasing concentration.
a)
 b)
b)
We furthermore distinguish the cells and particles regarding their position inside the main channel and calculate the axial concentration profiles for each cell/particle fraction in figure 11 a) and b). All fractions of red blood cells behave in a similar manner with a small peak at the apex. This peak stems from cells being trapped at the apex of the bifurcation: arriving in the center of the main channel, red blood cells have to break symmetry and decide for one branch. As visible in figure 1 a) right some cells flow directly onto the apex and are trapped there before flowing in one of both branches, a phenomenon called ”lingering” in [3]. We note that also the red blood cells at the top/bottom show a peak, because they are still located close enough to the center to be influenced by more central cells getting trapped at the apex.
In full analogy, a similar peak is observed for microparticles located left/right in figure 1 b). Also these microparticles flow onto the apex and become trapped for a short period of time. In contrast, the microparticles located top/bottom are diluted at the bifurcation. After a subsequent little dip in concentration, microparticles from both regions quickly reach a constant concentration inside the branches.
The concentration profile of both cells and particles can be understood again by considering tracer particles (see Supplemental Information).
Influence of hematocrit
In the following we present simulations which have the same geometrical properties as the channels in figure 1 but with a hematocrit of for the inflow.
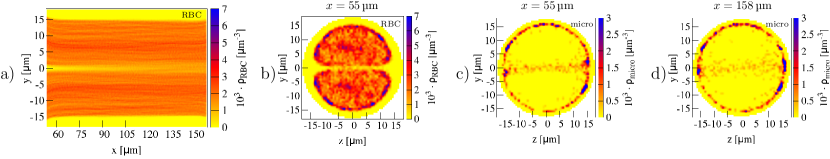
Figure 12 shows that behind the confluence of two branches the red blood cell distribution behaves qualitatively similar as for the lower hematocrit. Although the cell-free layer near the vessel wall is reduced compared to figure 3 b) the cell-free layer in the center of the main channel in figure 12 a) is of about the same size. Only at the left and right of the cross-section the cell-free space clearly reduces compared to lower hematocrit (figure 12 b)). The central cell-free layer is very pronounced up to 40 m behind the confluence, but becomes blurred slightly faster towards the end of the channel when compared to the low hematocrit case. This faster decay can be explained by the larger shear-induced diffusion coefficient of m2/s. This agrees with the theoretical expectation that the shear-induced diffusion coefficient depends on the number of cell-cell collision and thus on the cell concentration [14, 36]. The microparticles are still located in the cell-free layer in the center all along the main channel as can be seen in figure 12 c) and d). We can again calculate the fraction of anti-marginated microparticles and obtain the fractions 0.145 at m and 0.137 at m. Also when we compare the axial concentration of labeled red blood cells and microparticles in figure 13 a) and b) to the case of lower hematocrit in figure 6 we see similar behavior in both cases.
a)
 b)
b)
c)
 d)
d)
When we investigate the influence of larger hematocrit on the system with bifurcation, we find that each cell-free layer in the system decreases with increasing hematocrit (results shown in the Supplemental Information). At the end of the main channel the cell-free layer still decreases and the pronounced asymmetry of cell-free layers within the branches is present. The increase in concentration due to the apex of the bifurcation remains unaffected by larger hematocrit as seen in figure 13 c) and d). Since a certain number of cells or microparticles stacks at the apex of the bifurcation the effect is not modified when more cells are added to the system. Especially, the absolute number of cells in the center region stays approximately the same for larger hematocrit.
Asymmetric bifurcations
We finally touch briefly on the subject of asymmetric bifurcations. For this, we keep the main channel radius and the upper branch as in figure 1 right and only vary the diameter of the lower branch. Two different simulations are done with radius and . Here, we focus on the total concentration of red blood cells and microparticles within the two branches as listed in table 1.
| 1.027 | 0.794 | 0.0711 | 0.0792 | |
| 1.005 | 0.674 | 0.0722 | 0.0806 |
The red blood cell concentration clearly differs between the upper and lower branch. The upper branch, being the one with larger flow rate, receives clearly more cells than the lower branch. This effect is enhanced when the diameter and correspondingly the flow rate further decreases as in the case of . The fraction of concentration between lower and upper branch changes from to when changing from 8 to 5.5 m. We note that the total flow rate at the outflow of the system is the same in both simulations to match the flow rate at the entrance. As a consequence, the flow rate in the upper branch slightly differs in both simulations (the fraction of flow rates is 0.5 and 0.26, respectively). The asymmetric distribution of red blood cells qualitatively matches with the Zweifach-Fung effect observed earlier [68, 55, 76, 4] and can be attributed to the cell-free layer [76] combined with RBC deformability.
In contrast to the asymmetric red blood cell distribution microparticles are nearly evenly distributed to the daughter channels. Furthermore, the distribution is not affected by decreasing the diameter of the lower branch, the fraction in both cases being about . Since the stiff microparticles are located within the cell-free layer the different flow rate does not affect their distribution. Although the lower branch is significantly smaller the apex of the bifurcation and thus the separation line between the two branches is located near the center of the main channel by construction of the geometry. Thus, arriving near the wall only the microparticles located around the equator are drawn into the upper branch by the flow while all other microparticles may distribute equally into the branches. All in all, the microparticles exhibit a very similar concentration in both branches.
Conclusion
We used a 3D Lattice-Boltzmann-Immersed-Boundary method with inflow/outflow boundary conditions to investigate a mixed suspension of red blood cells and stiff particles flowing through a vessel confluence as well as a vessel bifurcation. The stiff particles can be regarded as models for synthetic drug delivery agents or naturally occuring stiff cells such as platelets. In agreement with earlier studies, we observe and quantify the formation of a pronounced central cell-free layer behind the confluence of two vessels. We find that the central cell-free layer is very stable being still observable even 100 m after the confluence. As a consequence, we show that stiff particles at the confluence are strongly redistributed. Although all stiff particles arrive on a marginated position inside the well-known near-wall cell free layer, while transversing the confluence a significant fraction of them undergoes anti-margination ending up trapped in the central cell-free layer near the channel center. This position is retained even longer than the 100 m life time of the central cell-free layer itself. Calculating the fraction of anti-marginated microparticles we found that more than 13% of the particles are located around the center 100 m behind a confluence. Under the assumption that at the succeeding confluence this fraction of microparticles is still anti-marginated we estimate that after 5 confluences half of the initially completely marginated particles is now evenly distributed across the cross-section of the channel. In contrast, a bifurcating geometry is found to not significantly influence the margination propensity of stiff particles. For the confluence, we also conducted in vivo measurements which proved the relevance of anti-margination of stiff microparticles in living mice.
In previous in vivo studies platelets have been observed to be mainly located near the wall in arterioles [84, 94] but not in venules where the platelet concentration was rather continuous across vessel diameter. In a similar direction, the recent work of Casa et al. [10] found that thrombi were platelet rich on the arterial but not on the venous side of the blood vessel network. Our present findings may provide an explanation for these observations. On the arterial side, the microvascular network consists mainly of bifurcations from larger into smaller and smaller vessels which, according to our findings, do not significantly disturb the margination propensity of platelets. On the venous side, however, small channels frequently merge into larger ones. At such confluences, our results clearly demonstrated anti-margination, i.e., a tendency of platelets to be forced into the center of the vessel. In a network with a cascade of confluences being only 400-1000 m apart [70, 35] the platelet margination near the channel wall will be further and further disturbed, ending up finally in a rather continuous concentration profile and thus explaining the experimental observations of ref. [94] and [10].
Author Contributions
C.B. performed research, analyzed data, wrote the manuscript. L.S. contributed to simulation tools. S.G. designed research, wrote the manuscript. A.K. performed image treatment and data analysis, C.W. designed and interpreted research. L.K. and M.W.L. designed and performed the in vivo experiments.
Acknowledgments
The authors thank the Gauss Centre for Supercomputing e.V. for providing computing time on the GCS Supercomputer SuperMUC at the Leibniz Supercomputing Centre.
This work was supported by the Volkswagen Foundation.
We gratefully acknowledge the Elite Study Program Biological Physics and the Studienstiftung des deutschen Volkes.
Supplemental Information
An online Supplemental Information to this article can be found by visiting BJ Online at http://www.biophysj.org.
References
- Aidun and Clausen [2010] C. K. Aidun and J. R. Clausen. Lattice-boltzmann method for complex flows. Annual Review of Fluid Mechanics, 42(1):439–472, 2010.
- Arnold et al. [2013] A. Arnold, O. Lenz, S. Kesselheim, R. Weeber, F. Fahrenberger, D. Roehm, P. Košovan, and C. Holm. Espresso 3.1: Molecular dynamics software for coarse-grained models. In Meshfree methods for partial differential equations VI, pages 1–23. Springer Berlin Heidelberg, 2013.
- Balogh and Bagchi [2017a] P. Balogh and P. Bagchi. Direct numerical simulation of cellular-scale blood flow in 3d microvascular networks. Biophysical Journal, 113(12):2815–2826, 2017a.
- Balogh and Bagchi [2017b] P. Balogh and P. Bagchi. A computational approach to modeling cellular-scale blood flow in complex geometry. Journal of Computational Physics, 334:280–307, 2017b.
- Barber et al. [2011] J. O. Barber, J. M. Restrepo, and T. W. Secomb. Simulated Red Blood Cell Motion in Microvessel Bifurcations: Effects of Cell–Cell Interactions on Cell Partitioning. Cardiovasc Eng Tech, 2(4):349–360, Oct. 2011.
- Barthès-Biesel [2011] D. Barthès-Biesel. Modeling the motion of capsules in flow. Current Opinion in Colloid & Interface Science, 16(1):3 – 12, 2011.
- Brust et al. [2014] M. Brust, O. Aouane, M. Thiébaud, D. Flormann, C. Verdier, L. Kaestner, M. Laschke, H. Selmi, A. Benyoussef, T. Podgorski, et al. The plasma protein fibrinogen stabilizes clusters of red blood cells in microcapillary flows. Scientific reports, 4:4348, 2014.
- Bächer et al. [2017] C. Bächer, L. Schrack, and S. Gekle. Clustering of microscopic particles in constricted blood flow. Physical Review Fluids, 2(1):013102, 2017.
- Carboni et al. [2016] E. J. Carboni, B. H. Bognet, G. M. Bouchillon, A. L. Kadilak, L. M. Shor, M. D. Ward, and A. W. Ma. Direct Tracking of Particles and Quantification of Margination in Blood Flow. Biophysical Journal, 111(7):1487–1495, 2016.
- Casa et al. [2015] L. D. C. Casa, D. H. Deaton, and D. N. Ku. Role of high shear rate in thrombosis. J. Vasc. Surg., 61(4):1068–1080, 2015.
- Charoenphol et al. [2010] P. Charoenphol, R. B. Huang, and O. Eniola-Adefeso. Potential role of size and hemodynamics in the efficacy of vascular-targeted spherical drug carriers. Biomaterials, 31(6):1392 – 1402, 2010.
- Chen et al. [2013] H. Chen, J. I. Angerer, M. Napoleone, A. J. Reininger, S. W. Schneider, A. Wixforth, M. F. Schneider, and A. Alexander-Katz. Hematocrit and flow rate regulate the adhesion of platelets to von willebrand factor. Biomicrofluidics, 7(6), 2013.
- Crowl and Fogelson [2011] L. Crowl and A. L. Fogelson. Analysis of mechanisms for platelet near-wall excess under arterial blood flow conditions. Journal of fluid mechanics, 676:348–375, 2011.
- Da Cunha and Hinch [1996] F. R. Da Cunha and E. J. Hinch. Shear-induced dispersion in a dilute suspension of rough spheres. Journal of Fluid Mechanics, 309:211–223, 1996.
- Daddi-Moussa-Ider et al. [2016] A. Daddi-Moussa-Ider, A. Guckenberger, and S. Gekle. Long-lived anomalous thermal diffusion induced by elastic cell membranes on nearby particles. Phys. Rev. E, 93(1):012612, 2016.
- D’Apolito et al. [2015a] R. D’Apolito, F. Taraballi, S. Minardi, X. Liu, S. Caserta, A. Cevenini, E. Tasciotti, G. Tomaiuolo, and S. Guido. Microfluidic interactions between red blood cells and drug carriers by image analysis techniques. Medical Engineering and Physics, 38:17–23, 2015a.
- D’Apolito et al. [2015b] R. D’Apolito, G. Tomaiuolo, F. Taraballi, S. Minardi, D. Kirui, X. Liu, A. Cevenini, R. Palomba, M. Ferrari, F. Salvatore, E. Tasciotti, and S. Guido. Red blood cells affect the margination of microparticles in synthetic microcapillaries and intravital microcirculation as a function of their size and shape. Journal of Controlled Release, 217(C):263–272, 2015b.
- Dünweg and Ladd [2008] B. Dünweg and A. J. Ladd. Advanced Computer Simulation Approaches for Soft Matter Sciences III, chapter Lattice Boltzmann Simulations of Soft Matter Systems, pages 89–166. Springer, 2008.
- Eckstein et al. [1988] E. C. Eckstein, A. W. Tilles, and F. J. M. III. Conditions for the occurrence of large near-wall excesses of small particles during blood flow. Microvascular Research, 36(1):31 – 39, 1988.
- Faivre et al. [2006] M. Faivre, M. Abkarian, K. Bickraj, and H. A. Stone. Geometrical focusing of cells in a microfluidic device: an approach to separate blood plasma. Biorheology, 43(2):147–159, 2006.
- Fay et al. [2016] M. E. Fay, D. R. Myers, A. Kumar, C. T. Turbyfield, R. Byler, K. Crawford, R. G. Mannino, A. Laohapant, E. A. Tyburski, Y. Sakurai, M. J. Rosenbluth, N. A. Switz, T. A. Sulchek, M. D. Graham, and W. A. Lam. Cellular softening mediates leukocyte demargination and trafficking, thereby increasing clinical blood counts. Proceedings of the National Academy of Sciences, 113(8):1987–1992, 2016.
- Fedosov and Gompper [2014] D. A. Fedosov and G. Gompper. White blood cell margination in microcirculation. Soft Matter, 10:2961–2970, 2014.
- Fedosov et al. [2010] D. A. Fedosov, B. Caswell, A. S. Popel, and G. E. Karniadakis. Blood flow and cell-free layer in microvessels. Microcirculation, 17:615–628, 2010.
- Fedosov et al. [2012] D. A. Fedosov, J. Fornleitner, and G. Gompper. Margination of white blood cells in microcapillary flow. Phys. Rev. Lett., 108:028104, 2012.
- Fedosov et al. [2014] D. A. Fedosov, M. Peltomäki, and G. Gompper. Deformation and dynamics of red blood cells in flow through cylindrical microchannels. Soft matter, 10(24):4258–4267, 2014.
- Fitzgibbon et al. [2015] S. Fitzgibbon, A. P. Spann, Q. M. Qi, and E. S. G. Shaqfeh. In Vitro Measurement of Particle Margination in the Microchannel Flow: Effect of Varying Hematocrit. Biophys J, 108(10):2601–2608, 2015.
- Freund [2007] J. B. Freund. Leukocyte margination in a model microvessel. Physics of Fluids, 19(2), 2007.
- Freund [2014] J. B. Freund. Numerical simulation of flowing blood cells. Annual Review of Fluid Mechanics, 46(1):67–95, 2014.
- Freund and Orescanin [2011] J. B. Freund and M. M. Orescanin. Cellular flow in a small blood vessel. J Fluid Mech, 671:466–490, 2011.
- Freund and Shapiro [2012] J. B. Freund and B. Shapiro. Transport of particles by magnetic forces and cellular blood flow in a model microvessel. Phys. Fluids, 24(5):051904–12, 2012.
- Fujiwara et al. [2009] H. Fujiwara, T. Ishikawa, R. Lima, N. Matsuki, Y. Imai, H. Kaji, M. Nishizawa, and T. Yamaguchi. Red blood cell motions in high-hematocrit blood flowing through a stenosed microchannel. J Biomechanics, 42(7):838–843, 2009.
- Fung [1973] Y.-C. Fung. Stochastic flow in capillary blood vessels. Microvascular research, 5(1):34–48, 1973.
- Gekle [2016] S. Gekle. Strongly accelerated margination of active particles in blood flow. Biophysical Journal, 110(2):514 – 520, 2016.
- Goldsmith and Marlow [1979] H. Goldsmith and J. Marlow. Flow behavior of erythrocytes. ii. particle motions in concentrated suspensions of ghost cells. Journal of Colloid and Interface Science, 71(2):383–407, 1979.
- Gompper and Fedosov [2015] G. Gompper and D. A. Fedosov. Modeling microcirculatory blood flow: current state and future perspectives. WIREs Syst Biol Med, 8(2):157–168, 2015.
- Grandchamp et al. [2013] X. Grandchamp, G. Coupier, A. Srivastav, C. Minetti, and T. Podgorski. Lift and Down-Gradient Shear-Induced Diffusion in Red Blood Cell Suspensions. Phys. Rev. Lett., 110(10):108101, 2013.
- Guckenberger and Gekle [2017] A. Guckenberger and S. Gekle. Theory and algorithms to compute Helfrich bending forces: A review. Journal of Physics: Condensed Matter, 29(20):203001, 2017.
- Guckenberger et al. [2016] A. Guckenberger, M. P. Schraml, P. G. Chen, M. Leonetti, and S. Gekle. On the bending algorithms for soft objects in flows. Computer Physics Communications, 207:1–23, 2016.
- Guckenberger et al. [2018] A. Guckenberger, A. Kihm, T. John, C. Wagner, and S. Gekle. Numerical-experimental observation of shape bistability of red blood cells flowing in a microchannel. Soft Matter, 14:2032–2043, 2018.
- Henríquez Rivera et al. [2015] R. G. Henríquez Rivera, K. Sinha, and M. D. Graham. Margination regimes and drainage transition in confined multicomponent suspensions. Phys. Rev. Lett., 114:188101, 2015.
- Henríquez Rivera et al. [2016] R. G. Henríquez Rivera, X. Zhang, and M. D. Graham. Mechanistic theory of margination and flow-induced segregation in confined multicomponent suspensions: Simple shear and Poiseuille flows. Physical Review Fluids, 1(6), 2016.
- Jain and Munn [2009] A. Jain and L. L. Munn. Determinants of leukocyte margination in rectangular microchannels. PLoS One, 4(9):e7104, 2009.
- Katanov et al. [2015] D. Katanov, G. Gompper, and D. A. Fedosov. Microvascular blood flow resistance: Role of red blood cell migration and dispersion. Microvasc. Res., 99(C):57–66, 2015.
- Krüger [2016] T. Krüger. Effect of tube diameter and capillary number on platelet margination and near-wall dynamics. Rheologica Acta, 55(6):511–526, 2016.
- Kumar and Graham [2011] A. Kumar and M. D. Graham. Segregation by membrane rigidity in flowing binary suspensions of elastic capsules. Phys. Rev. E, 84:066316, 2011.
- Kumar and Graham [2012a] A. Kumar and M. D. Graham. Mechanism of margination in confined flows of blood and other multicomponent suspensions. Phys. Rev. Lett., 109:108102, 2012a.
- Kumar and Graham [2012b] A. Kumar and M. D. Graham. Margination and segregation in confined flows of blood and other multicomponent suspensions. Soft Matter, 8:10536–10548, 2012b.
- Kumar et al. [2014] A. Kumar, R. G. H. Rivera, and M. D. Graham. Flow-induced segregation in confined multicomponent suspensions: effects of particle size and rigidity. Journal of Fluid Mechanics, 738:423–462, 2014.
- Laschke and Menger [2016] M. Laschke and M. Menger. The dorsal skinfold chamber: a versatile tool for preclinical research in tissue engineering and regenerative medicine. Eur Cell Mater, 32:202–215, 2016.
- Laschke et al. [2011] M. Laschke, B. Vollmar, and M. Menger. The dorsal skinfold chamber: window into the dynamic interaction of biomaterials with their surrounding host tissue. Eur Cell Mater, 22(147):e64, 2011.
- Leble et al. [2011] V. Leble, R. Lima, R. Dias, C. Fernandes, T. Ishikawa, Y. Imai, and T. Yamaguchi. Asymmetry of red blood cell motions in a microchannel with a diverging and converging bifurcation. Biomicrofluidics, 5(4):044120, 2011.
- Lee et al. [2013] T.-R. Lee, M. Choi, A. M. Kopacz, S.-H. Yun, W. K. Liu, and P. Decuzzi. On the near-wall accumulation of injectable particles in the microcirculation: smaller is not better. Sci. Rep., 3:2079, 2013.
- Li et al. [2012] X. Li, A. S. Popel, and G. E. Karniadakis. Blood–plasma separation in y-shaped bifurcating microfluidic channels: a dissipative particle dynamics simulation study. Physical biology, 9(2):026010, 2012.
- Limbach et al. [2006] H. Limbach, A. Arnold, B. Mann, and C. Holm. Espresso—an extensible simulation package for research on soft matter systems. Computer Physics Communications, 174(9):704 – 727, 2006.
- Lykov et al. [2015] K. Lykov, X. Li, H. Lei, I. V. Pivkin, and G. E. Karniadakis. Inflow/Outflow Boundary Conditions for Particle-Based Blood Flow Simulations: Application to Arterial Bifurcations and Trees. PLOS Computational Biology, 11(8):e1004410, 2015.
- Mehrabadi et al. [2016] M. Mehrabadi, D. N. Ku, and C. K. Aidun. Effects of s hear rate, confinement, and particle parameters on margination in blood flow. Phys. Rev. E, 93:023109, 2016.
- Migliorini et al. [2002] C. Migliorini, Y. Qian, H. Chen, E. B. Brown, R. K. Jain, and L. L. Munn. Red blood cells augment leukocyte rolling in a virtual blood vessel. Biophysical Journal, 83(4):1834 – 1841, 2002.
- Misbah and Wagner [2013] C. Misbah and C. Wagner. Living fluids. Comptes Rendus Physique, 14(6):447 – 450, 2013. Living fluids / Fluides vivants.
- Mittal and Iaccarino [2005] R. Mittal and G. Iaccarino. Immersed boundary methods. Annual Review of Fluid Mechanics, 37(1):239–261, 2005.
- Mountrakis et al. [2013] L. Mountrakis, E. Lorenz, and A. G. Hoekstra. Where do the platelets go? a simulation study of fully resolved blood flow through aneurysmal vessels. Interface Focus, 3(2), 2013.
- Müller et al. [2014] K. Müller, D. A. Fedosov, and G. Gompper. Margination of micro-and nano-particles in blood flow and its effect on drug delivery. Scientific reports, 4:4871, 2014.
- Müller et al. [2016] K. Müller, D. A. Fedosov, and G. Gompper. Understanding particle margination in blood flow: A step toward optimized drug delivery systems. Medical Engineering & Physics, 38(1):2 – 10, 2016. Micro and Nano Flows 2014 (MNF2014) - Biomedical Stream.
- Namdee et al. [2013] K. Namdee, A. J. Thompson, P. Charoenphol, and O. Eniola-Adefeso. Margination Propensity of Vascular-Targeted Spheres from Blood Flow in a Microfluidic Model of Human Microvessels. Langmuir, 29(8):2530–2535, 2013.
- Namgung et al. [2017] B. Namgung, Y. C. Ng, H. L. Leo, J. M. Rifkind, and S. Kim. Near-wall migration dynamics of erythrocytes in vivo: Effects of cell deformability and arteriolar bifurcation. Frontiers in Physiology, 8:963, 2017.
- Ng et al. [2016] Y. C. Ng, B. Namgung, S. L. Tien, H. L. Leo, and S. Kim. Symmetry recovery of cell-free layer after bifurcations of small arterioles in reduced flow conditions: effect of rbc aggregation. American Journal of Physiology-Heart and Circulatory Physiology, 311(2):H487–H497, 2016.
- Peskin [2002] C. S. Peskin. The immersed boundary method. Acta numerica, 11:479–517, 2002.
- Popel and Johnson [2005] A. S. Popel and P. C. Johnson. Microcirculation and hemorheology. Annual review of fluid mechanics, 37:43, 2005.
- Pries et al. [1989] A. Pries, K. Ley, M. Claassen, and P. Gaehtgens. Red cell distribution at microvascular bifurcations. Microvascular research, 38(1):81–101, 1989.
- Pries et al. [1996] A. Pries, T. W. Secomb, and P. Gaehtgens. Biophysical aspects of blood flow in the microvasculature. Cardiovascular research, 32(4):654–667, 1996.
- Pries and Secomb [2008] A. R. Pries and T. W. Secomb. Chapter 1 Blood Flow in Microvascular Networks. In Microcirculation, pages 3–36. Elsevier, Jan. 2008.
- Qi and Shaqfeh [2018] Q. M. Qi and E. S. Shaqfeh. Time-dependent particle migration and margination in the pressure-driven channel flow of blood. Physical Review Fluids, 3(3):034302, 2018.
- Qi and Shaqfeh [2017] Q. M. Qi and E. S. G. Shaqfeh. Theory to predict particle migration and margination in the pressure-driven channel flow of blood. Physical Review Fluids, 2(9), 2017.
- Reasor et al. [2013] D. A. Reasor, M. Mehrabadi, D. N. Ku, and C. K. Aidun. Determination of critical parameters in platelet margination. Annals of Biomedical Engineering, 41(2):238–249, 2013.
- Roehm and Arnold [2012] D. Roehm and A. Arnold. Lattice boltzmann simulations on gpus with espresso. The European Physical Journal Special Topics, 210(1):89–100, 2012.
- Schmid-Schönbein et al. [1980] G. W. Schmid-Schönbein, S. Usami, R. Skalak, and S. Chien. The interaction of leukocytes and erythrocytes in capillary and postcapillary vessels. Microvascular Research, 19(1):45 – 70, 1980.
- Secomb [2017] T. W. Secomb. Blood Flow in the Microcirculation. Annual Review of Fluid Mechanics, 49(1):443–461, 2017.
- Shen et al. [2016] Z. Shen, G. Coupier, B. Kaoui, B. Polack, J. Harting, C. Misbah, and T. Podgorski. Inversion of hematocrit partition at microfluidic bifurcations. Microvascular research, 105:40–46, 2016.
- Skorczewski et al. [2013] T. Skorczewski, L. C. Erickson, and A. L. Fogelson. Platelet motion near a vessel wall or thrombus surface in two-dimensional whole blood simulations. Biophysical journal, 104(8):1764–1772, 2013.
- Spann et al. [2016] A. P. Spann, J. E. Campbell, S. R. Fitzgibbon, A. Rodriguez, A. P. Cap, L. H. Blackbourne, and E. S. G. Shaqfeh. The Effect of Hematocrit on Platelet Adhesion: Experiments and Simulations. Biophys J, 111(3):577–588, 2016.
- Succi [2001] S. Succi. The lattice Boltzmann equation: for fluid dynamics and beyond. Oxford university press, 2001.
- Sun and Munn [2008] C. Sun and L. L. Munn. Lattice-boltzmann simulation of blood flow in digitized vessel networks. Computers & Mathematics with Applications, 55(7):1594–1600, 2008.
- Svanes and Zweifach [1968] K. Svanes and B. Zweifach. Variations in small blood vessel hematocrits produced in hypothermic rats by micro-occlusion. Microvascular Research, 1(2):210–220, 1968.
- Tan et al. [2012] J. Tan, A. Thomas, and Y. Liu. Influence of red blood cells on nanoparticle targeted delivery in microcirculation. Soft matter, 8(6):1934–1946, 2012.
- Tangelder et al. [1985] G. Tangelder, H. C. Teirlinck, D. W. Slaaf, and R. S. Reneman. Distribution of blood platelets flowing in arterioles. American Journal of Physiology-Heart and Circulatory Physiology, 248(3):H318–H323, 1985.
- Tokarev et al. [2011] A. Tokarev, A. Butylin, E. Ermakova, E. Shnol, G. Panasenko, and F. Ataullakhanov. Finite platelet size could be responsible for platelet margination effect. Biophysical Journal, 101(8):1835 – 1843, 2011.
- Tripathi et al. [2015] S. Tripathi, Y. B. V. Kumar, A. Prabhakar, S. S. Joshi, and A. Agrawal. Passive blood plasma separation at the microscale: a review of design principles and microdevices. Journal of Micromechanics and Microengineering, 25(8):083001, 2015.
- Turitto and Baumgartner [1975] V. Turitto and H. Baumgartner. Platelet deposition on subendothelium exposed to flowing blood: mathematical analysis of physical parameters. ASAIO Journal, 21(1):593–601, 1975.
- Vahidkhah and Bagchi [2015] K. Vahidkhah and P. Bagchi. Microparticle shape effects on margination, near-wall dynamics and adhesion in a three-dimensional simulation of red blood cell suspension. Soft Matter, 11(11):2097–2109, 2015.
- Vahidkhah et al. [2014] K. Vahidkhah, S. L. Diamond, and P. Bagchi. Platelet Dynamics in Three-Dimensional Simulation of Whole Blood. Biophys J, 106(11):2529–2540, 2014.
- Vahidkhah et al. [2016] K. Vahidkhah, P. Balogh, and P. Bagchi. Flow of red blood cells in stenosed microvessels. Scientific Reports, 6:28194, 2016.
- Wang et al. [2013a] G. Wang, W. Mao, R. Byler, K. Patel, C. Henegar, A. Alexeev, and T. Sulchek. Stiffness dependent separation of cells in a microfluidic device. PLoS One, 8(10):e75901, 2013a.
- Wang et al. [2016] T. Wang, U. Rongin, and Z. Xing. A micro-scale simulation of red blood cell passage through symmetric and asymmetric bifurcated vessels. Scientific reports, 6, 2016.
- Wang et al. [2013b] W. Wang, T. G. Diacovo, J. Chen, J. B. Freund, and M. R. King. Simulation of Platelet, Thrombus and Erythrocyte Hydrodynamic Interactions in a 3D Arteriole with In Vivo Comparison. PLoS ONE, 8(10):e76949–11, 2013b.
- Woldhuis et al. [1992] B. Woldhuis, G. Tangelder, D. W. Slaaf, and R. S. Reneman. Concentration profile of blood platelets differs in arterioles and venules. American Journal of Physiology-Heart and Circulatory Physiology, 262(4):H1217–H1223, 1992.
- Wu et al. [2017] W.-T. Wu, Y. Li, N. Aubry, M. Massoudi, and J. F. Antaki. Numerical simulation of red blood cell-induced platelet transport in saccular aneurysms. Applied Sciences, 7(5):484, 2017.
- Yang et al. [2011] X. Yang, O. Forouzan, J. M. Burns, and S. S. Shevkoplyas. Traffic of leukocytes in microfluidic channels with rectangular and rounded cross-sections. Lab on a Chip, 11(19):3231–3240, 2011.
- Yazdani and Karniadakis [2016] A. Yazdani and G. E. Karniadakis. Sub-cellular modeling of platelet transport in blood flow through microchannels with constriction. Soft Matter, 12:4339–4351, 2016.
- Zhao and Shaqfeh [2011] H. Zhao and E. S. G. Shaqfeh. Shear-induced platelet margination in a microchannel. Phys. Rev. E, 83:061924, 2011.
- Zhao et al. [2012] H. Zhao, E. S. G. Shaqfeh, and V. Narsimhan. Shear-induced particle migration and margination in a cellular suspension. Physics of Fluids, 24(1), 2012.
- Zhao et al. [2008] R. Zhao, J. Marhefka, F. Shu, S. Hund, M. Kameneva, and J. Antaki. Micro-flow visualization of red blood cell-enhanced platelet concentration at sudden expansion. Annals of Biomedical Engineering, 36(7):1130–41, 2008.
See pages - of si.pdf