Resolving the Inner Arcsecond of the RY Tau Jet with HST
Abstract
Faint X-ray emission from hot plasma (Tx 106 K) has been detected extending outward a few arcseconds along the optically-delineated jets of some classical T Tauri stars including RY Tau. The mechanism and location where the jet is heated to X-ray temperatures is unknown. We present high spatial resolution Hubble Space Telescope (HST) far-ultraviolet long-slit observations of RY Tau with the slit aligned along the jet. The primary objective was to search for C IV emission from warm plasma at TCIV 105 K within the inner jet (1′′) that cannot be fully-resolved by X-ray telescopes. Spatially-resolved C IV emission is detected in the blueshifted jet extending outward from the star to 1′′ and in the redshifted jet out to 0′′.5. C IV line centroid shifts give a radial velocity in the blueshifted jet of 136 10 km s-1 at an offset of 0′′.29 (39 au) and deceleration outward is detected. The deprojected jet speed is subject to uncertainties in the jet inclination but values 200 km s-1 are likely. The mass-loss rate in the blueshifted jet is at least = 2.3 10-9 M⊙ yr-1, consistent with optical determinations. We use the HST data along with optically-determined jet morphology to place meaningful constraints on candidate jet-heating models including a hot-launch model in which the jet is heated near the base to X-ray temperatures by an unspecified (but probably magnetic) process, and downstream heating from shocks or a putative jet magnetic field.
1 Introduction
Highly-collimated outflows or “jets” are a widespread phenomenon in astrophysics and have been detected in a diverse range of objects including young stars and protostars, compact binaries, planetary nebulae, and AGNs (reviewed by Livio 1999). In star-forming regions, jets are usually associated with accreting protostars, classical T Tauri stars (cTTS), and Herbig Ae/Be stars and are revealed in the optical as shock-excited Herbig-Haro (HH) objects. As such, jets provide an excellent laboratory for studying shock physics. Jets from young stars inject turbulence into the surrounding molecular cloud. Jet rotation, along with other mechanisms, may remove angular momentum from the accretion disk (reviewed by Frank et al. 2014). Possible detections of jet rotation in a few young stellar objects have been reported, a recent example being the protostellar system HH 212 (Lee et al. 2017). But searches for jet rotation signatures in RY Tau, the cTTS of primary interest here, have so far not yielded a high-confidence (3) detection (Coffey et al. 2015).
Jets from young stars have traditionally been identified and studied using optical and radio telescopes, both of which can provide sub-arcsecond resolution. Optical studies of forbidden spectral lines yield information on properties of cool (T 104 K) plasma in shocked jets. Somewhat surprisingly, much hotter X-ray plasma at temperatures Tx 106 K has now been detected at small offsets (4′′) along the jets of some young stars such as DG Tau (Güdel et al. 2005, 2008), Z CMa (Stelzer et al. 2009), RY Tau (Skinner, Audard, & Güdel 2011), and possibly RW Aur A (Skinner & Güdel 2014). Faint extended jet emission has also been reported in the vicinity of a few jet-driving protostars such as L1551 IRS 5 (Bally, Feigelson, & Reipurth 2003; Schneider, Günther, & Schmitt 2011) and Herbig-Haro objects (Pravdo et al. 2001, 2004; Favata et al. 2002; Grosso et al. 2006).
The mechanism(s) by which jets from young stars are launched, collimated, and heated are not fully understood but it is thought that magnetic fields play a key role. Shocks undoubtedly also play a role in jet heating but it is not yet clear that shocks alone can heat jets from young stars to X-ray emitting temperatures. In order to reach X-ray temperatures of a few MK, jet speeds (and shock speeds) of at least vs 300 - 400 km s-1 are required. But some jet-driving TTS for which faint extended X-ray jet emission has been detected apparently do not achieve such high jet speeds and other heating mechanisms besides shocks may be at work.
Of specific interest here is RY Tau, a relatively massive cTTS whose properties are summarized in Table 1. It is remarkable in several respects, being a rapid rotator with sin = 52 2 km s-1 (Petrov et al. 1999) and a bright variable X-ray source indicative of strong magnetic activity (Skinner, Audard, & Güdel 2016). It is undergoing disk accretion (Schegerer et al. 2008; Agra-Amboage et al. 2009) and mass loss is present from a wind (Kuhi 1964; Gómez de Castro & Verdugo 2007) and a bipolar jet known as HH 938 (St.-Onge & Bastien 2008). Searches for a companion have so far yielded negative results (Leinert et al. 1993; Schegerer et al. 2008; Pott et al. 2010).
Continuum-subtracted H images obtained by St. Onge & Bastien (2008) traced the approaching (blueshifted) jet outward to 31′′ from the star along P.A. 295∘ and inward to within 1′′.5 of the star. These images also show more distant features attributed to the receding counterjet at offsets of 2′.8 - 3′.5 from the star. A sub-arcsecond resolution ground-based study of the jet using the Canada-France-Hawaii Telescope by Agra-Amboage et al. (2009) revealed high-velocity (100 km s-1) jet plasma extending outward to at least 1′′ - 2′′ from the star. After taking into account projection effects due to the jet inclination angle to the line-of-sight ( = 61∘ 16∘) they estimated the most probable deprojected jet speed to be vjet 165 km s-1. This value is too low to explain the faint extended X-ray emission seen in deconvolved Chandra images overlapping the blueshifted jet in terms of a jet that is heated only by shocks (Skinner et al. 2011).
The above results raise the question of whether hotter and higher speed jet plasma could have escaped detection in ground-based optical studies. We investigate this possibility here by acquiring spatially-resolved far-ultraviolet (FUV) spectroscopic images of the inner jet using the HST Space Telescope Imaging Spectrograph (STIS). As discussed in more detail below, the new STIS spectra show that the jet speed is higher than measured in optical studies but is still only marginally sufficient at best to produce shock-induced X-rays.
| Sp. Type | M∗ | V | AV | Lbol | log Lx | log | d | |
|---|---|---|---|---|---|---|---|---|
| (M⊙) | (mag) | (mag) | (L⊙) | (ergs s-1) | (km s-1) | (M⊙ yr-1) | (pc) | |
| F8 III - G1-2 IV | 1.7 - 2.0 | 9.3 - 11 (v) | 2.20.2 | 15.3 | 30.5 - 31.2 | 181 | 7.30.3 | 134 |
Note. — Data are from Agra-Amboage et al. (2009), Calvet et al. (2004), Kenyon & Hartmann (1995), Petrov et al. (1999), and Schegerer et al. (2008). Spectral type is uncertain (Holtzman, Herbst, & Booth 1986). The visual extinction (AV) is from Calvet et al. (2004) but smaller values have been used in other studies (see text). The bolometric luminosity is based on Lbol = 16.7 L⊙ (d = 140 pc) from Kenyon & Hartmann (1995) and has been normalized to d = 134 pc. The X-ray luminosity Lx is from Skinner, Audard, & Güdel (2016) and is variable. The heliocentric radial velocity () is from Petrov et al. (1999) and is consistent with an earlier measurement = 16.5 2.4 km s-1 obtained by Hartmann et al. (1986). Distance is from Bertout et al. (1999).
2 Observations and Data Reduction
The HST STIS long-slit observations of RY Tau were obtained in December 2014 using the Multi-Anode Micro-channel Array (MAMA) detectors. In contrast to previous STIS observations (Calvet et al. 2004), the 52′′ 0.′′2 slit was aligned along the optical jet axis in order to sample emission along the jet. Table 2 summarizes the observations and basic instrument properties.
We focus here on the medium-resolution G140M spectrum which spectrally-resolves the C IV resonance doublet whose reference wavelengths are listed in the CHIANTI atomic database (Del Zanna et al. 2015) as = 1548.189/1550.775 Å111Accessible in electronic form at: http://www.chiantidatabase.org/chianti_linelist.html. The G140M grating provides detailed information on line centroid wavelengths (velocities) and shapes with a full-width half-maximum (FWHM) spectral resolution of 0.075 Å, equivalent to 15 km s-1 at 1550 Å. The C IV doublet traces warm plasma at a characteristic temperature TCIV 105 K and has been brightly-detected in previous HST observations of RY Tau (Calvet et al. 2004; Ardila et al. 2013).
Data were analyzed using PyRaf v. 2.1.6. Flat-fielded calibrated two-dimensional (2D) image science files (*flt.fits) for each exposure were provided by the Space Telescope Science Institute (STScI) production pipeline. The flat-fielded images for exposures taken at dithered offset positions were shifted and aligned with images for undithered exposures. The set of aligned flat-fielded images was then combined into a total exposure 2D spectral image (Fig. 1) using the Pyraf task x2d. Calibrated and background-subtracted one-dimensional (1D) spectra giving flux density as a function of wavelength were extracted from flat-fielded calibrated images using the task x1d. Wavelengths in the 2D spectral image and 1D spectra are in the heliocentric reference frame. We extracted spectra centered on the stellar trace for individual exposures (typical exposure time 815 s) to check for time-variable C IV emission and for the total usable summed exposure of 10,765 s. In addition, 1D spectra based on the total exposure were extracted at incremental offsets 0′′.145 (5 MAMA pixels) along the blueshifted and redshifted jets. The spectra at each offset were extracted using a spatial binsize of 5 MAMA pixels (full-width). This strategy provides complete non-overlapping spatial sampling along the jet. The choice of a 5-pixel step-size and a 5-pixel spatial binsize for each spectral extraction is a compromise between the need to obtain good spatial sampling while capturing sufficient counts in each spectrum to reliably measure line parameters. Taken together, the 1D spectra provide spatially-resolved information on the jet radial velocity, line width, and flux as a function of projected distance from the star. Decreasing signal-to-noise (S/N) ratio in the C IV lines toward larger offsets restricted our 1D spectral analysis to offsets of 1′′ in the blueshifted jet and 0′′.5 in the redshifted jet.
| Start | Stop | Resolution | Plate scale | Dispersion | Exposures | Time | |
|---|---|---|---|---|---|---|---|
| (UT) | (UT) | (Å) | FWHM (Å) | (′′/pixel) | (Å/pixel) | (s) | |
| 2014-12-04 23:53 | 2014-12-05 07:39 | 1522-1578aaFor tilt corresponding to central wavelength = 1550 Å. | 0.075 | 0.029 | 0.05 | 14bbExposure OCKF01060 (815 s) was not usable and is excluded from totals. | 10,765bbExposure OCKF01060 (815 s) was not usable and is excluded from totals. |
Note. — The observations were centered on RY Tau using target coordinates (J2000) R.A. = 04h 21m 57.41s, Decl. = 28∘ 26′ 35.57′′. All exposures were obtained in ACCUM mode with the 52′′ x 0.2′′ slit aligned along the optical jet axis (PA_APER = 112.45∘). STIS target acquisition centers the source in the slit to an accuracy of 0.′′01 (2). No additional peakup was performed. A 3-step STIS_ALONG_SLIT dither pattern was used with a 0.275′′ step size. The spectral resolution for MAMA first-order modes is 1.5 pixels (FWHM) at 1500 Å, equivalent to 15 km s-1 (FWHM). The STIS G140M wavelength accuracy from calibration studies expressed as the mean difference between observed (Gaussian-fitted) and laboratory wavelengths of selected emission lines is 0.13 0.14 (1) MAMA pixels (Sonnentrucker 2015). At 1500 Å this equates to 1.3 1.4 km s-1. Instrument properties are from the STIS Data Handbook unless otherwise noted.
3 Results
3.1 STIS G140M 2D Spectral Image
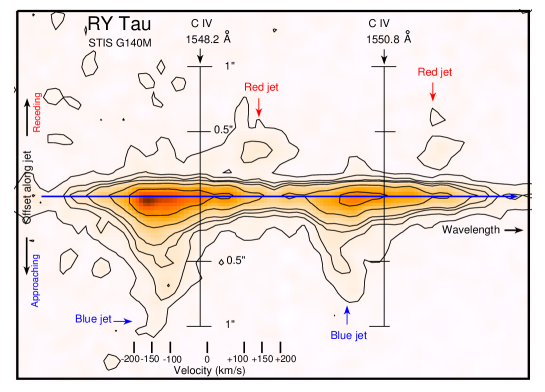
The STIS G140M 2D total-exposure spectral image at wavelengths near C IV is shown in Figure 1. The C IV doublet lines are clearly detected and spectrally-resolved. Spatial extension is visible in both doublet lines along the blue and redshifted jets. The blueshifted (approaching) jet is traced out to 1′′ (134 au) from the star and the redshifted jet out to 0′′.5 (67 au). The maximum intensity (peak pixel) of both lines is associated with the brighter blueshifted jet lobe. The spatial position of the peak pixel in both doublet lines is offset slightly from the stellar trace in the direction of the blueshifted jet. The offset in the 1547 - 1551 Å range is 0.3 0.5 MAMA pixels which is of low significance compared to the 0.2 pixel uncertainty in the location of the stellar trace on the detector as determined from calibration image fiducial bars.
As discussed further below, the C IV lines are quite broad at the stellar position but become narrower and more symmetric at increasing offsets along the jet. Several slightly-blueshifted moderately-broadened fluorescent H2 lines are also detected, the brightest of which is R(11) 2-8 ( = 1555.89 Å). This line shows faint spatial extension out to at least 5 MAMA pixels (19 au) in the blueshifted (approaching) direction relative the stellar trace in the unbinned total-exposure G140M 2D spectral image. Further discussion of the H2 lines is given in Section 4.3.
3.2 STIS G140M 1D Spectra Centered on the Star
The STIS G140M 1D total-exposure spectrum extracted along the stellar trace is shown in Figure 2. The spectrum was extracted with a spatial binsize of 5 MAMA pixels (full-width = 0′′.145) and thus captures emission out to offsets of 0′′.0725 (9.7 au) from the star. The spectrum is dominated by the bright broad blueshifted C IV doublet lines (Table 3). But as noted above, several slightly-blueshifted fluorescent H2 lines are also detected (Table 4). In addition to the conspicuous H2 lines visible in Figure 2, the blue wing of C IV 1548 Å shows a narrow peak that is due to H2 R(3)1-8 emission and C IV 1551 Å may contain a weak contribution from H2 P(8)2-8. Also visible in the G140M spectrum is a feature at rest-frame wavelength 1533.51 0.04 Å identified as Si II ( = 1533.43 Å ). Fainter emission from the Si II line at = 1526.71 Å may also be present.
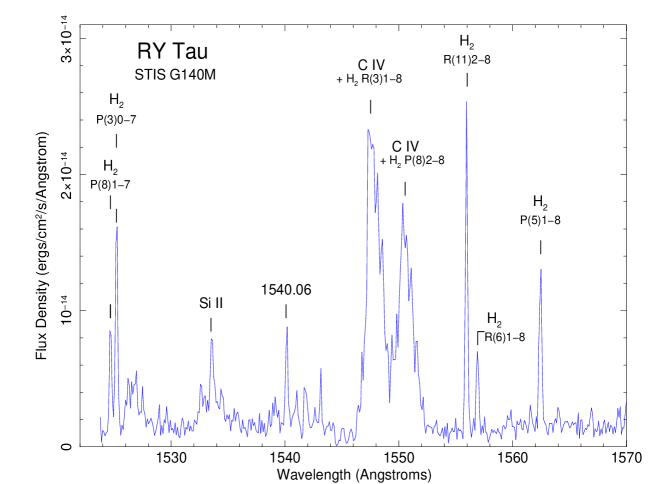
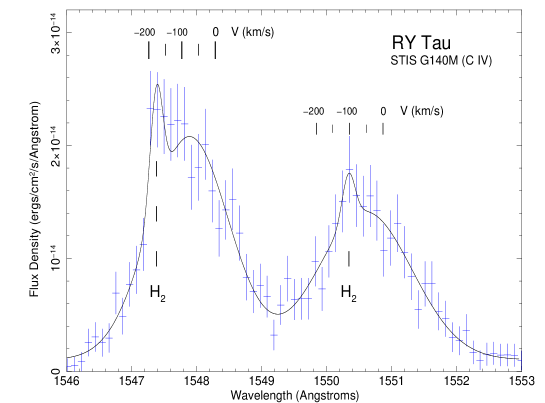
Figure 3 zooms in on the C IV doublet in the G140M 1D on-source spectrum. Both lines are broad and noticeably asymmetric. Trial fits of each line with a simple 1-component Gaussian model begin to reproduce the overall broad shapes but residuals remain at the wavelengths expected for H2 R(3)1-8 and P(8)2-8. Adding narrow low-velocity Gaussians with velocities and widths fixed at 9 km s-1 and FWHM = 44 km s-1 based on mean values of other H2 lines in the spectrum (Table 4) recovers the excess and results in a reasonably good first approximation of the overall doublet shape (Fig. 3). The two H2 lines that overlap C IV in the on-source spectrum contribute only 6% to the observed (absorbed) flux in the wavelength range spanned by the C IV doublet and most of this comes from the R(3) 1-8 line.
| Region | OffsetaaOffset of the central pixel of the spectral extraction relative to the stellar trace. A positive offset is in the direction of the redshifted (receding) jet. The spectra were extracted using a spatial binsize of 5 MAMA pixels (0′′.145 full width) and capture emission within 0′′.0725 of the extraction center. Thus, the spectrum centered on the stellar trace (offset=0) captures emission from both the blue and red inner jet lobes. | Velocityb,cb,cfootnotemark: | FWHMccAverage of the two lines comprising the doublet. | Total FluxddSum of the observed (absorbed) continuum-subtracted flux of the two lines in the doublet. The H2 flux contribution has also been subtracted for the spectrum centered on the stellar trace. At offsets of 0′′.29 the H2 flux is negligible (Sec. 3.4). | Flux ratioeeRatio of the observed fluxes of the doublet lines: F1548/F1551. |
|---|---|---|---|---|---|
| (arcsecs) [au] | (km s-1) | (km s-1) | (10-14 ergs cm-2 s-1) | ||
| starjet | 0 [0] | 65 10ffLines are asymmetric (non-Gaussian) so the velocity measurement may not correspond to a physical flow speed. | 304 26ffLines are asymmetric (non-Gaussian) so the velocity measurement may not correspond to a physical flow speed. | 5.41 0.36ggA spectrum extracted using a larger spatial bin full-width of 69 MAMA pixels (2.′′0) captures the star and jet emission out to offsets of 1′′ and gives a total flux (H2-subtracted) FCIV,absorbed(15481551) = 8.65 0.58 10-14 ergs cm-2 s-1. | 1.2 0.2 |
| blue jet | 0.29 [38.9] | 136 10 | 127 14 | 0.56 0.05 | 2.5 1.0 |
| red jet | 0.29 [38.9] | 125 14 | 127 24 | 0.18 0.02 | 2.0 1.2 |
Line widths of FWHM = 304 26 km s-1 are needed to reproduce the broad C IV lines, which is well in excess of that expected from stellar rotation at sin = 52 2 km s-1 (Petrov et al. 1999). As a result of the 5 MAMA pixel spatial binning, the spectrum extracted on the stellar trace also captures emission from the inner jet (9.7 au) which undoubtedly contributes to the line broadening. The Gaussian-fit centroids of the C IV lines in the stellar trace spectrum are blueshifted to 10 km s-1. However, this value cannot be considered a reliable flow velocity because of the asymmetric line shapes and blending. In addition, the flux ratio of the C IV doublet lines in the stellar trace spectrum is significantly less than the value F1548/F1551 = 2 expected for optically thin emission (Table 3) so optical depth effects may be important near the star. A similar conclusion was reached by Lamzin (2000). More reliable velocities are obtained from off-source spectra of the jet where the C IV lines are narrower and well-modeled as single-component Gaussians (Sec. 3.4).
| TransitionaaTransitions are in the Lyman band system (Abgrall et al. 1993). The letter denotes the change in rotational quantum number (J) from that in the upper electronic state (J′) to the lower electronic state (J′′) in the sense J = J′ J′′. The letter P corresponds to J = 1 and R corresponds to J = 1. The number in parentheses following the letter is the rotational quantum number in the lower electronic state (J′′). The two numbers separated by a hyphen correspond to the vibrational quantum numbers - in the upper and lower electronic states, respectively. | VelocitybbCentroid velocity is in the star’s rest frame and assumes a heliocentric stellar radial velocity of 18 km s-1. | FWHMccSTIS G140M resolution is FWHM = 15 km s-1. | FluxddObserved (absorbed) continuum-subtracted flux; not corrected for extinction. | |
|---|---|---|---|---|
| (Å ) | (km s-1) | (km s-1) | (10-15ergs cm-2 s-1) | |
| P(8) 1-7 | 1524.65 | 102 | 422 | 1.9 0.7 |
| P(3) 0-7 | 1525.15 | 82 | 422 | 3.8 0.8 |
| R(3) 1-8 | 1547.34 | [9]eeQuantities in brackets were held fixed during fitting. Blended with C IV. | [44]eeQuantities in brackets were held fixed during fitting. Blended with C IV. | 2.5 1.5 |
| P(8) 2-8 | 1550.30 | [9]eeQuantities in brackets were held fixed during fitting. Blended with C IV. | [44]eeQuantities in brackets were held fixed during fitting. Blended with C IV. | 1.0 0.6 |
| R(11) 2-8 | 1555.89 | 82 | 423 | 5.1 0.9 |
| R(6) 1-8 | 1556.87 | 102 | 454 | 1.5 0.7 |
| P(5) 1-8ffThis line has been detected in some Herbig-Haro objects such as HH 43/47 (Schwartz 1983). | 1562.39 | 72 | 473 | 3.4 0.9 |
| mean (s.d.)ggThe blended R(3) 1-8 and P(8) 2-8 lines were excluded from calculation of the mean. | … | 9 (1) | 44 (2) | …. |
Even though there is little doubt that the spectrum extracted along the stellar trace includes C IV emission from the inner jet near the star, it is not obvious that the star itself contributes. There is no significant peak at the stellar radial velocity in the broad C IV line profile shown in Figure 3. Nevertheless, estimates of the C IV flux contributed by the inner unresolved jet to the on-source spectrum are significantly less than the measured flux, so there is little doubt that the star itself is contributing (Sec. 3.4).
We compared the C IV doublet flux in 14 exposures with individual exposure times of 10 - 14 minutes acquired over a timespan of 7.8 hours. No deviations of greater than 1.9 with respect to the mean were found but low-level flux variations of up to 20% cannot be ruled out because of the lower S/N ratio in spectra of individual exposures as compared to their sum. Since the C IV emission is extended on a spatial scale of at least one arcsecond the measured flux depends on the aperture size or the spatial bin width used in STIS spectral extractions and comparisons with flux measurements from previous studies are not straightforward. But we note that the observed flux measured in a total exposure spectrum centered on the stellar trace and using a spatial binsize of 2′′ to capture the central source and essentially all of the detected jet emission out to offsets of 1′′ is FCIV,absorbed(15481551) = 8.65 0.58 10-14 ergs cm-2 s-1 (H2 subtracted). For comparison, the value obtained by IUE was FCIV,absorbed = 8.7 0.3 10-14 ergs cm-2 s-1 (Valenti et al. 2000). The agreement is remarkably good considering that most of the IUE observations were obtained in the 1980s.
The feature in Figure 2 identified as Si II deserves further comment. This line was also listed as a detection in HST Goddard High-Resolution Spectrograph (GHRS) spectra of RY Tau analyzed by Lamzin (2000). It forms at a characteristic temperature TSiII 104.5 K and thus traces slightly cooler plasma than C IV. As can be seen in Figure 2 the line consists of a sharply-peaked Gaussian superimposed on a broad pedestal extending from 1532.5 - 1534.5 Å . A Gaussian fit of the sharply-peaked core gives a redshifted velocity of 16 6 km s-1 and FWHM = 72 12 km s-1. The apparent redshift is surprising since all other identified lines in the G140M on-source spectrum are blueshifted. It is thus obvious that the line does not form in the approaching jet and it may originate near the star in the receding (redshifted) jet.
3.3 Extinction and C IV Luminosity
The intrinsic (unabsorbed) C IV line flux and luminosity are quite uncertain due to discrepancies in the value of determined from different color indices (Calvet et al. 2004) and subtleties in the far-UV extinction law toward dark clouds such as Taurus (Fitzpatrick & Massa 1988; Cardelli, Clayton, & Mathis 1989; Whittet et al. 2004). Previous UV studies of RY Tau have adopted different stellar extinction values including = 0.29 (Ardila et al. 2002), 0.55 (Gómez de Castro & Verdugo 2007), 0.6 - 1.3 (Lamzin 2000), 1.0 - 1.3 (Petrov et al. 1999), 1.8 (Kenyon & Hartmann 1995) and 2.2 0.2 (Calvet et al. 2004). The latter value is clearly larger than the others but is nevertheless consistent with independent estimates based on X-ray absorption (Skinner et al. 2016). Assuming an extinction ratio / 2.6 (Calvet et al. 2004), our absorbed fluxes convert to unabsorbed values according to FCIV,unabsorbed = 10 FCIV,absorbed. At d = 134 pc the intrinsic line luminosity is LCIV = 2.1461042 FCIV,unabsorbed ergs s-1. If the extinction is at the high end of the range of values in the literature ( 2) then the absorbed line flux for the starjet out to offsets of 1′′ of FCIV,absorbed(15481551) = 8.65 10-14 ergs cm-2 s-1 converts to an intrinsic (unabsorbed) luminosity LCIV(starjet) 2 1031 ergs s-1, which is comparable to the X-ray luminosity of RY Tau determined from Chandra and XMM-Newton observations (Table 1). The above derivation assumes that is the same for the star and the jet out to a separation of 1′′.
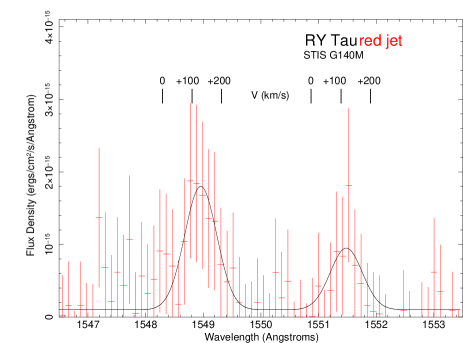
3.4 Spectra Extracted Along the Jet
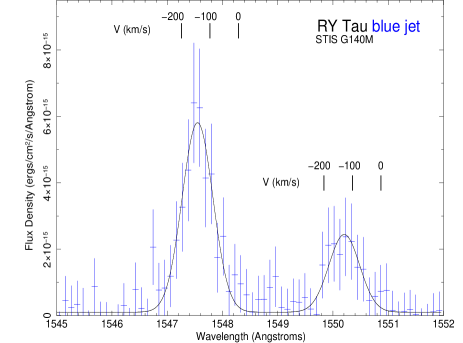
Figure 4 shows the C IV doublet in 1D total-exposure spectra extracted at an offset of 0′′.29 (10 MAMA pixels) from the star along the blue and redshifted jets using a spatial bin width of 0′′.145 (5 pixels). These spectra capture emission at offsets of 0′′.29 0′′.0725 (38.9 9.7 au) along the jets. The lines in the blueshifted jet provide higher S/N ratio and more reliable fit parameters. As is evident from the figure, the C IV lines are narrower and more symmetric (nearly Gaussian) than in the on-source spectrum. There is very little H2 contamination at this offset. H2 line fluxes are down by more than an order-of-magnitude compared to the on-source spectrum and are negligible. Gaussian fits of the C IV line at an offset of 0′′.29 in the blueshifted jet give a velocity that is 9% larger than that of the corresponding redshifted jet but the blue and red jet velocities agree to within the measurement uncertainties (Table 3). Thus, we find no evidence for a significant velocity asymmetry in the jet at an offset of 0′′.29 (39 au). The ratio of observed fluxes in the doublet lines in the spectra extracted at this offset is consistent with the value F1548/F1551 = 2 expected for optically thin emission.
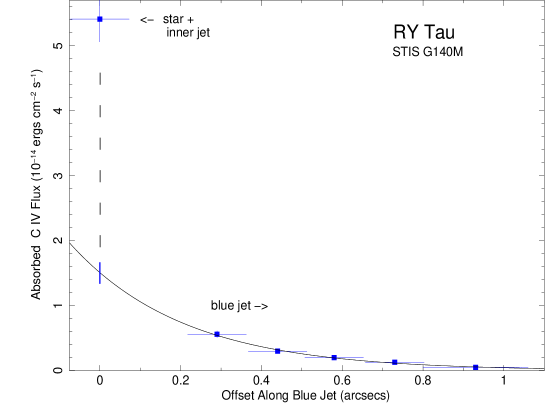
Figure 5 plots the absorbed C IV flux (sum of the doublet components) in the blueshifted jet as a function of projected offset from the star. The flux decreases toward larger offsets and the falloff is well-fitted by a simple exponential model at offsets 0′′29. The jet flux cannot be reliably measured at small offsets 0′′29 or at offsets beyond 1′′. However, extrapolating the exponential fit back to the star gives a predicted blue-jet flux F(offset=0′′) = 1.51 10-14 ergs cm-2 s-1. We assume that the red-jet contributes equally to the C IV flux in the on-source spectrum but this is probably an overestimate since the red-jet flux is weaker than the blue-jet at offsets away from the star (Table 3). We thus expect an on-source C IV flux contribution from the blue and red jet lobes combined of no more than twice the above value, namely F(offset=0′′0) = 3 10-14 ergs cm-2 s-1. But the absorbed flux measured in the on-source spectrum extracted using a 5 MAMA pixel spatial bin width is F(offset=0′′) = 5.41 10-14 ergs cm-2 s-1 (Table 3). The additional C IV flux in the on-source spectrum above that expected from the inner jet lobes is very likely due to the star itself. This result is not surprising since C IV emission is almost always detected in cTTS, even those without jets (Valenti, Johns-Krull, & Linsky 2000; Ardila et al. 2013).
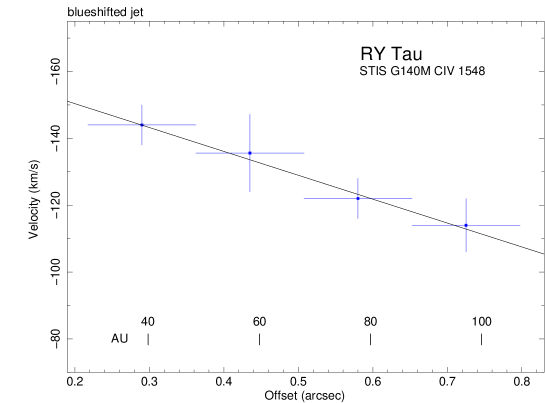
Figure 6 shows the radial velocity in the blueshifted jet as a function of offset from the star as measured by the centroid of the brighter CIV 1548.2 Å line. There is a clear decrease in jet speed toward larger offsets and this decrease is well-approximated by a linear fit vblue_jet = 71.46 (21.20) offset (arcsecs) 164.7 (11.0) km s-1 for offsets in the range 0.′′29 - 0.′′73 (39 - 98 au).
4 Discussion
4.1 Jet Mass-Loss Rate
The jet mass-loss rate for a fully-ionized jet is
| (1) |
where 1.24 is the mean atomic weight (amu) per nucleus for gas with cosmic abundances, is the proton mass, is the average electron density in the jet, is the (deprojected) jet velocity, and is the cross-sectional area of the jet. For simplicity we consider the blue jet lobe within 1′′ of the star where our velocity measurements are reliable. Within the inner arcsecond the jet is well-collimated with nearly-constant deconvolved width FWHM 0′′.18 (Agra-Amboage et al. 2009; Coffey et al. 2015). We thus assume a cylindrical jet with cross-sectional area = 1.02 1029 cm2 at a distance of 134 pc. At an offset of 0′′.5 from the star the radial jet velocity is 129 km s-1 (Fig. 6). We assume a jet inclination relative to the line-of-sight = 61∘ 16∘ as determined by Agra-Amboage et al. (2009). But for comparison we note that Isella, Carpenter, & Sargent (2010) used thermal dust models based on multiwavelength millimeter data to constrain the disk rotation axis inclination to be in the range = 66∘ 2∘ (1.3 mm) - 71∘ 6∘ (2.8 mm). For our adopted jet inclination angle the deprojected jet velocity is vjet 266 km s-1 where the uncertainty is due only to the uncertainty in and the much smaller uncertainty (10%) in the jet velocity measurement from the C IV centroid shift is ignored. Substituting these numbers into eq. (1) gives
| (2) |
To estimate we use the expression for the C IV volume emission measure (EM)
| (3) |
where is the volume of the emitting region, is the volume filling factor of the C IV plasma (0 1), LCIV is the unabsorbed C IV luminosity, and = 6.8 10-23 ergs s-1 cm3 is the volumetric cooling rate for C IV determined by Schneider et al. (2013a). As we have noted (Sec. 3.3), the value of LCIV for RY Tau is subject to uncertainties in . Assuming 2 and using the integrated C IV line flux within the inner arcsecond of the blue jet (Fig. 5) we obtain EMCIV = 1.57 1053 cm-3 and = 2.6 104 cm-3. Leaving as a free parameter gives = (2.3 10-9/) M⊙ yr-1. This value is consistent with the value = (1.6 - 26) 10-9 M⊙ yr-1 obtained by Agra-Amboage et al. (2009) using high spatial resolution [OI] 6300 Å spectral-images. For a symmetric jet the derived mass-loss rate for blue and red jet lobes combined would be about twice the above value. The main uncertainties in the above calculation are the deprojected jet velocity vjet (-dependent), (-dependent), and the volume filling factor . In addition, we have assumed a fully-ionized jet and if that is not the case then eq. (1) would need to be modified as discussed by Hartigan, Morse, & Raymond (1994). Considering the uncertainties, the above can only be regarded as an order-of-magnitude estimate of the jet mass-loss rate. For comparison, the mass-loss rate of RY Tau estimated by Kuhi (1964) using a spherically-symmetric isotropic wind model was = 3.1 (1.3 - 5.0) 10-8 M⊙ yr-1 where the range in parentheses reflects values obtained using different spectral lines. A more recent estimate of the wind mass-loss rate by Petrov, Babina, & Artemenko (2017) gives = 2 10-9 M⊙ yr-1.
4.2 Jet Heating Models
The physical process which heats the jet and where the heating occurs are not yet well-understood. The STIS observation discussed above reveals warm jet plasma from C IV emission to within a few tenths of an arcsecond of RY Tau, so some jet heating must take place close to the star. The new STIS data along with information on jet morphology obtained in earlier studies allow some constraints on heating mechanisms to be obtained, as discussed below.
Base-heated Jet: If heat input is restricted to the jet base near the star then it is launched hot and cools by different processes such as radiation and expansion as it flows outward. Since the width of the RY Tau jet remains nearly constant within 150 au (1′′) of the star (Agra-Amboage et al. 2009) we assume that radiative cooling is the dominant process. Any additional adiabatic cooling due to expansion would shorten the cooling times derived below, which should therefore be regarded as upper limits.
The radiative cooling time is
| (4) |
We first assume a jet-base temperature Tjet TCIV 105 K but this should be considered a lower limit and the possibility of a higher jet-base temperature is considered below. For a solar-abundance plasma we use (T = 105 K) = 6.5 10-22 ergs s-1 cm3, of which about one-third comes from carbon-cooling transitions, primarily C III (977 Å ) and C IV (Foster et al. 2012; Lykins et al. 2013; Smith et al. 2001). Inserting this value into eq. (4) along with ne = 2.6 104 cm-3 (Sec. 4.1) gives a radiative cooling time = 0.077 yr.
The distance traversed by the jet during the cooling time depends on the (deprojected) jet velocity after taking into account the jet inclination angle relative to the line-of-sight. The jet inclination is not well-determined for RY Tau but previous work suggests = 61∘ 16∘ (Agra-Amboage et al. 2009). At an offset of 0′′.5 from the star, which we take as representative, the radial velocity of the blue jet is 129 km s-1 (Fig. 6). This corresponds to a deprojected velocity vjet = 266 (182 - 573) km s-1 and a projected (tangential) velocity vjet,t = 233 (159 - 501) km s-1, where the range in parentheses reflects the uncertainty in . At this speed, the time required for the jet to traverse a projected distance of 134 au (1′′) is 2.7 (1.2 - 4.0) yr. But during the cooling time the jet traverses a projected distance of only = 3.8 (2.6 - 8.1) au. This value is much less than the distance 134 au (1′′) to which the blueshifted jet is actually detected in C IV (Fig. 1).
The above discrepancy could be resolved if the radiative cooling time is longer than estimated above, or if the jet undergoes additional heating as it flows outward. Possible additional heating mechanisms are discussed below. A longer radiative cooling time could be achieved if the jet base temperature is significantly higher than the value Tjet TCIV 105 K assumed above, or if ne is lower than assumed. Another question that may be relevant to the above discrepancy is whether the jet plasma is in collisional ionization equilibrium.
Some models assume temperatures at the jet-base of a few MK as in the disk corona heating model of Takasao, Suzuki, & Shibata (2017). Their analysis of the DG Tau jet adopted a jet-base temperature Tjet = 3.4 MK based on the X-ray observations of Güdel et al. (2008). The jet-base temperature of RY Tau is not known but a value of at least Tjet 3 - 4 MK (kT 0.26 - 0.34 keV) would be needed to produce detectable jet thermal X-ray emission above Chandra’s low-energy limit. Such emission may be present at offsets out to 1′′.7 from the star along the blueshifted jet (Fig. 4 of Skinner et al. 2011). However, Chandra’s angular resolution (FWHM 0′′.5) is insufficient to spatially distinguish between X-rays originating near the jet base within a few au of RY Tau or further out in the jet.
Assuming a jet-base temperature Tjet 3 MK at the low-end of Chandra’s detection range gives a radiative cooling time (eq. [4]) of = 6.9/(ne/105 cm-3) yr. Here is the volume filling factor of X-ray emitting plasma in the jet and we have used = (T = 3 MK) = 5.7 10-23 ergs s-1 cm3 for solar abundance plasma (Foster et al. 2012). To produce soft X-ray emission out to a projected (tangential) separation of 1′′.7 from the star, the cooling time would need to be at least 4.6 yr for vjet = 266 km s-1. This would be the case if ne 1.5 105 cm-3. This electron density is consistent with that derived above using the C IV luminosity provided that 0.03.
As is clear from the above, the ability of the base-heated jet model to produce soft X-rays at offsets 1′′ for a given jet speed depends critically on the jet plasma cooling time. The radiative cooling time is proportional to Tjet/ne, but neither Tjet nor ne is tightly-constrained by observations. For the above estimate we assumed Tjet 3 MK but if Tjet 6 MK then increases by a factor of 2.5 for a given ne. Non-radiative cooling from processes such as expansion may also contribute but has been neglected above since the optical jet width shows little change at the projected offsets of interest here and reliable measurements of the width of the faint X-ray jet versus projected separation are not available.
Collisional Ionization Equilibrium: A difference between the observed spatial extent of the C IV jet and that predicted from the radiative cooling time could occur if the jet plasma is not in collisional ionization equilibrium (CIE). Departures from CIE occur when plasma is rapidly heated (e.g. by shocks) or cooled on a timescale much shorter than the time for ionization equilibrium to be restored. Under non-CIE conditions the plasma is in a transient state during which it radiates at a temperature that is decoupled from ionization balance (Mewe 1999).
The timescale required for a given element to reach CIE is inversely proportional to electron density and has a complex electron-temperature dependence arising from differences in ionization and recombination rates of various ions (Fig. 1 of Smith & Hughes 2010; Mewe 1999). Without accurate estimates of the RY Tau jet temperature and electron density we cannot reach a firm conclusion as to whether it is in CIE but a preliminary assessment is possible based on order-of-magnitude estimates.
If the jet temperature is T 105 K, the metals which would take the longest time to reach CIE are C and Al (Smith & Hughes 2010). At this temperature, the time required for all C ions to be within 90% of their CIE value is 3.8/(ne/104 cm-3) yr. Using our estimate = 2.6 104 cm-3 (Sec. 4.1) gives 1.5 yr. As noted previously, the time required for the jet to propagate out to the C IV-traced distance of 134 au (1′′) is = 2.7 (1.2 - 4.0) yr. Thus, if the jet temperature is T 105 K then CIE appears likely. If the jet is at X-ray emitting temperatures T 3 106 K then the value of determined by Smith & Hughes (2010) is at least an order-of-magnitude less than at 105 K and the case for CIE is strengthened. Based on the above estimates, the case for invoking non-CIE conditions in the RY Tau jet does not look compelling.
Hot Plasmoids: Ejection of hot plasmoids during powerful stellar X-ray flares could produce high-temperature plasma in discrete structures offset from the star. This picture is reminiscent of solar coronal mass ejections and has been discussed in the context of large X-ray flares from protostars by Hayashi, Shibata, & Matsumoto (1996).
In their picture discrete plasmoids at or near coronal flare-loop temperatures are ejected at high velocities of several hundred km s-1 but in extreme cases may approach 1000 km s-1. We assume that the ejected plasmoid is at temperature Tplasmoid 108 K since superhot X-ray flares at such temperatures have been detected in RY Tau (Skinner et al. 2011). The radiative cooling time from eq. (4) is then = 0.044/(ne/109 cm-3) yr where for superhot solar abundance X-ray plasma (T = 100 MK) = 2.9 10-23 ergs s-1 cm3 (Foster et al. 2012). The actual cooling time could be less since other processes such as expansion may also cool the plasmoid.
X-ray spectra of cTTS give coronal densities in the range ne 109.5 - 1012 cm-3 (Ness et al. 2004). Adopting ne 109 cm-3 as a lower limit on plasmoid density gives 0.044 yr ( 16 days). Even at very high ejection speeds of 1000 km s-1 the plasmoid would traverse a distance of only 10 au during the cooling time, or 0′′.075 at the distance of RY Tau. As the plasmoids cool down they could be revealed in high-resolution optical images as knots close to the star. Because of their anticipated intermittent appearance during large X-ray flares and short cooling times, plasmoids do not offer a plausible explanation for the omnipresent jet of RY Tau that is traced outward to 100 au.
Shock-heated Jet: The maximum shock temperature for a shock-heated jet is = 0.15(vs/100 km s-1)2 MK, where vs vjet is the shock speed (Raga, Noriega-Crespo, & Velázquez 2002). As shown in Figure 6 the projected speed in the blueshifted jet decreases with increasing distance from the star. For a representative offset of 0′′.5, the deprojected jet speed allowing for the uncertainty in is vjet = 266 (182 - 573) km s-1. At these speeds the maximum shock temperature is = 1.1 (0.5 - 4.9) MK. These temperatures are high enough to account for C IV emission from shocks (TCIV 0.1 MK) but can only explain hotter X-ray plasma Tx few MK if the jet speed is at the high end of the expected range and vs vjet. On the contrary, Agra-Amboage et al. (2009) have argued that shock speeds are much less than the jet speed.
At offsets of 1′′, where faint X-ray emission is visible in Chandra images, the jet will have decelerated to lower speeds than the value at 0′′.5 used above and the maximum shock temperature will also be lower. Extrapolation of the linear decline shown in Figure 6 to an offset of 1′′ results in a jet speed that is about 32% less than given above and a corresponding maximum shock temperature Ts 2.3 MK (kTs 0.2 keV). This value is at or below Chandra’s low-energy threshold. Thus, the production of soft X-rays at offsets 1′′ in the RY Tau jet within Chandra’s detectability range is problematic if the jet velocity profile based on C IV measurements shown in Figure 6 is taken as a reference.
Magnetic Jet Heating: Currents generated by wound-up magnetic fields could play a role in heating ionized jets. But magnetic fields in young stellar jets are expected to be weak (G - mG) and hence difficult to detect and measure (Hartigan et al. 2007). Few good-quality measurements exist but an important result is the detection of radio synchrotron radiation in the powerful Herbig-Haro jet HH 80-81 by Carrasco-González et al. (2010). This provides clear evidence that the jet has a magnetic field. Their radio data imply an equipartition magnetic field strength in jet knots of 0.2 mG. But knots trace overdense regions in the jet and theoretical models predict that increases with density (Hartigan et al. 2007). Thus, a non-uniform magnetic field that is stronger in dense knot regions is expected and the spatially-averaged magnetic field strength in HH 80-81 is probably less than the above jet-knot value.
To our knowledge, there has been no B-field measurement for the RY Tau jet and we thus have to rely on estimates. If the jet is magnetically-confined then the magnetic pressure must exceed the gas (plasma) pressure, Pgas = Pmag where 0 1. Specifically, kTjet = /8) where is the total particle density in the jet, k is Boltzmann’s constant, and Tjet is the jet temperature. We assume Tjet TCIV 105 K as above but as already noted this should be taken as a lower limit. For solar-abundance plasma with fully-ionized H and He we get 1.92 (5 104)/ when using the value of obtained in Sec. 4.1. This gives = 4/() mG. For marginal confinement ( = 1), = 4/ mG but strong-confinement values 1 are typically used in magnetic jet simulations.
To obtain a second estimate of we use the canonical formula for magnetized young stellar jets proposed by Hartigan et al. (2007),
| (5) |
Using (5 104)/ for RY Tau as above gives 3/ mG, similar to that obtained using equipartition arguments.
Adopting a deprojected jet speed vjet 266 km s-1 at an offset of 0′′.5 from the star as a representative value and a jet radius 0′′.09 12 au for the inner arcsecond of the RY Tau jet, the magnetic energy in the jet is 1030(/5 mG)2 ergs s-1, where we have used the results of Schneider et al. (2013a) but have normalized to a weaker field strength of 5 mG. Using this result the minimum required field strength to account for the integrated blue jet C IV luminosity (Fig. 5) is 11 mG if Av 2 (i.e. LCIV,blue-jet = 1.1 1031 ergs s-1). This field strength is about 50 times greater than determined for the HH 80-81 jet by Carrasco-González et al. (2010).
4.3 Fluorescent H2 Lines
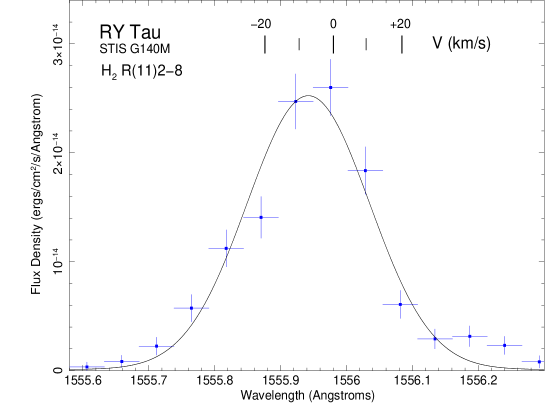
Fluorescent H2 lines are commonly present in the FUV spectra of TTS and are thought to be pumped mainly by wings of the stellar H Ly line. Detailed studies of fluorescent H2 emission in selected samples of TTS with the HST were carried out by Ardila et al. (2002) using the GHRS and France et al. (2012) using the Cosmic Origins Spectrograph (COS) and STIS. Their results revealed that the H2 lines in cTTS are broadened to typical values FWHM 40 20 km s-1 with velocities ranging from 0 km s-1 (i.e. the line centroid is centered at the stellar radial velocity) to values of a few tens of km s-1.
The H2 lines that we detect for RY Tau are blueshifted by an average of 9 1 km s-1 and moderately broadened to an average width FWHM = 44 2 km s-1. The brightest H2 line is R(11) 2-8 as shown in Figure 7. The velocity shifts are significantly larger than the STIS G140M wavelength calibration uncertainty (Table 2). The line broadening is also significant compared to the STIS G140M instrumental resolution of FWHM 15 km s-1 at 1500 Å. The fitted H2 line-widths are well above that expected from thermal broadening and turbulence, as has generally been found for the larger samples of TTS analyzed in the studies referenced above. Thus, bulk motion of molecular gas is implied.
Several different origins of the fluorescent H2 lines in cTTS have been proposed. In the sample analyzed by Ardila et al. (2002) the H2 line centroids in most stars were blueshifted and line formation in outflows was considered to be the most likely explanation. In the sample studied by France et al. (2012) some cTTS showed H2 lines with non-zero velocities suggestive of outflows, a good example being the jet-driving cTTS RW Aur A. On the other hand, no significant velocity shift was detected in some cTTS and it was proposed that their fluorescent H2 emission originates in a rotating disk. A detailed study of the jet-driving cTTS DG Tau using STIS G140M (Schneider et al. 2013a) and HST FUV imaging (Schneider et al. 2013b) revealed H2 emission close to the star near the approaching jet axis as well as extended emission fanning out into a wide-angle conical-shaped structure. The wide-angle emission was attributed to a disk wind. In view of the various results and interpretations above, it seems likely that different regions near the star can contribute to fluorescent H2 emission. The complex H2 morphology of DG Tau seen in HST FUV images supports this.
The remarkable similarity in blueshifted velocities and widths of the H2 lines we detect in RY Tau, along with the faint blueward spatial extension seen in brighter H2 lines (Sec. 3.1), is indicative of a low-velocity molecular outflow approaching the observer. The blueshifted centroids are at odds with the broadened unshifted lines expected for H2 formation in a rotating disk. The spatial morphology of the outflowing gas is not well-determined by the narrow 0′′.2 STIS slit but H2 emission is certainly present within 0′′.0725 (9.7 au) of the star (Fig. 2). In addition, the R(11) 2-8 and P(5) 1-8 lines are faintly visible in G140M spectra extracted at a blueward offset along the jet of 0′′.29 0′′.0725 (38.9 9.7 au) so the presence of H2 out to a projected distance of at least 30 au from the star is assured. The extended blueshifted H2 emission may originate in molecular gas that is being swept outward by the jet, possibly similar to the H2 emission detected near the approaching jet axis of DG Tau (Fig. 3 of Schneider et al. 2013b). High-resolution FUV images of RY Tau are needed to further clarify the spatial structure of the H2 emission, especially away from the jet-axis where extended conical-shaped structure has been seen in DG Tau.
5 Summary
The HST STIS observations presented here provide new information on RY Tau and its jet that help constrain jet-heating models. The main results of this study are summarized as follows.
-
1.
Warm plasma (TCIV 105 K) traced by C IV emission is clearly detected in STIS 2D images out to a projected offset of 1′′ (134 au) from the star along the blueshifted jet and out to 0′′.5 (67 au) along the fainter redshifted jet. The C IV emission is traced inward to offsets of a few tenths of an arcsecond, implying that significant jet heating occurs close to the star.
-
2.
The radial velocity in the brighter blueshifted jet is 136 10 km s-1 at a projected offset of 0′′.29 (39 au) and the jet speed decreases toward larger offsets. No significant difference in the radial velocity of the blue and redshifted jets is seen at an offset of 0′′.29.
-
3.
The mass-loss rate in the blueshifted jet is = 2.3 10-9/ M⊙ yr-1, where is the volume filling factor of C IV plasma in the jet. This value is consistent with previous optical measurements.
-
4.
Several fluorescent H2 lines blueshifted to 9 1 km s-1 are detected near the star. These lines evidently originate in a low-velocity molecular outflow but additional high spatial resolution FUV images are needed to further clarify the outflow geometry.
-
5.
Jet velocities determined from C IV centroids are high enough to account for warm C IV plasma by shocks in the inner jet at offsets of 1′′. Soft X-rays due to shocks in the inner jet could also occur if the deprojected jet speed is near the high end of the range allowed by jet inclination uncertainties but extreme shock speeds vs vjet are required. At offsets beyond 1′′ the extrapolated jet speed is too low to produce soft X-rays at energies above Chandra’s threshold. Thus, shocks alone do not provide a satisfactory explanation of the soft X-ray emission detected by Chandra at offsets 1′′ along the blueshifted jet.
-
6.
Other jet-heating mechanisms besides shocks seem necessary to produce soft X-ray emission along the jet. One possibility is that the jet is heated to X-ray temperatures near the base and is launched hot. The heating process is unspecified but could well involve magnetic processes in a magnetically-active star like RY Tau. A recent study focusing on the DG Tau jet has proposed that a hot magnetic disk corona could provide the base heating (Takasao et al. 2017). Tighter observational constraints on the temperature at the jet base, the jet electron density, and the X-ray jet morphology are needed to assess the relevance of this picture to RY Tau. Even if the jet is launched at high temperatures, additional heating may occur downstream. A jet magnetic field of minimum strength Bjet 11 mG could account for the jet C IV luminosity but the detection of such weak fields is challenging.
References
- Abgrall et al. (1993) Abgrall, H., Roueff, E., Launay, F., Roncin, J.-Y., & Subtil, J.-L. 1993, A&AS, 101, 273
- Agra-Amboage et al. (2009) Agra-Amboage, V., Dougados, C., Cabrit, S., Garcia, P.J.V., & Ferruit, P. 2009, A&A, 493, 1029
- Ardila et al. (2002) Ardila, D.R., Basri, G., Walter, F.M., Valenti, J.A., & Johns-Krull, C.M. 2002, ApJ, 566, 1100
- Ardila et al. (2013) Ardila, D.R., Herczeg, G.J., Gregory, S.G. et al. 2013, ApJS, 207, 1
- Bally, Feigelson, & Reipurth (2003) Bally, J. Feigelson, E., & Reipurth, B. 2003, ApJ, 584, 843
- Bertout, Robichon, & Arenou (1999) Bertout, C., Robichon, N., & Arenou, F. 1999, A&A, 352, 574
- Calvet et al. (2004) Calvet, N., Muzerolle, J., Briceño, C., Hernández, J., Hartmann, L., Saucedo, J.L., & Gordon, K.D. 2004, AJ, 128, 1294
- Cardelli, Clayton, & Mathis (1989) Cardelli, J.A., Clayton, G.C., & Mathis, J.S. 1989, ApJ, 345, 245
- Carrasco-González et al. (2010) Carrasco-González, C., Rodriguez, L.F., Anglada, G., Martí, J., Torrelles, J.M., & Osorio, M. 2010, Science, 330, 1209
- Coffey et al. (2015) Coffey, D., Dougados, C., Cabrit, S., Pety, J., & Bacciotti, F. 2015, ApJ, 804, 2
- Del Zanna et al. (2015) Del Zanna, G., Dere, K.P., Young, P.R., Landi, E., & Mason, H.E. 2015, A&A, 582, A56
- Favata et al. (2002) Favata, F., Fridlund, C.V.M., Micela, G., Sciortino, S., & Kaas, A.A. 2002, A&A, 386, 204
- Fitzpatrick & Massa (1988) Fitzpatrick, E.L. & Massa, D. 1988, ApJ, 328, 734
- Foster et al. (2012) Foster, A.R., Ji, L., Smith, R.K., & Brickhouse, N.S. 2012, ApJ, 756, 128
- France et al. (2012) France, K., Schindhelm, E., Herczeg, G.J. et al. 2012, ApJ, 756, 171
- Frank et al. (2014) Frank, A. et al. 2014, in Protostars and Planets VI, eds. H. Beuther, R.S. Klessen, C.P. Dullemond, & T. Henning (Tucson: U. of Arizona Press), 451
- Gómez de Castro & Verdugo (2007) Gómez de Castro, A.I. & Verdugo, E. 2007, ApJ, 654, L91
- Grosso et al. (2006) Grosso, N., Feigelson, E.D., Getman, K.V., Kastner, J.H., Bally, J., & McCaughrean, M.J. 2006, A&A, 448, L29
- Güdel et al. (2005) Güdel, M., Skinner, S.L., Briggs, K.R., Audard, M., Arzner, K., & Telleschi, A., 2005, ApJ, 626, L53
- Güdel et al. (2008) Güdel, M., Skinner, S.L., Audard, M., Briggs, K., & Cabrit, S. 2008, A&A, 478, 797
- Hartigan et al. (2007) Hartigan, P., Frank, A., Varniére, P., & Blackman, E.G. 2007, ApJ, 661, 910
- Hartigan et al. (1994) Hartigan, P., Morse, J.A., & Raymond, J. 1994, ApJ, 436, 125
- Hartmann et al. (1986) Hartmann, L., Hewett, R., Stahler, S., & Mathieu, R.D. 1986, ApJ, 309, 275
- Hayashi, Shibata, & Matsumoto (1996) Hayashi, M.R., Shibata, K., & Matsumoto, R. 1996, ApJ, 468, L37
- Holtzman, Herbst, & Booth (1986) Holtzman, J.A., Herbst, W., & Booth, J. 1986, AJ, 92, 1387
- Isella, Carpenter, & Sargent (2010) Isella, A., Carpenter, J.M., & Sargent, A.I. 2010, ApJ, 714, 1746
- Kenyon & Hartmann (1995) Kenyon, S.J. & Hartmann, L. 1995, ApJS, 101, 117
- Kuhi (1964) Kuhi, L. 1964, ApJ, 140, 1409
- Lamzin (2000) Lamzin, S.A. 2000, Ast. Letters, 26 (9), 589
- Lee et al. (2017) Lee, C.-F., Ho, P.T.P., Li, Z.-Y., Hirano, N., Zhang, Q. & Shang, H. 2017, Nature Astron., 1, 152
- Leinert et al. (1993) Leinert, Ch., Zinnecker, H., Weitzel, N., Christou, J., Ridgway, S.T., Jameson, R., Haas, M., & Lenzen, R. 1993, A&A, 278, 129
- Livio (1999) Livio, M. 1999, Physics Rep., 311, 225
- Lykins et al. (2013) Lykins, M.L., Ferland, G.J., Porter, R.L., van Hoof, P.A.M., Williams, R.J.R., & Gnat, O. 2013, MNRAS, 429, 3133
- Mewe (1999) Mewe, R. 1999, in X-Ray Spectroscopy in Astrophysics, eds. J. van Paradijs & J.A.M. Bleeker (Berlin: Springer), 109
- Ness et al. (2004) Ness, J.-U., Güdel, M., Schmitt, J.H.M.M., Audard, M., & Telleschi, A. 2004, A&A, 427, 667
- Petrov et al. (2017) Petrov, P.P., Babina, E.V., & Artemenko, S.A. 2017, in Stars: from Collapse to Collapse, eds. Y.Y. Balega, D.O. Kudryavtsev, I.I. Romanyuk, & I.A. Yakunin, ASP Conf. Series, Vol. 510 (San Francisco: Ast. Soc. Pacific), 94
- Petrov et al. (1999) Petrov, P.P., Zajtseva, G.V., Efimov, Y.S., Duemmler, R., Ilyin, I.V., Tuominen, I., & Shcherbakov, V.A. 1999, A&A, 341, 553
- Pott et al. (2010) Pott, J.-U., Perrin, M.D., Furlan, E., Ghez, A.M., Herbst, T.M., & Metchev, S. 2010, ApJ, 710, 265
- Pravdo et al. (2001) Pravdo, S.H., Feigelson, E.D., Garmire, G., Maeda, Y., Tsuboi, Y., & Bally, J. 2001, Nature, 413, 708
- Pravdo et al. (2004) Pravdo, S.H., Tsuboi, Y., Maeda,Y. 2004, ApJ, 605, 259
- Raga, Noriega-Crespo, & Velázquez (2002) Raga, A.C., Noriega-Crespo, A., & Velázquez, P.F. 2002, ApJ, 576, L149
- Schegerer et al. (2008) Schegerer, A.A., Wolf, S., Ratzka, Th., & Leinert, Ch. 2008, A&A, 478, 779
- Schneider et al. (2013a) Schneider, P.C., Eislöffel, J., Güdel, M., Günther, H.M., Herczeg, G., Robrade, J., & Schmitt, J.H.M.M. 2013a, A&A, 550, L1
- Schneider et al. (2013b) Schneider, P.C., Eislöffel, J., Güdel, M., Günther, H.M., Herczeg, G., Robrade, J., & Schmitt, J.H.M.M. 2013b, A&A, 557, A110
- Schneider, Günther, & Schmitt (2011) Schneider, P.C., Günther, H.M., & Schmitt, J.H.M.M. 2011, A&A, 530, A123
- Schwartz (1983) Schwartz, R.D. 1983, ApJ, 268, L37
- Skinner, Audard, & Güdel (2011) Skinner, S.L., Audard, M., & Güdel, M. 2011, ApJ, 737, 19
- Skinner, Audard, & Güdel (2016) Skinner, S.L., Audard, M., & Güdel, M. 2016, ApJ, 826, 84
- Skinner & Güdel (2014) Skinner, S.L. & Güdel, M. 2014, ApJ, 788, 101
- Smith & Hughes (2010) Smith, R.K. & Hughes, J.P. 2010, ApJ, 718, 583
- Smith et al. (2001) Smith, R.K., Brickhouse, N.S., Liedahl, D.A., & Raymond, J.R. 2001, ApJ, 556, L91
- Sonnentrucker (2015) Sonnentrucker, P. 2015, Instrument Science Report STIS 2015-02(v1), Space Telescope Science Institute, Baltimore, MD, 14
- Stelzer et al (2009) Stelzer, B., Hubrig, S., Orlando, S., Micela, G., Mikulás̆ek, Z., & Schöller, M. 2009, A&A, 499, 529
- St.-Onge & Bastien (2008) St.-Onge, G. & Bastien, P. 2008, ApJ, 674, 1032
- Takasao, Suzuki, & Shibata (2017) Takasao, S., Suzuki, T.K., & Shibata, K. 2017, ApJ, 847, 46
- Valenti, Johns-Krull, & Linsky (2000) Valenti, J.A., Johns-Krull, C.M., & Linsky, J.L. 2000, ApJS, 129, 399
- Whittet et al. (2004) Whittet, D.C.B., Shenoy, S.S., Clayton, G.C., & Gordon, K.D. 2004, ApJ, 602, 291