Measuring the masses of Intermediate Polars with NuSTAR: V709 Cas, NY Lup and V1223 Sgr
Abstract
The X-ray spectra of intermediate polars can be modelled to give a direct measurement of white dwarf mass. Here we fit accretion column models to NuSTAR spectra of three intermediate polars; V709 Cas, NY Lup and V1223 Sgr in order to determine their masses. From fits to 3–78 keV spectra, we find masses of , and for V709 Cas, NY Lup and V1223 Sgr, respectively. Our measurements are generally in agreement with those determined by previous surveys of intermediate polars, but with typically a factor smaller uncertainties. This work paves the way for an approved NuSTAR Legacy Survey of white dwarf masses in intermediate polars.
keywords:
accretion, accretion discs – novae, cataclysmic variables – white dwarfs – X-rays: binaries – X-rays: individual (V709 Cas, NY Lup, V1223 Sgr)1 Introduction
Cataclysmic variables (CVs) are binary systems in which a white dwarf (WD) accretes matter, via an accretion disc, from a stellar companion filling its Roche lobe. Magnetic CVs (mCVs) contain WDs with strong magnetic fields (G) which forces material to travel along magnetic field lines. In intermediate polars (IPs), a class of mCVs, the innermost regions of the disc are disrupted within the magnetosphere and in-falling material is instead funnelled on to the poles of the WD in a so-called “accretion curtain” (for a review see Patterson, 1994). Close to the surface of the WD, the in-falling material forms a standing shock with a high temperature ( keV) which emits hard X-rays via optically thin thermal plasma emission, cooling the gas in the post shock region as it descends on to the WD (Aizu, 1973).
The WD mass is a fundamental parameter in quantitative studies of any individual CVs. Moreover, it is important to know the WD mass distribution of CVs as a class for the understanding of their formation and evolution. While accretion alone would act to increase the WD mass in CVs, nova eruptions (thermonuclear runaway of accreted matter) were expected to expel all accreted matter. It was therefore a surprise that WD mass in CVs were found to be higher on average than in pre-CVs (Zorotovic et al., 2011). However, given the potential implications, it is important to confirm their results using independent methods. Moreover, a comparison of WD mass distributions between non-magnetic and magnetic CVs is of great interest in the context of the origin of the magnetic field in WDs. A leading scenario for the single magnetic WDs is that they are the results of mergers during the common envelope phase; mCVs are then understood to be the consequence of close interaction during the common envelope phase that end just short of merger (Ferrario et al., 2015, and references therein). Such a scenario could lead to a measurable difference between the mean WD masses of magnetic and non-magnetic CVs.
It has been shown that the temperature of the shock in IPs scales with WD mass (Katz, 1977; Rothschild et al., 1981) and therefore spectroscopy of IPs in the hard X-ray regime can be used to determine WD masses. It has been noted that X-ray spectroscopy provides a method of measuring WD masses independent of traditional radial velocity studies, which are dominated by uncertainties in binary inclination (Suleimanov et al., 2005; Yuasa et al., 2010).
X-ray surveys of IPs have led to mass determinations of IPs (Ramsay, 2000; Suleimanov et al., 2005; Brunschweiger et al., 2009; Yuasa et al., 2010). Unfortunately, systematic uncertainties stemming from poor sensitivities at high energies, and uncertain background (which must be modelled rather than extracted for non-imaging instruments such as Suzaku’s Hard X-ray Detector; Fukazawa et al., 2009) means that a number of WD masses remain poorly constrained. However, the emergence of the Nuclear Spectroscopic Telescope Array (NuSTAR) as the first X-ray telescope capable of focusing hard X-rays (Harrison et al., 2013) has brought about the ability to perform high angular resolution spectroscopy beyond 20 keV. This makes NuSTAR the ideal observatory to make accurate measurements of WD masses in mCVs. Mass measurements for 3 IPs observed with NuSTAR have been published so far (Suleimanov et al., 2016; Hailey et al., 2016).
In this work we present the results of WD mass measurements of 3 IPs, based on NuSTAR spectroscopy. We compare our results to those of earlier studies on these WD masses and note the tighter constraints provided by our mass determinations. This paper, along with previous work, will pave the way for an approved NuSTAR Legacy Survey of WD masses in IPs, which will constrain the mass distribution in this particular class of mCVs.
2 Observations and Data Reduction
NuSTAR consists of two co-aligned focal plane modules, FPMA and FPMB, and is the first telescope in orbit able to focus X-rays up to keV (Harrison et al., 2013). NuSTAR observed the IPs V709 Cas, NY Lup and V1223 Sgr in 2014 July, August and September, respectively for 20–26ks (Table 1). These observations were previously reported by Mukai et al. (2015).
| Source | Obs. Date | Obs. Time | Exposure (ks) |
|---|---|---|---|
| V709 Cas | 2014-07-07 | 02:01 | 25.6 |
| NY Lup | 2014-08-09 | 14:51 | 23.0 |
| V1223 Sgr | 2014-09-16 | 02:26 | 20.4 |
We reduced the data using the NuSTAR data analysis software (NuSTARDAS) v1.8.0, packaged with heasoft v6.22.1. The task nupipeline filtered the observations for passages of high background during passages through the South Atlantic Anomaly and produced cleaned event files. For each target and instrument, we extracted spectra from a radius circular region centred on the source. Background spectra were extracted from a radius circular region centred on a source-free region on the same detector. Spectra and corresponding response matrices were all generated with the task nuproducts. Finally, we grouped each spectrum to have at least 25 counts per bin using the heasoft task grppha. All spectra were fit in xspec v12.9.1 (Arnaud, 1996) using the statistic.
2.1 Modelling IP spectra
The shocked gas in IPs cools via optically thin thermal plasma emission as it descends on to the WD. The continuum of the overall spectrum in the hard X-ray band can therefore be broadly modelled by a series of bremsstrahlung components. However, since the shock is formed close to the stellar surface, a significant fraction of the radiation will be directed towards the WD and reflected. Reflection manifests itself in the X-ray spectrum as a Compton ‘hump’ at keV and neutral Fe–K emission at keV and has been demonstrated to be extremely important in modelling the X-ray spectrum of IPs (Mukai et al., 2015). Finally, the immediate pre-shock column have an effect on the X-ray spectrum (Done & Magdziarz, 1998), as the emitted X-rays may be viewed through this material some of the time, causing an absorption effect additional to that of the Galactic interstellar medium (ISM). To account for this, some model spectra require the addition of a partial covering component.
For the three IPs discussed in this work, we utilize the IP mass (IPM) model 111IPM is implemented as an additive table model:
(atable{polarmodel.fits}; see e.g. Hailey
et al., 2016) described by Suleimanov et al. (2005), which derives a WD mass based on the temperature of the bremsstrahlung continuum, assuming the Nauenberg (1972) relation between WD mass and radius. The Suleimanov et al. (2005) model calculates the predicted spectrum by modelling the vertical structure of the accretion column, taking into account the varying gravitational potential over the height of the shock. However, the model does not account for the effects of Compton reflection. We rectify this by including the convolution model for reflection from neutral material reflect (Magdziarz &
Zdziarski, 1995), assuming typical ISM abundances (Wilms
et al., 2000). This introduces the inclination angle of the reflecting surface (characterised in reflect by its cosine, ) as a parameter. However, the derived mass does not depend heavily on , in contrast to binary inclination, on which mass has a cubic dependence in radial velocity studies. As the WD mass is primarily determined by the shape of the continuum, we exclude the part of the spectrum in the keV range, effectively removing the Fe line complex, which has previously been studied in these three sources by Mukai et al. (2015). We also include a partial-covering term in some models, using the pcfabs model. However, we only use this if we find that a reflection model does not effectively model the spectrum, as partial covering can model some of the X-ray reflection effects, leading to degeneracies between the two models (Yuasa et al., 2010). In all combinations of models, the Galactic interstellar absorption was accounted for with tbabs (Wilms
et al., 2000). The cross-normalisation between the FPMA/B instruments was accounted for by a constant, .
We first fit the spectra in the energy range 3–78 keV (excluding the Fe line energy range) to derive a mass estimate. However, it has also been shown that similarly robust masses can be obtained by restricting the energy band keV (Hailey et al., 2016). The advantage of this method is that absorption and reflection effects can often be ignored, as they have been seen to be negligible at these energies, and we can investigate the effect (if any) they have on the derived masses.
3 Results
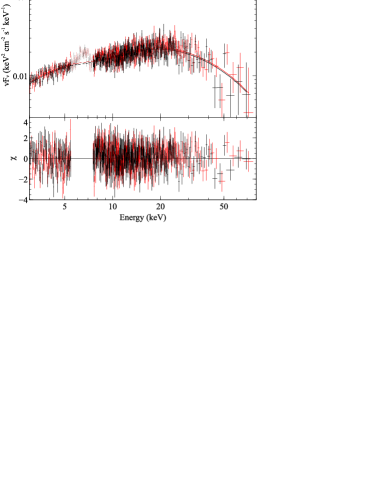
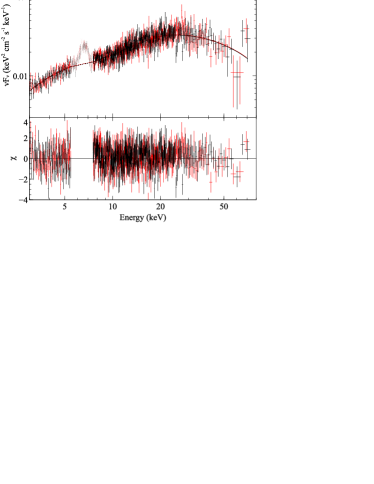
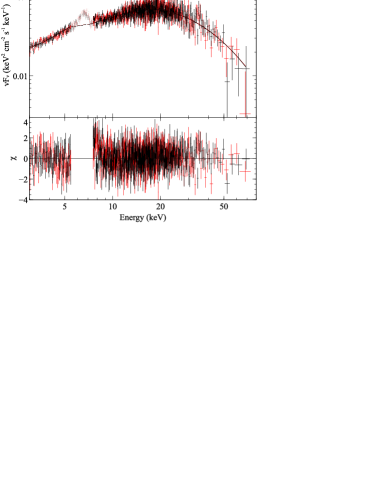
The 3–78 keV spectra and best fit models for each source are shown in Fig. 1. We compare spectral fitting results for different models in Tables 2, 3 and 4.
3.1 V709 Cas
| V709 Cas | |||
|---|---|---|---|
| Parameters | reflect*ipma | reflect*ipma | ipm |
| Bandpass [keV] | 3–78b | 3–78b | 15–78 |
| [ cm-2] | … | ||
| … | |||
| 1.0 | … | ||
| 1.0 | … | ||
| … | |||
| [] | |||
| [] | |||
| Flux [ ergs cm-2 s-1]f | 8.1 | 8.0 | 4.3 |
| 675/659 | 212/213 | ||
aMultiplied by tbabs to account for Galactic absorption
b3–78 keV bandpasses exclude the iron line complex (5.5–7.5 keV)
cFixed
dElemental abundance relative to Solar (fixed)
eIron abundance relative to Solar (fixed)
fObserved flux in the bandpass
V709 Cas was first identified as an IP from follow-up of a ROSAT all-sky survey detection (Haberl & Motch, 1995; Motch et al., 1996). The WD has a spin period s (Haberl & Motch, 1995; Norton et al., 1999) and the orbital period of the binary is 5.33h (Thorstensen et al., 2010). Modelling the X-ray emission with accretion column models has produced a range of WD mass for V709 Cas (; Ramsay, 2000; Suleimanov et al., 2005; Brunschweiger et al., 2009; Yuasa et al., 2010). Neither the WD, nor its companion are detectable in optical spectra (Thorstensen et al., 2010), so optical radial velocity studies have not been possible. X-ray spectroscopy is therefore the only reliable method of determining the mass of the WD, so we aim here to resolve the prior disagreements with NuSTAR.
The IPM model with reflection (reflect*ipm) provides a good fit to the 3–78 keV (excluding 5.5–7.5 keV) NuSTAR spectra ( for 659 degrees of freedom, dof) with a WD mass . However, the parameter, which characterizes the fraction of downward radiation that is reflected, is greater than unity, which is unphysical. We therefore freeze to unity and instead allow to vary and find a consistent with .
A simple IPM model fit to the 15–78 keV spectrum reveals a good (213 dof) and , in agreement with the 3–78 keV band reflect*ipm fit. Our measurements of are in agreement with the masses of , and derived by Ramsay (2000), Suleimanov et al. (2005) and Brunschweiger et al. (2009), respectively. However, our measurements do not agree with the as derived by Yuasa et al. (2010).
3.2 NY Lup
| NY Lup | ||||
|---|---|---|---|---|
| Parameters | reflect*ipma | reflect*ipma | ipm | reflect*ipm |
| Bandpass (keV) | 3–78b | 3–78b | 15–78 | 15–78 |
| [ cm-2] | … | … | ||
| 1.0c | … | 1.0c | ||
| 1.0 | 1.0 | … | 1.0 | |
| 1.0 | … | 1.0 | ||
| … | ||||
| [] | ||||
| [] | ||||
| Flux [ ergs cm-2 s-1]d | 11.1 | 11.1 | 7.6 | 7.3 |
| 725/724 | 307/270 | 269/269 | ||
aMultiplied by tbabs to account for Galactic absorption
b3–78 keV bandpasses exclude the iron line complex (5.5–7.5 keV)
cFixed
dObserved flux in the bandpass
NY Lup was identified as an IP from follow-up of the ROSAT all-sky survey (Haberl et al., 2002). The WD has s and a binary orbital period of 9.87h (Haberl et al., 2002; de Martino et al., 2006). A radial velocity study of the mass donor suggested (de Martino et al., 2006), in agreement with X-ray spectral modelling (, ; Brunschweiger et al., 2009; Yuasa et al., 2010, respectively). NY Lup shows colour-dependent circular polarization modulated on the spin period of the WD indicative of a fairly strong ( MG) magnetic field (Katajainen et al., 2010; Potter et al., 2012).
As in the case of V709 Cas, we obtain a good fit (; 724 dof) with an IPM model with reflection to the 3–78 keV spectra, but with an unphysical . To rectify this, we freeze , allowing to vary, and find a best fit (; 724 dof) . In this case we find that tends toward the hard upper limit of 0.95, with the best fit value (90% confidence). This is consistent with the low value for favoured by Mukai et al. (2015).
Fitting an IPM model, without reflection, to the 15–78 keV band spectrum indicates a heavier WD (), though still consistent with the 3–78 keV band fit within uncertainties. However, it is worth noting that the 15–78 keV fit has a higher (270 dof). This is not surprising as it has been shown that NY Lup has the highest amplitude Compton reflection hump, in addition to the strongest iron line (equivalent width = eV) of the three sources studied here (Mukai et al., 2015), so reflection is still likely a significant contribution to the shape of the X-ray spectrum, even at these energies. Convolving the IPM model with the Magdziarz & Zdziarski (1995) reflection model in the 15–78 keV band improves the fit ( for one fewer dof; ) and we find , consistent with the full 3–78 keV band fit. The masses we derive for NY Lup are in good agreement with the masses determined by Brunschweiger et al. (2009) and Yuasa et al. (2010) and it is evident that the system contains a relatively heavy WD.
3.3 V1223 Sgr
| V1223 Sgr | ||||
|---|---|---|---|---|
| Parameters | reflect*ipma | reflect*ipma | reflect*pcfabs*ipma | ipm |
| Bandpass (keV) | 3–78b | 3–78b | 3–78b | 15–78 |
| [ cm-2] | … | |||
| [ cm-2] | … | … | … | |
| … | … | … | ||
| 1.0d | 1.0d | … | ||
| 1.0 | 1.0 | … | ||
| 1.0 | 1.0 | … | ||
| … | ||||
| [] | ||||
| [] | ||||
| Flux [ ergs cm-2 s-1] e | 23.2 | 23.3 | 23.3 | 11.8 |
aMultiplied by tbabs to account for Galactic absorption
b3–78 keV bandpasses exclude the iron line complex (5.5–7.5 keV)
cInsensitive to fit
dFixed
eObserved flux in the bandpass
V1223 Sgr was discovered by Uhuru (Forman et al., 1978), but only identified as a CV three years later (Steiner et al., 1981). The WD has s (Osborne et al., 1985) and the binary orbital period is 3.37h (Jablonski & Steiner, 1987). As one of the brightest and most well studied IPs, there are a range of mass estimates from for the WD in V1223 Sgr (see Hayashi et al., 2011, and references therein).
Neither the reflect*ipm with fixed inclination (free reflection fraction), nor with varying inclination () provide a formally acceptable fit in the 3–78 keV band (; 919 dof and ; 919 dof, respectively). The residuals suggest that the fit is poor below keV, indicating that we are likely accounting for absorption incorrectly. To this end, we modify the fit with the addition of a partial covering model (pcfabs), to account for absorption by the pre-shock flow. The fit improves (; 917 dof) with a partial covering column density and covering fraction and we find in this case.
The uncovered IPM model, with no reflection, provides a good fit (; 423 dof) to the 15–78 keV band spectrum and we find , consistent with the 3–78 keV band measurement. Our measurements are more indicative of a moderate mass WD, in agreement with previous measurements of , and (Beuermann et al., 2004; Yuasa et al., 2010; Hayashi et al., 2011), rather than a heavy () WD, as suggested by Ramsay (2000) and Evans & Hellier (2007).
4 Discussion
4.1 WD mass measurements
We have shown that it is possible to obtain accurate mass estimates for WDs in IPs by modelling the X-ray spectrum in the 3–78 keV band as a one-dimensional accretion flow, which cools via bremsstrahlung as it descends on to the surface of the WD (Suleimanov et al., 2005). Though previous studies have suggested that reflection may have a negligible effect on the measured mass (Cropper et al., 1998), it has been shown that it is an important component in observed X-ray spectra (Mukai et al., 2015). In the case of V1223 Sgr, we require a partial covering component to account for the absorption effects of the accretion curtain.
We also constrain consistent WD masses with only the 15–78 keV portion of the spectrum (see also Yuasa et al., 2012; Hailey et al., 2016). This has the advantage of reducing computational time but still producing a consistent mass estimate, though with slightly larger statistical uncertainties. Still, this method can be used as a robust estimate of WD mass, before more complicated models are considered over the full band.
The derived masses for the three IPs studied here are mostly consistent with previous measurements. However, the largest discrepancy lies with V709 Cas, where the mass of the WD was derived to be by Yuasa et al. (2010), compared to derived in this work (consistent with Ramsay, 2000; Suleimanov et al., 2005; Brunschweiger et al., 2009). Yuasa et al. (2010) note that there may be some systematic uncertainties present in their results as a result of the limitations of their model, and we note here the large residuals in the Suzaku spectral fits, and the resultant large negative uncertainty in the derived mass. This does not necessarily mean that our work is free from potential systematic uncertainties - we do use the same model as Suleimanov et al. (2005) and Brunschweiger et al. (2009) and derive consistent masses - but NuSTAR is less susceptible to an uncertain background estimation due to its capability as an imaging telescope. Also, Yuasa et al. (2010) do not provide a treatment of reflection in their modelling, despite it having been shown to be an important component of the X-ray spectrum of V709 Cas (Mukai et al., 2015). We investigate this by fitting an IPM model with no reflection component to the 3–78 keV (excluding 5.5–7.5 keV as before) spectra of V709 Cas. We find an unacceptable fit (; 660 dof) and , consistent with Yuasa et al. (2010). It is therefore evident that the mistreatment of reflection in X-ray spectral fitting can lead to a misinterpretation of WD mass.
4.2 Underestimation of WD mass?
The IPM model (Suleimanov et al., 2005) utilizes the link between the temperature of the standing shock and the mass of the WD. The model assumes that the inner radius of the accretion disc, , which terminates at the magnetospheric radius of the WD, , is far enough from the WD surface that accreting material can be considered to be free-falling from infinity. However, if is sufficiently small ( WD radii, ), then the accretion flow will be accelerated to lower velocities, and the shock will have a lower temperature than derived by the assumed model (Suleimanov et al., 2016). This leads to the possibility of some WD masses being underestimated by IP mass models.
Revnivtsev et al. (2009, 2011) postulated that the frequency of the break that is commonly seen in the power spectra of systems with magnetospherically truncated accretion discs corresponds to the Kepler frequency at . Therefore, measuring this break could provide an estimate of . Based on this relation Suleimanov et al. (2016) claimed that the magnetospheres of the two IPs, GK Per and EX Hya, reached to , and thus these WD masses had been underestimated previously (e.g. by Suleimanov et al., 2005; Yuasa et al., 2010).
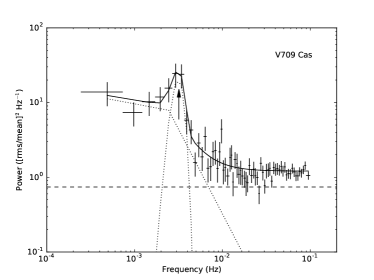
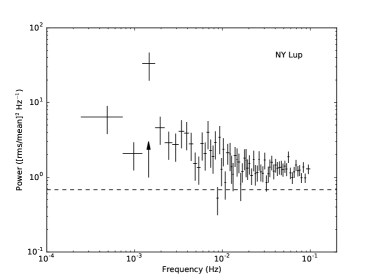
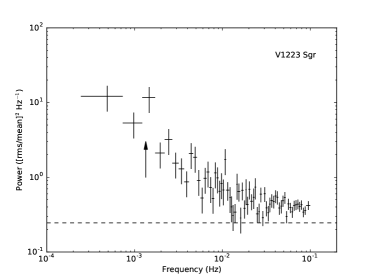
Here we investigate the possibility of a misinterpretation of affecting our mass measurements of the three IPs studied in this work. We construct the power spectra for these three IPs (Fig. 2) using the python package MaLTPyNT (Bachetti, 2015). Power spectra are constructed from 2048s light curve segments and combined to produce the averaged power spectrum for each source. We find that NY Lup and V1223 Sgr exhibit no obvious break in their power spectra, with the only visible indicator of discrete variability being the spin period of the WDs in each system. This is contrary to Revnivtsev et al. (2011) who report a break at Hz in optical photometry of V1223 Sgr. We must note here that white noise dominates the power spectra at frequencies above Hz, so a break at 0.07 Hz would likely be undetectable. However, if the break as measured by Revnivtsev et al. (2011) is indeed indicative of the Kepler frequency, then this would indicate that is extremely close to the WD surface ( for a WD). If this were the case we would see a very soft X-ray spectrum as the accretion flow would not be accelerated to very high velocities before reaching the shock - if accelerated at all - and the post-shock region would have a very low temperature. This is not in agreement with the observed properties of V1223 Sgr, which exhibits a shock temperature of keV (Yuasa et al., 2010; Mukai et al., 2015), typical of IPs.
The power spectrum of V709 Cas, however, may show a break close to or at the spin frequency. To investigate, we fit a model consisting of a broken power law, with a Gaussian at the spin frequency, and a order polynomial for the white noise at higher frequencies. We find that a power law with a break at Hz can constrain the power spectrum. However, the fit is indistinguishable at 90% confidence from a single power law model, with a Gaussian at the spin period ( for one more degree of freedom). We therefore cannot confidently claim the detection of a break and do not attempt to use to modify the masses we have derived in this work.
We can use the fact that most IPs are approximately in spin equilibrium (King & Lasota, 1991; King, 1993) as an independent approximation of . For mCVs in spin equilibrium, (and therefore ) is approximately equal to the co-rotation radius (King & Lasota, 1991). For NY Lup and V 1223 Sgr , which is far enough away from the WD surface to have a negligible effect on the shock temperature. However, the low s (Haberl & Motch, 1995; Norton et al., 1999) of V709 Cas suggests that may be closer to the WD surface. Using the Nauenberg (1972) relation between WD mass and radius we find for a WD. This is still not close enough to the WD to have a large effect on the derived according to Suleimanov et al. (2016). The temperature of the shock , where is the mean molecular weight for a completely ionized plasma with solar abundances and is the proton mass. The best-fit mass implies keV. If we re-calculate the mass using this temperature and instead place the inner disk at , we find - an increase but still consistent within uncertainties with the mass derived from an infinite fall height.
4.2.1 Location of the standing shock
Another caveat of the IPM model (Suleimanov et al., 2005) is that it assumes that the standing shock is formed immediately above the WD surface. However, this may not always be the case. To explain the differing amplitudes of reflected emission seen in the three systems studied in this work, Mukai et al. (2015) propose that the shock may form at a non-negligible distance from the WD surface, dependent on the level of reflection exhibited. V709 Cas exhibits a low reflection amplitude and thus the shock is likely above the WD. Conversely, NY Lup, which shows strong reflection in its spectrum, likely has a shock close to the WD surface, consistent with the assumptions in the Suleimanov et al. (2005) model. To explain the level of reflection seen in the spectrum of V1223 Sgr, Mukai et al. (2015) suggest a shock height of .
Underestimating the shock height leads to an underestimation of as it introduces an additional term to the calculation of the shock temperature: . In the case of V709 Cas, a shock with temperature keV located above the WD would imply . The inclusion of the fall height at would increase the WD mass further to .
In addition to the case of V709 Cas, Mukai et al. (2015) suggest a shock height of for V1223 Sgr. This would imply - a slight increase but consistent within uncertainties with the best-fit mass derived from the IPM model. It is evident that the shock height can have an non-negligible effect on the derived WD mass if it is more than a few tenths of a WD radius above the stellar surface and should be carefully considered in the analysis of IP spectroscopy.
4.3 Comparison with cooling flow models
In their study of reflection from the three IPs presented in this work, Mukai et al. (2015) utilize an isobaric cooling flow model to characterise the emission from the post-shock region (mkcflow; Mushotzky & Szymkowiak, 1988). We can use the best-fit shock temperatures to derive the implied mass and compare to the IPM model fits in this work. Assuming the material is falling from infinity and forming a shock just above the surface of the WD (which we note above may not be a completely valid assumption but mirrors the model of Suleimanov et al., 2005), then .
The best fit temperatures are , and keV for V709 Cas, NY Lup and V1223 Sgr, respectively. This translates to , and , respectively, utilising the Nauenberg (1972) mass-radius relation. For V709 Cas and V1223 Sgr, these values are broadly consistent, within uncertainties, with those calculated from our IPM model fits. However, there is a remarkable difference for NY Lup, for which we derive using the IPM model to fit the spectrum. It is worth noting here that, out of the three sources studied in this work, NY Lup is the one that is most affected by a reflection component, which may have an effect on either the temperature derived from the cooling flow model, or on the mass derived from the IPM model. However, the likely reason for the discrepancy is the high value of keV, which drives the location of the cut-off in a bremsstrahlung energy spectrum. The cut-off for NY Lup is beyond 50 keV, where the background is much more dominant, and thus it is difficult to constrain tightly. It is possible that the current data do not provide robust constraints on high mass WDs, and that longer exposures are required in order to increase signal-to-noise at high energies.
4.4 Iron abundance
In all of our fits, we have assumed Wilms et al. (2000) solar abundances for the reflecting surface, including of iron. Conversely, analysis of Fe lines in IP spectra suggests that the majority of WDs in IPs have significantly sub-solar Fe abundances (see e.g. Ezuka & Ishida, 1999; Yuasa et al., 2010). However, as the majority of confirmed IPs are at distances pc (Suleimanov et al., 2005, and references therein), and therefore in the solar neighbourhood, we would expect the abundances of the companion stars (and therefore the accreted material) to be similar to that of the Sun, on average. It is unclear if we would expect the abundance of the reflector (i.e. the WD surface) to be significantly sub-solar, but as it is continuously accreting stellar material from a main sequence companion in the solar neighbourhood, then, unless the elements quickly stratify, then it would not be unreasonable to assume solar abundances. We therefore approach the subject of iron abundance with some caution.
Nevertheless, we show here how changes in abundances can affect reflection and therefore the derived mass. Fixing to a value of 0.5 (relative to solar), we find , and for V709 Cas, NY Lup and V1223 Sgr, respectively. Lowering iron abundances has the effect of increasing the derived mass (by approximately one error bar), but it is unclear if a sub-solar is the correct approach.
We must note here that a degeneracy is present if , and are all allowed to vary at the same time, so an accurate interpretation of all three parameters simultaneously is not possible with the current modelling strategy. A detailed study of abundances is possible with grating spectroscopy of the iron line region with e.g. Chandra/High Energy Transmission Grating Spectrometer (HETGS) or the micro-calorimeter of the future X-ray Astronomy Recovery Mission (XARM).
4.5 Toward a systematic IP survey
Here we have shown that we can accurately model WD masses in IPs (within ) using relatively short exposures with NuSTAR. We can improve on the precision of previous measurements determined using non-imaging telescopes in significantly less time. For example, a 46.2 ks observation of V1223 Sgr with Suzaku enabled Yuasa et al. (2010) to derive , compared to the 20.4 ks NuSTAR observation presented here from which we calculated . We even derive tighter constraints from our NuSTAR spectra than from 2.5 years of Swift/BAT observations (Brunschweiger et al., 2009). Also, NuSTAR is the first telescope to unambiguously detect Compton reflection in IPs (Mukai et al., 2015), which is an important component in modelling their hard X-ray spectra.
This brings into context the potential efficiency of a systematic survey of IPs with NuSTAR. We have therefore devised a Ms NuSTAR Legacy Survey222https://www.nustar.caltech.edu/page/legacy_surveys#g7 (PI: Shaw) of 25 mCVs in order to efficiently measure the WD mass distribution in IPs, which has many important implications for binary evolution models and the production of type Ia supernovae (Zorotovic et al., 2011). To devise the target list we selected the 25 brightest mCVs in the Swift/BAT 70 month catalogue (Baumgartner et al., 2013) that have not previously been observed with NuSTAR.
5 Conclusions
We have modelled the mass of three bright IPs observed with NuSTAR and found that the measured masses are consistent with the majority of previously published measurements but with tighter constraints. For NY Lup we find a very strong reflection component that contributes to the X-ray spectrum even above 15 keV, confirming the results of Mukai et al. (2015). We find no strong evidence for a break in the power spectra of the sources, suggesting that the inner edge of the accretion disc is likely relatively distant from the WD, unlike in GK Per (Suleimanov et al., 2016). However, we do present our results with caveats, showing that just a slight change in the height of the shock above the WD, the location of the inner accretion disc, or the iron abundance can alter our interpretation of the derived WD mass. This work, along with that of Hailey et al. (2016) and Suleimanov et al. (2016) has shown that NuSTAR is the ideal facility with which to perform a systematic survey of IPs in order to accurately determine the mass distribution of WDs in mCVs. This will be realised with an approved Ms NuSTAR Legacy Survey.
Acknowledgements
We thank the anonymous referee for useful comments which helped improve the manuscript. COH and GRS are supported by NSERC Discovery Grants and COH by a Discovery Accelerator Supplement. This work made use of data from the NuSTAR mission, a project led by the California Institute of Technology, managed by the Jet Propulsion Laboratory, and funded by the National Aeronautics and Space Administration. We thank the NuSTAR Operations, Software and Calibration teams for support with the execution and analysis of these observations. This research has made use of the NuSTAR Data Analysis Software (NuSTARDAS) jointly developed by the ASI Science Data Center (ASDC, Italy) and the California Institute of Technology (USA).
References
- Aizu (1973) Aizu K., 1973, Progress of Theoretical Physics, 49, 1184
- Arnaud (1996) Arnaud K. A., 1996, in Jacoby G. H., Barnes J., eds, Astronomical Society of the Pacific Conference Series Vol. 101, Astronomical Data Analysis Software and Systems V. p. 17
- Bachetti (2015) Bachetti M., 2015, MaLTPyNT: Quick look timing analysis for NuSTAR data, Astrophysics Source Code Library (ascl:1502.021)
- Baumgartner et al. (2013) Baumgartner W. H., Tueller J., Markwardt C. B., Skinner G. K., Barthelmy S., Mushotzky R. F., Evans P. A., Gehrels N., 2013, ApJS, 207, 19
- Beuermann et al. (2004) Beuermann K., Harrison T. E., McArthur B. E., Benedict G. F., Gänsicke B. T., 2004, A&A, 419, 291
- Brunschweiger et al. (2009) Brunschweiger J., Greiner J., Ajello M., Osborne J., 2009, A&A, 496, 121
- Cropper et al. (1998) Cropper M., Ramsay G., Wu K., 1998, MNRAS, 293, 222
- Done & Magdziarz (1998) Done C., Magdziarz P., 1998, MNRAS, 298, 737
- Evans & Hellier (2007) Evans P. A., Hellier C., 2007, ApJ, 663, 1277
- Ezuka & Ishida (1999) Ezuka H., Ishida M., 1999, ApJS, 120, 277
- Ferrario et al. (2015) Ferrario L., de Martino D., Gänsicke B. T., 2015, Space Sci. Rev., 191, 111
- Forman et al. (1978) Forman W., Jones C., Cominsky L., Julien P., Murray S., Peters G., Tananbaum H., Giacconi R., 1978, ApJS, 38, 357
- Fukazawa et al. (2009) Fukazawa Y., et al., 2009, PASJ, 61, S17
- Haberl & Motch (1995) Haberl F., Motch C., 1995, A&A, 297, L37
- Haberl et al. (2002) Haberl F., Motch C., Zickgraf F.-J., 2002, A&A, 387, 201
- Hailey et al. (2016) Hailey C. J., et al., 2016, ApJ, 826, 160
- Harrison et al. (2013) Harrison F. A., et al., 2013, ApJ, 770, 103
- Hayashi et al. (2011) Hayashi T., Ishida M., Terada Y., Bamba A., Shionome T., 2011, PASJ, 63, S739
- Jablonski & Steiner (1987) Jablonski F., Steiner J. E., 1987, ApJ, 323, 672
- Katajainen et al. (2010) Katajainen S., Butters O., Norton A. J., Lehto H. J., Piirola V., Berdyugin A., 2010, ApJ, 724, 165
- Katz (1977) Katz J. I., 1977, ApJ, 215, 265
- King (1993) King A. R., 1993, MNRAS, 261, 144
- King & Lasota (1991) King A. R., Lasota J.-P., 1991, ApJ, 378, 674
- Magdziarz & Zdziarski (1995) Magdziarz P., Zdziarski A. A., 1995, MNRAS, 273, 837
- Motch et al. (1996) Motch C., Haberl F., Guillout P., Pakull M., Reinsch K., Krautter J., 1996, A&A, 307, 459
- Mukai et al. (2015) Mukai K., Rana V., Bernardini F., de Martino D., 2015, ApJ, 807, L30
- Mushotzky & Szymkowiak (1988) Mushotzky R. F., Szymkowiak A. E., 1988, in Fabian A. C., ed., NATO Advanced Science Institutes (ASI) Series C Vol. 229, NATO Advanced Science Institutes (ASI) Series C. pp 53–62
- Nauenberg (1972) Nauenberg M., 1972, ApJ, 175, 417
- Norton et al. (1999) Norton A. J., Beardmore A. P., Allan A., Hellier C., 1999, A&A, 347, 203
- Osborne et al. (1985) Osborne J. P., Rosen R., Mason K. O., Beuermann K., 1985, Space Sci. Rev., 40, 143
- Patterson (1994) Patterson J., 1994, PASP, 106, 209
- Potter et al. (2012) Potter S. B., Romero-Colmenero E., Kotze M., Zietsman E., Butters O. W., Pekeur N., Buckley D. A. H., 2012, MNRAS, 420, 2596
- Ramsay (2000) Ramsay G., 2000, MNRAS, 314, 403
- Revnivtsev et al. (2009) Revnivtsev M., Churazov E., Postnov K., Tsygankov S., 2009, A&A, 507, 1211
- Revnivtsev et al. (2011) Revnivtsev M., Potter S., Kniazev A., Burenin R., Buckley D. A. H., Churazov E., 2011, MNRAS, 411, 1317
- Rothschild et al. (1981) Rothschild R. E., et al., 1981, ApJ, 250, 723
- Steiner et al. (1981) Steiner J. E., Schwartz D. A., Jablonski F. J., Busko I. C., Watson M. G., Pye J. P., McHardy I. M., 1981, ApJ, 249, L21
- Suleimanov et al. (2005) Suleimanov V., Revnivtsev M., Ritter H., 2005, A&A, 443, 291
- Suleimanov et al. (2016) Suleimanov V., Doroshenko V., Ducci L., Zhukov G. V., Werner K., 2016, A&A, 591, A35
- Thorstensen et al. (2010) Thorstensen J. R., Peters C. S., Skinner J. N., 2010, PASP, 122, 1285
- Wilms et al. (2000) Wilms J., Allen A., McCray R., 2000, ApJ, 542, 914
- Yuasa et al. (2010) Yuasa T., Nakazawa K., Makishima K., Saitou K., Ishida M., Ebisawa K., Mori H., Yamada S., 2010, A&A, 520, A25
- Yuasa et al. (2012) Yuasa T., Makishima K., Nakazawa K., 2012, ApJ, 753, 129
- Zorotovic et al. (2011) Zorotovic M., Schreiber M. R., Gänsicke B. T., 2011, A&A, 536, A42
- de Martino et al. (2006) de Martino D., Bonnet-Bidaud J.-M., Mouchet M., Gänsicke B. T., Haberl F., Motch C., 2006, A&A, 449, 1151
- van der Klis (1997) van der Klis M., 1997, in Babu G. J., Feigelson E. D., eds, Statistical Challenges in Modern Astronomy II. p. 321 (arXiv:astro-ph/9704273)