Supplemental material for “Symmetry-breaking supercollisions in Landau-quantized graphene”
pacs:
Sample growth and doping
Both multilayered epitaxial graphene (MEG) samples were grown on the C-terminated (000-1) face of 4H-SiC substrates with maximum 0.2 degree misorientation by thermal decomposition of SiC. Two different confinement controlled sublimation (CCS) de Heer et al. (2011) furnaces were used, where graphene grows under the Si vapor in quasi-equilibrium above the SiC crystal at high temperature. The low quality sample was grown at C for 18 min on a pre-etched SiC substrate. The high quality sample was grown directly on an epitaxy ready CMP polished surface. It was annealed twice at C for 60 min, with a decomposition step at C for 20 min.
The multilayer epitaxial graphene layers are composed of a highly doped layer at the interface with SiC, followed by about three layers of exponentially decreasing doping Sun et al. (2008) and large number (for our samples about 40 - 50 layers) of almost neutral graphene Orlita et al. (2008). The experiments at a photon energy of 75 meV are sensitive to the almost intrinsic layers. Experiments using all combinations of pumping and probing with and polarized radiation indicate that both samples feature slight n-type doping. The Fermi energy (at B = 0) for the high quality sample is about 10 meV to 15 meV König-Otto et al. (2016), for the low quality sample 28 meV Mittendorff et al. (2014).
Long time scan
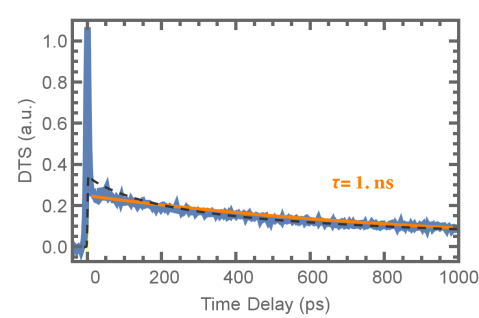
To demonstrate the slow decay time in the high quality sample, in Fig. S1 we provide the experimental signal for a time range of up to (blue line) which is complemented by an exponential fit (orange line) and the theoretical result (dashed black line). Fig. S1 shows the result for linear polarized pumping and probing with -polarized radiation. The plot confirms the extracted decay time in the order of in the high quality sample in Fig. S1a in the main manuscript. Unfortunately, the data is not available for the most simple case discussed in the main manuscript, i.e. pumping and probing with -polarized radiation.
Raman spectroscopy
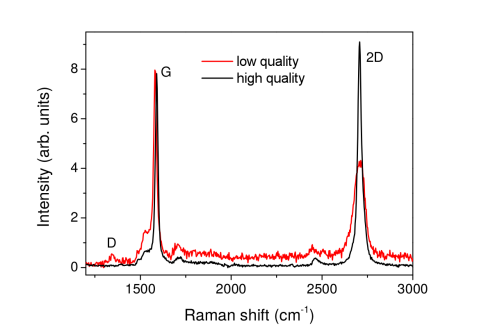
The Raman spectra of both samples are depicted in Fig. S2. They are measured with an excitation wavelength of 532 nm. Both samples feature single-Lorentzian 2D peaks as expected for electronically decoupled graphene layers Faugeras et al. (2008). The most prominent indication for the high structural quality of the MEG samples is the low intensity of the D-peak at , which is forbidden in defect-free graphene. Indeed the high quality sample shows no D-peak at all, showing the MEG excellent structural quality de Heer et al. (2010). The spectrum of the low quality sample presents a very low D-peak, with an intensity ratio of the G-peak to the D-peak of 20. Note that the additional peaks observed around the G-peak arise from the SiC substrate, and are strongly attenuated because of the large number of graphene layers. A further indication of high structural quality is the narrow width of the 2D-peak. The full width at half maximum is and for the high quality and the low quality sample, respectively. The Raman analysis shows that the high quality sample has a structural quality that is comparable to the purest form of graphene Berciaud et al. (2009), which is quite remarkable considering the large number of layers (The Raman spectrum probe them all since the substrate SiC peaks are visible). The low quality sample, on the other hand, shows signatures of a reduced structural quality, although the Raman spectrum still characterizes it as graphene with very low defect density. Graphene grown by chemical vapor deposition and transferred to is typically of much lower structural quality Lee et al. (2008).
Note that the higher signal-to-noise ratio in the Raman spectrum of the high quality sample (cf. Fig. S2) results from a longer integration time that was chosen to enable resolving even a very tiny D peak if it would be there. The pronounced difference of the G/2D ratios is mainly connected to differences in D-peak width. If we compare the ratios of peak areas, there is only a 5 % difference in the ratio of the areas of the G peak and 2D peaks for the two samples.
Dynamics at zero magnetic field
We investigated the carrier dynamics of both samples also in absence of a magnetic field. To this end, the same photon energy, pump fluence and substrate temperature as for the experiments under Landau quantization was applied. The experiments were performed with linearly polarized radiation with the polarization of the probe beam being perpendicular to the polarization of the pump beam. The results are depicted in Fig. S3. Exactly the same relaxation time of ps is found for the two samples. This is very surprising considering the fact that their relaxation times in case of Landau quantization differ by two orders of magnitude. This observation provides evidence for a very specific relaxation channel, which is opened up in the low quality sample in case of Landau quantization.
Next, we discuss our results with respect to previous studies of the carrier dynamics in graphene with varied structural quality. In an early-stage degenerate pump-probe experiment at a photon energy of 1.5 eV on multilayer epitaxial graphene on SiC, carrier cooling times between 0.4 ps and 1.7 ps for the lowest and highest quality sample, respectively, were found Dawlaty et al. (2008). The much faster relaxation is due to efficient relaxation via optical phonons at the high photon energy Winnerl et al. (2011). The observed dependence of the cooling time on the defect density may be explained by the fairly high amount of defects. The best sample in this study features a higher intensity ratio of G-peak to D-peak than our low quality sample. In a more recent study two-color pump-probe experiments have been performed on graphene with a systematically varied defect concentration Alencar et al. (2014). In these experiment a pump photon energy of 3.1 eV and a probe photon energy of 1.55 eV was applied. Carrier cooling times ranging from 2.0 ps for pristine graphene to 0.7 ps for the sample with the highest amount of defects (intensity ratio of D to G-peak ) were measured. A large number of different samples was investigated in near-infrared pump – terahertz-probe experiments in a very recent study Mihnev et al. (2016). This study is closest to our experiment for two reasons. Firstly, at the low probe photon energy relaxation via optical phonons is impossible. Consequently the observed timescales are much longer, in the 10 ps range. Second, even though many different samples were investigated in the study, they were all of high structural quality as evidenced by a negligible D-peak in the Raman spectra, hence comparable to our two samples. Mihnev et al. do not observe differences in the relaxation dynamics for samples with slightly different structural quality. This behavior is corroborated by microscopic theory, which shows that defect related effects are negligible in this regime. The results of our experiments in absence of a magnetic field are in very good agreement with the findings of Mihnev et al Mihnev et al. (2016).

Intentionally induced defects by ion irradiation
In order to investigate the general role of defects on the carrier dynamics in Landau quantized graphene, a control experiment using ion irradiation was carried out. In this experiment some areas of the high quality sample, that had an area of , were irradiated with C+ ions at an energy of . At this low energy, most of the ions are stopped within the 50 graphene layers and thereby intermixing at the interface to SiC is avoided. One area of the sample was irradiated with a dose of , another one with a dose of and a third was kept pristine. Simple simulations, not taking into account healing effects, provide an upper limit for the concentration of generated defects. This is for the lower dose. For the higher dose the concentration is 50 times higher. It is known that under these conditions mainly single and double vacancies are formed Lehtinen et al. (2010); Åhlgren et al. (2011). Such point defects can enhance defect-assisted electron-phonon scattering, the supercollision process in absence of Landau quantization Alencar et al. (2014). However, since they are not symmetry breaking, these defects should not result in symmetry-breaking supercollisions in Landau-quantized graphene.
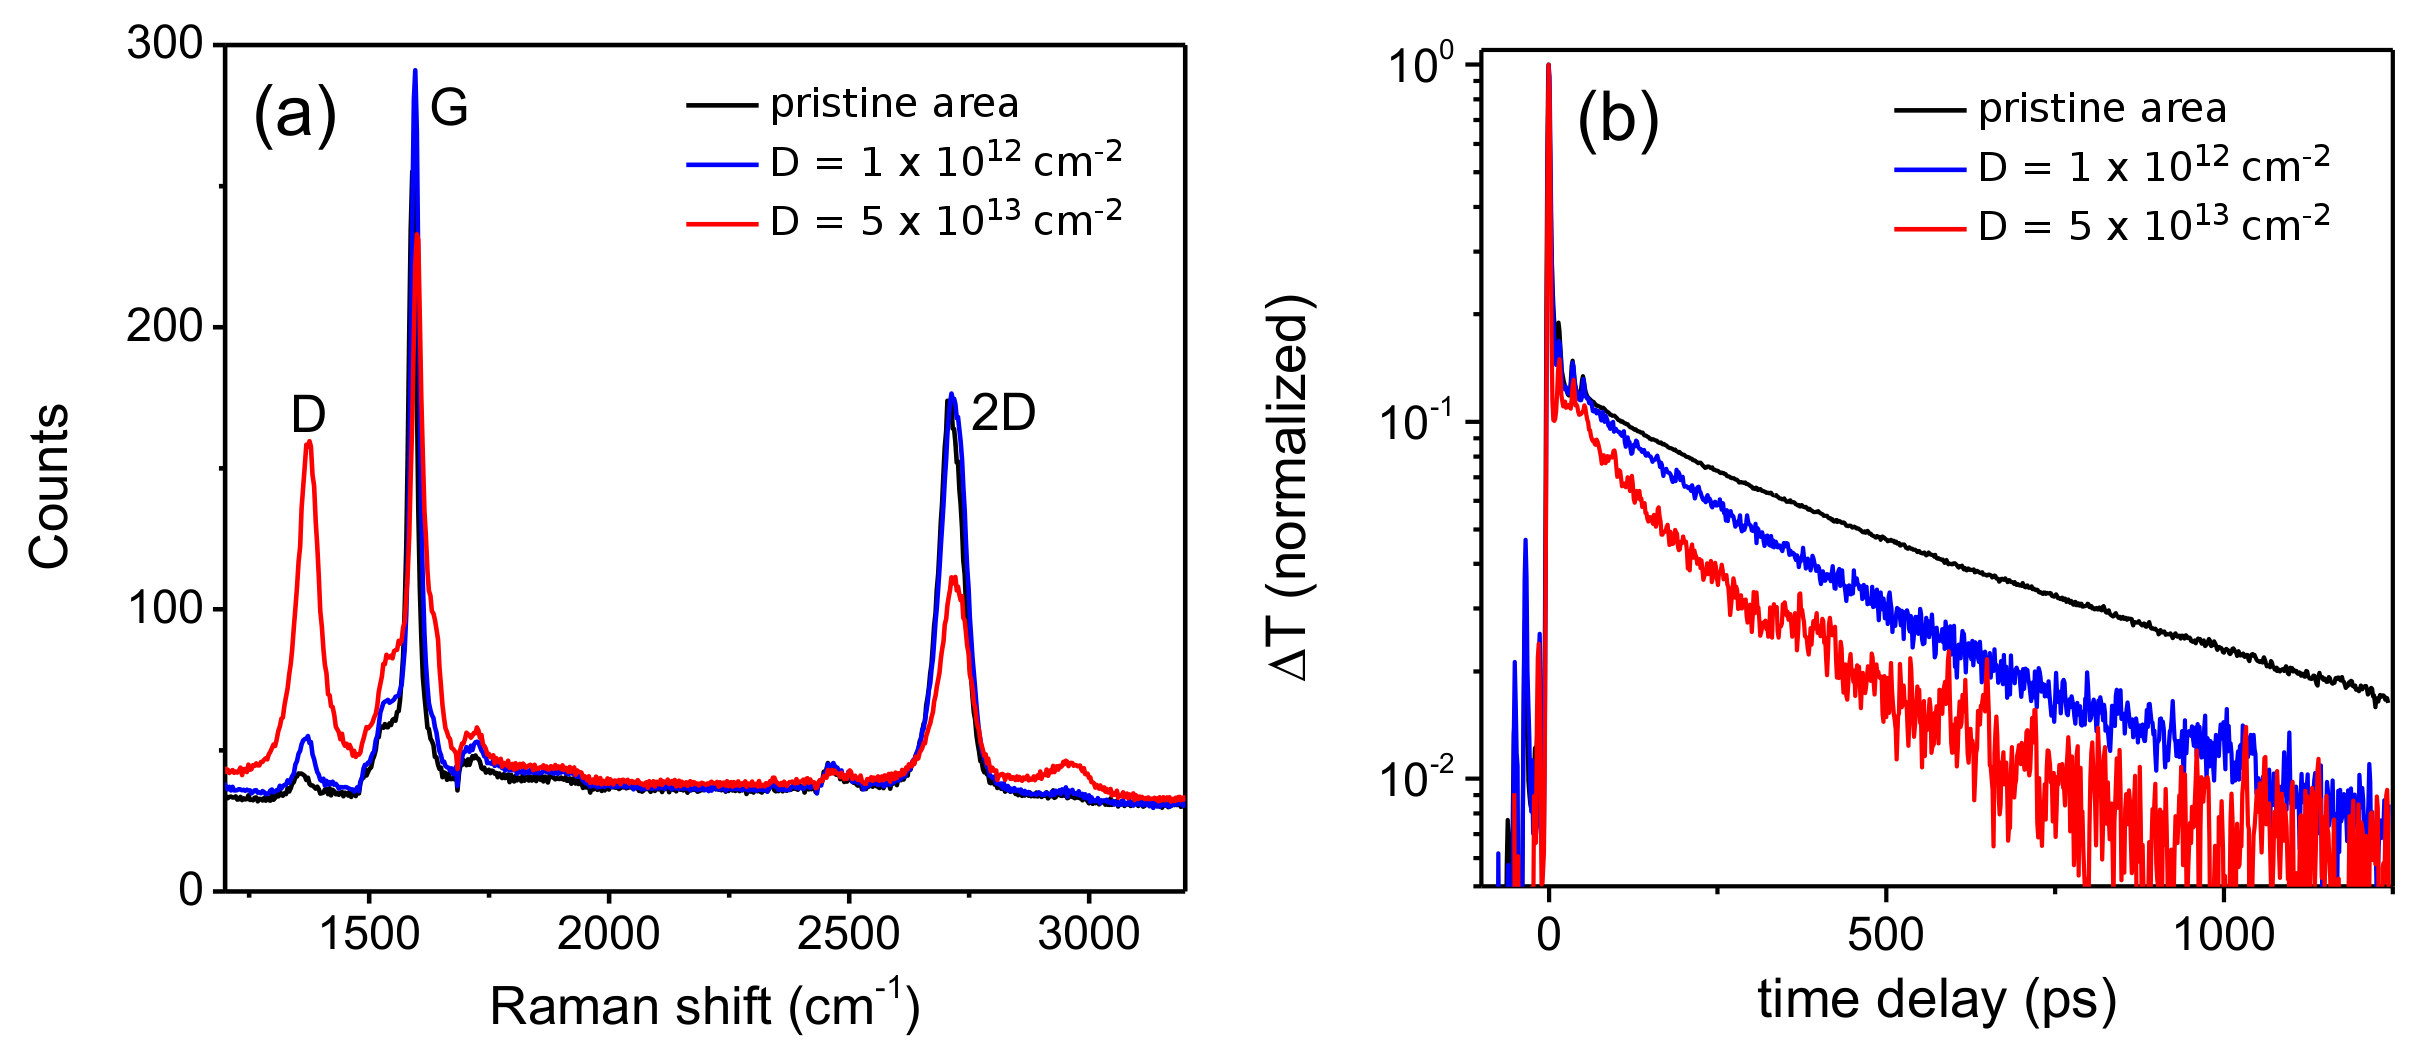
In Fig. S4a Raman spectra from the three areas are depicted. The very small D peak for the pristine graphene, that is absent in the spectrum depicted in Fig. S2 seems to indicate a slight aging of the sample over the roughly 5 years that have passed between the measurements. The induced defects by ion irradiation are clearly seen in the Raman spectra with the dose of () resulting in a G/D peak ratio of 13 (1.6). Note that even for the low dose, the G/D peak ratio of 13 is lower than the ratio of 20 found for the “low quality sample” that is assumed to contain symmetry-breaking defects.
Degenerate pump-probe experiments applying polarized pump and probe beams and a photon energy of were carried out in the resonant magnetic field of . Clearly the relaxation time is reduced with increasing amount of defects. However, the cooling times remain in the few range (cf. Fig. S4b). Even for the case of implantation with a dose of , the relaxation in the time window from is about , i.e. 20 times larger than for the “low quality” sample described in the main text (cf. Fig. 2). Note that at the same time the G/D peak ratio of the sample implanted with high dose is times lower than for the “low quality” sample. This is direct evidence for two facts: Firstly, there is a bottleneck in carrier cooling in Landau quantized graphene when the levels are spaced non-resonantly with the optical phonon energies. Relaxation times in the range for few are found even in a sample with a very large concentration of point defects, so this bottleneck is very robust. Secondly, the results indicate that the “low quality sample” must feature an unusual mechanism that leads to the very short relaxation time of . Finding direct experimental evidence for the presence of symmetry breaking defects and understanding their formation during the growth process are important tasks, which go beyond our present study, in which we present mainly theory that provides a very strong indication that rapid relaxation is due to relaxation via out-of-plane phonons mediated by symmetry-breaking defects. Further experimental work is needed to unambiguously prove that symmetry-breaking supercollisions with ZO phonons are responsible for the dramatically different decay times.
Details of the theory
The disorder averaged (denoted by , cf. Ref. Akkermans and Montambaux, 2007) electron-defect matrix element reads
| (1) | ||||
with the definition , , the form factor which can be found in Ref. Wendler et al. (2015), and the defect-induced dephasing Funk et al. (2015). Note that in order to allow the symmetry-breaking supercollisions proposed in this work, the disorder needs to break the mirror symmetry of the graphene plane. Consequently, we only consider defects of that kind, but in general it is conceivable that there are also defects that affect the dephasing without contributing to supercollisions. It would be straightforward to generalize our approach to this case.
Since the in-plane phonon modes were already described in detail in Ref. Wendler et al. (2015), we focus here on the out-of-plane -mode. The corresponding electron-phonon matrix element is given by Mariani and von Oppen (2010); Wendler et al. (2015)
| (2) | ||||
where is the dimensionless coupling strength as defined in Ref. Basko et al. (2009), with the force exerted on electrons upon a deformation (corresponding to the phonon ) and the mass density of graphene Malic et al. (2011). The calculation of the coupling strength of an electron with a single -phonon () is not straightforward, since this scattering process is forbidden in free-standing graphene and becomes allowed, only if the symmetry with respect to out-of-plane deformations is broken Mariani and von Oppen (2008). Provided this mirror symmetry is broken, for example due to the presence of a substrate or due to an external electric field, a deformation in one perpendicular direction with respect to the graphene plane gives a different energy contribution to electrons than the same deformation in the reverse direction. This means that a deformation in one out-of plane direction leads to a force being exerted on the electrons in graphene, which does not simply equalize the mirrored force, i.e. , under the reverse deformation . Therefore, the coupling strength is determined by that force and it depends on the concrete origin of the mechanism breaking the mirror symmetry. We estimate the coupling strength to be , a value recently measured for graphene on Pt(111) by Politano et al. Politano et al. (2015) in the first experiment demonstrating a first-order coupling of electrons and out-of-plane-phonons in graphene 111In fact, the paper states that . However, within our notation it should be .. While this is certainly a rough estimate, the exact value of the coupling strength is not vital for the novel supercollision we are proposing, since the strong impact of the out-of-plane phonons mainly relies on their favorable energy.
Note that out-of-plane acoustic (ZA) phonons have a very low energy at the point rendering them inefficient for the decay between the lowest Landau levels (where the Landau level distance is the largest). ZA phonons at the K point, have a larger energy and they could result in a faster decay in our theory, which would indicate that the mirror-breaking defect concentration is lower than assumed (but still of the same order). However, we want to stress that the message of the paper is unaffected by this phonon mode.
Phonon spectrum in multilayer graphene
As mentioned above, it has been shown that the individual graphene layers are essentially decoupled in terms of their electronic band structure due to small in-plane rotations of the different layers Faugeras et al. (2008). However, as Ref. Cocemasov et al., 2013 suggests, this is not necessarily true for the phonon spectrum. The paper theoretically investigates the phonon dispersion for twisted graphene layers, where the increased unit cell size leads to the emergence of a large number of hybrid folded phonon modes. This provides an alternative explanation for the dramatically different decay times in the two samples we investigated: A different twisting angle leads to different phonon energies, so that a hybrid folded phonon mode in one of the samples could be in resonance with the inter-Landau level transition under investigation, while this is not the case in the other sample. However, both multilayered epitaxial graphene samples were grown on the C-terminated (000-1) face of 4H-SiC substrates. For these samples it is known that the different graphene sheets can have the rotation angles () or (), where and graphene sheets are interleaved to produce a high density of fault pairs instead of occurring as AB stacked or isolated domains Hass et al. (2008). Therefore, the structure of both samples with respect to the rotation angles between the graphene sheets is expected to be the same, hence, the explanation of our experimental results via different rotation angles in the two samples is unlikely to be true.
Moreover, our results do not rely on the exact phonon energies, but on the fact that the optical in-plane phonon energies are too high and the acoustic in-plane phonon energies are too low to explain the fast decay in the low quality sample, while the -mode has an intermediate energy in the range of the relevant inter-Landau level transition. From the observed extremely slow decay in the high quality sample we can conclude that phonon modes with energies fitting the inter-Landau level transition under investigation are absent in this sample, hence, they should also be absent in the low quality sample.
References
- de Heer et al. (2011) W. A. de Heer, C. Berger, M. Ruan, M. Sprinkle, X. Li, Y. Hu, B. Zhang, J. Hankinson, and E. Conrada, Proc. Nat. Acad. Sci. 108, 16900 (2011).
- Sun et al. (2008) D. Sun, Z.-K. Wu, C. Divin, X. Li, C. Berger, W. A. de Heer, P. N. First, and T. B. Norris, Phys. Rev. Lett. 101, 157402 (2008).
- Orlita et al. (2008) M. Orlita, C. Faugeras, P. Plochocka, P. Neugebauer, G. Martinez, D. K. Maude, A.-L. Barra, M. Sprinkle, C. Berger, W. A. de Heer, and M. Potemski, Phys. Rev. Lett. 101, 267601 (2008).
- König-Otto et al. (2016) J. C. König-Otto, M. Mittendorff, T. Winzer, F. Kadi, E. Malic, A. Knorr, C. Berger, W. A. de Heer, A. Pashkin, H. Schneider, M. Helm, and S. Winnerl, Phys. Rev. Lett. 117, 087401 (2016).
- Mittendorff et al. (2014) M. Mittendorff, F. Wendler, E. Malic, A. Knorr, M. Orlita, M. Potemski, C. Berger, W. a. de Heer, H. Schneider, M. Helm, and S. Winnerl, Nat. Phys. 11, 75 (2014).
- Faugeras et al. (2008) C. Faugeras, A. Nerrière, M. Potemski, A. Mahmood, E. Dujardin, C. Berger, and W. A. de Heer, Appl. Phys. Lett. 92, 011914 (2008).
- de Heer et al. (2010) W. A. de Heer, C. Berger, X. Wu, M. Sprinkle, Y. Hu, M. Ruan, J. A. Stroscio, P. N. First, R. Haddon, B. Piot, C. Faugeras, M. Potemski, and J.-S. Moon, J. Phys. D: Appl. Phys. 43, 374007 (2010).
- Berciaud et al. (2009) S. Berciaud, S. Ryu, L. E. Brus, and T. F. Heinz, Nano Lett. 9, 346 (2009).
- Lee et al. (2008) D. S. Lee, C. Riedl, B. Krauss, K. von Klitzing, U. Starke, and J. H. Smet, Nano Lett. 8, 4320 (2008).
- Dawlaty et al. (2008) J. M. Dawlaty, S. Shivaraman, M. Chandrashekhar, F. Rana, and M. G. Spencer, Appl. Phys. Lett. 92, 042116 (2008).
- Winnerl et al. (2011) S. Winnerl, M. Orlita, P. Plochocka, P. Kossacki, M. Potemski, T. Winzer, E. Malic, A. Knorr, M. Sprinkle, C. Berger, W. A. de Heer, H. Schneider, and M. Helm, Phys. Rev. Lett. 107, 237401 (2011).
- Alencar et al. (2014) T. V. Alencar, M. G. Silva, L. M. Malard, and A. M. de Paula, Nano Lett. 14, 5621 (2014).
- Mihnev et al. (2016) M. T. Mihnev, F. Kadi, C. J. Divin, T. Winzer, S. Lee, C.-H. Liu, Z. Zhong, C. Berger, W. a. de Heer, E. Malic, A. Knorr, and T. B. Norris, Nat. Commun. 7, 11617 (2016).
- Lehtinen et al. (2010) O. Lehtinen, J. Kotakoski, A. V. Krasheninnikov, A. Tolvanen, K. Nordlund, and J. Keinonen, Phys. Rev. B 81, 153401 (2010).
- Åhlgren et al. (2011) E. H. Åhlgren, J. Kotakoski, and A. V. Krasheninnikov, Phys. Rev. B 83, 115424 (2011).
- Akkermans and Montambaux (2007) E. Akkermans and G. Montambaux, Mesoscopic Physics of Electrons and Photons (Cambridge University Press, 2007).
- Wendler et al. (2015) F. Wendler, A. Knorr, and E. Malic, Nanophotonics 4, 224 (2015).
- Funk et al. (2015) H. Funk, A. Knorr, F. Wendler, and E. Malic, Phys. Rev. B 92, 205428 (2015).
- Mariani and von Oppen (2010) E. Mariani and F. von Oppen, Phys. Rev. B 82, 195403 (2010).
- Basko et al. (2009) D. M. Basko, S. Piscanec, and A. C. Ferrari, Phys. Rev. B 80, 165413 (2009).
- Malic et al. (2011) E. Malic, T. Winzer, E. Bobkin, and A. Knorr, Phys. Rev. B 84, 205406 (2011).
- Mariani and von Oppen (2008) E. Mariani and F. von Oppen, Phys. Rev. Lett. 100, 076801 (2008).
- Politano et al. (2015) A. Politano, F. de Juan, G. Chiarello, and H. A. Fertig, Phys. Rev. Lett. 115, 075504 (2015).
- Note (1) In fact, the paper states that . However, within our notation it should be .
- Cocemasov et al. (2013) A. I. Cocemasov, D. L. Nika, and A. A. Balandin, Phys. Rev. B 88, 035428 (2013).
- Hass et al. (2008) J. Hass, F. Varchon, J. E. Millán-Otoya, M. Sprinkle, N. Sharma, W. A. de Heer, C. Berger, P. N. First, L. Magaud, and E. H. Conrad, Phys. Rev. Lett. 100, 125504 (2008).