Al/Ti/Al phonon-mediated KIDs for UV-VIS light detection over large areas
Abstract
The development of wide-area cryogenic light detectors with baseline energy resolution lower than 20 eV RMS is essential for next generation bolometric experiments searching for rare interactions. Indeed the simultaneous readout of the light and heat signals will enable background suppression through particle identification.
Because of their excellent intrinsic energy resolution, as well as their well-established reproducibility, Kinetic Inductance Detectors (KIDs) are good candidates for the development of next generation light detectors. The CALDER project is investigating the potential of phonon-mediated KIDs.
The first phase of the project allowed to reach a baseline resolution of 80 eV using a single KID made of aluminium on a 2x2 cm silicon substrate acting as photon absorber. In this paper we present a new prototype detector implementing a trilayer aluminium-titanium-aluminium KID. Taking advantage of superconducting proximity effect the baseline resolution improves down to 26 eV.
1 Introduction
In the last decade, Kinetic Inductance Detectors (KIDs)[1] underwent a rapid development, allowing their successful application to millimeter [2] and UV astronomy [3]. Different projects are currently on-going with the aim to apply this technology to other fields, ranging from the search of extrasolar planets [4] to X-ray spectroscopy [5, 6].
The CALDER project [7] is developing large area phonon-mediated KIDs with the aim of detecting small amounts of ultraviolet-visible (UV-VIS) light. Such detectors will play a crucial role for the next-generation bolometric experiments searching for neutrinoless double- decay. CUORE [8], the current leading bolometric experiment, is an array of 988 TeO2 crystals read by NTD sensors. Its sensitivity to double- decay is mainly limited by the background induced by the radioactivity of the material surrounding the detector at cryogenic temperature, mainly copper. The possibility to distinguish different particles would allow to overcome this limit. Particle identification could be accomplished by measuring the Cherenkov light ( 100 eV) emitted in a TeO2 crystal by electrons, that are the signal candidates, but not by particles [9, 10, 11]. CUPID[12, 13], the planned upgrade of CUORE, will therefore require light detectors able to monitor the whole face of a crystal ( 25 cm) with a baseline energy resolution good enough to clearly detect this tiny amount of light (< 20 eV RMS).
One of the limits of KIDs is that they can reach a maximum sensitive area of a few mm2[14]. To increase the sensible area to several cm2 we opted for a phonon-mediated approach[16]: photons are absorbed by the silicon substrate on which the KID is deposited and produce athermal or ballistic phonons able to reach the KID, where they break Cooper pairs and generate a signal. The use of KIDs as phonon-mediated detectors was proposed for the detection of Dark matter [15], cosmic rays [16] and X-rays [17, 18]. The application of such detectors to detect visible light was initially studied by the CALDER project, using an array of 4 KIDs [19], made of aluminium and lithographed on a cm2, 300 m thick silicon substrate. Recently it was demonstrated a baseline resolution of 82 eV using a single KID made of aluminium and combining both phase and amplitude readout, that had respectively a baseline resolution of 105 eV and 115 eV[20]. In the following we describe a resolution improvement down to 26 eV, obtained using a trilayer KID made of titanium (Ti) and aluminium (Al).
2 Detector description
KIDs base their working principle on the kinetic inductance of Cooper pairs, which can be modified by an energy release able to break them into quasi-particles (QPs). If the superconductor is inserted in a resonant RLC circuit with high quality factor (), the density variation of QPs modifies the transfer function of the resonator both in phase and in amplitude. The phase readout is usually preferred since the phase response is larger (up to a factor 10) and is given by [21]:
| (1) |
where is the energy to QPs conversion efficiency, is the fraction of kinetic inductance with respect to total inductance, is the superconducting gap, is the single spin density of states and the detector volume. is a dimensionless factor given by the Mattis-Bardeen theory, describing the phase responsivity as a function of frequency and effective temperature [22]. Finally is the quality factor of the resonator. The detector described in [20], made of a 60 nm thick Al film, featured , , , eV, m3, , while for aluminium eVm-3.
One way to improve the responsivity is to increase the fraction of kinetic inductance and to reduce the superconducting gap , without affecting significantly the other parameters in Eq. 1. This can be achieved by exploiting the superconducting proximity effect between aluminium and a lower gap superconductor, such as titanium. Titanium also features a higher kinetic inductance due to its higher penetration depth [23] leading to a significant increase of . However titanium was never demonstrated to work as a high quality factor resonator, possibly because of its high sensitivity to contaminants [24], yielding dissipative conducting states. This leads us naturally to protect titanium with aluminium, which is known to have an almost lossless self-protecting oxide layer. Moreover, to efficiently collect phonons from the substrate into the superconductor it is important to have an acoustic impedance matching between the substrate and the KID. In that respect, aluminium provides a better coupling to silicon than titanium [25]. The geometry, we present, is thus an Al-Ti-Al trilayer with the following thicknesses: Al 14 nm / Ti 33 nm / Al 30 nm.
The fabrication of the chip was made according to the following steps. The intrinsic 380 m thick Si <100> wafer is dipped for 1 min in dilute 5% HF solution and then rinsed in deionized water water for 1 min. The wafer is then moved to an electron beam evaporator dedicated to superconducting materials, where the layers are subsequently evaporated at rates of 0.5 nm/s in a residual vacuum of mb. This is important especially for titanium to avoid trapping impurities in the layer [24]. The film is patterned using standard UV lithography followed by a two-step wet etching. In a first step, the aluminium is removed using a commercial etchant (H3PO4/HNO3/CH3COOH). Then, in the second step, the titanium and the bottom aluminium layers are etched in diluted HF (0.05%) at a rate of about 0.2 nm/s.
The sensor implements a LEKID design [26] identical to the Al detector in [20]. Its active area consists of an inductive meander made of 30 connected strips of 62.5 m2 mm. The meander is closed with a capacitor made of 2 interdigitated fingers of 1.2 mm50 m. The silicon substrate is diced into a 2x2 cm detector with the KID in the center as shown in Figure 1.
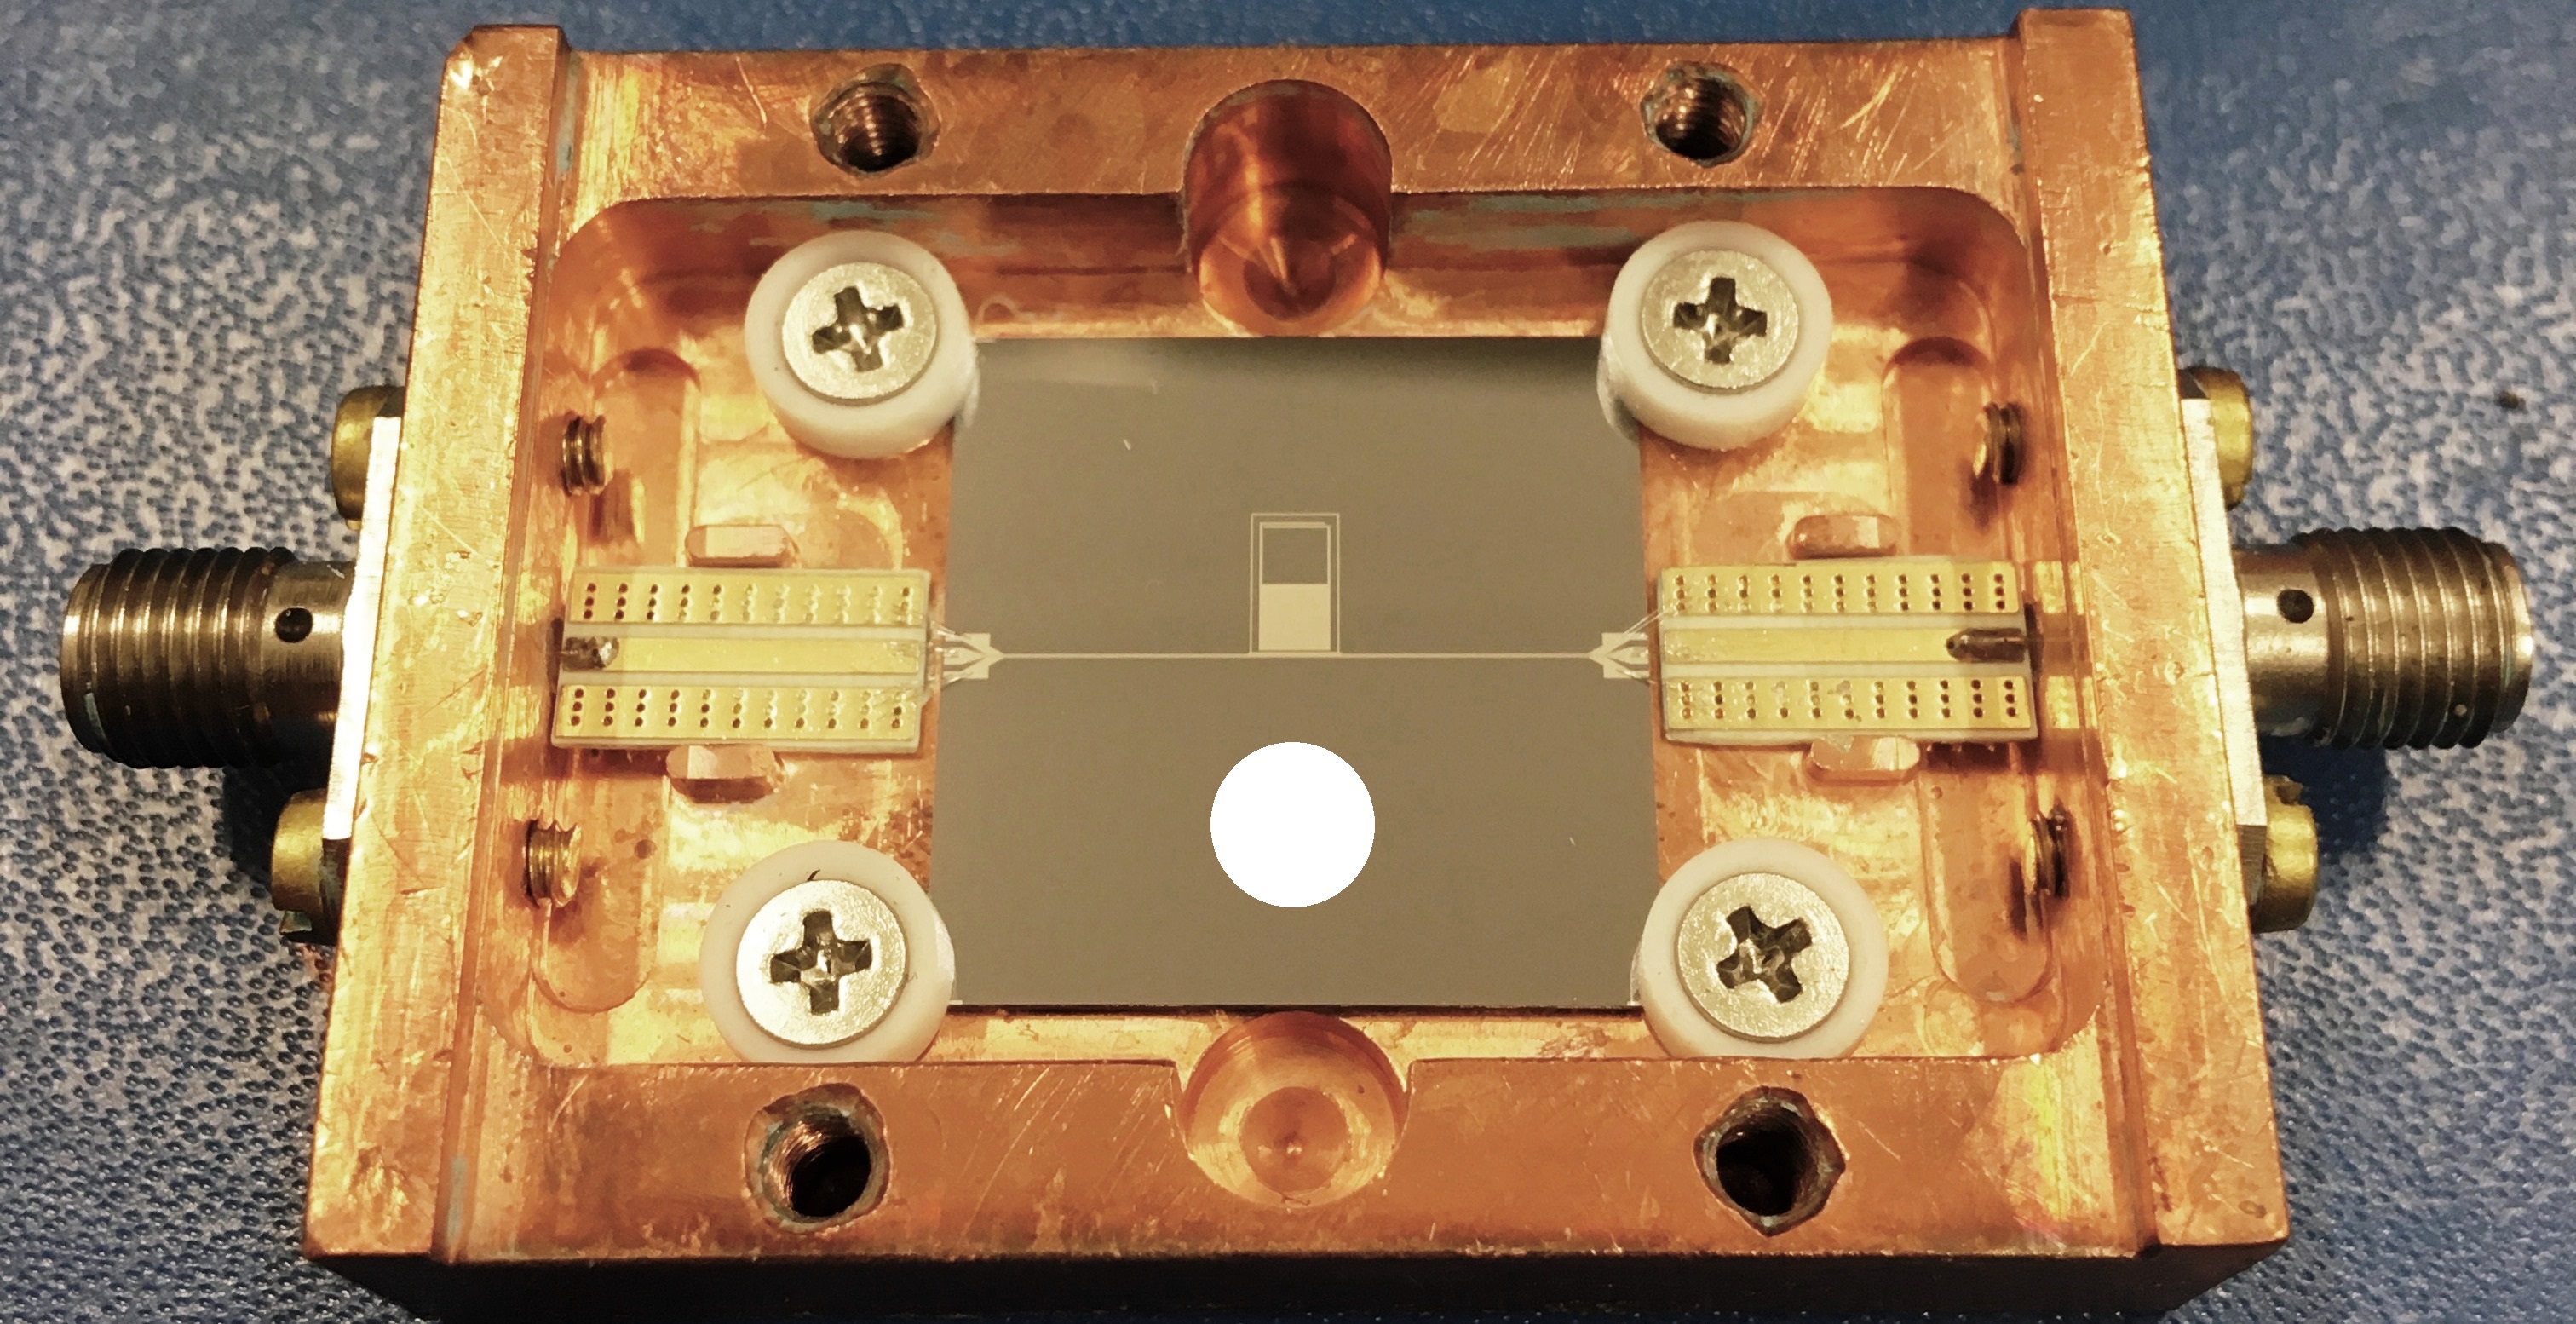
The chip is assembled in a copper structure and held by 4 PTFE supports with total contact area of about 3 mm. The copper holder is thermally anchored to the mixing chamber of a He/He dilution refrigerator with base temperature lower than 10 mK.
3 Electrical and thermal characterization of the detector
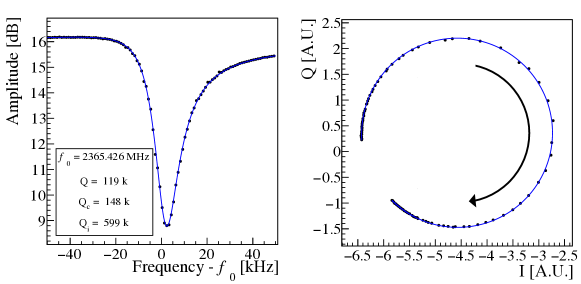
The electrical characterization of the KID is based on the study of the complex transmission () of the resonator around the resonant frequency (Figure 2). The frequency dependence of the transmission of a resonator is ideally well described by a single-pole approximation. It is however necessary to take into account also impedance mismatches, power distortion and electronics non-linearity to perform a rigorous estimation [27]. This measurement allows one to extract the coupling quality factor , the internal quality factor and the total quality factor .
The resonant frequency is found to be close to 2.4 GHz. is in very good agreement with the value predicted by the SONNET electromagnetic simulation of about . is estimated as , lower than our typical samples made of aluminium [20], but high enough to allow the detector to operate well.
The critical temperature and the resistance of the trilayer film have been measured in a 4-terminal geometry. The superconducting transition was measured at (805 10) mK with a normal state resistance per square /sq above the transition. We estimate theoretically the of the trilayer following [28], assuming perfect interface transparency to phonons across the layers and a superconductor total thickness comparable or lower to its coherence length. Solving the Usadel equations [29] within these assumptions yields an analytical dependence of on the thickness of the layers, similar to that found in the Cooper model [30]. To apply straightforwardly this bilayer model to the Al/Ti/Al trilayer, we treat it as a bilayer Al-Ti taking the average thicknesses of the Al layers [31]. The expected critical temperature from this model is , assuming values of for the single layers that take into account the increase of critical temperature in thin films, as described in [32]. The discrepancy between the expected and the measured value may come from the limitations of the model: we do not know the precise values of the electron-phonon coupling in all the layers, the actual transparency of the interfaces and also the actual for each layer. A more complete model was recently proposed in [33] and its experimental validation will be the subject of a separate work.
Using the SONNET electromagnetic simulations software we estimate the amount of kinetic inductance needed to shift the resonant frequency from the value simulated for a perfect conductor () to the measured value. The simulation is calibrated against a detector with identical geometry but in aluminium. of the calibration device was calculated independently using direct measurements of ,, film thickness and an estimation of from resonant frequency shift with temperature. We obtain a value of 1.4 pH/sq, which is significantly higher than the value of 1.0 pH/sq obtained using the BCS form described in [14], which depends on and . This is a first hint that our case of inhomogenous superconductor cannot be well described by the BCS theory. The obtained value of kinetic inductance translates into a kinetic inductance fraction =17%, much larger than that obtained in aluminium (=2.5%) using the same design [20].
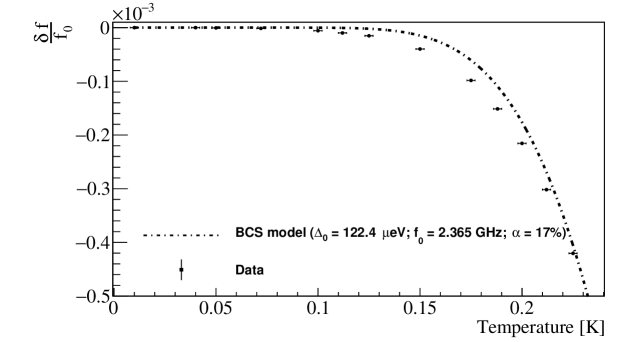
We have also measured the relative variations of the resonant frequency as a function of the temperature (Figure 3). These data are compared with a model developed by Gao et al.[34] using the Mattis-Bardeen theory. The model is calculated for our best estimation of the parameters ( mK and ). Again the BCS form cannot describe properly the case of our inhomogeneous superconductor and we can indeed see the data departing from the BCS model at intermediate temperatures. The interpretation of these measurements needs a dedicated model, whose development is beyond the scope of this paper.
4 Detector performance
Our experimental setup allows to back-illuminate the detector using two different sources: a non-collimated X-ray 55Fe source and an optical fiber coupled to a fast room-temperature LED. The 55Fe source illuminates in an almost uniform way the whole substrate with a rate of 1 Hz. The LED emits photons at 400 nm in the typical range of Cherenkov light. Depending on the LED pulse duration and/or amplitude, a variable number of photons can be sent onto the substrate. The whole optical system is intially calibrated with an accuracy of 10 % using a PMT at room temperature and then cross-calibrated with the 55Fe source. The position and size of the optical system spot on the substrate is shown in Figure 1.
The resonator is excited and probed with a monochromatic tone at the resonant frequency . The output signal is fed into a CITLF3 SiGe cryogenic low noise amplifier, downconverted at room temperature using a superheterodyne electronics and then digitized with an acquisition card at a sampling frequency of 500 kSPS. Time traces of up to 12 ms of the real (I) and imaginary (Q) parts of are acquired following a software trigger. Finally I and Q variations are converted into changes of phase and amplitude relative to the center of the resonance loop. A detailed description of the experimental setup of our laboratory at INFN Rome, including the room-temperature electronics and the acquisition software, can be found in references [7, 35].
As already mentioned, the phase response is typically larger than the amplitude one. However the phase noise exhibits often an excess noise, which sometimes makes it advantageous to consider both phase and amplitude responses in the analysis of the detector sensitivity. When amplitude and phase noises are dominated by the noise of the low noise amplifier, they decrease with microwave power as ; however at large powers the non-linearities of the kinetic inductance [36] and heating effects [37] become relevant and can suppress the signal. The recombination time , which determines the signal integration time [38], is also reduced by heating effects, lowering the signal-to-noise ratio. For these reasons, it is important to determine experimentally the bias power leading to the optimal signal-to-noise ratio.
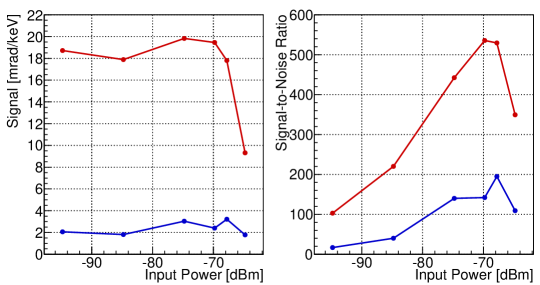
For this purpose, we perform a microwave power scan from about dBm to dBm at the input of the sample, while the monitoring signal and noise levels, as well as the pulse shape, in both the phase and amplitude readouts. A reference signal is produced by sending light pulses of 15.5 keV. The signals are processed using a matched filter, a software algorithm that allows to improve the signal-to-noise ratio by suppressing the signal frequencies that are mostly affected by noise [39]. The height of the filtered pulses is reported in Figure 4 left. The phase response is quite flat with increasing power around 19 mrad/keV, a sizeable improvement with respect to the 6 mrad/keV obtained with the Al detector in [20]. A similar increase is observed for the amplitude response, around 2.5 mrad/keV with respect to the 0.6 mrad/keV obtained with the Al detector.
In Figure 4 right we show the signal-to-noise ratio, obtained by dividing the amplitude of the pulses by the RMS of their baseline (after the matched filter). We determine an optimal working power of , about 10dB lower than what obtained with aluminium. The efficiency at the optimal working power is estimated as in [20] and amounts to consistent with what found in [20].
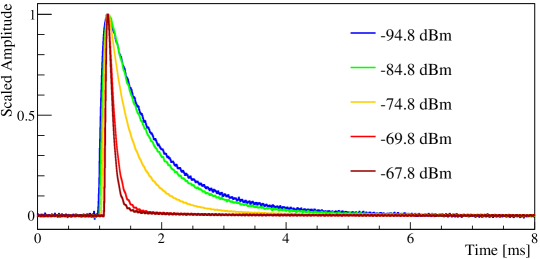
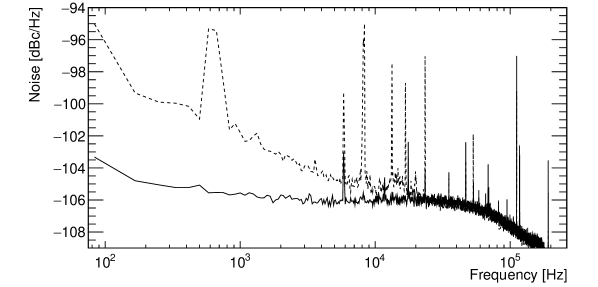
The trailing edge of the pulse is well described by a single exponential law with a decay time that varies between 800 s and 100 s with increasing microwave power (Figure 5). As shown in [38], this decay constant can be interpreted as . The noise power spectrum at optimal power is reported in Figure 6 for both the phase and amplitude readouts. The flat noise observed in the amplitude readout and in the high frequency region of the phase readout, is consistent with the noise temperature of the cold amplifier (). This noise is exceeded by a low-frequency phase noise, whose spectral index is found to be , consistent with the presence of a two-level system noise in the detector, observed often in KIDs [40]. In order to compare the obtained TLS noise with other works, we convert the noise in fractional frequency noise as in [14] and get (f=1 KHz)=Hz-1, that is among the best values reported in [14]. Both power spectra show also peaks due to the readout electronics. These peaks are strongly suppressed by the matched filter and the measured energy resolution is always found consistent with the predictions from the noise power spectrum and the matched filter.
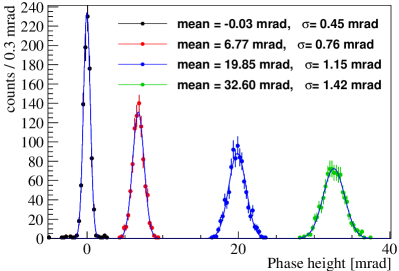
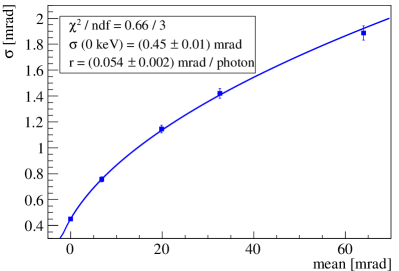
To obtain a solid estimation of the detector performance we implement a calibration based on the Poisson statistics of the photons absorbed into the substrate. The detector is biased at the optimal microwave power of -70 dBm and is illuminated with optical pulses of energies in the range 0 - 3 keV. For each energy the distribution of the pulse heights in the phase readout is found to be well described by a Gaussian with mean and standard deviation (Figure 7 left). The vs data are then fitted (Figure 7 right) assuming that two uncorrelated components contribute to the detector resolution: the baseline resolution () and the Poissonian term from the photon counting that we model as 111The number of photons absorbed in the detector is . According to the Poisson statistics one has ., where is the responsivity per photon which is estimated from the fit: . By dividing by the energy of a single 400 nm photon we obtain a responsivity of ( mrad/keV) in good agreement with the calibration against 55Fe presented previously in this Section. Using this energy calibration we find a phase readout baseline resolution eV. Applying the same procedure to the amplitude readout, we obtain eV.
5 Conclusions and discussions
In this paper we presented the results obtained using an Al/Ti/Al trilayer film to develop a phonon-mediated KID for the detection of UV-VIS light on large surfaces. The sample features mK, 600 k and a low-power recombination time s. The main features of the detector are compared in Table 1 with the Al detector, presented in [20]. The lower critical temperature increases significantly the fraction of kinetic inductance and thus the responsivity of the detector (factor 3 in the phase readout). The integrated phase noise after the matched filter improves of about 25 %. This improvement can be ascribed likely to the change in the fabrication process: the new trilayer detector was made by etching while the previous detectors were made by lift-off. The overall result is the improvement of the RMS baseline resolution for phase readout from 105 eV down to 26 eV. The amplitude responsivity also improves (factor 4). Since the amplitude noise is dominated by the LNA noise, the lower bias power implies however a worsening of the integrated noise by a factor 3. Therefore the amplitude baseline resolution improves only from 115 to 77 eV. The obtained energy baseline resolution approaches the target resolution of the CALDER project of 20 eV. The last phase of the project - currently in progress- consists in the development of light detectors of 5x5 cm.
| Al KID | Al/Ti/Al KID | |
| [mK] | 1.18 | 0.805 |
| [k] | > 2000 | 600 |
| 0.025 | 0.17 | |
| Phase resp. [mrad/keV] | 5.8 | 17.6 |
| Amplitude resp. [mrad/keV] | 0.6 | 2.5 |
| Integ. phase noise [mrad] | 0.61 | 0.46 |
| Integ. amplitude noise [mrad] | 0.069 | 0.190 |
| [eV] | 105 | 26 |
| [eV] | 115 | 77 |
| [eV] | 82 | 26 |
Acknowledgements
This work was supported by the European Research Council (FP7/2007-2013) under
contract CALDER no. 335359 and by the MIUR under the
FIRB contract no. RBFR1269SL. The authors thank the personnel of INFN Sezione
di Roma for the technical support, in particular M. Iannone, F. Pellegrino, L.
Recchia and D. Ruggeri. HLS, MC, JG and AM acknowledge support from the ANR
grant ELODIS2 no. ANR-16-CE30-0019-02. The authors thank also the anonymous reviewers for useful suggestions and comments.
References
- [1] Day P K, LeDuc H G, Mazin H G, Vayonakis A and Zmuidzinas J 2003 Nature 425 817
- [2] Monfardini A et al 2011 Astrophys.J.Suppl. 194
- [3] Mazin B et al 2013 Pub. of the Astronomical Society of the Pacific 125 1348
- [4] Cook T et al 2015 J. Astron. Telescopes, Instruments, and Systems 1 id. 044001
- [5] Quaranta O, Cecil T W, Gades L, Mazin B and Miceli A 2013 Sup. Sci. Tech. 26 105021
- [6] Faverzani M et al 2014 J. Low. Temp. Phys. 176 530
- [7] Battistelli E S et al 2015 EPJ C 75 353
- [8] Artusa D R et al 2015 Adv. High En. Phys. 2015 879871
- [9] Tabarelli de Fatis T 2010 Eur. Phys. J. C 65 359
- [10] Casali N et al 2015 Eur. Phys. J. C 75 12
- [11] Casali N 2017 Astropart. Phys. 91 44
- [12] Wang G et al 2015 arXiv:1504.03599 [physics.ins-det]
- [13] Artusa D R et al 2014 Eur. Phys. J. C 74 3096
- [14] Zmuidzinas J 2012 Annual Review of Condensed Matter Physics 3 169
- [15] Golwala S, Gao J, Moore D, Mazin B, Eckart M, Bumble B , Day P, Le Duc H G, Zmuidzinas J 2008 J. Low Temp. Phys. 151 550
- [16] Swenson L J, Cruciani A, Benoit A, Roesch M, Yung C S, Bideaud A and Monfardini A 2010 Appl.Phys.Lett. 96 263511
- [17] Cruciani A, Swenson L J, Monfardini A, Boudou N, Calvo M and Roesch M 2012 J. Low Temp. Phys. 167 311
- [18] Moore D C, Golwala S R , Bumble B, Cornell B, Day P K, LeDuc H G and Zmuidzinas J 2012 Appl. Phys. Lett. 100, 262601,
- [19] Cardani L et al 2015 Appl.Phys.Lett. 107 093508
- [20] Cardani L et al 2017 Appl. Phys. Lett. 110 033504
- [21] Mazin B, PhD Thesis, Caltech (2005)
- [22] Mattis D C, Bardeen J , 1958 Physical Review 111 412
- [23] Tinkham M, 2004 Introduction to Superconductivity
- [24] Peruzzi A, Gottardi E, Peroni I, Ponti G and Ventura G 1999 Nucl. Phys. B 78 576
- [25] Kaplan S B 1979 J. Low Temp. Phys. 37 343
- [26] Doyle S, Naylon J, Mauskopf P D, Porch A and Dunscombe C 2008 J. Low Temp. Phys. 151 530
- [27] Casali N et al 2016 J. Low Temp. Phys. 184 142
- [28] Catalano A et al 2015 Astron. Astrophys 580 A15
- [29] Usadel K D 1970 Phys. Rev. Lett. 25 570
- [30] Cooper L N 1961 Phys. Rev. Lett. 6 689
- [31] Le Suer H, PhD Thesis, Universite Paris 6 (2007)
- [32] Strongin M, Kammerer O F and Paskin A 1965 Phys. Rev. Lett. 14 949
- [33] Zhao S, Goldie D J , Witington S , Thomas CN , 2018Supercond. Sci. Technol. 31 015007
- [34] Gao J 2006 NIMPA 559 585
- [35] Bourrion O , Bideaud A, Benoit A, Cruciani A, Macias-Perez J F, Monfardini A, Roesch M, Swenson L J and Vescovi C 2011 JINST 6 P06012
- [36] Swenson L J, Day P K, Eom B H, Leduc H G, Llombart N, McKenney C M, Noroozian O and Zmuidzinas J 2013 J. Appl. Phys. 113 104501
- [37] Goldie D J, Withington S 2013 Supercond. Sci. Technol. 26 1
- [38] Cruciani A et al 2016 J. Low Temp. Phys. 184 859
- [39] Gatti E, Manfredi P F 1986 Riv. Nuovo Cimento 9 1
- [40] Gao J, Daal M, Vajonakis A, Kumar S, Zmuidzinas J, Sadoulet B, Mazin B A, Day Pk, Leduc H G 2008 Appl. Phys. Lett. 92 152505