Revival of the Fittest: Exploding Core-Collapse Supernovae from 12 to 25 M⊙
Abstract
We present results of 2D axisymmetric core-collapse supernova simulations, employing the Fornax code, of nine progenitor models spanning 12 to 25 M⊙. Four of the models explode with inelastic scattering off electrons and neutrons as well as the many-body correction to neutrino-nucleon scattering opacities. We show that these four models feature sharp Si-O interfaces in their density profiles, and that the corresponding dip in density reduces the accretion rate around the stalled shock and prompts explosion. The non-exploding models lack such a steep feature, highlighting the Si-O interface as one key to explosion. Furthermore, we show that all of the non-exploding models can be nudged to explosion with modest changes to macrophysical inputs, including moderate rotation and perturbations to infall velocities, as well as to microphysical inputs, including reasonable changes to neutrino-nucleon interaction rates, suggesting that all the models are perhaps close to criticality. Exploding models have energies of few 1050 ergs at the end of our simulation, and are rising, emphasizing the need to continue these simulations over larger grids and for longer times to reproduce the energies seen in Nature. Morphology of the explosion contributes to the explosion energy, with more isotropic ejecta producing larger explosion energies. We do not find evidence for the Lepton-number Emission Self-Sustained Asymmetry. Finally, we look at PNS properties and explore the role of dimension in our simulations. We find that convection in the proto-neutron star (PNS) produces larger PNS radii as well as greater “” luminosities in 2D compared to 1D.
keywords:
stars - supernovae - general1 Introduction
For over fifty years, since neutrinos were proposed by Colgate & White (1966) as critical to core-collapse supernovae, simulations have attempted, often unsuccessfully, to reproduce the robust explosions seen in Nature. Given recent detection of gravitational waves from compact mergers (Abbott et al. 2016; Abbott et al. 2017), simultaneous detection of electromagnetic radiation, a neutrino signature (Ott et al. 2012), and gravitational waves from supernovae (Ott 2009; Müller et al. 2013; Cerdá-Durán et al. 2013; Kotake 2013; Kuroda et al. 2016) represents a yet unbreached frontier and a probe of three of the four fundamental natural forces. Such observations will be tractable by second and third generator detectors (Yakunin et al. 2015; Andresen et al. 2017) and allow constraints on the explosion mechanism, progenitor mass, and equation of state (Morozova et al. 2018). Improvements over the years in understanding the multitude of microphysical interactions and in the capabilities of multi-dimensional simulations have combined together to improve our understanding of this central phenomenon.
Using the CHIMERA code, the Oak Ridge group (Bruenn et al. 2013; Bruenn et al. 2016) found explosions for the 12-, 15-, 20-, and 25-M⊙ progenitors from Woosley & Heger 2007 (henceforth, WH07), all roughly at the same post-bounce time and without the shock radius stalling. Employing PROMETHEUS-VERTEX, Summa et al. (2016) found later explosions over a spread of explosion times for the same four progenitors and 14 additional progenitors in the 11-28 M⊙ mass range, from Woosley et al. (2002). Both approaches use a ray-by-ray approach of multiple one-dimensional solutions to approximate multi-dimensional neutrino transport and include inelastic scattering of neutrinos off nucleons and electrons. However, earlier studies suggest that the ray-by-ray approach introduces axial artifacts and exaggerates anisotropies (Ott et al. 2006, Skinner et al. 2016, Dolence et al. 2015, Burrows et al. 2018) which may artificially promote explosion, at least in two dimensions. Recently updated results for the same progenitors by O’Connor & Couch (2018) found explosions for all but the 12-M⊙ progenitor using an M1 closure scheme for neutrino transport rather than the ray-by-ray approximation, but ignoring inelastic neutrino scattering processes. All their explosions were significantly delayed relative to Summa et al. (2016) (490 ms for the 15-M⊙ model, 500 ms for the 20-M⊙ model, and 270 ms for the 25-M⊙ model). Though, O’Connor & Couch (2018) found earlier explosions by 100-150 ms by correcting for inelastic neutrino scattering, this is insufficient to explain the delayed explosions using M1 transport rather than ray-by-ray. The lack of explosion for the 12-M⊙ progenitor, and significantly delayed explosions for the remaining three models, buttress our argument that the ray-by-ray approach either allows an explosion where there would have been none, or accelerates the time of explosion, at least in 2D. The potential artifacts of the ray-by-ray approach in three dimensions remain unclear.
Abdikamalov et al. (2016) (see also Radice et al. 2017a) found that late nuclear shell burning produces strong turbulent convection, which promotes supernova explosion. These results were iterated in 3D by various groups (see below). More recently, using the M1 closure for multi-dimensional neutrino transport, Summa et al. (2018) found 2D explosions abetted by using a general relativistic rather than Newtonian treatment of gravity. Bollig et al. (2017) find that muon creation at the high temperatures in proto-neutron stars facilitates explosion in 2D. Thus, an interplay of turbulence, microphysics, and a proper treatment of gravity have been historically critical in producing supernovae explosions in two dimensions.
3D simulations have evolved in the decade since the early foray by Fryer & Warren (2002) using a grey scheme for neutrino transport. Using PROMETHEUS-VERTEX, Melson et al. (2015a) found that the 9.6-M progenitor explodes in 3D with faster shock expansion than in 2D. Melson et al. (2015b) found also explosion for a 20-M⊙ progenitor, but only with a strangeness correction to the axial-vector coupling constant which may be too large to be physical (see Ahmed et al. 2012, Green et al. 2017). Using ZEUS-MP and omitting heavy neutrinos, Takiwaki et al. (2012) explode their 11.2-M⊙ progenitor in 3D on a low-resolution grid with the IDSA scheme and the ray-by-ray approach to solve for multi-dimensional neutrino transport. Comparing to 2D, 3D resulted in increased neutrino dwell time in the gain region and more violent convection, but also increased neutrino cooling. Updating the IDSA scheme, including a leakage scheme for heavy neutrinos, and quadrupling the resolution, Takiwaki et al. (2014) identified shock revival for all models, with delayed explosion at higher resolution and more robust explosions in 2D than 3D. More recently, the Garching group studied the 15-M⊙ WH07 progenitor with various rotation models (Summa et al. 2018). They concluded that rapid rotation inhibits explosion in 2D but promotes it in 3D, citing the development of a SASI mode that compensates for reduced neutrino heating due to rotation. Notably, explosion set in shortly after the accretion of the Si/Si-O interface. Using FLASH, Couch & Ott (2013) produced explosions in 3D for their 15-M⊙ progenitor when introducing perturbations to angular velocities. Such perturbations increased turbulent ram pressure (Couch & Ott 2015), mediating explosion. Müller et al. (2017) also presented the first simulations of the final minutes of iron core evolution in 3D, finding that asphericities in 3D progenitor structure enhance post-shock turbulence. Using COCONUT-FMT, Müller et al. (2017) similarly found their 18-M⊙ model to explode when the progenitor is allowed to evolve in 3D for the final five minutes of oxygen burning. More generally, some past multi-group 3D simulations either did not explode (Hanke et al. 2013; Tamborra et al. 2014), or exploded later than 2D counterparts (Couch 2013) more recent simulations suggest that 3D progenitors are only slightly less explosive (Roberts et al. 2016; Lentz et al. 2015; see review by Müller 2016).
In Burrows et al. (2018), we presented results of 2D simulations toggling a variety of physical processes, particularly inelastic neutrino scattering off electrons and nucleons and the many-body correction to neutrino-nucleon scattering opacities (Horowitz et al. 2017). We found that the results, particularly whether or not a model exploded, were sensitive to small changes in microphysics when near criticality for explosion. O’Connor et al. (2017) emphasized these results that explosion is sensitive to the many-body effect, with changes to the neutral-current scattering cross section at the 10-20% level at densities above 1012 g cm-3 pushing all their models from 12-25 M⊙ to explode.
Here, we present the comprehensive results of a series of 2D radiation/hydro simulations using Fornax of a suite of nine progenitors spanning 12 to 25 M⊙ performed on a grid extending out to 20,000 km. Our key findings are that four of our progenitors explode with the inclusion of inelastic scattering processes off electrons and nucleons as well as with the many-body correction to neutrino-nucleon scattering opacities. We show that the non-exploding models can also be nudged to explosion with the inclusion of additional physical inputs, such as modest rotation and perturbations to infall velocities.
In Sec. 2, we introduce the numerical methods and setup for our simulations. In Sec. 3, we remark on basic diagnostics of our results and explore the role of the Si-O interface accretion in explosion outcome. We expand these diagnostics in Sec. 4, where we look at explosion energies and probe properties in the gain region. We also focus on a study of microphysical and macrophysical inputs, as well as progenitor dependence, illustrating that all models considered can explode with changes to opacities, moderate rotation and/or perturbations to infall velocities. We further explore the electron-fraction distribution of the ejecta mass for the exploding models, and look for evidence for the Lepton-number Emission Self-Sustained Asymmetry but find none. In Sec. 5, we comment on the properties of the resulting neutron stars. We compare our 2D and 1D simulations in Sec. 6. Finally, we summarize our results and present our conclusions in Sec. 7.
2 Progenitors and Setup
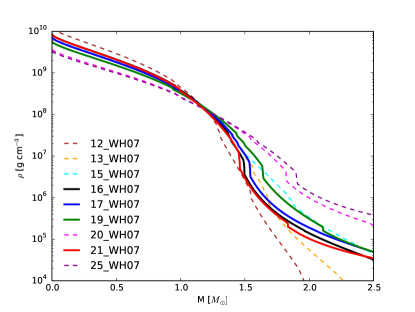
We consider nine progenitors from Woosley & Heger (2007) spanning 12 to 25 M⊙. Their density profiles are illustrated in Fig. 1. We evolve these models in two dimensions out to 20,000 km, until the maximum shock radius reaches the grid boundary, using Fornax, a new multi-dimension, multi-group radiation/hydrodynamic code developed to study core-collapse supernovae (Wallace et al. 2016; Skinner et al. 2016, Burrows et al. 2018; Skinner et. al 2018, in prep.). Fornax solves the comoving-frame velocity dependent transport equations to order O(v/c). The hydrodynamics uses a directionally-unsplit Godunov-type finite-volume scheme and computes fluxes at cell faces using an HLLC Riemann solver. It employs a dendritic grid that deresolves at small radii to overcome CFL limitations in evolution time while approximately preserving cell size and shapes to keep the timestep independent of resolution. Our default resolution is 608 radial cells by 256 angular cells. The radial grid extends out to 20,000 km and is spaced evenly with r 0.5 km for r 50 km and logarithmically for r 50 km, with a smooth transition between. The angular grid resolution varies smoothly from 0.95∘ at the poles to 0.65∘ at the equator. For this project, we use a monopole approximation for gravity. We include an approximate general relativistic term following Marek et al. (2006) and employ the SFHo equation of state (Steiner et al. 2013) which is consistent with all currently known nuclear constraints (Tews et al. 2017).
We solve for radiation transfer using the M1 closure scheme for the second and third moments of the radiation fields (Vaytet et al. 2011). We follow three species of neutrinos: electron-type, anti-electron-type, and treat the heavy neutrinos as a single species, “." We use 20 energy groups spaced logarithmically between 1 and 300 MeV for electron neutrinos and to 100 MeV for anti-electron- and “"-neutrinos.
We follow the notation of Burrows et al. (2018) for our progenitors, with IES_INS_MB indicating inelastic scattering of neutrinos off electrons (IES) and nucleons (INS) and the many-body (MB) correction to the neutrino-nucleon opacities. The neutrino-matter interactions follow Burrows et al. (2006), with inelastic neutrino-nucleon scattering incorporated using a modified version of Thompson et al. (2003).
3 Explosion Dynamics
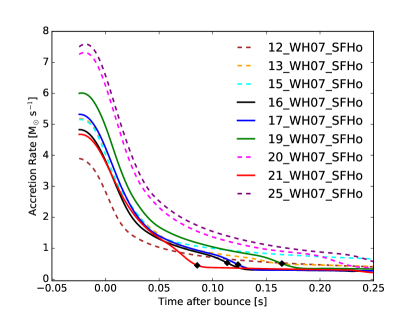
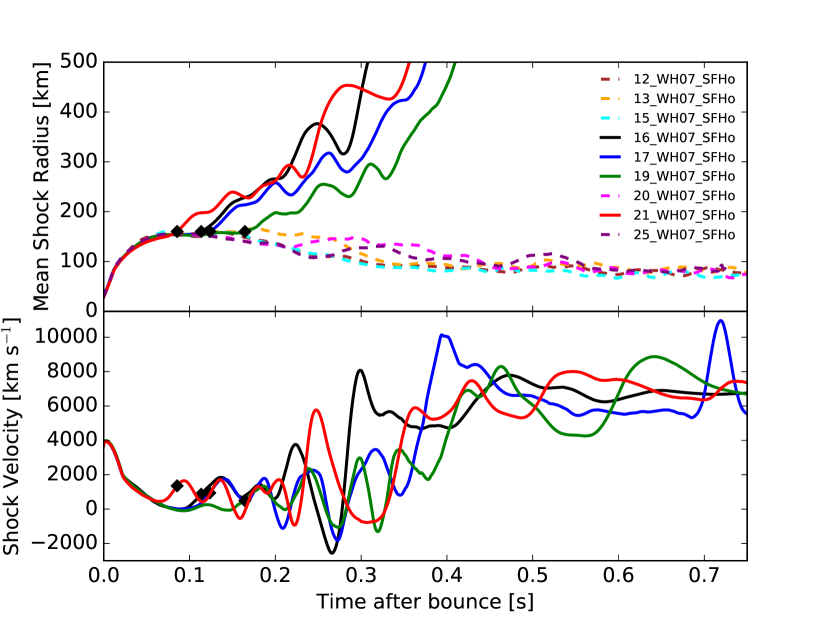
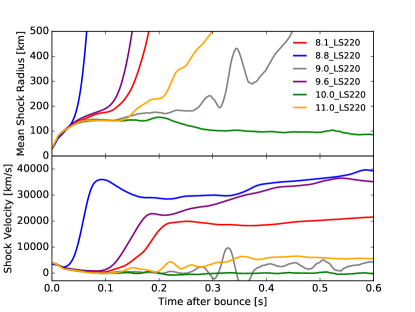
We present results that the progenitor structure is crucial in determining explosion outcome for our model suite of simulations. In Fig. 1, right panel, we illustrate the accretion rates (in M⊙ s-1) as a function of time after bounce (in seconds) at 500 km for the first several hundred milliseconds post-bounce. In the top panel of Fig. 2, we illustrate the mean shock radii (in km) and the shock velocity (km s-1) as a function of time after bounce (in seconds) in the top and bottom panels, respectively, for our suite of nine WH07 progenitors from 12 to 25 M⊙. Explosion times, defined as when the mean shock radius reaches 160 km after passing an inflection point, are indicated subsequently in our figures as black diamonds. The explosion times are non-monotonic with progenitor mass and have a spread of approximately 100 ms for the various explosions. The mean shock radii evolve almost identically until 100 ms post-bounce, then continue to rise without stalling for all our exploding models. Models 16-, 17-, 19- and 21- M⊙ all explode, with the heaviest, the 21 M⊙ model exploding first. These four have not been the focus of previous studies in recent simulations. Both Bruenn et al. (2016) (see also their Paper 1, Bruenn et al. 2013) and Summa et al. (2016) studied the 12-, 15-, 20- and 25-M⊙ WH07 progenitors, finding that all of them explode, but using the ray-by-ray approximation to neutrino transport and the LS220 equation of state (Lattimer & Swesty 1991). We find that none of these models explodes for our default setup, but we show later (Sec. 4) that, with moderate macrophysical modifications, all progenitors models can be nudged into explosion. However, using M1 transport rather than ray-by-ray for neutrino transport, O’Connor & Couch (2018) find delayed explosions for the 15-, 20-, and 25-M⊙ progenitors. There are significant physical differences between our two approaches, including a different analytic closure (Minerbo 1978 vs. Vaytet et al. 2011), a different equation of state (LS220 vs. SFHo), and different energy resolutions (12 vs. 20 energy groups). In particular, the LS220 equation of state has shown to be more explosive than the SFHo (Bollig et al. 2017). Be that as it may, we show in Sec. 4 that all progenitors are close to criticality for explosion.
Models 16- and 17-M⊙ explode in short succession of each other, with the 19-M⊙ progenitor exploding last, roughly 50 ms later. As we will discuss in Sec. 4, explosion order anti-correlates with explosion energy. In the bottom panel of Fig. 2, we plot the mean shock velocity versus time after bounce for the four exploding models. At late times, the shock velocities undulate with no regard to progenitor mass, asymptoting to roughly 7000 km s-1 with values as high as 10,000 km s-1, around 0.03 times the velocity of light, . However, the early rise in velocities at 0.1s after bounce follows the explosion ordering seen in the shock radii, with earlier explosions showing higher shock velocities at early times.
For the heaviest progenitors, the accretion rates remain over 1 M⊙ s-1 until as late as 200 ms post-bounce, over a hundred of milliseconds longer than found by Radice et al. (2017b) for a suite of lower mass (8.1 - 11 M⊙) progenitors. We naively expect lower mass progenitors to have systematically lower accretion rates, resulting in less ram pressure to overcome to achieve explosion. While the five non-exploding models do have accretion rates which increase with mass, the four exploding models (16-, 17-, 19-, 21-M⊙) see their accretion rates dip earlier for models that explode earlier. Note that even for our conservatively early definition of explosion time (shock radius reaching only 160 km, marked by the black diamonds), the accretion rate dips in advance of explosion, suggesting that the reduced accretion rate prompts explosion and is not a result of it. The magnitude of the accretion rate itself is not the determinant of explosion, but rather the interplay between accretion rate and accretion luminosity (Burrows & Goshy 1993; Müller & Janka 2015, Suwa et al. 2016). For instance, the 12-M⊙ progenitor has the lowest accretion rate, but also a low luminosity (Fig.4, top right panel) and does not explode. The sensitivity of explosion to the progenitor mass suggests that small differences in density profiles can be significant.
We propose that the early accretion of the Si-O interface promotes explosion (see also, e.g. Murphy & Burrows 2008). Looking at Fig. 1, we see that those models that do explode (solid) have several characteristics in their density profiles that distinguish them from models that do not explode (dashed). Namely, the density is quite high in the interior, out to 1.2 M⊙, but then drops sharply. Furthermore, the exploding models all have a Si-O interface located interior to 1.7 M⊙, where the density drops by a factor of several over a thin mass region. Our default 20- and 25-M⊙ models also have Si-O burning interfaces, but these are located further out. The 12-, 13-, and 15-M⊙ models do not feature prominent interfaces. None of these five models explodes during the physical time they were followed here, and all five models feature mean shock radii stagnating at 100 km, 700 milliseconds post-bounce. The variation in outcome explosion or failure over progenitors differing only by a solar mass suggests that certain density profiles are most prone to explosion, and that early accretion of the Si-O interface can be one key to explosion. In fact, looking at Fig. 1, we see that all four exploding models accrete Si-O interfaces early on, as indicated by the dip in accretion rates. Comparing with the shock radius evolution depicted in Fig. 2, we find explosion occurring soon after interface accretion.
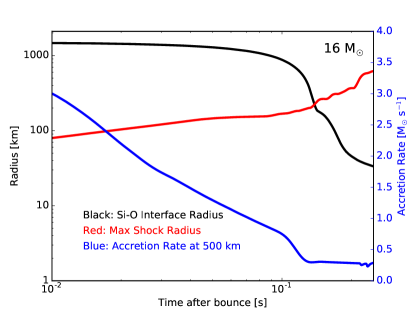
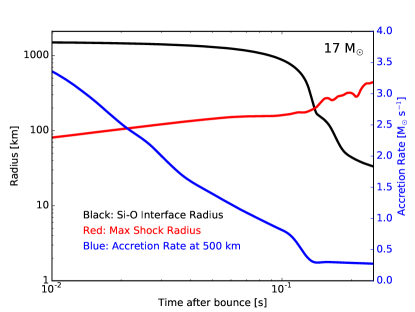
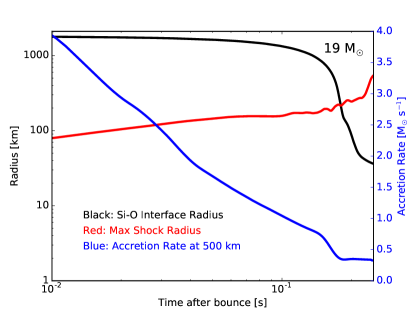
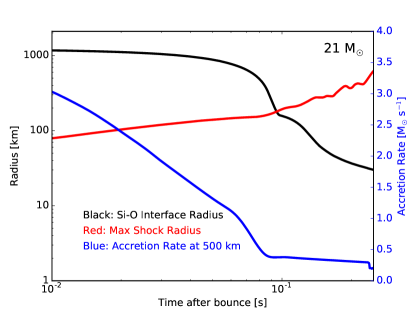
In Fig. 3, we simultaneously show accretion rates at 500 km (in M⊙ s-1, blue), the evolution of the Si-O interface (in km, red), and the maximum shock radius (in km, black) as a function of time after bounce (in seconds) for our four exploding models. Once the Si-O interface passes 500 km, at roughly 80 ms for the 21-M⊙ progenitor, the corresponding accretion rate falls by a factor of five, from 10 to 2 M⊙ s-1. Simultaneously, the maximum shock radii begins to climb towards explosion once it intersects the Si-O interface. The high accretion rates prior to interface accretion enhance the accretion luminosity interior to the stalled shock. The subsequent drop in accretion rate reduces the ram pressure of the infalling material exterior to the stalled shock, while still allowing the stalled shock to benefit for a short time interval from the high luminosity due to earlier accretion. This paints a coherent picture of the critical role of the interface in explosion.
The role of the Si-O interface has been studied earlier in literature. Using BETHE-hydro, Murphy & Burrows (2008) explored the evolution of the 11.2- and 15-M⊙ progenitors, and found that accretion rates plummet following accretion of the Si-O interface. Hanke et al. (2013) evolve a 27-M⊙ progenitor in both 2D and 3D and find strong shock expansion ensues after Si-O infall due to the resulting decrease in mass accretion. Summa et al. (2018) find that explosion for an artificially-rotating 15-M⊙ progenitor follows shortly after accretion of the Si-O interface, but argue that a strong spiral SASI mode has set the grounds for explosion even earlier. Using Zeus-2D for 12-100 M⊙ progenitors, Suwa et al. (2016) similarly found shock expansion associated with the density, and hence ram pressure, jump around the Si-O interface. However, shock expansion lasted briefly and the models did not explode. Recently, Ott et al. (2017) performed 3D simulations using the GR multi-group radiation hydrodynamics code ZELMANI. Omitting inelastic scattering processes and velocity dependence and with 12 energy groups spaced logarithmically between 1 and 248 MeV, they find similar results regarding the role of Si-O interface accretion to prompting explosion, perhaps even more critical than the compactness parameter. Similarly, for a suite of 2D progenitors from 11-28 M⊙, Summa et al. (2017) find a steep drop in density at the Si-O interface corresponds to a reduction of the accretion ram pressure and subsequent strong shock expansion.
Literature is replete with analytical parametrizations of explosions, spanning the compactness (O’Connor & Ott 2011; O’Connor & Ott 2013; Nakamura et al. 2015) and Ertl parameters (Ertl et al. 2016), the antesonic condition (Pejcha & Thompson 2012; Raives et al. 2018); critical luminosity curves (Burrows & Goshy 1993; Summa et al. 2016; Summa et al. 2018) to scaling relations (Müller et al. 2016) and integral conditions (Murphy & Dolence 2017). We propose early accretion of the Si-O interface as one possible empirical condition.
4 Energetics and Diagnostics
Here, we present an analysis of the energetics of our results, explode the failed explosions of the prior section, and comment on the Ye-mass ejecta distribution and the absence of the LESA.
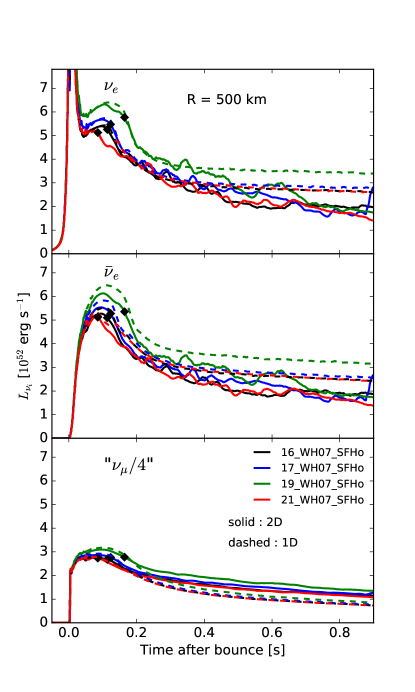
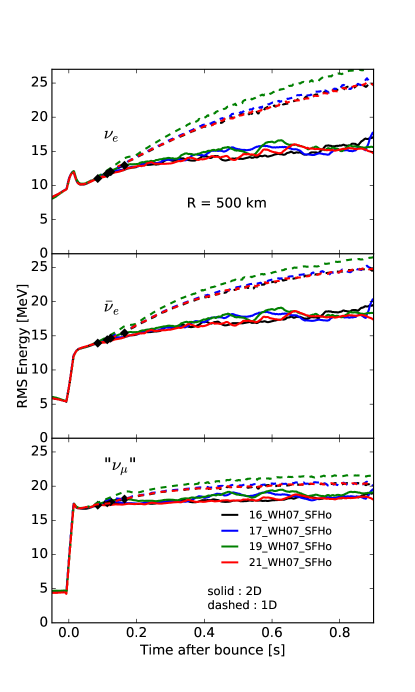
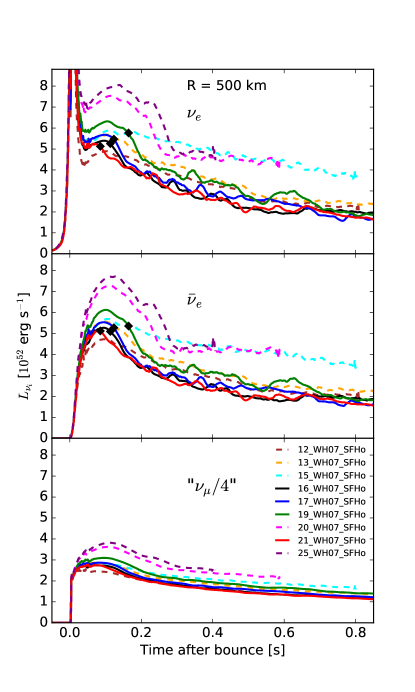
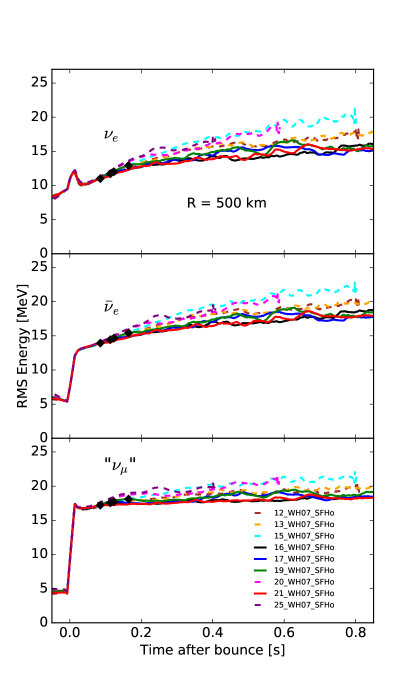
In Fig. 4, we depict the lab-frame neutrino luminosities (in 1052 erg s-1, top panel) and RMS energies (in MeV, bottom panel) as a function of time after bounce (in seconds), evaluated at 500 km and redshifted out to infinity for our nine progenitors. We assume a forward-peaked radial neutrino distribution as in Radice et al. (2017b). At early times, RMS energies and luminosities are monotonic with progenitor mass for the non-exploding progenitors, with the 12-M⊙ progenitor fielding neutrino luminosities 50% smaller and RMS energies 30% smaller than its more massive counterparts. Interestingly, the models that explode later reach higher post-breakout luminosities. Note that the exploding models show an expected dip in luminosities and RMS energies after explosion reverses accretion. Electron-type neutrino luminosities asymptote to 21052 ergs s-1 by 1 second post-bounce for the exploding models.
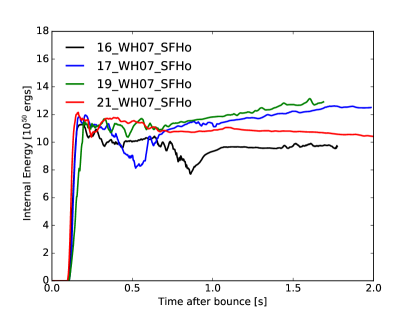
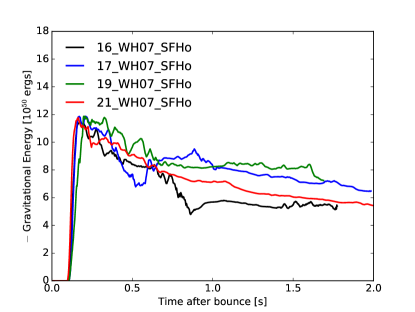
We calculate diagnostic energies (Müller et al. 2012a) as the sum of the kinetic, internal, gravitational binding and nuclear binding energy interior to the grid and correct for the gravitational binding energies exterior to our 20,000 km grid. We list the binding and final energies in Table 1, with the latter summed over all zones where the final energy is positive.
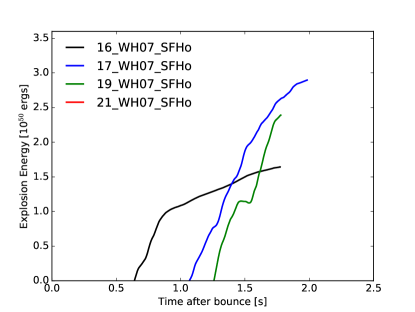
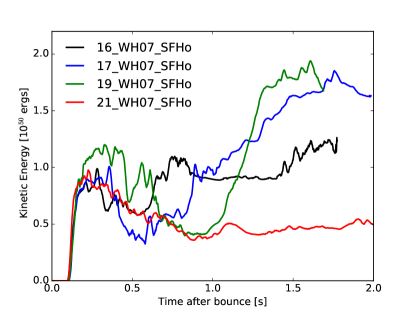
The final explosion energies, with external binding energies subtracted, are illustrated in the top-left panel of Fig. 5 as a function of time after bounce for the four exploding progenitors. The 17-M⊙ progenitor yields the highest diagnostic energy of 1050 ergs at 2.0s after bounce. Its energy is still steeply rising at the end of the simulation, which ends once the outer shock radius reaches the grid edge at 20,000 km. This suggests the need to repeat such simulations over much larger radial domains and is consistent with the results found by Summa et al. (2016), who performed simulations over a 10,000 km grid and found explosion energies still rising for their suite of 12-, 15-, 20- and 25-M⊙ WH07 progenitors. Note, however, that they plot the diagnostic energy and do not correct for the gravitational binding burden off the grid, which would result in much smaller and even negative final energies for them. For the same progenitor suite, Bruenn et al. (2016) find final explosion energies corrected for the gravitational overburden nearly an order larger, around 1 Bethe (1B = 1051 ergs). The 21-M⊙ progenitor does not reach positive explosion energy by the end of our simulation since it has not yet overcome its gravitational overburden. Note also that the explosion energies anti-correlate with explosion times the models that explode later have higher energies. The same behavior appears for the luminosities in Fig. 6, suggesting that a delayed explosion is more energetic. Interestingly, though the 16- and 17-M⊙ progenitors explode almost simultaneously, their explosion energies are quite different, with the former asymptoting by the end of the simulation.
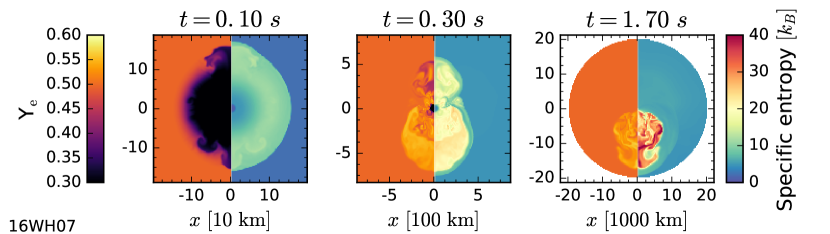
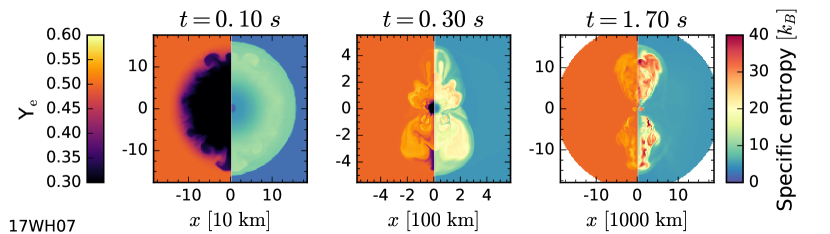
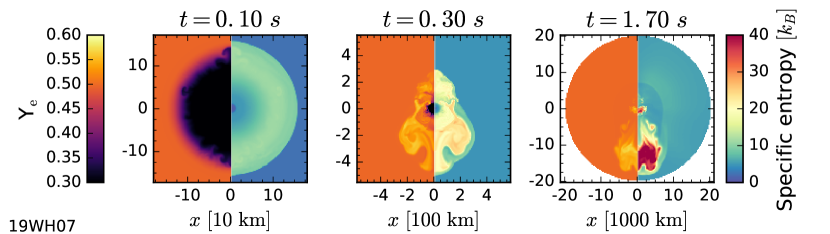
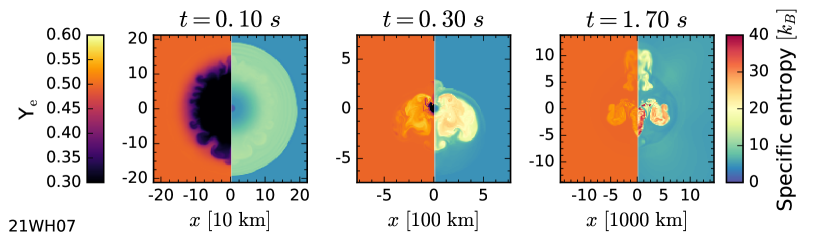
In the top right panel, we show the kinetic energies which, early after bounce, are only a fraction of the internal energy. At late times, the kinetic energies of the 17- and 19-M⊙ progenitors rise steeply, paralleling the larger explosion energy at late times for these models and accounting for roughly two-thirds of the final energies. Furthermore, from the entropy profiles in Fig. 6, we see that exploding models with multiple plumes covering a wider spread of solid angle have higher explosion energies. The 16-M⊙ progenitor has an asymmetric explosion concentrated around the southern pole at late times, and has a correspondingly smaller explosion energy. On the other hand, the 17- and 19-M⊙ progenitors have multiple wide plumes in both hemispheres with correspondingly higher explosion energies. The rapid rise in kinetic energy together with multiple expanding plumes, which drive this kinetic outflow, suggest that the morphology of the unbound material is significant in producing robust explosion energies. Furthermore, simulations in 3D will not suffer from axial artifacts present in 2D; we thus expect more isotropic explosions in 3D with correspondingly higher explosion energies than in 2D. However, 3D simulations are required to draw consistent conclusions about explosion morphologies and energies. In the bottom right panel, we illustrate the (negative) gravitational binding energy interior to the grid, with magnitudes comparable to the internal energies. The 25-M⊙ model does not have an exceptionally high interior binding energy; rather, a combination of low kinetic energy and high exterior binding overburden prevents its explosion energy from becoming positive. Its final energy at the end of our simulation is roughly ergs and rising.
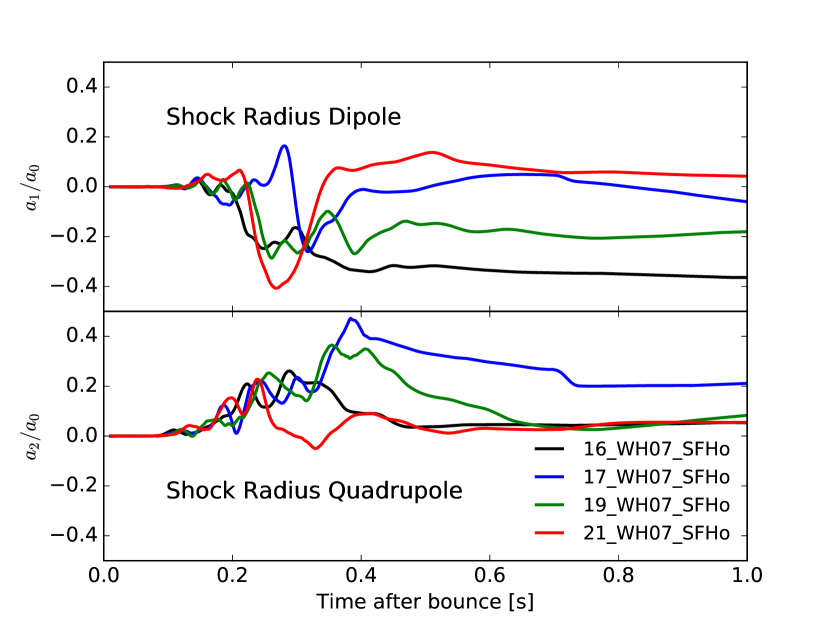
As a final point on morphology, in Fig. 7, we plot the dipole (top panel) and quadrupole moments of the shock radii, normalized to the monopole moments and plotted against time after bounce (in seconds) for our four exploding models. All models feature a strong dipole moment, and with the possible exception of the 21-M⊙ progenitor, have positive quadrupole moments, indicating equatorial pinching. Note that the 16-M⊙ progenitor sustains a significant dipole moment even at late times and has a correspondingly smaller explosion energy. The 17-M⊙ progenitor sustains a larger quadrupole moment at late times, and has a correspondingly larger explosion energy. These observations lend credence to our proposal that more isotropic explosions are more energetic, all else being equal.
4.1 Evolution of the Gain Region
To probe the dependence of progenitor mass on explosion outcome, we study the properties of the models in the gain region, defined as where there is net neutrino heating.
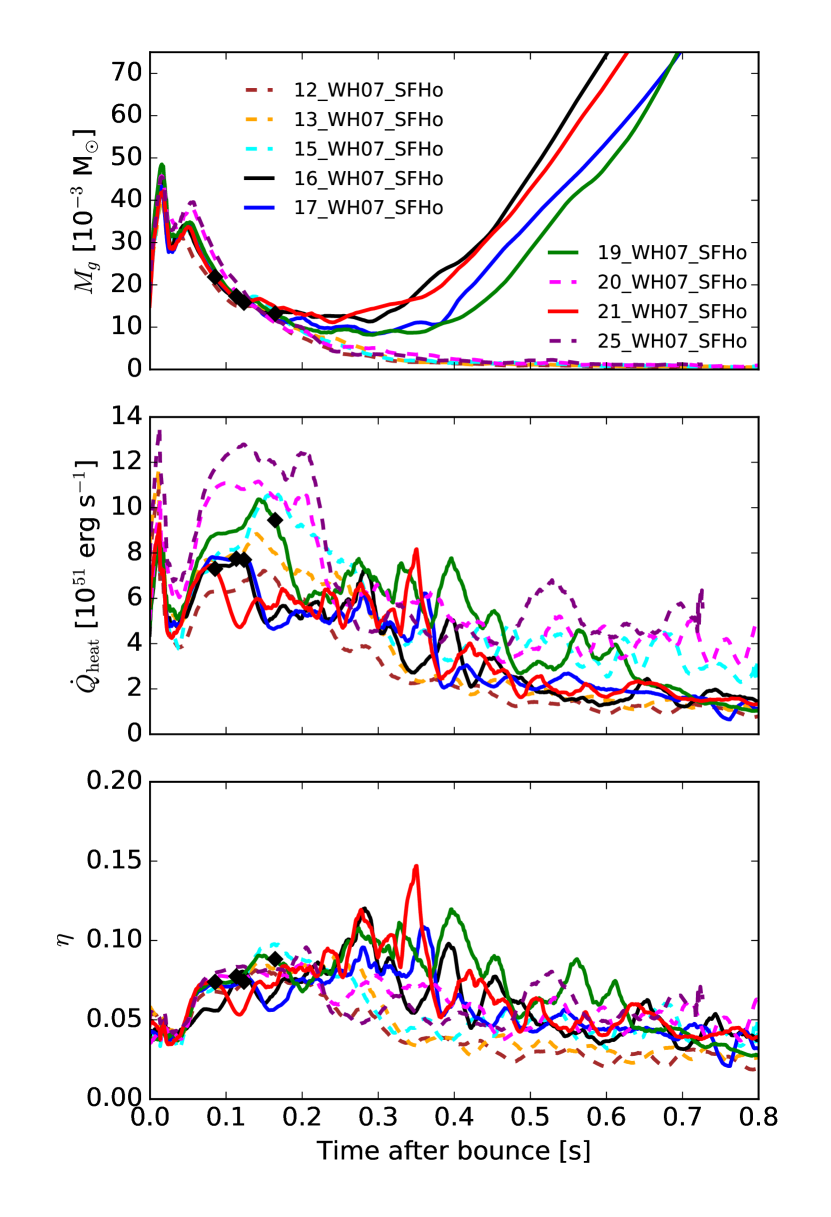
In Fig. 8, we illustrate, from top to bottom, the mass of the gain region in units of 10-3 M⊙, the net heating rates in B s-1, and the heating efficiency, defined as , as a function of post-bounce time (in seconds) for the suite of nine progenitor masses. In the top panel, models that explode (solid) continue to grow in gain mass past the first 200 ms, while the remainder (dashed) do not. Furthermore, models with higher accretion rates (see Fig. 1) have higher heating rates (middle panel) for the first 200 milliseconds of evolution, and hence earlier explosions feature lower heating rates. The heavier 20- and 25-M⊙ models have the highest heating rates (not heating efficiency, bottom panel) early on, but these prove insufficient to overcome the greater ram pressure and the explosions are stifled. The exploding models have significantly higher heating efficiencies (bottom) after 200 milliseconds, following the explosion, than the non-exploding progenitors, with efficiency peaking at 0.15 for the 21-M⊙ progenitor around 350 ms post-bounce.
For comparison, Summa et al. (2016) study 12-, 15-, 20-, and 25-M⊙ progenitors, finding maximum heating efficiencies in the gain region of 0.12, 600 milliseconds post-bounce, and Bruenn et al. (2016) find maximum efficiencies of 0.15, 200 milliseconds post-bounce. Changes in gain properties may be endemic of explosion and not necessarily its precursors.
4.2 Microphysical Dependence
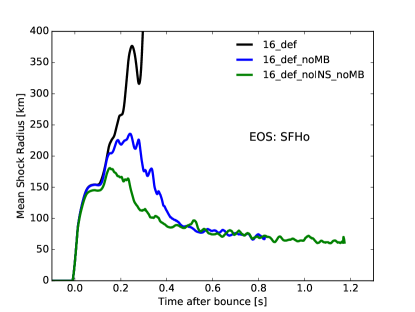
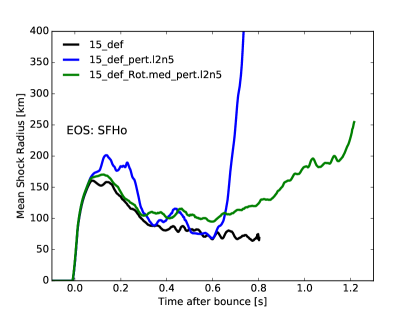
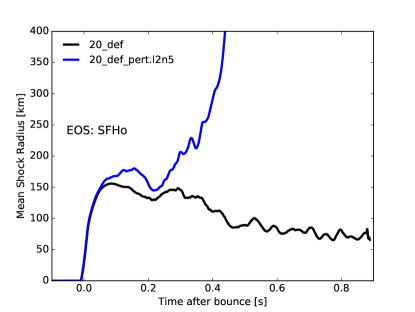
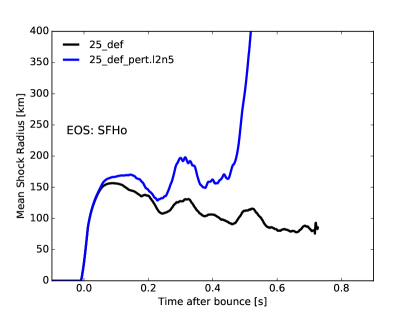
We briefly explore the effects of inclusion of various physical processes to the explosion outcome. We use the 16-M⊙ progenitor as a case study. In Fig. 9 (top left panel), we plot the mean shock radii (top panel) for three runs the default (‘def’) with IESINSMB, one with IESINS, and one with IES only.
We note a steady march towards explosion as we include additional physical processes. Adding inelastic scattering off nucleons leads to a shock radius stalling further out, and the inclusion of the many-body effect converts the failure to explosion. Without all three effects, our 16-M⊙ progenitor does not explode.
Buras et al. (2006) performed an early comparison of different neutrino interaction rates, finding reduced , opacities when including inelastic scattering of neutrinos off nucleons via Burrows & Sawyer (1998), rather than the elastic approach of Bruenn (1985). Müller et al. (2012a) finds higher , luminosities when including inelastic scattering off nucleons. Furthermore, O’Connor et al. (2017) find increased neutrino heating due to the many-body effect (Horowitz et al. 2017). Finally, O’Connor & Couch (2018) found that including inelastic scattering produced earlier explosions for the 12-, 15-, and 25-M⊙ progenitors, though not early enough to overcome the discrepancy in explosion time between their work and that of Summa et al. (2016).
As illustrated in Burrows et al. (2018), however, one can prompt the model without the many-body effect to explode by including either perturbations to the infall velocities or modifying the opacity table to include the Fischer (2016) correction to the nucleon-nucleon bremsstrahlung (“bf”) and cutting the electron capture rate Juodagalvis et al. (2010) on heavy nuclei to only 20%. Non-exploding models can be made to explode with moderate changes to physical inputs.
4.3 Exploding the “Non-Exploding" Models
Though the many-body effect was crucial in exploding the 16-M⊙ progenitor, this default microphysical setup proved insufficient in exploding five of our other WH07 models. Five (the 12-, 13-, 15-, 20-, and 25-M⊙ models) of our nine WH07 models did not explode with the default setup, and we identify the absence of a sharp Si-O interface in the progenitor interior (see Fig. 1) as one key difference. We find that with the inclusion of additional inputs, such as perturbations and/or moderate rotation, all these models explode.
We perturb the infalling velocities to 1000 km s-1 over 3 regions using the prescription of Müller & Janka (2015) (see also Radice et al. 2017b). We use radial nodes and angular modes. Our perturbed regions span 1000-2000 km, 2100-4000 km, and 4100-6000 km. The inner region was chosen to be just outside our core at the start of the simulation and the outer region was approximated by the radial extent of matter that would be accreted during the first half second after bounce, by which time the default models have exploded. We find that the outcome is crucially sensitive to when these perturbed regions are accreted.
For our rotation prescription, we assume a cylindrical rotational profile following Eriguchi & Müller (1985). Our rotational angular frequency along the pole is a moderate 0.2 radians s-1, corresponding to a period of just over 30 seconds. The characteristic radius, over which the frequency drops to half this value, is 10,000 km, much larger than normally assumed. We find that moderately rotation near the center that remains high at large radii is most promising for explosion (see Vartanyan et al. 2018b, in prep.).
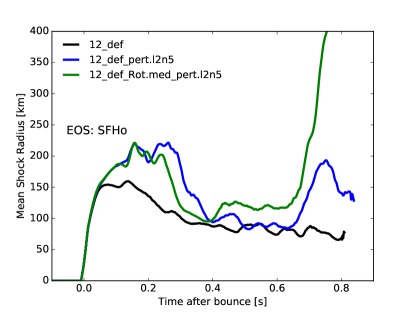
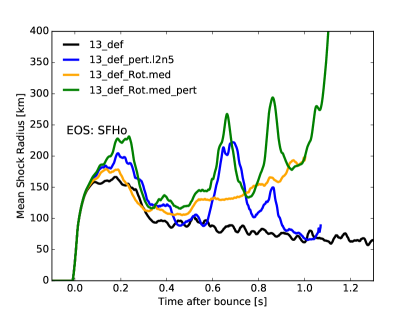
We plot our results in Fig. 9. The 15-, 20- and 25-M⊙ progenitors explode with only the addition of perturbations to infall velocities. However, the 12- and 13- M⊙ models require the further inclusion of moderate rotation to explode. Note, however, that the 13-M⊙ progenitor explodes with rotation alone (orange curve in third panel of Fig. 9. For comparison, we also add rotation to the 15-M⊙ progenitor and find, quaintly enough, that rotation delays explosion here by roughly 400 ms. The non-monotonic affect of rotation on explosion outcome will be further explored in Vartanyan et al. (2018b).
4.4 Electron Fraction Distribution
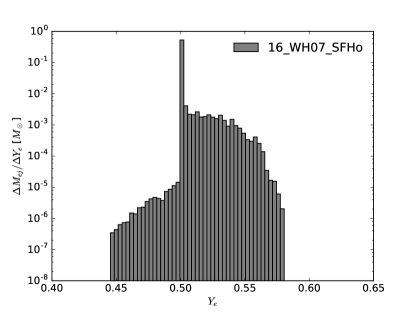
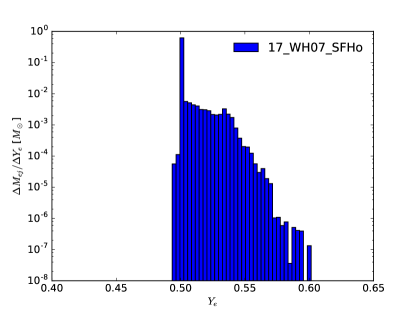
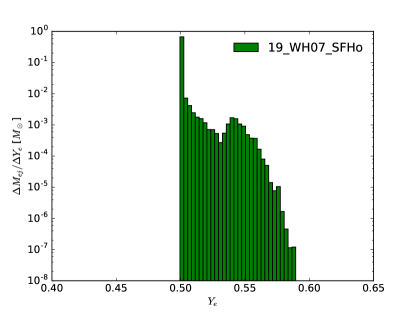
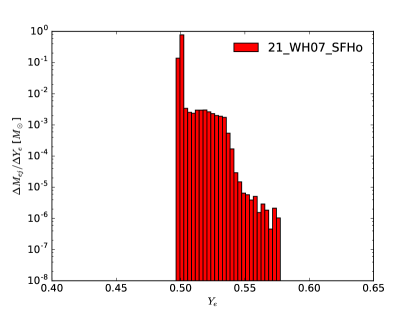
We study the ejecta mass distribution (with the ejecta defined as the gravitationally unbound mass) with at the end of our default simulations. Figure 10 illustrates a histogram of these results with Ye bin resolution of 0.003. Independent of progenitor mass, all models show a peak near Ye = 0.5, with a tail extending to . Only the lowest mass progenitor, 16 M⊙, shows a tail extending to lower values.
Recently, Wanajo et al. (2018) found that, for their sample of four low-mass progenitor supernovae, lower-mass progenitors had more neutron-rich ejecta due to faster shock growth and, hence, less dwell time of the neutron-rich ejecta for neutrino processing. This holds true for the lower-mass progenitors, which are relatively isotropic in explosion. However, we find little correlation between the shock velocities of our more massive models (see Fig. 2) and the ejecta distribution, Fig. 10, where perhaps multidimensionality and ejecta anisotropies play a bigger role. For instance, our 16-M⊙ progenitor is the only model with outflow concentrated in the southern hemisphere (see Fig. 6), which we suggested earlier could lead to a correspondingly smaller explosion energy. Such an anisotropic explosion would also leave neutron-rich material in the northern hemisphere relatively untouched, possibly explaining the low- tail for the 16-M⊙ model seen in Fig. 10.
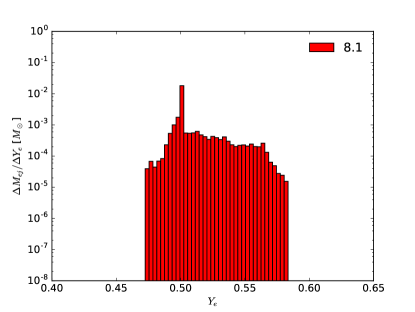
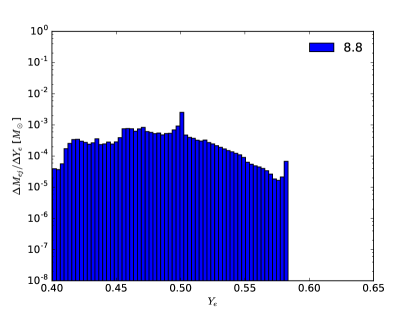
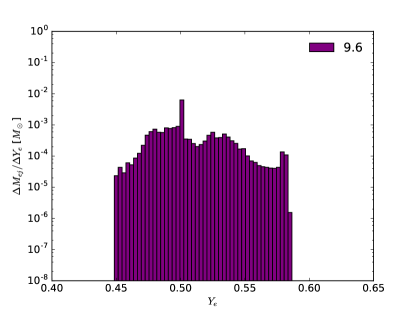
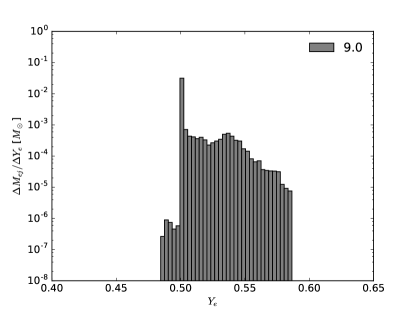
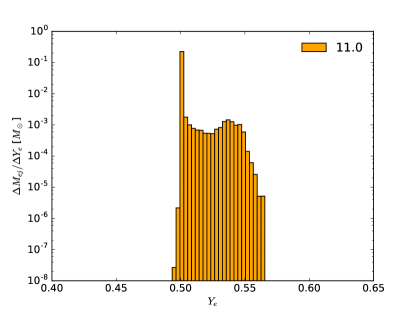
To explore this claim, we add in Fig. 11 the distribution of the ejecta mass for a set of low-mass progenitors from Radice et al. 2017b, which we note uses the LS220 and not the SFHo EoS, as per our calculations (all else equal). We look at an 8.8-M⊙ model (Nomoto 1984; Nomoto 1987); an 8.1-M⊙ model (Müller et al. 2012b); an initially metal-free 9.6-M⊙ model (Müller et al. 2013); and 9-, 10-, 11-M⊙ models (Sukhbold et al. 2016), using the Lattimer-Swesty (LS220) equation of state with nuclear incompressibility of 220 MeV (Lattimer & Swesty 1991). Radice et al. (2017b) find that all models except for the 10-M⊙ progenitor explode with the inclusion of inelastic scattering off electrons and nucleons as well as the Horowitz et al. (2017) many-body correction (the 10-M⊙ model explodes with the further addition of perturbations to infall velocities). We plot in the final panel of Fig. 11 the mean shock radii (km) and shock velocities (km s-1) as a function of time post bounce (in seconds) for these six low-mass progenitors. Note that the shock velocities show a bimodal clumping: 1) those weakly explosive models (9- and 11-M⊙) with shock velocities less than 10,000 km s-1 (together with the non-exploding 10-M⊙ progenitor), and 2) the three more robust explosions with shock velocities spanning 20,000 to 40,000 km s-1 (the 8.1-, 8.8-, and 9.6- M⊙ progenitors). In our Ye histograms in Fig. 10, we see that these three lower mass ECSN progenitors have more low-Ye ejecta together with greater shock velocities, in agreement with Wanajo et al. (2018). For comparison, all four of our more massive exploding models have smaller shock velocities, asymptoting at roughly 7000 km s-1 (see Fig. 2), and the association between shock velocity and ejecta mass is less clear for these more massive progenitors, where we argue explosion anisotropies play a more decisive role in -ejecta mass distribution.
4.5 LESA
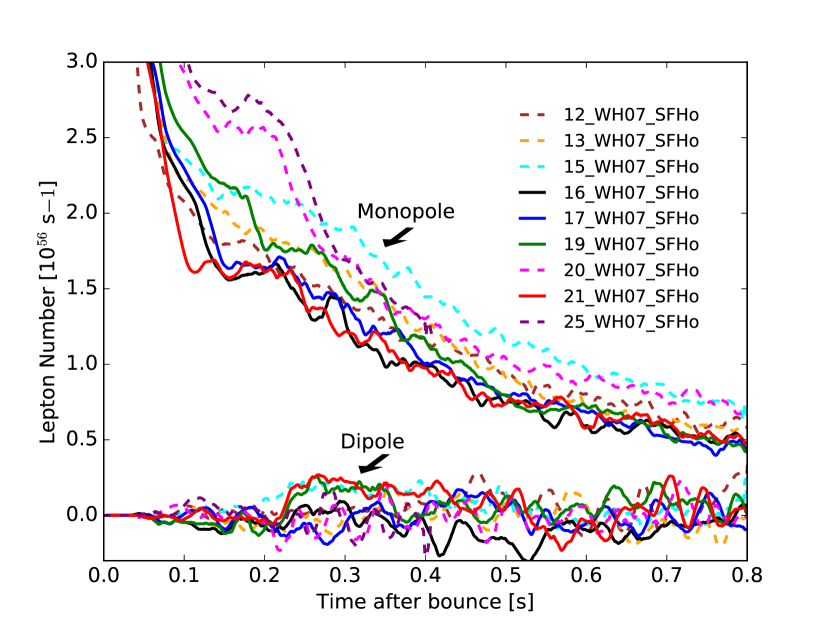
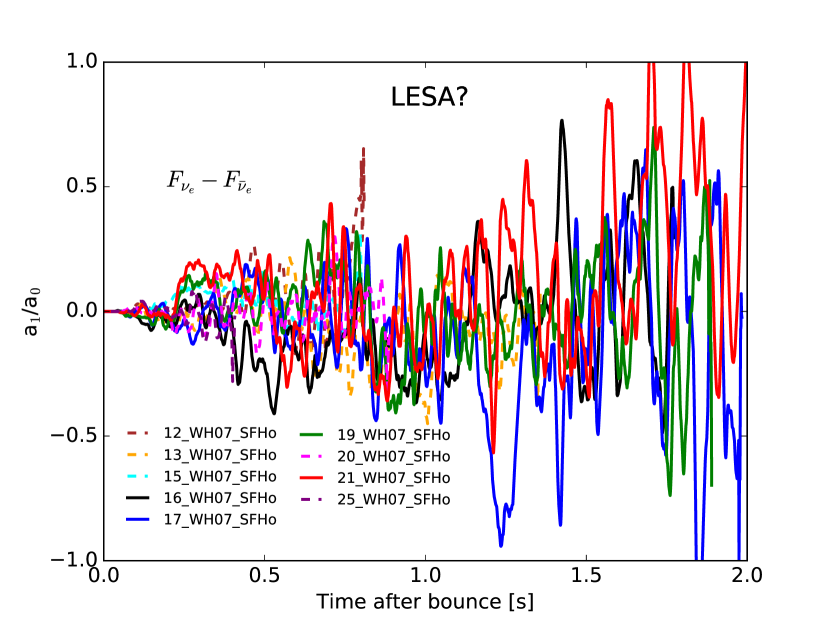
Following Tamborra et al. (2014), we look for evidence for the Lepton-number Emission Self-sustained Asymmetry (LESA), a neutrino-hydrodynamical instability that may set in shortly before explosion. In Fig. 12, we plot (top panel) the dipole and monopole moments of the neutrino number asymmetry (defined as the number flux of electron-type neutrinos minus anti-electron type neutrinos, ,) and the ratio of the two (bottom panel). Relative to Tamborra et al. (2014) (who perform the simulations in 3D with the ray-by-ray plus approximation but find no explosions), we find our dipole term to be an order of magnitude smaller, at least for the first several hundred milliseconds. This is in agreement with Dolence et al. (2015), though we find our dipole component to be slightly larger. Furthermore, even when the dipole term is of the same order as the monopole term (around one second post-bounce, when the latter has decayed sufficiently), the amplitudes are oscillating and not sustained. Only for the 21-M⊙ model (red) do we find a sustained dipole term from 200 to 500 ms post-bounce, but even this is smaller by an order of magnitude than the results found by Tamborra et al. (2014) for their progenitor suite. Thus, we conclude that we do not find evidence for lepton-emission self-sustained asymmetry (LESA), at least in 2D. However, we emphasize that thorough analysis requires performing the simulation in 3D with correct neutrino transport.
5 Neutron Star Properties
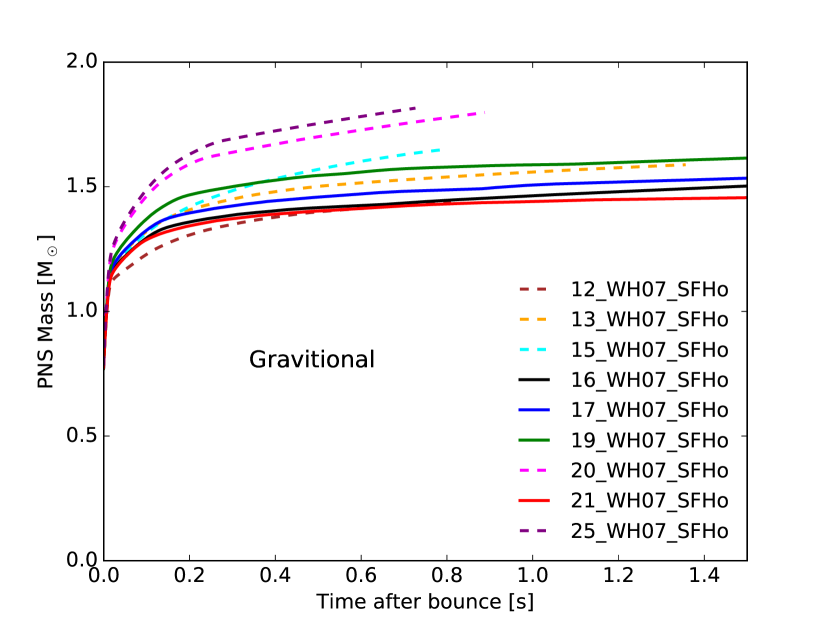
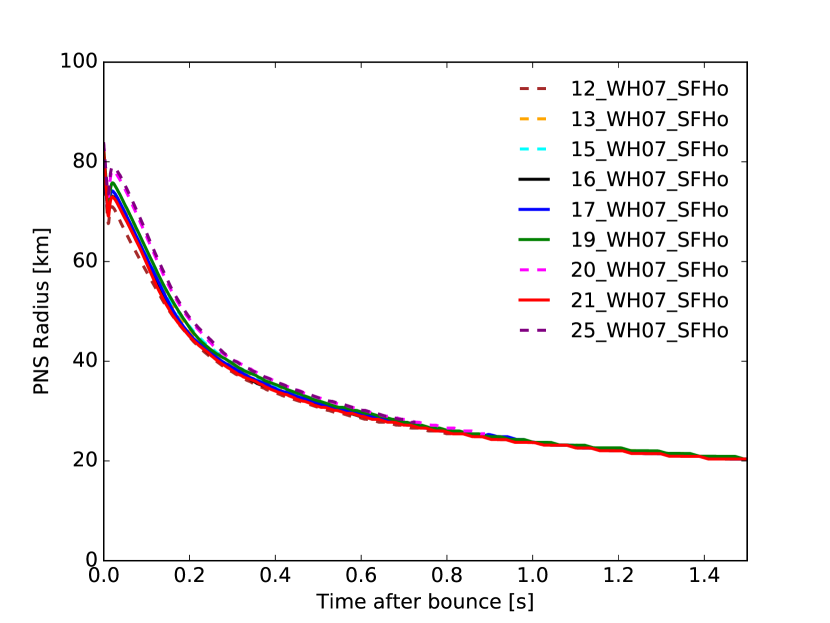
Here, we provide a few of the properties of the remnant proto-neutron star in our model suite. We identify the proto-neutron star (PNS) radius where the density first drops below 1011 g cm-3, though the radius is quite insensitive to the precise density cutoff near this value.
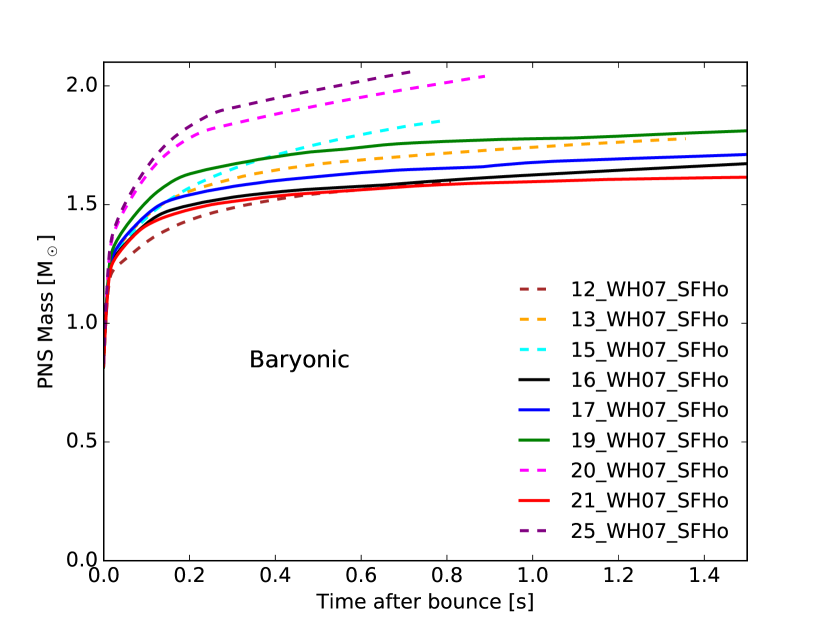
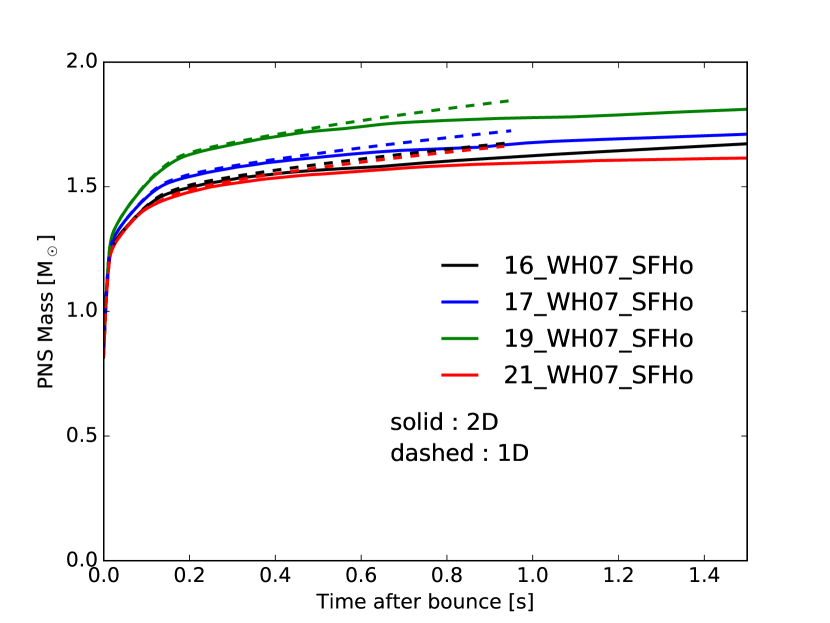
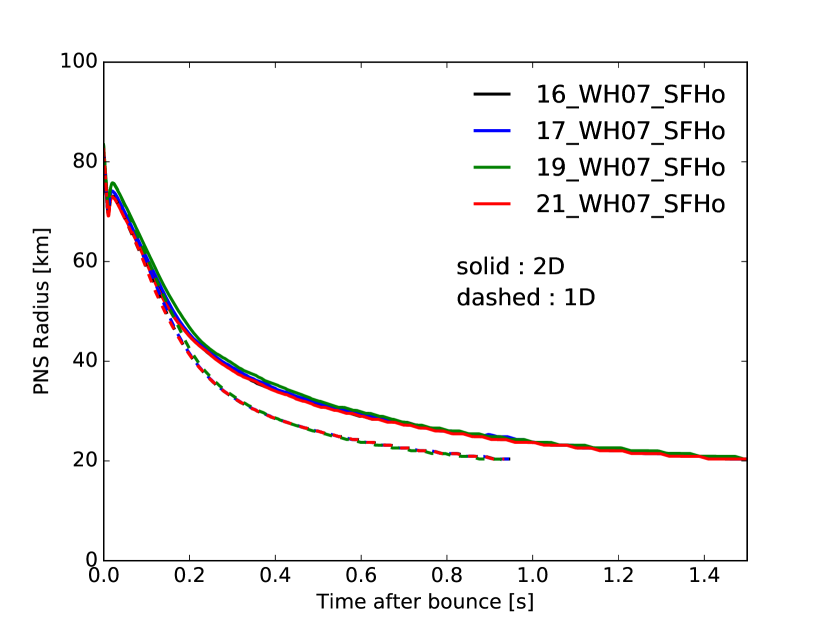
In Fig. 13 and Fig. 14, we study both the dependence upon progenitor mass and the detailed microphysics on PNS mass (top panel) and radius (bottom panel) for two sets of models: all nine progenitors in 2D, and the four exploding progenitors in 2D and their 1D counterparts. For the former, we also plot the gravitational mass following the approximate fit of Timmes et al. (1996). Since the density drops sharply at the PNS surface, the PNS radii are insensitive to the ambient pressure external to the core and, hence, to the progenitor mass (see also Radice et al. 2017b), and we find that all PNS radii converge to the same mass by 1.5 seconds post-bounce for all the progenitors in 2D. However, we find that the PNS radii are sensitive to the dimensionality, with the 1D models’ PNS radii roughly 20% smaller than the 2D counterparts. Radice et al. (2017b) find a similar result for their set of low-mass progenitors, attributing the larger radii in 2D to convection in the PNS.
The PNS baryon mass evolution on the other hand, simply tracks accretion history. For the non-exploding (dashed) models in Fig. 13, this is monotonic with progenitor mass, spanning from 1.6 to 2.0 M⊙ for the 12 to 25-M progenitors, respectively, and correlates roughly monotonically with progenitor mass. For the 20- and 25-M⊙ progenitors, the PNS exceeds 2.0 M⊙ as early as 0.6 seconds post-bounce. Unlike the four exploding models, the non-exploding models have not yet asymptoted by the end of the calculation. Figure 17 illustrates the mass evolution comparing 1D and 2D. The latter explodes, reverting accretion, and hence, leaves behind a smaller PNS mass.
5.1 Effect of Microphysics on PNS Masses
Due to the reduced neutrino opacities, we find that the many-body effect leads to a faster PNS contraction rate and a smaller PNS radii by 5%, as was found to be the case for low-mass progenitors by Radice et al. (2017b). Furthermore, because the model with the many-body correction prompts an earlier explosion, it leads to smaller PNS masses because of the shorter accretion history.
6 1D Comparison
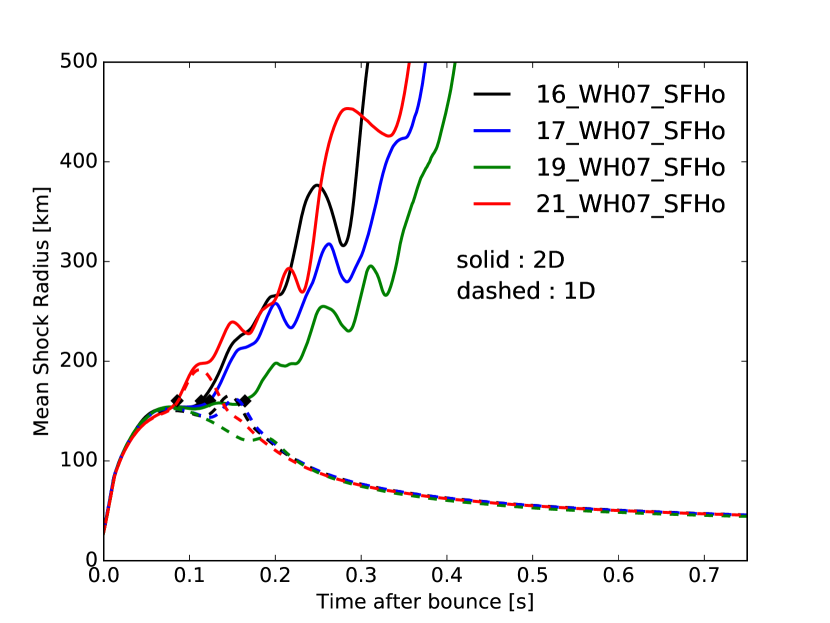
Here, we compare one-dimensional counterparts to the four models that explode in two dimensions. The shock radii (in km) for these eight models are shown in Fig. 15 as a function of time after bounce (in seconds). None of these models explodes by the end of our simulations, spanning at least 700 milliseconds post-bounce.
Figure 17 depicts the luminosities (in 1052 erg s-1) and RMS energies (MeV) as a function of time after bounce (in seconds) for the 2D models and their 1D counterparts. The electron and anti-electron luminosities dip after explosion for the former as accretion is reversed. However, the 2D models have consistently higher luminosities by %, which is in agreement with Radice et al. (2017b) and O’Connor & Couch (2018), who cite increases in heavy-neutrino luminosities due to PNS convection in multi-dimensional simulations (see also Burrows & Fryxell 1993; Keil et al. 1996; Dessart et al. 2006). In Fig. 6, we see an inner convective region for the 2D models driven by a negative gradient developing in the PNS as early as 100 ms post-bounce. Indeed, since our 1D models do not explode and accretion continues for longer, we may be underestimating the effects of convection in our comparison.
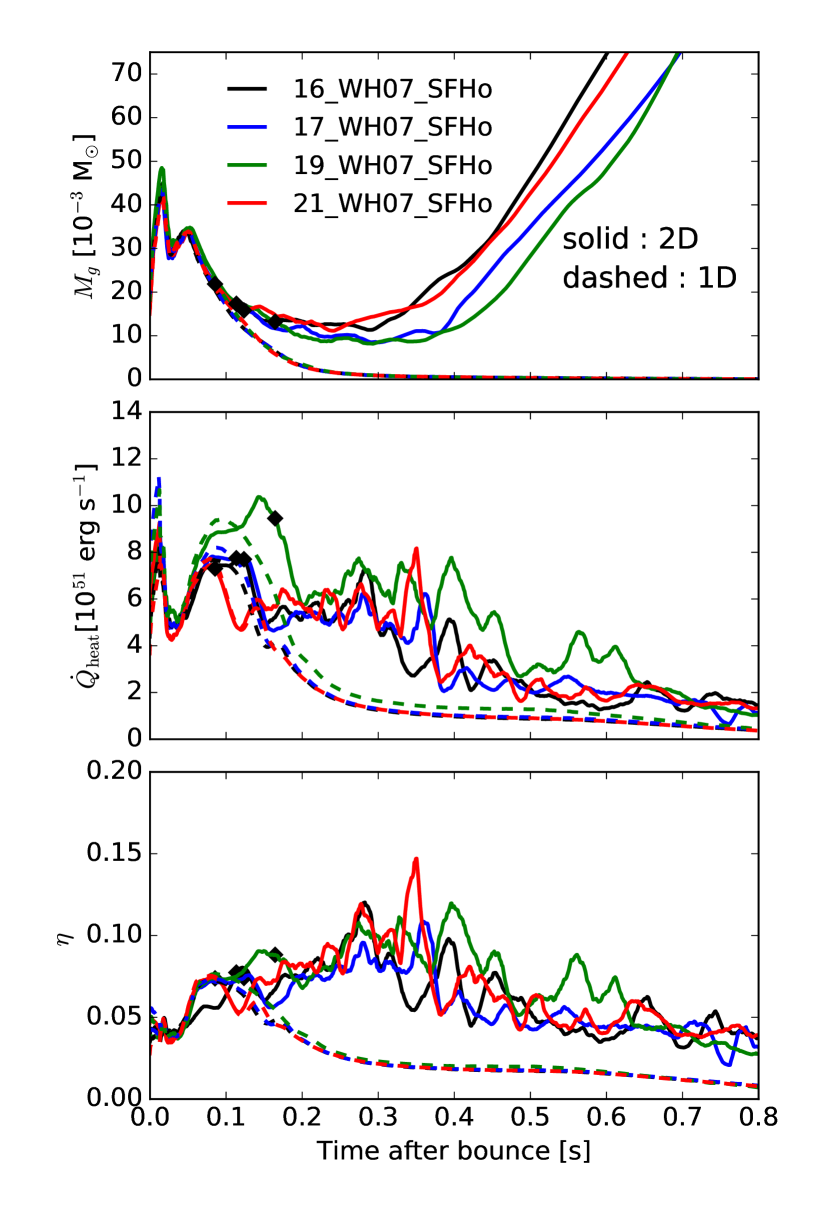
In Fig. 16, we compare gain region properties for the four exploding models (solid) in 2D to their counterparts in 1D (dashed). Up to 100 ms post-bounce, the gain region mass, heating rate, and heating efficiency are quite similar for the two cases. The similarities are short-lived at later times, the gain mass, heating rates, and heating efficiency of the 1D models plummeting to values much smaller than their 2D counterparts. Hence, dimensionality of the simulation is directly reflected in the energetics of the exploding models.
7 Conclusions
We have presented a series of 2D radiation-thydrodynamic simulations for nine progenitors with inelastic scattering processes off electrons and nucleons, as well as the many-body correction to neutrino-nucleon scattering opacities over a grid extending out to 20,000 km. We find that four of these models (16-, 17-, 19-, and 21-M⊙ from Woosley & Heger 2007) explode in this default configuration. These four models have Si-O interfaces featuring a significant density drop which reduces the accretion rate near the stalled shock and prompts early explosion. All four models explode within 200 milliseconds of bounce. The remaining five models do not have a prominent Si-O interface (12-, 13-, 15-M⊙), or have one further out (20-, 25-M⊙), suggesting that the timing of the accretion and dip at the Si-O interface could be critical to explosion. However, with the addition of moderate rotation and perturbations to infall velocities, even these five non-exploding models explode, suggesting that all progenitors are close to criticality for explosion. We also explore the microphysical dependence for the 16-M⊙ progenitor, finding that it does not explode if either IES, INS, or MB is not included. Even removing the many-body correction prevents explosion. However, in Burrows et al. (2018), we show that inclusion of the Fischer (2016) correction to the nucleon-bremsstrahlung and reducing the electron capture rate on heavy nuclei (Juodagalvis et al. 2010) leads to explosion, corroborating our proposal that all models are near criticality and that modest changes to inputs can lead to explosion.
We calculate explosion energies for the four exploding models, summing kinetic, internal, and gravitational energies over our grid and substracting the absolute value of nuclear binding energy. We correct for the binding energy of the exterior overburden. All but the 21-M⊙ progenitor have positive explosion energies at the end of our simulation of order a few 1050 ergs, and rising. The 17- and 19-M⊙ progenitors are far from asymptoting and feature a corresponding rise in kinetic energy, suggesting the need to carry these calculations out on larger grids and for longer times to estimate final explosion energies. Furthermore, we see that the more energetically explosive models have multiple convective plumes with larger solid angles. Together with the rise in kinetic energy, this suggests that more isotropic morphology of outflow is significant in producing larger explosion energies. The gain region properties of exploding models further distinguish them from the non-exploding models, with the former growing in gain mass following explosion with correspondingly higher heating efficiencies.
Together with the low-mass progenitors models from Radice et al. (2017b), we show that lower-mass progenitors tend to have higher shock velocities and consequently, less dwell time of the neutron-rich ejecta for neutrino processing. This produces -ejecta mass histograms skewed towards lower for the lower mass progenitors. We also find no evidence for Lepton-number Emission Self-sustained Asymmetry (LESA), finding rather that the dipole moment of the net neutrino number is an order of magnitude smaller than found in Tamborra et al. (2014).
We find that PNS masses track accretion history and are systemically larger for non-exploding or later-exploding models. PNS radii, however, are largely insensitive to input physics, but are sensitive to dimensionality, with 1D models asymptoting to a smaller PNS radii than their 2D counterparts. Radice et al. (2017b) found similar behavior for their set of low-mass progenitors, citing convection in the PNS in 2D for the larger PNS radii. Including the many-body effect, however, does lead to a faster PNS contraction rate.
We concluded by exploring 1D comparisons to our four exploding models in 2D. None of the models explodes in 1D. The electron- and anti-electron-type neutrino luminosities dip in 2D post-explosion, as accretion is reversed. The “"-type neutrino luminosities, however, are consistently higher, attributed to inner convection in the PNS. Mass, heating rate, and heating efficiency rise post-explosion for the exploding 2D models, but not for their 1D counterparts.
In the near future, we will explore these progenitor models in 3D using Fornax. Early multi-group 3D simulations either did not explode, or exploded later; more recent simulations illustrate that 3D progenitors are only slightly less explosive (see review by Müller 2016). The inclusion of detailed microphysics, including the many-body effects, together with multi-dimensional neutrino transport, may bridge this gap. Moreover, we will explore whether 3D simulations produce more isotropic explosions and larger explosion energies that closely reproduce what we see in Nature.
8 Acknowledgements
The authors thank Sydney Andrews and Viktoriya Morozova for helpful discussions and feedback. DR acknowledges support from a Frank and Peggy Taplin Membership at the Institute for Advanced Study and the Max-Planck/Princeton Center (MPPC) for Plasma Physics (NSF PHY-1523261). JD acknowledges support from the Laboratory Directed Research and Development program of Los Alamos National Laboratory. The authors acknowledge support under U.S. NSF Grant AST-1714267, the Max-Planck/Princeton Center (MPPC) for Plasma Physics (NSF PHY-1144374), and the DOE SciDAC4 Grant DE-SC0018297 (subaward 00009650). They employed computational resources of the Princeton Institute for Computational Science and Engineering (PICSciE) and of the National Energy Research Scientific Computing Center (NERSC), which is supported by the Office of Science of the US Department of Energy (DOE) under contract DE-AC03-76SF00098.
References
- Abbott et al. (2016) Abbott B. P., et al., 2016, ApJ, 818, L22
- Abbott et al. (2017) Abbott B. P., et al., 2017, Physical Review Letters, 119, 161101
- Abdikamalov et al. (2016) Abdikamalov E., Zhaksylykov A., Radice D., Berdibek S., 2016, MNRAS, 461, 3864
- Ahmed et al. (2012) Ahmed Z., et al., 2012, Phys. Rev. Lett., 108, 102001
- Andresen et al. (2017) Andresen H., Müller B., Müller E., Janka H.-T., 2017, MNRAS, 468, 2032
- Bollig et al. (2017) Bollig R., Janka H.-T., Lohs A., Martínez-Pinedo G., Horowitz C. J., Melson T., 2017, Physical Review Letters, 119, 242702
- Bruenn (1985) Bruenn S. W., 1985, ApJS, 58, 771
- Bruenn et al. (2013) Bruenn S. W., et al., 2013, ApJ, 767, L6
- Bruenn et al. (2016) Bruenn S. W., et al., 2016, ApJ, 818, 123
- Buras et al. (2006) Buras R., Rampp M., Janka H.-T., Kifonidis K., 2006, A&A, 447, 1049
- Burrows & Fryxell (1993) Burrows A., Fryxell B. A., 1993, ApJ, 418, L33
- Burrows & Goshy (1993) Burrows A., Goshy J., 1993, ApJ, 416, L75
- Burrows & Sawyer (1998) Burrows A., Sawyer R. F., 1998, Phys. Rev. C, 58, 554
- Burrows et al. (2006) Burrows A., Reddy S., Thompson T. A., 2006, Nuclear Physics A, 777, 356
- Burrows et al. (2018) Burrows A., Vartanyan D., Dolence J. C., Skinner M. A., Radice D., 2018, Space Science Reviews, 214, 33
- Cerdá-Durán et al. (2013) Cerdá-Durán P., DeBrye N., Aloy M. A., Font J. A., Obergaulinger M., 2013, ApJ, 779, L18
- Colgate & White (1966) Colgate S. A., White R. H., 1966, ApJ, 143, 626
- Couch (2013) Couch S. M., 2013, ApJ, 775, 35
- Couch & Ott (2013) Couch S. M., Ott C. D., 2013, ApJ, 778, L7
- Couch & Ott (2015) Couch S. M., Ott C. D., 2015, ApJ, 799, 5
- Dessart et al. (2006) Dessart L., Burrows A., Livne E., Ott C. D., 2006, ApJ, 645, 534
- Dolence et al. (2015) Dolence J. C., Burrows A., Zhang W., 2015, ApJ, 800, 10
- Eriguchi & Müller (1985) Eriguchi Y., Müller E., 1985, A&A, 146, 260
- Ertl et al. (2016) Ertl T., Janka H.-T., Woosley S. E., Sukhbold T., Ugliano M., 2016, ApJ, 818, 124
- Fischer (2016) Fischer T., 2016, A&A, 593, A103
- Fryer & Warren (2002) Fryer C. L., Warren M. S., 2002, ApJ, 574, L65
- Green et al. (2017) Green J., et al., 2017, Phys. Rev. D, 95, 114502
- Hanke et al. (2013) Hanke F., Müller B., Wongwathanarat A., Marek A., Janka H.-T., 2013, ApJ, 770, 66
- Horowitz et al. (2017) Horowitz C. J., Caballero O. L., Lin Z., O’Connor E., Schwenk A., 2017, Phys. Rev. C, 95, 025801
- Juodagalvis et al. (2010) Juodagalvis A., Langanke K., Hix W. R., Martínez-Pinedo G., Sampaio J. M., 2010, Nuclear Physics A, 848, 454
- Keil et al. (1996) Keil W., Janka H.-T., Mueller E., 1996, ApJ, 473, L111
- Kotake (2013) Kotake K., 2013, Comptes Rendus Physique, 14, 318
- Kuroda et al. (2016) Kuroda T., Kotake K., Takiwaki T., 2016, ApJ, 829, L14
- Lattimer & Swesty (1991) Lattimer J. M., Swesty F., 1991, Nuclear Physics A, 535, 331
- Lentz et al. (2015) Lentz E. J., et al., 2015, ApJ, 807, L31
- Marek et al. (2006) Marek A., Dimmelmeier H., Janka H.-T., Müller E., Buras R., 2006, A&A, 445, 273
- Melson et al. (2015a) Melson T., Janka H.-T., Marek A., 2015a, ApJ, 801, L24
- Melson et al. (2015b) Melson T., Janka H.-T., Bollig R., Hanke F., Marek A., Müller B., 2015b, ApJ, 808, L42
- Minerbo (1978) Minerbo G. N., 1978, J. Quant. Spectrosc. Radiative Transfer, 20, 541
- Morozova et al. (2018) Morozova V., Radice D., Burrows A., Vartanyan D., 2018, preprint, (arXiv:1801.01914)
- Müller (2016) Müller B., 2016, Publ. Astron. Soc. Australia, 33, e048
- Müller & Janka (2015) Müller B., Janka H.-T., 2015, MNRAS, 448, 2141
- Müller et al. (2012a) Müller B., Janka H.-T., Marek A., 2012a, ApJ, 756, 84
- Müller et al. (2012b) Müller B., Janka H.-T., Heger A., 2012b, ApJ, 761, 72
- Müller et al. (2013) Müller B., Janka H.-T., Marek A., 2013, ApJ, 766, 43
- Müller et al. (2016) Müller B., Heger A., Liptai D., Cameron J. B., 2016, MNRAS, 460, 742
- Müller et al. (2017) Müller B., Melson T., Heger A., Janka H.-T., 2017, MNRAS, 472, 491
- Murphy & Burrows (2008) Murphy J. W., Burrows A., 2008, ApJ, 688, 1159
- Murphy & Dolence (2017) Murphy J. W., Dolence J. C., 2017, ApJ, 834, 183
- Nakamura et al. (2015) Nakamura K., Takiwaki T., Kuroda T., Kotake K., 2015, PASJ, 67, 107
- Nomoto (1984) Nomoto K., 1984, ApJ, 277, 791
- Nomoto (1987) Nomoto K., 1987, ApJ, 322, 206
- O’Connor & Couch (2018) O’Connor E. P., Couch S. M., 2018, ApJ, 854, 63
- O’Connor & Ott (2011) O’Connor E., Ott C. D., 2011, ApJ, 730, 70
- O’Connor & Ott (2013) O’Connor E., Ott C. D., 2013, ApJ, 762, 126
- O’Connor et al. (2017) O’Connor E., Horowitz C. J., Lin Z., Couch S., 2017, in Marcowith A., Renaud M., Dubner G., Ray A., Bykov A., eds, IAU Symposium Vol. 331, Supernova 1987A:30 years later - Cosmic Rays and Nuclei from Supernovae and their Aftermaths. pp 107–112 (arXiv:1712.08253), doi:10.1017/S1743921317004586
- Ott (2009) Ott C. D., 2009, Classical and Quantum Gravity, 26, 063001
- Ott et al. (2006) Ott C. D., Burrows A., Thompson T. A., Livne E., Walder R., 2006, ApJS, 164, 130
- Ott et al. (2012) Ott C. D., et al., 2012, Phys. Rev. D, 86, 024026
- Ott et al. (2017) Ott C. D., Roberts L. F., da Silva Schneider A., Fedrow J. M., Haas R., Schnetter E., 2017, preprint, (arXiv:1712.01304)
- Pejcha & Thompson (2012) Pejcha O., Thompson T. A., 2012, ApJ, 746, 106
- Radice et al. (2017a) Radice D., Abdikamalov E., Ott C. D., Moesta P., Couch S. M., Roberts L. F., 2017a, preprint, (arXiv:1710.01282)
- Radice et al. (2017b) Radice D., Burrows A., Vartanyan D., Skinner M. A., Dolence J. C., 2017b, ApJ, 850, 43
- Raives et al. (2018) Raives M. J., Couch S. M., Greco J. P., Pejcha O., Thompson T. A., 2018, preprint, (arXiv:1801.02626)
- Roberts et al. (2016) Roberts L. F., Ott C. D., Haas R., O’Connor E. P., Diener P., Schnetter E., 2016, ApJ, 831, 98
- Skinner et al. (2016) Skinner M. A., Burrows A., Dolence J. C., 2016, ApJ, 831, 81
- Steiner et al. (2013) Steiner A. W., Hempel M., Fischer T., 2013, ApJ, 774, 17
- Sukhbold et al. (2016) Sukhbold T., Ertl T., Woosley S. E., Brown J. M., Janka H.-T., 2016, ApJ, 821, 38
- Summa et al. (2016) Summa A., Hanke F., Janka H.-T., Melson T., Marek A., Müller B., 2016, ApJ, 825, 6
- Summa et al. (2017) Summa A., Janka H.-T., Hanke F., Melson T., Marek A., Müller B., 2017, in Eldridge J. J., Bray J. C., McClelland L. A. S., Xiao L., eds, IAU Symposium Vol. 329, The Lives and Death-Throes of Massive Stars. pp 449–449, doi:10.1017/S174392131700117X
- Summa et al. (2018) Summa A., Janka H.-T., Melson T., Marek A., 2018, ApJ, 852, 28
- Suwa et al. (2016) Suwa Y., Yamada S., Takiwaki T., Kotake K., 2016, ApJ, 816, 43
- Takiwaki et al. (2012) Takiwaki T., Kotake K., Suwa Y., 2012, ApJ, 749, 98
- Takiwaki et al. (2014) Takiwaki T., Kotake K., Suwa Y., 2014, ApJ, 786, 83
- Tamborra et al. (2014) Tamborra I., Hanke F., Janka H.-T., Müller B., Raffelt G. G., Marek A., 2014, ApJ, 792, 96
- Tews et al. (2017) Tews I., Lattimer J. M., Ohnishi A., Kolomeitsev E. E., 2017, ApJ, 848, 105
- Thompson et al. (2003) Thompson T. A., Burrows A., Pinto P. A., 2003, ApJ, 592, 434
- Timmes et al. (1996) Timmes F. X., Woosley S. E., Weaver T. A., 1996, ApJ, 457, 834
- Vaytet et al. (2011) Vaytet N. M. H., Audit E., Dubroca B., Delahaye F., 2011, J. Quant. Spectrosc. Radiative Transfer, 112, 1323
- Wallace et al. (2016) Wallace J., Burrows A., Dolence J. C., 2016, ApJ, 817, 182
- Wanajo et al. (2018) Wanajo S., Müller B., Janka H.-T., Heger A., 2018, ApJ, 852, 40
- Woosley & Heger (2007) Woosley S. E., Heger A., 2007, Phys. Rep., 442, 269
- Woosley et al. (2002) Woosley S. E., Heger A., Weaver T. A., 2002, Reviews of Modern Physics, 74, 1015
- Yakunin et al. (2015) Yakunin K. N., et al., 2015, Phys. Rev. D, 92, 084040
| Model | MBar | MGrav | -EEnv | ETot | |
|---|---|---|---|---|---|
| [M⊙] | [M⊙] | [1050 ergs] | [1050 ergs] | [1050 ergs ] | |
| 16 | 1.70 | 1.52 | 1.57 | 1.64 | 0.4 |
| 17 | 1.74 | 1.56 | 2.02 | 2.89 | 0.8 |
| 19 | 1.84 | 1.64 | 2.70 | 2.40 | 0.8 |
| 21 | 1.63 | 1.47 | 3.56 | -0.70 | 0.7 |