The -Process Pattern of a Bright, Highly -Process-Enhanced Metal-Poor Halo Star at
Abstract
A high-resolution spectroscopic analysis is presented for a new highly -process-enhanced (, ), very metal-poor (), retrograde halo star, RAVE J153830.9-180424, discovered as part of the R-Process Alliance survey. At , this is the brightest and most metal-rich -II star known in the Milky Way halo. Its brightness enables high-S/N detections of a wide variety of chemical species that are mostly created by the -process, including some infrequently detected lines from elements like Ru, Pd, Ag, Tm, Yb, Lu, Hf, and Th, with upper limits on Pb and U. This is the most complete -process census in a very metal-poor -II star. J1538-1804 shows no signs of -process contamination, based on its low [Ba/Eu] and [Pb/Fe]. As with many other -process-enhanced stars, J1538-1804’s -process pattern matches that of the Sun for elements between the first, second, and third peaks, and does not exhibit an actinide boost. Cosmo-chronometric age-dating reveals the -process material to be quite old. This robust main -process pattern is a necessary constraint for -process formation scenarios (of particular interest in light of the recent neutron star merger, GW 170817), and has important consequences for the origins of -II stars. Additional -I and -II stars will be reported by the R-Process Alliance in the near future.
1 Introduction
The very metal-poor stars () are believed to be some of the oldest objects in the Milky Way (MW). These stars retain the chemical signatures of the few stars that evolved and died before them (e.g., Frebel et al. 2015). The subset of stars that are highly enhanced in the heavy elements that form via the rapid (-) neutron capture process are of particular interest, as their abundances trace the yields from early -process events. The signatures of the -process are seen throughout the Galaxy (Roederer, 2013), but -process-enhanced stars enable measurements of a wide assortment of neutron-capture elements. These stars are classified according to their Eu abundances: -I stars have , while -II stars have (Christlieb et al., 2004).111Both have to minimize contamination from the slow (-) process. There are presently only -II and -I stars known (see the JINAbase compilation; Abohalima et al. 2017). Studies of these stars have found a nearly identical main -process pattern (for Ba to Hf) in all types of stars and in all environments, with variations among the lightest and heaviest elements (e.g., Sneden et al. 1994; Roederer et al. 2014b; Siqueira Mello et al. 2014; Ji et al. 2016; Placco et al. 2017).
Neutron star mergers (NSMs) have long been suspected to be a site of the -process (e.g., Lattimer & Schramm 1974; Rosswog et al. 2014; Lippuner et al. 2017). The recent detection of GW 170817 (Abbott et al., 2017) and subsequent -process nucleosynthesis (e.g., Chornock et al. 2017) demonstrate that these conditions can indeed be met in NSMs. Galactic chemical evolution models (e.g., Côté et al. 2017) also suggest that NSMs can produce all the observed Eu in the MW. However, problems such as coalescence time and NSM rates still remain, prompting the question: Is there only a single site for -process nucleosynthesis, and are the physical conditions always identical? Standard core-collapse supernovae seem to have been ruled out as the site for most of the -process elements (though they may form the lighter elements; e.g., Arcones & Thielemann 2013), but the magneto-rotational supernovae (e.g., Winteler et al. 2012) remain another option. Observations of the detailed -process pattern in large samples of stars will be useful for constraining the fundamental physics and site(s) behind the -process, through determinations of the relative abundances of second- vs. third-peak elements, the presence of actinide boosts (e.g., Schatz et al. 2002), and the behavior of the first-peak elements.
Also important is the rate at which -process events occur, as well as where and when. The detection of -process-enhanced stars in ultra-faint dwarf galaxies (Ji et al., 2016), the age-dating of -process-enhanced stars (Sneden et al., 1996; Cayrel et al., 2001), trends with metallicity or other chemical abundances (Macias & Ramirez-Ruiz, 2016), the relative numbers of -I and -II stars (Barklem et al., 2005), and the amount of -process material in a given environment (e.g., Tsujimoto & Nishimura 2015; Beniamini et al. 2016) are all important for deciphering the site of the -process. Obtaining high-precision, detailed abundance patterns and understanding the -process-enhanced stars as a stellar population in a statistical sense requires a much larger sample of -I and -II stars.
The R-Process Alliance is a collaboration with the aim of identifying the site(s) of the -process. The first phase of the Alliance is dedicated to discovering larger samples of -I and -II stars in the Milky Way through medium- and high-resolution spectroscopy (Placco et al., Hansen et al., Sakari et al., in prep.). This letter presents the detailed -process abundances of an -II star, RAVE J153830.9-180424 (hereafter J1538-1804) that was discovered in the northern hemisphere sample of Sakari et al. (in prep., hereafter Paper I). Future papers will present additional -I and -II stars discovered by the R-Process Alliance.
2 Observations, Data Reduction, and Analysis Techniques
J1538-1804 was identified as a metal-poor star in the re-analyzed data from the RAdial Velocity Experiment (RAVE) survey (Steinmetz et al., 2006) by Matijevic̆ et al. (2017). The star was followed up at medium-resolution () in the blue ( Å) to determine atmospheric parameters (Placco et al., in prep.), and was subsequently identified as an -II star in the northern hemisphere, high-resolution component of the R-Process Alliance (Paper I), based on echelle spectroscopy with the Astrophysical Research Consortium (ARC) 3.5 - m telescope at Apache Point Observatory (APO). The target was then followed up at higher resolution ( in the blue and in the red), with the slit and binning) on 4 May, 2017 with the Magellan Inamori Kyocera Echelle (MIKE) spectrograph (Bernstein et al., 2003) on the Magellan-Clay Telescope at Las Campanas Observatory. A wavelength coverage of Å was obtained in the blue, and Å in the red. The details for the MIKE observations are listed in Table 1; the conditions were photometric, with 0.4″ seeing. The spectra were reduced using the Image Reduction and Analysis Facility program (IRAF)222IRAF is distributed by the National Optical Astronomy Observatory, which is operated by the Association of Universities for Research in Astronomy, Inc., under cooperative agreement with the National Science Foundation. and the mtools package.333http://www.lco.cl/telescopes-information/magellan/instruments/mike/iraf-tools/iraf-mtools-package
All abundances were derived with spectrum syntheses, using the 2017 version of MOOG (Sneden, 1973) with an appropriate treatment of scattering (Sobeck et al., 2011).444https://github.com/alexji/moog17scat The atmospheric parameters of the stars were determined by flattening trends in Fe I lines with wavelength, reduced equivalent width, and excitation potential (EP), and by forcing agreement between Fe I and Fe II abundances. For each Fe I line, a 3D, non-Local Thermodynamic Equilibrium (NLTE) correction (Amarsi et al. , 2016) was applied to the LTE abundance. Paper I will demonstrate that the NLTE parameters are generally in better agreement with photometric temperatures; however, at , the differences between NLTE and LTE atmospheric parameters are generally negligible. Using LTE atmospheric parameters also has a slight impact on the derived abundances; see Table 3.
The line lists were generated with the linemake code555https://github.com/vmplacco/linemake (C. Sneden, private comm.) with additions from Cowan et al. (2005), Xu et al. (2007), and Sneden et al. (2009), and include hyperfine structure, isotopic splitting, and molecular lines from CH, C2, and CN. The atmospheric parameters and abundances of the light and iron-peak elements are provided in Paper I, though Table 1 lists the final, adopted atmospheric parameters, the [C/Fe], and the average [/Fe]. Note that this star is not C-enhanced. This star was also included in the first Gaia data release (Brown et al., 2016). Its proper motion, parallax, and velocity demonstrate that it is a retrograde halo star (see Table 1), even accounting for the large uncertainty in the parallax.
| Parameter | Value |
|---|---|
| Aliases | TYC 6189-285-1 |
| 2MASS J15383085-1804242 | |
| RA (J2000) | 15:38:30.85 |
| Dec (J2000) | -18:04:24.2 |
| 10.86 | |
| 8.484 | |
| Observation Date | 4 May 2017 (MJD = 57877) |
| Exposure Time (s) | 1800 |
| S/N, 3700 Åa | 287 |
| (km s-1) | |
| (km s-1)b | |
| (km s-1)b | |
| (km s-1)b | |
| (K) | |
| (km/s) | |
| Fe/H | |
| C/Fe | |
| /Fe |
3 -Process Patterns
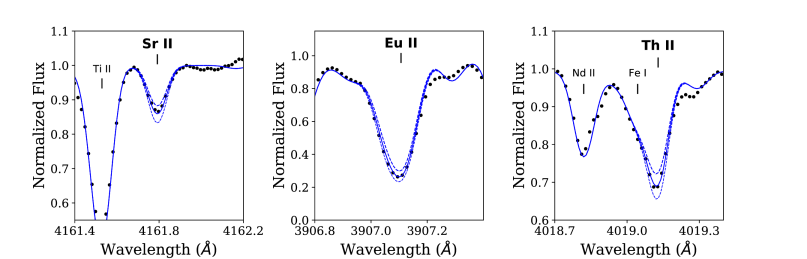
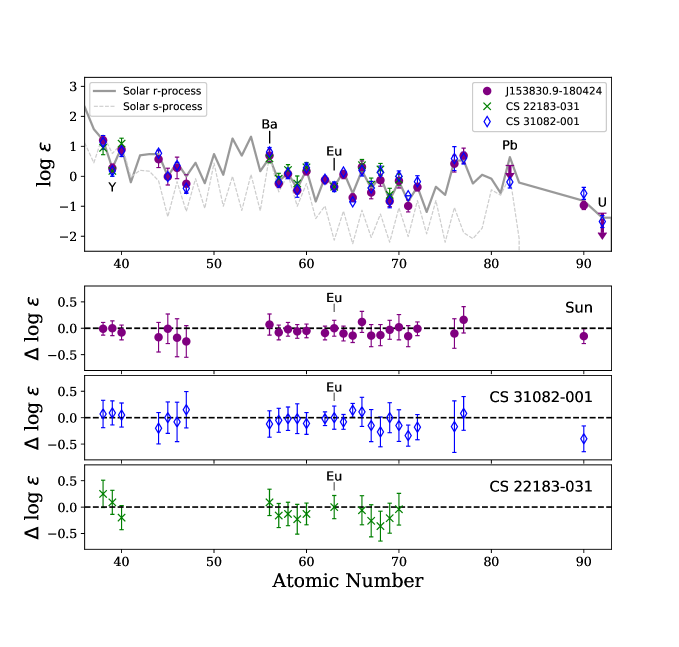
Abundances or upper limits are derived for 27 neutron-capture elements; sample syntheses are shown in Figure 1. Table 2 shows the line-by-line -process abundances, while Table 3 shows the final mean abundances. When a spectral line was sufficiently weak and unblended in the Kurucz solar spectrum,666http://kurucz.harvard.edu/sun.html the solar abundance for that line was derived using the same atomic data (see Table 2; otherwise, the Asplund et al. 2009 solar values are used). All [X/Fe] ratios are relative to the [Fe I/H] ratios in Table 1 (note that the adoption of NLTE corrections during the atmospheric parameter determination has ensured that the Fe I and Fe II ratios are equal). The random errors are based on the quality of the data and the fitted synthetic spectra. A minimum random error of 0.05 dex was adopted, but weak or blended lines in low-S/N regions could have random errors as large as dex. The systematic errors are due to uncertainties in the atmospheric parameters. Table 3 also provides the abundance offsets that occur when LTE parameters are adopted. Figure 2 shows the -process pattern in J1538-1804, along with reference patterns in the Sun, a very metal-poor, actinide boost -II star (Hill et al., 2002), and an extremely metal-poor -I star (Roederer et al., 2014a). The pattern in J1538-1804 is well-fit by the Solar -process pattern, and does not agree with the Solar -process pattern. The various groups of elements are discussed further below.
| Wavelength | EP | Solar | J1538-1804 | ||||
|---|---|---|---|---|---|---|---|
| (Å) | (eV) | ||||||
| Sr II | 4161\@alignment@align.792 | 2.938 | -0.50 | A09\@alignment@align | 1.20±0.05 | ||
| Y II | 3747\@alignment@align.556 | 0.104 | -0.91 | A09\@alignment@align | 0.22±0.10 | ||
| Y II | 4398\@alignment@align.013 | 0.129 | -1.00 | A09\@alignment@align | 0.22±0.10 | ||
| Y II | 4682\@alignment@align.324 | 0.408 | -1.51 | A09\@alignment@align | 0.24±0.05 | ||
| Y II | 4883\@alignment@align.680 | 1.083 | 0.07 | A09\@alignment@align | 0.42±0.10 | ||
| Zr II | 3998\@alignment@align.954 | 0.558 | -0.39 | A09\@alignment@align | 0.65±0.05 | ||
| Zr II | 4050\@alignment@align.316 | 0.713 | -1.00 | A09\@alignment@align | 1.02±0.05 | ||
| Zr II | 4317\@alignment@align.299 | 0.713 | -1.38 | A09\@alignment@align | 1.01±0.05 | ||
| Ru I | 3436\@alignment@align.736 | 0.148 | -0.02 | 1\@alignment@align.67 | 0.51±0.10 | ||
| Ru I | 3498\@alignment@align.942 | 0.000 | 0.33 | 1\@alignment@align.60 | 0.46±0.10 | ||
| Ru I | 3798\@alignment@align.898 | 0.148 | -0.09 | 1\@alignment@align.75 | 0.56±0.10 | ||
| Ru I | 3799\@alignment@align.349 | 0.000 | -0.07 | 1\@alignment@align.75 | 0.51±0.10 | ||
| Rh I | 3396\@alignment@align.819 | 0.000 | 0.05 | 0\@alignment@align.91 | 0.07±0.10 | ||
| Rh I | 3692\@alignment@align.358 | 0.000 | 0.17 | 0\@alignment@align.91 | -0.08±0.10 | ||
| Pd I | 3404\@alignment@align.579 | 0.813 | 0.32 | 1\@alignment@align.37 | 0.08±0.10 | ||
| Ag I | 3382\@alignment@align.889 | 0.000 | -0.38 | 0\@alignment@align.64 | 0.55±0.10 | ||
| Ba II | 5853\@alignment@align.675aaS/N is per resolution element | 0.604 | -1.00 | A09\@alignment@align | 0.69±0.10 | ||
| Ba II | 6141\@alignment@align.713aaLine has hyperfine structure and/or isotopic splitting. | 0.704 | -0.08 | A09\@alignment@align | 0.69±0.10 | ||
| La II | 3988\@alignment@align.515aaLine has hyperfine structure and/or isotopic splitting. | 0.403 | 0.21 | A09\@alignment@align | -0.34±0.05 | ||
| La II | 4086\@alignment@align.709aaLine has hyperfine structure and/or isotopic splitting. | 0.000 | -0.07 | A09\@alignment@align | -0.31±0.05 | ||
| La II | 4123\@alignment@align.230aaLine has hyperfine structure and/or isotopic splitting. | 0.321 | 0.13 | A09\@alignment@align | -0.31±0.05 | ||
| La II | 4333\@alignment@align.750aaLine has hyperfine structure and/or isotopic splitting. | 0.173 | -0.06 | A09\@alignment@align | -0.34±0.05 | ||
| La II | 5303\@alignment@align.520aaLine has hyperfine structure and/or isotopic splitting. | 0.321 | -1.35 | A09\@alignment@align | -0.14±0.05 | ||
| La II | 6390\@alignment@align.460aaLine has hyperfine structure and/or isotopic splitting. | 0.321 | -1.41 | A09\@alignment@align | -0.04±0.05 | ||
| Ce II | 3940\@alignment@align.330 | 0.318 | -0.27 | A09\@alignment@align | -0.14±0.05 | ||
| Ce II | 3999\@alignment@align.237 | 0.295 | 0.06 | A09\@alignment@align | -0.03±0.05 | ||
| Ce II | 4014\@alignment@align.897 | 0.529 | -0.20 | A09\@alignment@align | 0.09±0.05 | ||
| Ce II | 4072\@alignment@align.918 | 0.327 | -0.64 | A09\@alignment@align | 0.19±0.05 | ||
| Ce II | 4073\@alignment@align.474 | 0.477 | 0.21 | A09\@alignment@align | 0.07±0.05 | ||
| Ce II | 4083\@alignment@align.230 | 0.700 | 0.27 | A09\@alignment@align | 0.16±0.05 | ||
| Ce II | 4120\@alignment@align.840 | 0.320 | -0.37 | A09\@alignment@align | 0.19±0.05 | ||
| Ce II | 4137\@alignment@align.645 | 0.516 | 0.40 | A09\@alignment@align | -0.06±0.05 | ||
| Ce II | 4138\@alignment@align.096 | 0.924 | -0.08 | A09\@alignment@align | 0.17±0.05 | ||
| Ce II | 4165\@alignment@align.599 | 0.909 | 0.52 | A09\@alignment@align | 0.09±0.05 | ||
| Ce II | 4222\@alignment@align.597 | 0.122 | -0.15 | A09\@alignment@align | 0.09±0.05 | ||
| Ce II | 4418\@alignment@align.790 | 0.863 | 0.27 | A09\@alignment@align | 0.06±0.05 | ||
| Ce II | 4449\@alignment@align.330 | 0.608 | 0.04 | A09\@alignment@align | 0.04±0.05 | ||
| Ce II | 4486\@alignment@align.910 | 0.295 | -0.18 | A09\@alignment@align | 0.01±0.05 | ||
| Ce II | 4562\@alignment@align.370 | 0.477 | 0.21 | A09\@alignment@align | 0.09±0.05 | ||
| Ce II | 4628\@alignment@align.160 | 0.516 | 0.14 | A09\@alignment@align | 0.19±0.10 | ||
| Ce II | 5274\@alignment@align.230 | 1.044 | 0.13 | A09\@alignment@align | 0.19±0.05 | ||
| Pr II | 3964\@alignment@align.812aaLine has hyperfine structure and/or isotopic splitting. | 0.055 | 0.07 | A09\@alignment@align | -0.52±0.05 | ||
| Pr II | 4179\@alignment@align.393aaLine has hyperfine structure and/or isotopic splitting. | 0.204 | 0.46 | A09\@alignment@align | -0.40±0.05 | ||
| Pr II | 4222\@alignment@align.934aaLine has hyperfine structure and/or isotopic splitting. | 0.055 | 0.23 | A09\@alignment@align | -0.48±0.05 | ||
| Pr II | 4408\@alignment@align.819aaLine has hyperfine structure and/or isotopic splitting. | 0.000 | 0.05 | A09\@alignment@align | -0.48±0.05 | ||
| Pr II | 5259\@alignment@align.740aaLine has hyperfine structure and/or isotopic splitting. | 0.633 | 0.12 | A09\@alignment@align | -0.47±0.10 | ||
| Nd II | 3862\@alignment@align.566 | 0.182 | -0.76 | A09\@alignment@align | 0.18±0.10 | ||
| Nd II | 3863\@alignment@align.408 | 0.000 | -0.01 | A09\@alignment@align | 0.03±0.10 | ||
| Nd II | 3900\@alignment@align.215 | 0.471 | 0.10 | A09\@alignment@align | 0.05±0.10 | ||
| Nd II | 4021\@alignment@align.728 | 0.182 | -0.31 | A09\@alignment@align | 0.18±0.05 | ||
| Nd II | 4051\@alignment@align.139 | 0.380 | -0.30 | A09\@alignment@align | 0.18±0.05 | ||
| Nd II | 4061\@alignment@align.080 | 0.471 | 0.55 | A09\@alignment@align | 0.23±0.05 | ||
| Nd II | 4069\@alignment@align.270 | 0.064 | -0.57 | A09\@alignment@align | 0.20±0.05 | ||
| Nd II | 4177\@alignment@align.320 | 0.064 | -0.10 | A09\@alignment@align | 0.12±0.05 | ||
| Nd II | 4178\@alignment@align.635 | 0.182 | -1.03 | A09\@alignment@align | 0.17±0.05 | ||
| Nd II | 4179\@alignment@align.580 | 0.182 | -0.64 | A09\@alignment@align | 0.13±0.10 | ||
| Nd II | 4232\@alignment@align.380 | 0.064 | -0.47 | A09\@alignment@align | 0.18±0.05 | ||
| Nd II | 4446\@alignment@align.390 | 0.204 | -0.35 | A09\@alignment@align | 0.15±0.05 | ||
| Nd II | 4462\@alignment@align.990 | 0.559 | 0.04 | A09\@alignment@align | 0.23±0.05 | ||
| Nd II | 4959\@alignment@align.120 | 0.064 | -0.80 | A09\@alignment@align | 0.25±0.05 | ||
| Nd II | 4989\@alignment@align.950 | 0.630 | -0.50 | A09\@alignment@align | 0.28±0.05 | ||
| Nd II | 5092\@alignment@align.790 | 0.380 | -0.61 | A09\@alignment@align | 0.19±0.05 | ||
| Nd II | 5130\@alignment@align.590 | 1.303 | 0.45 | A09\@alignment@align | 0.09±0.05 | ||
| Nd II | 5212\@alignment@align.350 | 0.204 | -0.96 | A09\@alignment@align | 0.23±0.10 | ||
| Nd II | 5249\@alignment@align.590 | 0.975 | 0.20 | A09\@alignment@align | 0.13±0.10 | ||
| Nd II | 5319\@alignment@align.820 | 0.550 | -0.14 | A09\@alignment@align | 0.23±0.05 | ||
| Sm II | 3896\@alignment@align.970 | 0.040 | -0.67 | A09\@alignment@align | -0.25±0.05 | ||
| Sm II | 4188\@alignment@align.128 | 0.543 | -0.44 | A09\@alignment@align | -0.05±0.05 | ||
| Sm II | 4318\@alignment@align.926 | 0.277 | -0.25 | A09\@alignment@align | -0.13±0.05 | ||
| Sm II | 4421\@alignment@align.126 | 0.378 | -0.49 | A09\@alignment@align | -0.03±0.05 | ||
| Sm II | 4424\@alignment@align.337 | 0.484 | 0.14 | A09\@alignment@align | -0.13±0.05 | ||
| Eu II | 3724\@alignment@align.931aaLine has hyperfine structure and/or isotopic splitting. | 0.000 | -0.09 | 0\@alignment@align.42 | -0.47±0.05 | ||
| Eu II | 3907\@alignment@align.107aaLine has hyperfine structure and/or isotopic splitting. | 0.207 | 0.17 | 0\@alignment@align.42 | -0.52±0.05 | ||
| Eu II | 4129\@alignment@align.725aaLine has hyperfine structure and/or isotopic splitting. | 0.000 | 0.22 | 0\@alignment@align.40 | -0.42±0.05 | ||
| Eu II | 4435\@alignment@align.578aaLine has hyperfine structure and/or isotopic splitting. | 0.207 | -0.11 | 0\@alignment@align.40 | -0.37±0.05 | ||
| Eu II | 6645\@alignment@align.064aaLine has hyperfine structure and/or isotopic splitting. | 1.379 | 0.12 | 0\@alignment@align.52 | -0.27±0.05 | ||
| Gd II | 3549\@alignment@align.359 | 0.240 | 0.29 | 0\@alignment@align.97 | -0.32±0.10 | ||
| Gd II | 3697\@alignment@align.733 | 0.032 | -0.34 | 0\@alignment@align.87 | -0.02±0.10 | ||
| Gd II | 3768\@alignment@align.396 | 0.078 | 0.21 | A09\@alignment@align | -0.03±0.10 | ||
| Gd II | 3796\@alignment@align.384 | 0.032 | 0.02 | A09\@alignment@align | 0.03±0.10 | ||
| Gd II | 3844\@alignment@align.578 | 0.144 | -0.46 | A09\@alignment@align | 0.23±0.10 | ||
| Gd II | 4191\@alignment@align.075 | 0.427 | -0.48 | A09\@alignment@align | 0.13±0.05 | ||
| Gd II | 4215\@alignment@align.022 | 0.427 | -0.44 | A09\@alignment@align | 0.13±0.05 | ||
| Gd II | 4251\@alignment@align.731 | 0.382 | -0.22 | A09\@alignment@align | 0.05±0.05 | ||
| Tb II | 3702\@alignment@align.850aaLine has hyperfine structure and/or isotopic splitting. | 0.126 | 0.44 | A09\@alignment@align | -0.74±0.05 | ||
| Tb II | 3747\@alignment@align.380aaLine has hyperfine structure and/or isotopic splitting. | 0.401 | 0.04 | A09\@alignment@align | -0.64±0.10 | ||
| Tb II | 3848\@alignment@align.730aaLine has hyperfine structure and/or isotopic splitting. | 0.000 | 0.28 | A09\@alignment@align | -0.67±0.05 | ||
| Tb II | 3874\@alignment@align.168aaLine has hyperfine structure and/or isotopic splitting. | 0.000 | 0.27 | A09\@alignment@align | -0.77±0.05 | ||
| Tb II | 4002\@alignment@align.566aaLine has hyperfine structure and/or isotopic splitting. | 0.641 | 0.10 | A09\@alignment@align | -0.74±0.05 | ||
| Dy II | 3757\@alignment@align.368 | 0.100 | -0.17 | A09\@alignment@align | 0.01±0.10 | ||
| Dy II | 3944\@alignment@align.680 | 0.000 | 0.11 | A09\@alignment@align | 0.21±0.10 | ||
| Dy II | 3996\@alignment@align.689 | 0.590 | -0.26 | A09\@alignment@align | 0.26±0.05 | ||
| Dy II | 4050\@alignment@align.565 | 0.590 | -0.47 | A09\@alignment@align | 0.36±0.05 | ||
| Dy II | 4073\@alignment@align.120 | 0.540 | -0.32 | A09\@alignment@align | 0.38±0.05 | ||
| Dy II | 4077\@alignment@align.966 | 0.100 | -0.04 | A09\@alignment@align | 0.51±0.05 | ||
| Dy II | 4103\@alignment@align.306 | 0.100 | -0.38 | A09\@alignment@align | 0.46±0.05 | ||
| Ho II | 3796\@alignment@align.730aaLine has hyperfine structure and/or isotopic splitting. | 0.000 | 0.16 | A09\@alignment@align | -0.44±0.05 | ||
| Ho II | 3810\@alignment@align.738aaLine has hyperfine structure and/or isotopic splitting. | 0.000 | 0.19 | A09\@alignment@align | -0.56±0.10 | ||
| Ho II | 3890\@alignment@align.738aaLine has hyperfine structure and/or isotopic splitting. | 0.079 | 0.46 | A09\@alignment@align | -0.61±0.10 | ||
| Er II | 3692\@alignment@align.649 | 0.055 | 0.28 | A09\@alignment@align | -0.12±0.10 | ||
| Er II | 3729\@alignment@align.524 | 0.000 | -0.59 | A09\@alignment@align | -0.02±0.10 | ||
| Er II | 3786\@alignment@align.836 | 0.000 | -0.52 | A09\@alignment@align | -0.07±0.10 | ||
| Er II | 3830\@alignment@align.481 | 0.000 | -0.22 | A09\@alignment@align | -0.17±0.10 | ||
| Er II | 3896\@alignment@align.233 | 0.055 | -0.12 | A09\@alignment@align | -0.07±0.10 | ||
| Er II | 3906\@alignment@align.311 | 0.000 | 0.12 | A09\@alignment@align | -0.17±0.10 | ||
| Er II | 3938\@alignment@align.626 | 0.000 | -0.52 | A09\@alignment@align | -0.27±0.10 | ||
| Tm II | 3700\@alignment@align.255 | 0.029 | -0.38 | A09\@alignment@align | -0.74±0.10 | ||
| Tm II | 3701\@alignment@align.362 | 0.000 | -0.54 | A09\@alignment@align | -0.89±0.10 | ||
| Tm II | 3795\@alignment@align.759 | 0.029 | -0.23 | A09\@alignment@align | -1.04±0.10 | ||
| Tm II | 3848\@alignment@align.019 | 0.000 | -0.14 | A09\@alignment@align | -0.67±0.10 | ||
| Tm II | 3996\@alignment@align.510 | 0.000 | -1.20 | A09\@alignment@align | -0.79±0.10 | ||
| Yb II | 3694\@alignment@align.190aaLine has hyperfine structure and/or isotopic splitting. | 0.000 | -0.30 | 0\@alignment@align.54 | 0.08±0.10 | ||
| Lu II | 3507\@alignment@align.380aaLine has hyperfine structure and/or isotopic splitting. | 0.000 | -1.16 | 0\@alignment@align.10 | -0.99±0.10 | ||
| Hf II | 3719\@alignment@align.276 | 0.608 | -0.81 | A09\@alignment@align | -0.34±0.10 | ||
| Hf II | 3918\@alignment@align.090 | 0.452 | -1.14 | A09\@alignment@align | -0.34±0.10 | ||
| Hf II | 4093\@alignment@align.150 | 0.452 | -1.15 | A09\@alignment@align | -0.39±0.05 | ||
| Os I | 4135\@alignment@align.775 | 0.515 | -1.26 | A09\@alignment@align | 0.56±0.05 | ||
| Os I | 4260\@alignment@align.848 | 0.000 | -1.44 | A09\@alignment@align | 0.31±0.05 | ||
| Os I | 4420\@alignment@align.520 | 0.000 | -1.53 | A09\@alignment@align | 0.38±0.05 | ||
| Ir I | 3800\@alignment@align.120 | 0.000 | -1.43 | A09\@alignment@align | 0.69±0.10 | ||
| Pb I | 4057\@alignment@align.807aaLine has hyperfine structure and/or isotopic splitting. | 1.319 | -0.17 | A09\@alignment@align | ¡0.36 | ||
| Th II | 4019\@alignment@align.129 | 0.000 | -0.23 | A09\@alignment@align | -1.07±0.05 | ||
| Th II | 4086\@alignment@align.521 | 0.000 | -0.93 | A09\@alignment@align | -0.87±0.05 | ||
| U II | 3859\@alignment@align.571 | 0.036 | -0.10 | A09\@alignment@align | ¡-1.23 | ||
| ElementaaIn order of atomic number. | bbThe large uncertainty is due to the uncertain Gaia DR1 parallax. | ccThis is the “natal” [C/Fe], calculated with the evolutionary corrections of Placco et al. (2014). The measured [C/Fe] is -0.10. | ddThis is an average of [Mg/Fe], [Si/Fe], and [Ca/Fe] from Paper I | [X/Fe I] | ccThe total error refers to the combination of random and systematic errors (where the latter are due to uncertainties in the atmospheric parameters), calculated according to Equations A1, A4, and A5 in McWilliam et al. (2013). Errors in and [X/Fe] are listed separately. | ddThe LTE error refers to the offset that results when LTE atmospheric parameters are used (see Paper I). Errors in and [X/Fe] are listed separately. These offsets are not included in . | ||||||
|---|---|---|---|---|---|---|---|---|---|---|---|---|
| Sr II | 1 | 1\@alignment@align.20 | 0.10 | 0.12 | -0.08 | \@alignment@align | 0.44 | 0.20 | 0\@alignment@align.07 | |||
| Y II | 4 | 0\@alignment@align.27 | 0.05 | 0.14 | -0.11 | \@alignment@align | 0.17 | 0.13 | 0\@alignment@align.04 | |||
| Zr II | 3 | 0\@alignment@align.89 | 0.07 | 0.14 | -0.09 | \@alignment@align | 0.47 | 0.13 | 0\@alignment@align.06 | |||
| Ru I | 5 | 0\@alignment@align.57 | 0.05 | 0.28 | 0.10 | \@alignment@align | 0.89 | 0.07 | 0\@alignment@align.09 | |||
| Rh I | 2 | -0\@alignment@align.01 | 0.06 | 0.28 | 0.10 | \@alignment@align | 1.15 | 0.08 | 0\@alignment@align.09 | |||
| Pd I | 1 | 0\@alignment@align.28 | 0.10 | 0.36 | 0.07 | \@alignment@align | 0.78 | 0.15 | 0\@alignment@align.06 | |||
| Ag I | 1 | -0\@alignment@align.25 | 0.10 | 0.30 | 0.09 | \@alignment@align | 0.88 | 0.11 | 0\@alignment@align.08 | |||
| Ba II | 2 | 0\@alignment@align.69 | 0.07 | 0.20 | -0.16 | \@alignment@align | 0.62 | 0.08 | -0\@alignment@align.01 | |||
| La II | 6 | -0\@alignment@align.24 | 0.05 | 0.14 | -0.11 | \@alignment@align | 0.77 | 0.12 | 0\@alignment@align.04 | |||
| Ce II | 17 | 0\@alignment@align.08 | 0.05 | 0.13 | -0.07 | \@alignment@align | 0.61 | 0.13 | 0\@alignment@align.08 | |||
| Pr II | 5 | -0\@alignment@align.47 | 0.05 | 0.13 | -0.07 | \@alignment@align | 0.92 | 0.13 | 0\@alignment@align.08 | |||
| Nd II | 20 | 0\@alignment@align.17 | 0.05 | 0.13 | -0.08 | \@alignment@align | 0.86 | 0.12 | 0\@alignment@align.07 | |||
| Sm II | 5 | -0\@alignment@align.12 | 0.05 | 0.13 | -0.08 | \@alignment@align | 1.03 | 0.12 | 0\@alignment@align.07 | |||
| Eu II | 5 | -0\@alignment@align.32 | 0.05 | 0.15 | -0.16 | \@alignment@align | 1.27 | 0.11 | -0\@alignment@align.01 | |||
| Gd II | 8 | 0\@alignment@align.06 | 0.05 | 0.14 | -0.10 | \@alignment@align | 1.10 | 0.12 | 0\@alignment@align.05 | |||
| Tb II | 5 | -0\@alignment@align.71 | 0.05 | 0.13 | -0.09 | \@alignment@align | 1.10 | 0.12 | 0\@alignment@align.06 | |||
| Dy II | 7 | 0\@alignment@align.31 | 0.05 | 0.20 | -0.15 | \@alignment@align | 1.32 | 0.07 | 0\@alignment@align.0 | |||
| Ho II | 3 | -0\@alignment@align.54 | 0.05 | 0.21 | -0.15 | \@alignment@align | 1.09 | 0.07 | 0\@alignment@align.0 | |||
| Er II | 7 | -0\@alignment@align.13 | 0.05 | 0.20 | -0.14 | \@alignment@align | 1.06 | 0.07 | 0\@alignment@align.01 | |||
| Tm II | 5 | -0\@alignment@align.83 | 0.05 | 0.18 | -0.08 | \@alignment@align | 1.18 | 0.08 | 0\@alignment@align.07 | |||
| Yb II | 1 | 0\@alignment@align.25 | 0.10 | 0.24 | -0.24 | \@alignment@align | 1.52 | 0.11 | -0\@alignment@align.09 | |||
| Lu II | 1 | -0\@alignment@align.99 | 0.10 | 0.20 | -0.06 | \@alignment@align | 0.92 | 0.12 | 0\@alignment@align.09 | |||
| Hf II | 3 | -0\@alignment@align.36 | 0.05 | 0.13 | -0.06 | \@alignment@align | 0.90 | 0.13 | 0\@alignment@align.09 | |||
| Os I | 3 | 0\@alignment@align.42 | 0.05 | 0.28 | 0.09 | \@alignment@align | 1.13 | 0.07 | 0\@alignment@align.08 | |||
| Ir I | 1 | 0\@alignment@align.44 | 0.10 | 0.25 | 0.02 | \@alignment@align | 1.17 | 0.10 | 0\@alignment@align.01 | |||
| Pb I | 1 | ¡0\@alignment@align.36 | ¡0.72 | \@alignment@align | ||||||||
| Th II | 2 | -0\@alignment@align.97 | 0.07 | 0.14 | -0.05 | \@alignment@align | 1.12 | 0.14 | 0\@alignment@align.10 | |||
| U II | 1 | ¡-1\@alignment@align.23 | ¡1.42 | \@alignment@align | ||||||||
3.1 Barium and Europium
Barium and europium are the elements used for classification of -I and -II stars. The Ba lines are quite strong in this fairly metal-rich star; only the 5853 and 6141 Å lines were used. Multiple Eu II lines were detected, including the weak line at 6645 Å . The derived subsolar value of [Ba/Eu] () suggests that the star has minimal contamination from the s-process despite its moderate [Fe/H], while its high [Eu/Fe] () makes it an -II star.
J1538-1804 is on the metal-rich end of known -II stars. There are only four -II stars in JINAbase that have , and only one has a detailed -process pattern that covers from Sr to U and provides an age determination. Two of these four stars are associated with dwarf galaxies (Reticulum II and Ursa Minor; Ji et al. 2016; Aoki et al. 2007), while the other two are associated with the Milky Way bulge (Howes et al., 2016). J1538-1804 is therefore the most metal-rich -II star known in the Milky Way halo.
3.2 Lighter -Process Elements
The lighter -process elements Sr, Y, and Zr were derived with 1, 4, and 6 lines, respectively (see Figure 1 for the fit to the Sr line). These elements are commonly derived in many abundance analyses. Abundances of Ru and Rh were determined from 5 and 2 lines, while Pd and Ag were derived from single lines in the noisier blue end of the spectrum. Sr, Y, and Zr are in agreement with the Solar pattern and the other -I and -II stars. Ru and Ag are slightly low in J1538-1804 compared to the Sun; CS 31082-001 also has similarly low Ag relative to the Sun.
These lighter -process elements are thought to form in the main -process and in a “weak” or “limited” -process (Frebel in prep.) that could occur in traditional core-collapse supernovae (e.g., Arcones & Thielemann 2013). The lighter -process pattern may therefore vary between stars depending on age, environment, etc. Both Siqueira Mello et al. (2014) and Placco et al. (2017) have noted first-peak variations in -I and -II stars. J1538-1804’s abundance pattern is robust with respect to the Sun, suggesting that the relative contribution from the “limited” and main -processes are similar.
3.3 The Lanthanides and Hafnium
There are many detectable, relatively unblended lines from rare earth elements (La through Lu) and Hf. There is only a single, strong line available for Yb, which requires hyperfine and isotopic structure. The pattern of these elements agrees well with the Sun and with the other -I and -II stars. This robust pattern amongst the rare earth elements is a feature that is seen in all -process-enhanced stars (e.g., Sneden et al. 2008), and is therefore an essential requirement for models of -process nucleosynthesis.
3.4 Third-Peak Elements
Os and Ir are the only third-peak elements available in this spectrum. Os has three lines, though Ir only has one. Despite the paucity of lines, both elements agree very well with the other patterns in Figure 2 (and with other -II stars; e.g., Placco et al. 2017).
The relative strength of the second and third -process peaks is also important for constraining the physical conditions of the -process (see Section 4.1). In J1538-1804, in the other -I and -II stars, and in the Sun, the pattern between the second and third peaks appears to be consistent across dex in metallicity.
3.5 Lead
Only an upper limit of can be derived from the line at 4057.8 Å. Pb is a significant product of the -process. This upper limit therefore supports the assertion from the [Ba/Eu] that any contamination from the -process in this star is minimal. This agrees with Roederer et al. (2010), who find minimal -process contributions to MW stars with metallicities as high as .
3.6 The Actinides
Th and U are highly desirable elements for -process studies for two reasons: 1) A handful of -II stars exhibit an enhancement in the actinides (e.g., Schatz et al. 2002) and 2) U and Th are radioactive, and relative abundance ratios with respect to stable elements like Eu are therefore useful for age-dating (see Section 4.2).
There are two clean Th II lines in this star, enabling a high-precision Th measurement (see Figure 1). The strongest Th II line at 4019 Å is often blended, but this problem is reduced at low metallicities. The U II line at 3859 Å is severely blended with an Fe I in J1538-1804, providing only an upper limit. Based on its Th and U abundances, J153830.9-180424 does not appear to be an actinide boost star.
4 Discussion
4.1 The -Process Pattern
Despite its high metallicity relative to other -II stars, J1538-1804 is a typical -II star. Its -process abundance pattern matches that of the Sun and the -II star CS 31082-001 (except that J1538-1804 does not exhibit an actinide boost like CS 31082-001). Its Pb abundance and [Ba/Eu] ratio suggest that the -process has not contributed to its abundance pattern. It does not exhibit the light -process variations that have been observed in other -I and -II stars (e.g., Honda et al. 2006), and therefore does not require excessive contributions from the “limited” (or “weak”) -process (see Frebel et al., in prep.).
Patterns such as these are essential for identifying the site(s) of the -process. The abundance patterns from models are highly sensitive to uncertainties in nuclear masses, -decay rates, fission cycling, neutrino properties, etc. (e.g., Surman et al. 2017), as well as the physical conditions of the environment, such as temperature, the electron fraction, and the density (Hoffman et al., 1997). The pattern in J1538-1804 sets strong requirements for -process models.
4.2 Age
The Th abundance and the upper limit on U indicate that J153830.9-180424 is an old star. The relative abundances between Th and all the second- and third- peak elements in Table 3 give a mean age of Gyr when the Schatz et al. (2002) initial production ratios (from waiting-point calculations) are adopted, and Gyr when the Hill et al. (2017) values (from a high-entropy wind model) are adopted (see Table 7 in Placco et al. 2017). The quoted uncertainties represent the standard deviations from different chronometer pairs. The upper limit in the U abundance yields a lower limit from U/Eu of Gyr, depending on the production ratio. The dominant sources of uncertainty in these ages are the choices of production ratios and chronometer pairs; while U/Th would be a better ratio, the upper limit on U is not very constraining in this case. These ratios strongly suggest that the -process material in J1538-1804 is indeed ancient.
4.3 J1538-1804 and the Site of the -Process
Given that J1538-1804 is a typical -II star, what is gained from these observations? First, this adds another -II star to the known sample of , an important step for statistically analyzing the -process patterns as a function of stellar properties (metallicity, age, location in the Galaxy, etc.). Secondly, this letter has demonstrated that the main -process pattern at is very similar to the pattern at and , a powerful result when combined with the old age of the -process material. This either implicates a single site for the -process, or requires that -process nucleosynthesis in different sites leads to the same final abundance pattern.
The very metal-poor -I and -II stars without -process contamination also provide constraints on the birth environments of these stars, such as star formation rates, timescales relative to the onset of type Ia supernovae, etc. The recent discovery of -process-enhanced stars in ultra-faint dwarfs (e.g., Ji et al. 2016) has led to speculation that all -process-enhanced stars may originate in dwarf galaxies. Indeed, J1538-1804’s retrograde orbit in the MW halo does hint at a possible extragalactic origin. The chemical enrichment of lower mass systems proceeds more slowly than in more massive galaxies; in particular, dwarf galaxies cannot form as many metal-rich stars, and the onset of the -process occurs at a lower [Fe/H] than in the Milky Way (e.g., Tolstoy et al. 2009). As more -I and -II stars are discovered, particularly at higher metallicities, the general properties of the -process-enhanced stellar population will place limits on the nature of the birth environments of these stars.
In the near future, the R-Process Alliance will provide data for many more -process-enhanced stars. This will enable -I and -II stars to be studied as stellar populations, and will provide -process patterns that can be used to tease out any variations as a function of stellar properties such as metallicity, location, and more.
References
- Abbott et al. (2017) Abbott, B.P., Abbott, R., Abbott, T.D., et al. 2017, PhRvL, 119, 1101
- Abohalima et al. (2017) Abohalima, A. & Frebel, F. 2017, arXiv:1711.04410
- Amarsi et al. (2016) Amarsi, A.M., Lind, K., Asplund, M., Barklem, P.S., & Collet, R. 2016, MNRAS, 463, 1518
- Aoki et al. (2007) Aoki, W., Honda, S., Sadakane, K., & Arimoto, N. 2007, PASJ, 59, 15
- Arcones & Thielemann (2013) Arcones, A., & Thielemann, F.-K. 2013, Journal of Physics G: Nuclear and Particle Physics, 40, 3201
- Arlandini et al. (1999) Arlandini, C., Käppeler, F., Wisshak, K., Gallino, R., Lugaro, M., Busso, M., Straniero, O. 1999, ApJ, 525, 886
- Asplund et al. (2009) Asplund, M., Grevesse, N., Sauval, J.A., & Scott, P. 2009, ARA&A, 47, 481
- Barklem et al. (2005) Barklem, P.S., Christlieb, N., Beers, T.C., et al. 2005, A&A, 439, 129
- Beniamini et al. (2016) Beniamini, P., Hotokezaka, K., & Piran, T. 2016, ApJ, 832, 149
- Bernstein et al. (2003) Bernstein, R., Shectman, S. A., Gunnels, S. M., Mochnacki, S., & Athey, A. E. 2003, in Society of Photo-Optical Instrumentation Engineers (SPIE) Conference Series, Vol. 4841, Society of Photo-Optical Instrumentation Engineers (SPIE) Conference Series, ed. M. Iye & A. F. M. Moorwood, 1694
- Brown et al. (2016) Brown, A.G.A., Vallenari, A., Prusti, T., et al. 2016, A&A, 595, A2
- Cayrel et al. (2001) Cayrel, R., Hill, V., Beers, T.C., et al. 2001, Nature, 409, 691
- Chornock et al. (2017) Chornock, R., Berger, E., Kasen, D., et al. 2017, ApJ, 848, L19
- Christlieb et al. (2004) Christlieb, N., Beers, T.C., Barklem, P.S., et al. 2004, A&A, 428, 1027
- Côté et al. (2017) Côté, B., Fryer, C.L., Belczynski, K., et al. 2017, arXiv:1710.05875
- Cowan et al. (2005) Cowan, J.J., Sneden, C., Beers, T.C., et al. 2005, ApJ, 627, 238
- Frebel et al. (2015) Frebel, A., Chiti, A., Ji, A.P., Jacobson, H.R., & Placco, V.M. 2015, ApJ, 810, L27
- Hill et al. (2002) Hill, V., Plez, B., Cayrel, R., et al. 2002, A&A, 387, 560
- Hill et al. (2017) Hill, V., Christlieb, N., & Beers, T. C., et al. 2017, A&A, 607, 91
- Hoffman et al. (1997) Hoffman, R.D., Woosley, S.E., & Qian, Y.-Z. 1997, ApJ, 482, 957
- Honda et al. (2006) Honda, S., Aoki, W., Ishimaru, Y., Wanajo, S., & Ryan, S.G. 2006, ApJ, 643, 1180
- Howes et al. (2016) Howes, L.M., Asplund, M., Keller, S.C., et al. 2016, MNRAS, 460, 884
- Ji et al. (2016) Ji, A.P., Frebel, A., Simon, J.D., & Chiti, A. 2016, ApJ, 830, 93
- Lattimer & Schramm (1974) Lattimer, J. & Schramm, D. 1974, ApJ, 192, L145
- Lippuner et al. (2017) Lippuner, J., Fernández, R., Roberts, L.F., Foucart, F., Kasen, D., Metzger, B.D., & Ott, C.D. 2017, MNRAS, 472, 904
- Macias & Ramirez-Ruiz (2016) Macias, P. & Ramirez-Ruiz, E. 2016, arXiv:1609.04826
- Matijevic̆ et al. (2017) Matijevic̆, G., Chiappini, C., Grebel, E.K., et al. 2017, A&A, 603, 19
- McWilliam et al. (2013) McWilliam, A., Wallerstein, G., & Mottini, M. 2013, ApJ, 778, 149
- Placco et al. (2014) Placco, V.M., Frebel, A., Beers, T.C., & Stancliffe, R.J. 2017, ApJ, 797, 21
- Placco et al. (2017) Placco, V.M., Holmbeck, E.M., Frebel, A., et al. 2017, ApJ, 844, 18
- Roederer (2013) Roederer, I.U. 2013, AJ, 145, 26
- Roederer et al. (2010) Roederer, I.U., Cowan, J.J., Karakas, A.I., et al. 2010, ApJ, 724, 975
- Roederer et al. (2014a) Roederer, I.U., Cowan, J.J., Preston, G.W., et al. 2014a, MNRAS, 445, 2970
- Roederer et al. (2014b) Roederer, I.U., Preston, G.W., Thompson, I.B., et al. 2014b, AJ, 147, 136
- Rosswog et al. (2014) Rosswog, S., Korobkin, O., Arcones, A., Thielemann, F.-K., Piran, T. 2014, MNRAS, 439, 744
- Schatz et al. (2002) Schatz, H., Toenjes, R., Pfeiffer, B., Beers, T.C., Cowan, J.J., Hill, V., & Kratz, K.-L. 2002, ApJ, 579, 626
- Siqueira Mello et al. (2013) Siqueira Mello, C., Spite, M., Barbuy, B. 2013, A&A, 550, 122
- Siqueira Mello et al. (2014) Siqueira Mello, C., Hill, V., Barbuy, B., et al. 2014, A&A, 565, 93
- Sneden (1973) Sneden, C. 1973, ApJ, 184, 839
- Sneden et al. (1994) Sneden, C., Preston, G.W., McWilliam, A., & Searle, L. 1994, ApJ, 431, 27
- Sneden et al. (1996) Sneden, C., McWilliam, A., Preston, G.W., Cowan, J.J., Burris, D.L., & Armosky, B.J. 1996, ApJ, 467, 819
- Sneden et al. (2008) Sneden, C., Cowan, J.J., & Gallino, R. 2008, ARA&A, 46, 241
- Sneden et al. (2009) Sneden, C., Lawler, J.E., Cowan, J.J., Ivans, I.I., & Den Hartog, E.A. 2009, ApJS, 182, 80
- Sobeck et al. (2011) Sobeck, J. S., Kraft, R. P., Sneden, C., et al. 2011, AJ, 141, 175
- Steinmetz et al. (2006) Steinmetz, M., Zwitter, T., Siebert, A., et al. 2006, AJ, 132, 1645
- Surman et al. (2017) Surman, R., Mumpower, M., & McLaughlin, G. 2017, Proc. of the 14th International Symposium on Nuclei in the Cosmos, ed. Kubono, S., Kajino, T., Nishimura, S., Isobe, T., Nagataki, S. Shima, T., & Takeda, Y.
- Tolstoy et al. (2009) Tolstoy, E., Hill, V., & Tosi, M. 2009, ARA&A, 47, 371
- Tsujimoto & Nishimura (2015) Tsujimoto, T. & Nishimura, N. 2015, ApJ, 811, L10
- Winteler et al. (2012) Winteler, C., Käppeli, R., Perego, A., Arcones, A., Vasset, N., Nishimura, N., Liebendörfer, M., & Thielemann, F.-K. 2012, ApJ, 750, L22
- Xu et al. (2007) Xu, H.L., Svanberg, S., Quinet, P., Palmeri, P., & Biémont, É. 2007, JQSRT, 104, 52