Deuterium and 15N fractionation in N2H+ during the formation of a Sun-like star ††thanks: Based on observations carried out with the IRAM 30m Telescope. IRAM is supported by INSU/CNRS (France), MPG (Germany) and IGN (Spain).
Abstract
Although chemical models predict that the deuterium fractionation in N2H+ is a good evolutionary tracer in the star formation process, the fractionation of nitrogen is still a poorly understood process. Recent models have questioned the similar evolutionary trend expected for the two fractionation mechanisms in N2H+, based on a classical scenario in which ion-neutral reactions occurring in cold gas should have caused an enhancement of the abundance of N2D+, 15NNH+ , and N15NH+. In the framework of the ASAI IRAM-30m large program, we have investigated the fractionation of deuterium and 15N in N2H+ in the best known representatives of the different evolutionary stages of the Sun-like star formation process. The goal is to ultimately confirm (or deny) the classical "ion-neutral reactions" scenario that predicts a similar trend for D and 15N fractionation. We do not find any evolutionary trend of the 14N/15N ratio from both the 15NNH+ and N15NH+ isotopologues. Therefore, our findings confirm that, during the formation of a Sun-like star, the core evolution is irrelevant in the fractionation of 15N. The independence of the 14N/15N ratio with time, found also in high-mass star-forming cores, indicates that the enrichment in 15N revealed in comets and protoplanetary disks is unlikely to happen at core scales. Nevertheless, we have firmly confirmed the evolutionary trend expected for the H/D ratio, with the N2H+/N2D+ ratio decreasing before the pre–stellar core phase, and increasing monotonically during the protostellar phase. We have also confirmed clearly that the two fractionation mechanisms are not related.
keywords:
Stars: formation – ISM: clouds – ISM: molecules – Radio lines: ISM1 Introduction
Observations and chemical models agree that the process of deuterium enrichment in N2H+ is a robust evolutionary indicator in the star formation process. The root ion-neutral reaction that forms N2D+ is (e.g. Millar et al. 1989, Ceccarelli et al. 2014):
| (1) |
followed by the reaction of with to give N2D+. Reaction (1) is exothermic by K, and hence it is fast only from left to right below K. At these low temperatures, and if CO is highly depleted, the abundance of is thus boosted, and so are the species directly formed from it, like N2D+. This implies that the N2D+/N2H+ ratio is expected to decrease from the pre–stellar to the proto-stellar phase, when the nascent protostar begins to heat up its surrounding material (e.g. Caselli 2002a). In fact, observations of pre-stellar cores and young protostars have shown D/H ratios in N2H+ of the order of (e.g. Bacmann et al. 2003, Crapsi et al. 2005, Emprechtinger et al. 2009), i.e. several orders of magnitude higher than the cosmic D/H elemental abundance (, e.g. Linsky et al. 2006), and a decrease with core evolution in both low- and high-mass star-forming cores (Emprechtinger et al. 2009, Ceccarelli et al. 2014, Fontani et al. 2011, Bianchi et al. 2017). This trend is followed by other molecules formed by , such as DNC (e.g. Fontani et al. 2014, Gerner et al. 2015) and (e.g. Emprechtinger et al. 2009, Gerner et al. 2015). Despite the gradual decrease with time expected after the protostar birth, the huge D enrichment in the early cold phase is able to explain the enhanced D/H ratio measured in comets (, e.g. Hartogh et al. 2011, Altwegg et al. 2015), with respect to the cosmic value (Cleeves et al. 2014). For this reason, the D/H ratio is believed to be an excellent chemical tool to link the different phases of the Solar system formation, from the earliest pre–stellar stage to the formation of the planets and other Solar system bodies (Ceccarelli et al. 2014).
Similarly to D, 15N is enriched in pristine Solar system bodies such as comets (14N/15N , Manfroid et al. 2009, Shinnaka et al. 2016) and carbonaceous condrites (, Bonal et al. 2009) by factors to with respect to the protosolar nebula value (, Marty et al. 2010). As for N2D+, the 15NNH+ and N15NH+ abundances were thought to be enhanced through ion-neutral reactions occuring in cold gas (Terzieva & Herbst 2000):
| (2) |
| (3) |
However, recent chemical models (Roueff et al. 2015) have questioned the efficiencies of these reactions, because of the presence of energy barriers higher than previously predicted, which make significant fractionation unlikely to occur even in the earliest cold phases of the protostellar evolution. The few observational findings obtained to date make the puzzle even more intriguing: the 14N/15N measurements in N2H+ in high-mass star-forming cores obtained by Fontani et al. (2015) do not show an evolutionary dependence, in agreement with Roueff et al. (2015) predictions, but the same observations indicate a huge dispersion of the values (14N/15N ) which cannot be reproduced by the models. The models also do not predict the high 14N/15N ratio found in the low-mass pre–stellar core L1544 (, Bizzocchi et al. 2013).
In this paper, we show the first evolutionary study of the combined 14N/15N and D/H ratio in N2H+ in the best representatives of the main evolutionary stages of the Sun-like star formation process. The primary goal of the study is to understand whether the two ratios are linked and, consequently, whether (also) the 14N/15N is an evolution-dependent parameter and can be considered a chemical link between the earliest and the most evolved stages during the formation of Sun-like stars.
2 Sample and observations
The targets are extracted from the Large Program ASAI111http://www.iram-institute.org/EN/content-page-344-7-158-240-344-0.html (Lefloch et al. in prep.) and represent the best known precursors of a Sun-like star, in the main phases of its formation: the pre–stellar core L1544, the Class 0 protostars IRAS 4A, the Class 0/Class I protostar L1527 and the Class I protostar SVS13-A. We have analysed also the Class 0 source IRAS 16293 using the data of the TIMASSS survey (Caux et al. 2011). Together with this "evolutionary" sample, we have studied other sources to provide additional relevant information about the chemical evolution in a Sun-like star-forming environment: the protocluster OMC–2 FIR4, the chemically rich protostellar shock L1157–B1, and the intermediate-mass Class 0 protostar CepE. In the following, we give a brief description of each target (for more details, please see López-Sepulcre et al. 2015):
-
•
L1544 is a starless core in the Taurus molecular cloud complex (d 140 pc, Cernicharo & Guélin 1987). It is considered the prototypical pre–stellar core on the verge of the gravitational collapse (Caselli et al. 2012, and references therein). L1544 is characterized by a nucleus with a high H2 density peak ( cm-3) and low temperature ( 7 K), surrounded by a lower density envelope undergoing extended infall (Caselli et al. 2012). For these reasons, in the central region, CO is depleted by a factor (Caselli et al. 1999) and the deuterium fractionation is high, like in the interiors of dark clouds, although differentiated chemical processes can take place in the external layers (Caselli et al. 1999, Vastel et al. 2014).
-
•
IRAS 16293 is a well known Class 0 protostar located in the small L1689N molecular cloud in the Ophiuchus complex at a distance of 120 pc (Loinard et al. 2008). It is a system with two main components, IRAS16293 A and IRAS16293 B, separated by 5′′, characterized by a strong chemical differentiation (Bisschop et al. 2008; Jørgensen et al. 2011, 2012). It is the first source where a hot corino has been discovered, (Ceccarelli et al. 2000; Cazaux et al. 2003; Bottinelli et al. 2004), and a well-studied astrochemical laboratory thanks to its richness in complex organic molecules, and its high deuterium fractionation for example in formaldehyde (Ceccarelli et al. 1998, 2001), methanol (Parise et al. 2004), methyl formate (Demyk et al. 2010), and water (Coutens et al. 2012).
-
•
IRAS 4A is the second hot corino ever discovered (Bottinelli et al. 2007), and is a binary source in the Perseus molecular complex (d 235 pc, Hirota et al. 2007, Hirota et al. 2011); it is composed of two Class 0 objects separated by 18: IRAS4 A1 and IRAS4 A2 (e.g. Looney et al. 2000). The nature of IRAS4 A1 and IRAS4 A2 has been discussed in several papers (e.g. Persson et al. 2012, Taquet et al. 2015, Santangelo et al. 2015, De Simone et al. 2017, López-Sepulcre et al. 2017). In particular, Santangelo et al. (2015) have concluded that A1 is brigther than A2 in the millimeter continuum, but only A2 is associated with a hot-corino.
-
•
L1527 is a dark cloud in the Taurus molecular complex (d 140 pc), with a heavily obscured IRAS source (IRAS 04368+2557) located at the core center, classified as a borderline Class 0/Class I object according to André et al. (2000). This source is considered as a prototypical warm-carbon-chain-chemistry source (WCCC, Sakai et al. 2008, 2010), and high-angular resolution observations indicate the presence of a compact, infalling, and rotating envelope (Sakai et al. 2016, 2017) surrounding the protostar.
-
•
SVS13-A is a part of the multiple system NGC1333-SVS13 (distance 235 pc, Hirota et al. 2007) in the Perseus complex, dominated by three millimetre sources identified by interferometric observations (Bachiller et al. 1998, Looney et al. 2000, Lefavre et al. 2017, Tobin et al. 2016, and references therein): SVS13-A, SVS13-B separated by 15′′and associated with two different evolutionary stages, and SVS13-C, 20′′away from SVS13-A. Although SVS13-A is still deeply embedded in a large scale envelope (Lefloch et al. 1998), it is considered a young Class I protostar because of its extended outflow ( pc) and its low ratio between submillimeter and bolometric luminosity (0.8%), becoming an almost unique laboratory to investigate how deuteration and fractionation change from the Class 0 to the Class I phases (Chen et al. 2009, Tobin et al. 2016, Bianchi et. al 2017, Lefloch et al in prep). In the analysis of SVS13-A, care needs to be taken in the fit of the lines because of the contamination of core IRAS 4A at velocity 7 km s-1 in the off position (Santangelo et al. 2015), while that of SVS13-A is at about 8–9 km s-1 which results in an artificial absorption near the emission lines of interest. This contamination has affected only the border of the blue side of the lines (see the figures in the on-line Appendix-A); in the case of the N2H+ (1–0) line we used the observation carried out in Position Switching mode, and not in Wobbler Switching mode, to avoid this contamination.
-
•
OMC–2 FIR4 is a protocluster of low- and intermediate-mass protostars at a distance of 420 pc (e.g. Hirota et al.2007). Its 30 M☉ envelope extends to about AU (Crimier et al. 2009) and contains several clumps, probably a cluster of protostars (Shimajiri et al. 2008, López-Sepulcre et al. 2013), which makes it one of the best and closest environment analogues of the one in which the Sun was born (e.g. Ceccarelli et al. 2014, Fontani et al. 2017). In fact, growing evidence indicates that our Sun was born in a crowded environment, forming together with many other protostars, including very likely more massive objects (e.g. Adams 2010, Taquet et al. 2016). The fractionation of nitrogen has been studied by Kahane et al. (submitted to ApJ) in several molecular species (HCN, HNC, HC3N, CN), who derived 14N/15N , regardless of the molecule used, and in remarkable agreement with the present-day local interstellar 14N/15N .
-
•
L1157–B1 is a chemically rich bipolar outflow (Bachiller et al. 1997, 2001) driven by a low-mass ( 4 L☉) Class 0 protostar (L1157-mm, at a distance of 250 pc, Looney et al. 2007), and associated with several blue and red-shifted shocks at different ages (Gueth et al. 1996, 1998). It may be regarded as the ideal laboratory for observing the effects of shocks on the gas chemistry (Bachiller et al. 2001, Lefloch et al. 2010, Codella et al. 2010) and on isotopic fractionation (Fontani et al. 2014, Busquet et al. 2017). The analysis of the N2H+ emission performed by Codella et al. (2013) showed that the N2H+ emission detected towards the L1157-B1 shock can be considered a fossil record of the pre-shock phase, when the gas density was 104 cm-3. In other words, N2H+ is sampling the chemical-physical conditions of the quiescient gas evolved for more than yr, before the gas was perturbed by the protostellar shock induced by the L1157 protostellar activity.
-
•
CepE is an intermediate-mass Class 0 protostar (L = 100 L☉, Lefloch et al. 1996) in the Cepheus OB3 association at a distance of 730 pc (Sargent 1977), which drives an exceptionally powerful and luminous molecular outflow. Both the protostar and the outflow have been intensively studied at mm and IR wavelengths (Lefloch et al. 1996, Moro-Martin et al. 2001, Noriega-Crespo et al. 2004).
The observations have been performed during several runs between 2011 and 2016 with the IRAM 30-m telescope near Pico Veleta (Spain) in the context of the Astrochemical Surveys at IRAM (ASAI) Large Program, using the broad-band EMIR receivers E090, E150 and E230. These were carried out in Wobbler Switching Mode, with a throw of 3′, in order to ensure a flat baseline across the spectral bandwidth observed. The instrumental setup was decided according to the sources: L1544 was observed in the band 72 to 115 GHz using the Fast Fourier Transform Spectrometer (FTS) in its 50 kHz resolution mode; about Protostars and Outflow Shocks, the 3mm (72 – 116 GHz) and 2mm (126 – 170 GHz) bands were observed at the same time. The 1.3mm (200 – 272 GHz) band was covered observing LSB and USB simultaneously, using the FTS in its 200 kHz resolution mode (Lefloch et al. in prep.). The data were reduced with the CLASS software of the GILDAS222http://www.iram.fr/IRAMFR/GILDAS package. Calibration uncertainties are 10% at 3mm and 20% at shorter wavelengths. All the spectra are displayed in antenna temperature units. The main spectroscopic parameters of the transitions observed, and the main observational parameters, are summarised in Table 1. The spectroscopic parameters have been taken from the Cologne Database for Molecular Spectroscopy333https://www.astro.uni-koeln.de/cdms.
The distances in our sample vary from 120 pc (for the closest object, IRAS 16293) to pc (for the farthest, OMC–2 FIR4). Therefore, the linear scales probed differ by a factor at all frequencies, although in reality the difference is less than a factor 2 for all objects but OMC–2 FIR4. However, most of our calculations are based on the (1–0) transition (see Sect. 3.2), whose angular beam size corresponds to a linear scale that ranges from a minimum of au for IRAS 16293, to a maximum of au for OMC–2 FIR4. According to the description of the sources presented above, these scales probe the lower-density envelope in all objects, including OMC–2 FIR4, which is a protocluster intrinsically larger than the other cores, and thus the isotopic fractions that we will derive in Sect. 3.2 are always associated with the envelope of the sources, and not with their inner nuclei.
| Transition | ||||||
|---|---|---|---|---|---|---|
| GHz | K | D2 | s-1 | ″ | ||
| (1–0) | 93.173 | 4.5 | 104 | 0.80 | ||
| (3–2) | 279.512 | 27 | 312 | 0.49 | ||
| (1–0) | 77.109 | 4 | 104 | 0.83 | ||
| (2–1) | 154.217 | 11 | 208 | 0.71 | ||
| (3–2) | 231.322 | 22 | 312 | 0.59 | ||
| (1–0) | 90.264 | 4 | 35 | 0.80 | ||
| (3–2) | 270.784 | 26 | 104 | 0.51 | ||
| (1–0) | 91.206 | 4 | 35 | 0.80 | ||
| (3–2) | 273.609 | 26 | 104 | 0.51 |
3 Results
3.1 Detected lines and fitting procedure
| Molecule | Transition | FWHM | rms | ||||
| K | km s-1 | km s-1 | - | (K km s-1) | (mK) | ||
| L1544 | |||||||
| N2H+ | 1–0 | 0.9(0.1) | 6.0(0.1) | 0.3(0.1) | 0.5(0.1) | 5.11(0.04) | 4 |
| N2D+ | 1–0 | 4.9(0.1) | 5.8(0.2) | 0.4(0.6) | 2.7(0.1) | 1.89(0.02) | 3 |
| 15NNH+ | 1–0 | 0.06(0.02) | 6.9(0.1) | 0.4(0.1) | 1.9(1.8) | 0.023(0.004) | 1 |
| N15NH+ | 1–0 | 0.10(0.04) | 6.2(0.1) | 0.3(0.1) | 3.7(2.9) | 0.03(0.01) | 2 |
| IRAS4 A | |||||||
| N2H+ | 1–0 | 0.3(0.1) | 5.9(0.1) | 1.2(0.1) | 0.1(0.01) | 9.10(0.03) | 6 |
| N2D+ | 1–0 | 1.0(0.1) | 7.2(0.1) | 1.2(0.1) | 0.1(0.01) | 1.58(0.02) | 3 |
| 2–1 | 2.2(0.01) | 7.0(0.1) | 1.2(0.1) | 1.2(0.1) | 2.31(0.04) | 6 | |
| 3–2 | 1.5(0.1) | 6.0(0.1) | 1.0(0.1) | 1.3(0.2) | 1.17(0.05) | 8 | |
| 15NNH+ | 1–0 | - | 7.3(0.1) | 1.33(0.2) | - | 0.017(0.002) | 1 |
| 3–2 | - | 6.8(0.1) | 0.8(0.3) | - | 0.02(0.02) | 7 | |
| N15NH+ | 1–0 | 0.03(0.01) | 6.2(0.6) | 1.3(2.1) | 0.4(0.1) | 0.043(0.001) | 0.3 |
| 3–2 | - | 6.6(0.1) | 0.3(0.1) | - | 0.009(0.002) | 9 | |
| L1527 | |||||||
| N2H+ | 1–0 | 0.2(0.1) | 5.6(0.1) | 1.2(0.1) | 0.1(0.01) | 3.47(0.02) | 4 |
| N2D+ a | 2–1 | - | - | 5.1b | - | 8.3 | |
| 15NNH+ a | 1–0 | - | - | 3.3b | - | 4 | |
| N15NH+ a | 1–0 | - | - | 4.5b | - | 4 | |
| IRAS 16293 | |||||||
| N2H+ | 1–0 | 0.3(0.1) | 3.0(0.1) | 1.7(0.1) | 0.1(0.01) | 11.78(0.07) | 16 |
| N2D+ | 2–1 | 2.7(0.1) | 4.0(0.1) | 1.0(0.1) | 2.0(0.2) | 2.17(0.01) | 3 |
| 3–2 | - | 4.5(0.2) | 2.8(0.4) | 0.7(0.1) | 0.72(0.02) | 10 | |
| 15NNH+ a | 1–0 | - | - | 5.6b | - | 6.4 | |
| N15NH+ | 3–2 | - | 5.6(0.2) | 2.8(0.5) | - | 0.13(0.02) | 5 |
| SVS13-A | |||||||
| N2H+ | 1–0 | 0.6(0.1) | 8.2(0.1) | 0.8(0.1) | 0.1(0.003) | 11.40(0.01) | 3 |
| N2D+ | 2–1 | 0.4(0.1) | 8.3(0.1) | 0.6(0.1) | 0.1(0.01) | 0.21(0.02) | 3 |
| 3–2 | - | 8.9(0.1) | 0.8(0.1) | - | 0.17(0.02) | 7 | |
| 15NNH+ a | 1–0 | - | - | 1.9b | - | 2.5 | |
| N15NH+ | 1–0 | - | 7.6(0.1) | 1.4(0.3) | - | 0.020(0.009)(c) | 1.5 |
| Molecule | Transition | T | Vpeak | FWHM | Area | rms | |
| K | km s-1 | km s-1 | - | (Kkm s-1) | (mK) | ||
| L1157–B1 | |||||||
| N2H+ | 1–0 | 0.004(0.001) | 1.4(0.1) | 3.0(0.1) | 0.1(0.01) | 0.28(0.01) | 2 |
| N2D+ | 1–0 | - | 3.3(0.2) | 1.8(0.5) | - | 0.025(0.014)(c) | 1 |
| 15NNH+ a | 1–0 | - | - | 7.5b | - | 1 | |
| N15NH+ a | 1–0 | - | - | 9.6b | - | 1 | |
| OMC–2 FIR4 | |||||||
| N2H+ | 1–0 | 1.4(0.1) | 10.2(0.1) | 1.3(0.1) | 0.1(0.01) | 39.40(0.02) | 6 |
| N2D+ | 2–1 | 0.8(0.1) | 11.0(0.1) | 1.3(0.1) | 0.3(0.6) | 1.24(0.08) | 14 |
| 3–2 | - | 10.7(0.02) | 0.9(0.03) | - | 0.80(0.08) | 21 | |
| 15NNH+ | 1–0 | 0.14(0.1) | 11.1(0.1) | 1.2(0.1) | 1.2(0.9) | 0.15(0.01) | 2 |
| N15NH+ | 1–0 | 0.14(0.1) | 10.3(0.1) | 1.3(0.1) | 0.8(0.8) | 0.19(0.01) | 1 |
| CepE | |||||||
| N2H+ | 1–0 | 0.2(0.1) | -13.6(0.1) | 1.2(0.1) | 0.1(0.01) | 4.17(0.02) | 4 |
| 3–2 | - | -11.7(0.1) | 4.5(0.1) | - | 4.20(0.02) | 4 | |
| N2D+ | 1–0 | 0.3(0.1) | -11.1(0.1) | 1.3(0.1) | 1.5(1.0) | 0.29(0.02) | 3 |
| 2–1 | 1.3(0.1) | -11.2(0.1) | 0.8(0.1) | 2.4(0.3) | 0.79(0.02) | 4 | |
| 3–2 | - | -12.1(0.3) | 4.6(0.7) | - | 0.28(0.08) | 3 | |
| 15NNH+ | 1–0 | - | -11.9(0.4) | 1.8(1.4) | - | 0.010(0.004) | 2 |
| N15NH+ | 1–0 | - | -13.2(0.6) | 4.3(1.2) | - | 0.070(0.001) | 0.3 |
(a)Transition undetected: the column density given in Table 4 is an upper limit;
(b)Assumed value for FWHM (see text);
(c)One or more hyperfine components are under the rms level; the
has been computed by summing the integrated intensity of the detected components and the
expected area of the undetected components (assuming LTE and optically thin conditions).
We have detected at least one transition of N2H+ and N2D+ in all the sources of our sample. In Tables 2 and 3 we list the lines observed and detected in each source. The N2H+ (1–0) line is detected in all targets, while N2D+ was observed and detected either in the (1–0) and/or in the (2–1) and (3–2) lines. Transitions of N15NH+ have also been detected in all sources, except L1157–B1 and L1527, while 15NNH+ lines were detected only towards L1544, IRAS 4A, Cep E, and OMC–2 FIR4. All the transitions are split into multiple hyperfine components due to the coupling of the 14N nuclear spin with the angular momentum of the molecule. Therefore, we have attempted to fit all lines taking the hyperfine structure into account. The method assumes that the components are Gaussians with the same line width separated in frequency according to the laboratory value, and have all the same excitation temperature. A detailed description of the method and of the output parameters is given in the CLASS manual444https://www.iram.fr/IRAMFR/GILDAS/doc/pdf/class.pdf. For the N2H+ and N2D+ lines, the method has given generally good results, while it was not appropriate for several 15NNH+ and N15NH+ lines, mainly because of the faintness of the secondary components. In particular, for two lines, N15NH+ (1–0) in SVS13-A and N2D+ (1–0) in L1157–B1, the main component was clearly detected, but one or more satellites were undetected. Therefore, we have fitted the main component with a single Gaussian, and then calculated the expected contribution of the undetected hyperfine components assuming LTE and optically thin conditions. The final integrated area for these lines is the sum of these contributions (see Tables 2 and 3). In Cols. 3–8 of Tables 2 and 3 we show the line parameters derived with the methods mentioned above. The Tables also give the rms level in the spectrum (Col. 9), used for non-detected lines to compute the upper limits on the column densities. Transitions not shown in the Tables were not observed. The spectra of all lines detected are shown in the on-line Appendix-A.
3.2 Derivation of the total column densities
From the line parameters, we have calculated the total column densities of N2H+, N2D+, 15NNH+ and N15NH+ . Because different sources have been detected in different lines, and, above all, not all targets have been observed in the same lines, to be consistent, we have derived from the (1–0) line for all species, when possible. This approach was suggested by the fact that the (1–0) line is detected in almost all species and targets, and because the isotopic ratio derived by dividing column densities obtained from the same transition are independent from the excitation temperature. The method has been used successfully for L1544, IRAS 4A, and L1157–B1. In the other targets, this method can not be applied because the (1–0) line was either not observed or not detected in all molecules. For example, in IRAS 16293, the (1–0) transition is detected in N2H+ and 15NNH+ but neither in N2D+ nor in N15NH+. For these two molecules, we have detected the (2–1) and (3–2) lines (see Table 2). In this case, the column densities were derived adopting the transition with the best signal-to-noise ratio in each molecule, assuming a wide (but reasonable) range of excitation temperatures of 5 – 30 K. For L1544, we have assumed a more realistic temperature range of 5 – 15 K.
The fit to the hyperfine structure gives an estimate of the optical depth of the main component, . For lines with , we have computed from the total line integrated area according to Eq. (A4) in Caselli et al. (2002b), valid for optically thin lines. The integrated areas have been computed from the spectra in antenna temperature units, and then converted to main beam brightness temperature units using the main beam efficiencies reported on the IRAM–30m website555http://www.iram.es/IRAMES/mainWiki/Iram30mEfficiencies. The optically thin approach is good for almost all the detections (see Tables 2 and 3). Some N2D+ lines have , but poorly constrained (), so that we have derived the column densities using the optically thin approach as well. For the few optically thick lines and with opacity well-constrained, the column density has been calculated by multiplying the value derived in optically thin approximation by the factor (where is the total opacity of the line). Finally, for the few 15NNH+ transitions in which the secondary components are not detected, we have used only the integrated intensity of the main one, assuming optically thin conditions, hence in these cases (see Tables 2 and 3) the derived has to be regarded as lower limits.
The column densities should be corrected for the filling factor to compare them in a consistent way, but in most cases we do not know the emission size of the transitions observed, therefore we do not have a direct estimate of the filling factor. However, as shown in Castets et al. (2001), in IRAS 16293 the source size in N2H+ (1–0) can be as extended as ′′, i.e. bigger than the beam size of all transitions observed. This is reasonably the extension of the emission also in the other sources, because it is well-known that the N2H+ (1–0) line traces the core envelope. For the (1–0) lines of the isotopologues, we have assumed the same emission size as for N2H+, and in the few cases in which only the (2–1) or (3–2) line was detected, we have assumed that the emission fills the telescope beam. The different transitions do not have the same critical density, which is cm-3 for the (1–0) line, and cm-3 for the (3–2) line (see Lique et al. 2015 for the collisional coefficients). Hence the angular size of the (3–2) line emitting region is likely smaller than that of the (1–0) line. However, because the telescope beam size of the (3–2) transition is also smaller (Table 1) than that of the (1–0) line, in the absence of high-angular resolution observations it is reasonable to assume that even the higher excitation transitions fill their (smaller) telescope beam sizes. Moreover, the isotopic ratio is derived comparing the (1–0) and (3–2) transitions only for IRAS 16293 and CepE (this latter does not even belong to the "evolutionary" sample). Hence, the two isotopic ratios obtained from different excitation transitions, although suffering from higher uncertainties, are not crucial for the trends and the overall conclusions of the work.
The total molecular column densities are given in Table 4, and the associated isotopic ratios are listed in Table 5. For each source, the estimates have been made assuming a reasonable range of excitation temperatures (5–30 K for all sources but L1544, for which a more realistic range 5 –15 K is used). We stress that the temperature assumed is irrelevant when the 14N/15N is derived from the (1–0) line of both isotopologues, but even when derived from different excitation transitions, the difference is within the uncertainties (typical uncertainty in between and , see Table 4). The N2H+ average column densities are of the order of cm-2, while (N2D+) range from up to cm-2, and both (15NNH+ ) and (N15NH+ ) are in the range cm-2.
Finally, for the sources undetected in N2D+, 15NNH+ and N15NH+, we have calculated the upper limits on the column density from the upper limit on the line integrated area. This was evaluated as the area of a single Gaussian having peak equal to the rms level of the spectrum. To compute the integrated area, however, one needs an estimate of the line width. This latter was evaluated as the width obtained from a Gaussian fit to the other, well-detected lines. In those cases in which the fit with a single Gaussian does not give reasonable results, we have computed the line width by applying to the line width obtained from the hyperfine structure a factor derived from the lines with good fit results with both methods.
4 Discussion
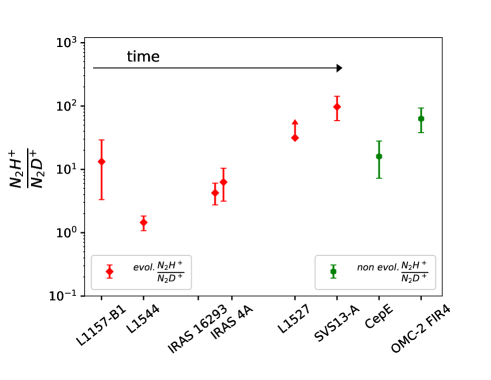
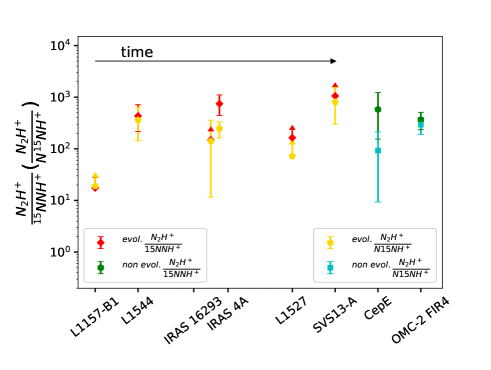
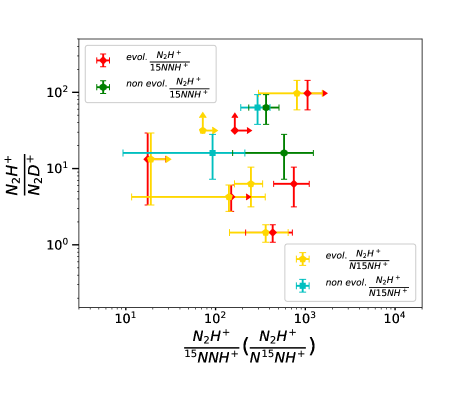
In Fig. 1 we show the trends of the three isotopic ratios. We indicate in different colours the low-mass sources with well established evolutionary stage, namely L1544, IRAS 4A, IRAS 16293, L1527, and SVS13-A, and the other objects. We have ordered the "evolutionary sample" with increasing time. Although L1157–B1 does not belong to the evolutionary sample of cores, as explained in Sect. 2 the measurement of the fractionation in this object reflects that of the diffuse gas of the cloud before the condensation into a dense pre–stellar core, hence we have placed it in the evolutionary sequence before L1544. The two hot-corinos IRAS 4A and IRAS 16293 are placed closer than the other objects because there is no evidence that can indicate a different age of these two objects. Moreover, in Fig. 2 we plot the N2H+/N2D+ versus N2H+/15NNH+ and N2H+/N15NH+ ratios, in order to highlight a possible correlation between the D and 15N fractionation.
The most direct results emerging from Figs. 1 and 2 are:
-
(1)
the N2H+/N2D+ decreases, as expected, from the diffuse cloud stage (represented by L1157–B1) to the pre–stellar core stage, represented by L1544, by a factor . Then, it increases monotonically in the more evolved stages, again by a factor in the Class 0 objects, and by a factor in the more evolved Class I object SVS13-A;
-
(2)
the 14N/15N is quite uniform across the sample, which indicates that time is globally irrelevant in the fractionation of nitrogen in N2H+. Moreover, in the four objects in which both 15NNH+ and N15NH+ are detected, namely L1544, IRAS 4A, CepE, and OMC–2 FIR4, the 14N/15N ratio is the same, within the uncertainties, when derived from the two isomers. The only exception is IRAS 4A, in which they are different by a factor 2 (see Table 5 and Fig. 1). This indicates that the two isotopologues tend to follow the same chemical pathway, although the peculiar case of IRAS 4A deserves to be investigated further, possibly with the help of higher sensitivity and higher spectral resolution observations. Moreover, one can note that the 14N/15N ratio derived from 15NNH+ is systematically higher than that computed from N15NH+ which suggests that the N15NH+ is more abundant than 15NNH+. This difference could be due to the slightly different zero-point energy of the ground state level of the two molecules, which would favour the formation of N15NH+ (see e.g. Terzieva & Herbst 2000). However, all this needs to be supported and confirmed by a higher statistics;
-
(3)
the two isotopic ratios D/H and 14N/15N are not related, as it can be seen from Fig. 2. This result is a direct consequence of the fact that the 14N/15N is independent of evolution, opposite to the D/H ratio. Therefore, we do not confirm the possible anti-correlation claimed by Fontani et al. (2015) in massive star-forming cores, although even in that study the anti-correlation was tentative due to the large dispersion of the points. Moreover, our dataset and that of Fontani et al. (2015) are different in many aspects: the linear size of the observed region is much more extended in the high-mass objects of Fontani et al. 2015 (located at more than 1 kpc), and the evolutionary timescales in massive star-forming cores are significantly shorter;
-
(4)
inspection of Fig. 1 also shows that the D/H ratio in CepE is consistent with that measured in IRAS 16293 and IRAS 4A, which suggests that low- and intermediate-mass class 0 protostars have a comparable deuteration in N2H+. Of course, this finding needs to be supported by a more robust statistics.
That the core evolution is basically irrelevant for the 14N/15N ratio was concluded also by Fontani et al. (2015) and Colzi et al. (2017) from observations of several molecular species (N2H+, CN, HNC, and HNC) towards high-mass star-forming cores belonging to different evolutionary stages. Both our study and those performed in high-mass star-forming regions indicate that the enrichment of 15N is unlikely to happen at core scales during the formation of stars of all masses. Therefore, we speculate that the 15N abundance enhancement measured in pristine Solar system material should be due to chemical processes occurred locally, perhaps at the scale of the protoplanetary disk, and not in the extended surrounding envelope. The same conclusion was provided also by Kahane et al. (submitted to ApJ) towards OMC–2 FIR4. We will discuss this point further in Sect. 4.1. Interestingly, cometary-like 14N/15N have indeed been measured by Guzmán et al. (2017) in a sample of protoplanetary disk, suggesting a chemical link. However, the study of Guzmán et al. (2017) is focused on HCN and HNC isotopologues, hence obviously what happens in N2H+ and its isotopologues could be completely different and still needs to be investigated in disks. Interestingly, our 14N/15N ratios are consistent, within the uncertainties, with those measured from ammonia and NH2D in a sample of dense and young star-forming cores (e.g. Gerin et al. 2009, Daniel et al. 2013). This would suggest that the 14N/15N ratio in the envelope of star-forming cores does not depend even on the molecule used. However, both our work and those on ammonia mentioned above are based on a small statistics, thus only observations on larger, carefully selected samples of star-forming cores, like that studied in this work, will confirm this possibility.
4.1 Comments on individual sources
L1544: the 14N/15N ratio in N2H+ was already derived by Bizzocchi et al. (2013) through a non-LTE method using a Bonnor-Ebert sphere model for the source. This method provided 14N/15N , while with our LTE method we derive 14N/15N in the range 275 – 408 and 228 – 341 from 15NNH+ and N15NH+. However, we stress that within the uncertainties, the values are still marginally consistent, as we can note from Fig. 1. Also, even with the value given by Bizzocchi et al. (2013) the global evolutionary trend on the 14N/15N in Fig. 1 would not change significantly. On the other hand, the deuterated fraction of previously calculated by Caselli et al. (2002b) with the same approach adopted by us, is perfectly consistent with our estimates ().
SVS13-A: we find different values for the 14N/15N derived from 15NNH+ and N15NH+ . In particular, the lower limit derived from 15NNH+ is larger (, see Table 5) than the upper limit calculated from N15NH+ (), as well as any other 14N/15N measured in our survey. Please note that in Fig. 1, we have shown the intermediate values (1050 and 530, repectively). Because SVS13-A is the only class I object of the sample, if confirmed, this result would point to a different chemical behaviour between the two 15N isotopologues with time, which is not predicted by the most recent theoretical models (Roueff et al. 2015). Hence, it will be worth investigating this result with higher sensitivity observations, and possibly a larger statistics of similar objects.
OMC–2 FIR4: as stated in Sect. 2, this protocluster is the closest analogue of the environment in which our Sun is thought to have been born. The nitrogen fractionation has been extensively studied by Kahane et al. (submitted to ApJ), who found a good agreement between the present-day local interstellar 14N/15N , and the 14N/15N measured from several molecules (HCN, HNC, HC3N, CN). Our results (Table 5) are perfectly consistent with this finding, indicating a remarkable uniformity of this ratio independently from the molecule used, and a further indication that the large-scale gas is not enriched in 15N, as concluded by Kahane et al. (2017).
| Source | Transition | (N2H+) | (N2D+) | (15NNH+) | (N15NH+) | |
|---|---|---|---|---|---|---|
| K | 1013cm-2 | 1013cm-2 | 1010cm-2 | 1010cm-2 | ||
| L1544 | 1–0 | 5 - 15 | 32.6 - 12.9 | 18.5 - 11.6 | 62.7 - 37.2 | 75.3 - 44.4 |
| IRAS 4A | 1–0 | 5 - 30 | 53.9 - 26.3 | 6.3 - 6.5 | 54.7 - 52.0 | 165 - 156 |
| IRAS 16293 | 1–0 | 5 - 30 | 7.0 - 3.4 | - | 35.4 - 33.7 | - |
| 2–1 | 5 - 30 | - | 2.0 - 0.7 | - | - | |
| 3–2 | 5 - 30 | - | - | - | 393 - 12.9 | |
| L1527 | 1–0 | 5 - 30 | 20.6 - 10.0 | - | 128.6 - 122.4 | 142.7 - 135.1 |
| 2–1 | 5 - 30 | - | 0.48- 0.49 | - | - | |
| SVS13-A | 1–0 | 5 - 30 | 6.8 - 3.3 | - | 4.8 - 4.6 | 6.3 - 6.0 |
| 2–1 | 5 - 30 | - | 0.08 - 0.03 | - | - | |
| L1157–B1 | 1–0 | 5 - 30 | 1.7 - 0.8 | 0.1 - 0.1 | 61.1 - 58.2 | 80.6 - 76.3 |
| CepE | 1–0 | 5 - 30 | 2.5 - 1.2 | 0.11 - 0.12 | 3.2 - 3.1 | - |
| 3–2 | 5 - 30 | - | - | - | 212 - 6.9 | |
| OMC–2 FIR4 | 1–0 | 5 - 30 | 19.8 - 9.6 | - | 40.9 - 38.9 | 51.1 - 48.3 |
| 2–1 | 5 - 30 | - | 0.4 - 0.1 | - | - |
| Source | ||||
|---|---|---|---|---|
| K | ||||
| L1157–B1 | 5 - 30 | 18.4 - 8.1 | 27.2 - 13.9l | 20.6 - 10.6l |
| L1544 | 5 - 15 | 1.8 - 1.1 | 520 - 347 | 433 - 290 |
| IRAS 4A | 5 - 30 | 8.6 - 4.1 | 986 - 505 | 327 - 168 |
| IRAS 16293 | 5 - 30 | 3.5 - 4.8 | 197 - 101l | 18 - 264 |
| L1527 | 5 - 30 | 42.9 - 20.4l | 160 - 168l | 70 - 74l |
| SVS13-A | 5 - 30 | 84 - 110 | 1400 - 717l | 1065 - 548 |
| CepE | 5 - 30 | 22 - 10 | 767 - 392 | 12 - 173 |
| OMC–2 FIR4 | 5 - 30 | 52 - 74 | 484 - 247 | 388 - 199 |
l lower limit;
5 Conclusions
In the framework of the IRAM-30m Large Program ASAI (Lefloch et al. in prep.), we have analysed the rotational transitions of N2H+, N2D+, 15NNH+ , and N15NH+ in order to investigate if (and how) the isotopic fractions H/D and 14N/15N vary during the formation of a Sun-like star. We have confirmed in a robust way that the N2H+/N2D+ is a clear evolutionary indicator in low-mass star formation, because this ratio reaches the minimum value in L1544 (around ), i.e. during the pre–stellar core phase at the onset of the gravitational collapse, and then increases with time monotonically by two orders of magnitude during the protostellar phase, as expected from chemical models. On the other hand, our data do not indicate an evolutionary trend for the 14N/15N ratio, and show clearly that the two isotopic ratios H/D and 14N/15N are basically independent. Therefore, our study confirms previous claims obtained in high-mass star-forming cores that the two ratios are not influenced by the same physical/chemical processes. Also, because our findings demonstrate that the 15N enrichment is a process unlikely to happen in the envelope of forming stars of all masses, the enrichment measured in pristine Solar system material should be caused by chemical processes occurred locally at the scale of the protoplanetary disk.
Acknowledgments. We are grateful to the anonymous referee for the useful and constructive comments that have improved the paper. We thank the IRAM staff for the precious help during the observations. F.F. and C.Codella akcnowledge financial support from the Italian Ministero dell’Istruzione, Università e Ricerca through the grant Progetti Premiali 2012 - iALMA (CUP C52I13000140001). C.Ceccarelli acknowledges the funding from the European Research Council (ERC) under the European Union’s Horizon 2020 research and innovation programme, project DOC contract 741002.
References
- Adams (2010) Adams, F.C. 2010, ARA&A, 48, 47
- Altwegg et al. (2015) Altwegg, K., Balsiger, H., Bar-Nun, A., et al. 2015, Science, 347, 387
- Andre et al. (2000) Andre, P., Ward-Thompson, D., & Barsony, M. 2000, Protostars and Planets IV, 59
- Arce et al. (2008) Arce, H.G., Santiago-García, J., Jørgensen, J. K., Tafalla, M., & Bachiller, R. 2008, ApJL, 681, L21
- Bachiller & Pérez Gutiérrez (1997) Bachiller, R., & Pérez Gutiérrez, M. 1997, ApJ, 487, L93
- Bachiller et al. (1998) Bachiller, R., Guilloteau, S., Gueth, F., et al. 1998, A&A, 339, L49
- Bachiller et al. (2001) Bachiller, R., Pérez Gutiérrez, M., Kumar, M. S. N., & Tafalla, M. 2001, A&A, 372, 899
- Bacmann et al. (2003) Bacmann, A., Lefloch, B., Ceccarelli, C., Steinacker, J., Castets, A., Loinard, L. 2003, ApJ, 585, L55
- Bianchi et al. (2017) Bianchi, E., Codella, C., Ceccarelli, C., Fontani, F., Testi, L., et al. 2017, MNRAS, 467, 3011
- Bisschop et al. (2008) Bisschop, S. E., Jørgensen, J. K., Bourke, T. L., Bottinelli, S., & van Dishoeck, E. F. 2008, A&A, 488, 959
- Bizzocchi et al. (2013) Bizzocchi, L., Caselli, P., Leonardo, E., & Dore, L. 2013, A&A, 555, 109
- Bonal et al. (2009) Bonal, L., Huss, G.R., Nagashima, K., Krot, A.N. 2009, Meteoritics and Planetary Science Supplement. 72, 5178
- Bottinelli et al. (2004) Bottinelli, S., Ceccarelli, C., Neri, R., et al. 2004, ApJ, 617, L69
- Bottinelli et al. (2007) Bottinelli, S., Ceccarelli, C., Williams, J. P., & Lefloch, B. 2007, A&A, 463, 601
- Busquet et al. (2017) Busquet, G., Fontani, F., Viti, S., Codella, C., Lefloch, B., Benedettini, M., Ceccarelli, C. 2017, A&A, 604, 20
- Caselli et al. (2002a) Caselli, P. 2002a, P&SS, 50, 1133
- Caselli et al. (2002b) Caselli, P., Walmsley, C.M., Zucconi, A., Tafalla, M., Dore, L., Myers, P.C. 2002b, ApJ, 565, 344
- Caselli et al. (1999) Caselli, P., Walmsley, C. M., Tafalla, M., Dore, L., Myers, P. C., 1999, ApJL, 523, L165
- Caselli et al. (2012) Caselli, P., Keto, E., Bergin, E. A., Tafalla, M., Aikawa, Y,. Douglas, T., Pagani, L.,et al. 2012, ApJL, 759 L37
- Castets et al. (2001) Castets, A., Ceccarelli, C., Loinard, L., Caux, E., Lefloch, B. 2001, A&A, 375, 40
- Caux et al. (2011) Caux, E., Kahane, C., Castets, A., Coutens, A., Ceccarelli, C., Bacmann, A., Bisschop, S., Bottinelli, S., et al. 2011, A&A, 532, 23
- Cazaux et al. (2003) Cazaux, S., Tielens, A. G. G. M., Ceccarelli, C., et al. 2003, ApJ, 593, L51
- Ceccarelli et al. (1998) Ceccarelli, C., Castets, A., Loinard, L., Caux, E., & Tielens, A. G. G. M. 1998, A&A, 338, L43
- Ceccarelli et al. (2000) Ceccarelli, C., Loinard, L., Castets, A., Tielens, A. G. G. M., & Caux, E. 2000, A&A, 357, L9
- Ceccarelli et al. (2001) Ceccarelli, C., Baudry, A., Caux, E., et al. 2001, The Promise of the Herschel Space Observatory, 460, 219
- Ceccarelli et al. (2014) Ceccarelli, C., Caselli, P., Bockelée-Morvan, D., Mousis, O. et al. 2014, PPVI, University of Arizona Press, Tucson, 914, p.859
- Cernicharo & Guelin (1987) Cernicharo, J.; Guelin, M., 1987, A&A, 183, L10-12
- Chen et al. (2009) Chen, X., Launhardt, R., & Henning, T. 2009, ApJ, 691, 1729
- Cleeves et al. (2014) Cleeves, L.I., Bergin, E.A., Alexander, C.M.O.D., Du, F., Graninger, D. et al. 2014, Science, 345, 1590
- Codella et al. (2010) Codella, C., Lefloch, B., Ceccarelli, C., et al. 2010, A&A, 518, L112
- Codella et al. (2013) Codella, C., Viti, S., Ceccarelli, C., Lefloch, B., Benedettini, M., et al. 2013, ApJ, 776, 52
- Colzi et al. (2017) Colzi, L., Fontani, F., Caselli, P., Ceccarelli, C., Hily-Blant, P., Bizzocchi, L. 2017, arXiv:170904237
- Coutens et al. (2012) Coutens, A., Vastel, C., Caux, E., et al. 2012, A&A, 539, A132
- Crapsi et al. (2005) Crapsi, A., Caselli, P., Walmsley, C.M., Myers, P.C., Tafalla, M., et al. 2005, ApJ, 619, 379
- Crimier et al. (2009) Crimier, N., Ceccarelli, C., Lefloch, B., & Faure, A. 2009, A&A, 506, 1229
- Daniel et al. (2013) Daniel, F., Gérin, M., Roueff, E., Cernicharo, J., Marcelino, N., et al. 2013, A&A, 560, 2013, A3
- Demyk et al. (2010) Demyk, K., Bottinelli, S., Caux, E., et al. 2010, A&A, 517, A17
- Emprechtinger et al. (2009) Emprechtinger M., Caselli P., Volgenau N. H., Stutzki J., Wiedner M. C., 2009, A&A , 493, 89
- De Simone et al. (2017) De Simone, M., Codella, C., Testi, L., et al. 2017, A&A, 599, A121
- Fontani et al. (2011) Fontani, F., Palau, Aina, Caselli, P., Sánchez-Monge, Á., Butler, M.J., et al. 2011, A&A, 529, L7
- Fontani et al. (2014) Fontani, F., Sakai, T., Furuya, K., Sakai, N., Aikawa, Y., Yamamoto, S. 2014, MNRAS, 440, 448
- Fontani et al. (2015) Fontani, F., Caselli, P., Palau, Aina, Bizzocchi, L., Ceccarelli, C. 2015, ApJL, 808, 46
- Fontani et al. (2017) Fontani, F., Ceccarelli, C., Favre, C., Caselli, P., Neri, R. et al. 2017, arXiv170701384
- Gerin et al. (2009) Gérin, M., Marcelino, N., Biver, N., E. Roueff, Coudert, L.H., et al. 2009, A&A, 498, L9
- Gerner et al. (2015) Gerner, T., Shirley, Y.L., Beuther, H., Semenov, D., Linz, H., Albertsson, T., Henning, Th. 2015, A&A, 579, 80
- Gueth et al. (1996) Gueth, F., Guilloteau, S., & Bachiller, R. 1996, A&A, 307, 891
- Gueth et al. (1998) Gueth, F., Guilloteau, S., & Bachiller, R. 1998, A&A, 333, 287
- Guzman et al. (2017) Guzmán, V.V., Öberg, K.I., Huang, J., Loomis, R., Qi, C. 2017, ApJ, 836, 30
- Hartogh et al. (2011) Hartogh, P., Lis, D. C., Bockelée-Morvan, D., et al. 2011, Nature, 478, 218
- Hirota et al. (2007) Hirota, T., Bushimata, T., Choi, Y. K., et al. 2007, PASJ, 59, 897
- Hirota et al. (2007) Hirota, T., Bushimata, T., Choi, Y.K., Honma, M., Imai, H., Iwadate, K., Jike, T., Kameya, O., et al. 2008, PASJ, 60 37
- Hirota et al. (2011) Hirota, T., Honma, M., Imai, H., et al. 2011, PASJ, 63, 1
- Jørgensen et al. (2011) Jørgensen, J. K., Bourke, T. L., Nguyen Luong, Q., & Takakuwa, S. 2011, A&A, 534, A100
- Jørgensen et al. (2012) Jørgensen, J. K., Favre, C., Bisschop, S. E., et al. 2012, ApJ, 757, L4
- Kahane et al. (2017) Kahane, C., Jaber Al-Edhari, A., Ceccarelli, C., López-Sepulcre, A., Fontani, F., Kama, M. 2017, arXiv:171201564
- Lefévre et al. (2017) Lefévre, C., Cabrit, S., Maury, A.J., Gueth, F., Tabone, B., Podio, L., Belloche, A., et al. 2017, A&A, 604, L1
- Lefloch et al. (1996) Lefloch, B., Eisloeffel, J., & Lazareff, B. 1996, A&A, 313, L17
- Lefloch et al. (1998) Lefloch, B., Castets, A., Cernicharo, J., Langer, W. D., & Zylka, R. 1998, A&A, 334, 269
- Lefloch et al. (2010) Lefloch, B., Cabrit, S., Codella, C., Melnick, G., Cernicharo, J. et al. 2010, A&A, 518, 113
- Lefloch et al. (2015) Lefloch, B., Gusdorf, A., Codella, C., et al. 2015, A&A, 581, A4
- Linsky et al. (2006) Linsky, J.L., Draine, B.T., Moos, H.W., Jenkins, E.B., Wood, B.E., et al. 2006, ApJ, 647, 1106
- Lique et al. (2015) Lique, F., Daniel, F., Pagani, L., Feautrier, N. 2015, MNRAS, 446, 1245
- Loinard et al. (2008) Loinard, L., Torres, R. M., Mioduszewski, A. J., & Rodríguez, L. F. 2008, ApJ, 675, L29
- Looney et al. (2000) Looney, L. W., Mundy, L. G., & Welch, W. J. 2000, ApJ, 529, 477
- Looney et al. (2007) Looney, L. W., Tobin, J. J., & Kwon, W. 2007, ApJ, 670, L131
- López-Sepulcre et al. (2013) López-Sepulcre, A., Taquet, V., Sánchez-Monge, Á., Ceccarelli, C., Dominik, C. et al. 2013, A&A, 556, 62L
- López-Sepulcre et al. (2015) López-Sepulcre, A., Jaber, Ali A., Mendoza, E., Lefloch, B., Ceccarelli, C., et al. 2015, MNRAS, 449, 2438
- López-Sepulcre et al. (2017) López-Sepulcre, A., Sakai, N., Neri, R., et al. 2017, arXiv:1707.03745
- Manfroid (2009) Manfroid, J., Jehin, E., Hutsemékers, D., et al. 2009, A&A, 503, 613
- Marty (2010) Marty, B., Zimmermann, L., Burnard, P.G., Wieler, R., et al. 2010, Geochimica et Cosmochimica Acta74, 340
- Marty (2009) Marty, B., Zimmermann, L., Burnard, P.G. 2009, Geochimica et Cosmochimica Acta73, 842
- Millar et al. (1989) Millar, T. J., Bennett, A., & Herbst, E. 1989, ApJ, 340, 906
- Moro-Martín et al. (2001) Moro-Martín, A., Noriega-Crespo, A., Molinari, S., et al. 2001, ApJ, 555, 146
- Müller et al. (2001) Müller, H.S.P., Thorwirth, S., Roth, D.A., & Winnewisser, G. 2001, A&A, 370, L49
- Müller et al. (2005) Müller, H.S.P, Schlüder, F., Stutzki, J., & Winnewisser, G. 2005, J. Mol. Struct., 742, 215
- Noriega-Crespo et al. (2004) Noriega-Crespo, A., Moro-Martin, A., Carey, S., et al. 2004, ApJS, 154, 402
- Parise et al. (2004) Parise, B., Castets, A., Herbst, E., et al. 2004, A&A, 416, 159
- Persson et al. (2012) Persson, M.V., Jørgensen, J.K., van Dishoeck, E.F. 2012, A&A, 541, 39
- Roueff et al. (2015) Roueff, E., Loison, J.C., Hickson, K.M. 2015, A&A, 576, 99
- Santangelo et al. (2015) Santangelo, G., Codella, C., Cabrit, S., et al. 2015, A&A, 584, A126
- Sakai et al. (2008) Sakai, N., Sakai, T., Hirota, T., & Yamamoto, S. 2008, ApJ, 672, 371-381
- Sakai et al. (2010) Sakai, N., Sakai, T., Hirota, T., & Yamamoto, S. 2010, ApJ, 722, 1633
- Sakai et al. (2016) Sakai, N., Oya, Yoko; L pez-Sepulcre, Ana; Watanabe, Yoshimasa; Sakai, Takeshi, et al. 2016, ApJ, 820, L34
- Sakai et al. (2017) Sakai, N., Oya, Y., Higuchi, A.E., Aikawa, Y., Hanawa, T., et al. 2017, MNRAS, 467, L76
- Sargent (1977) Sargent, A. I. 1977, ApJ, 218, 736
- Shinnaka et al. (2016) Shinnaka Y., Kawakita H., Jehin E., Decock A., Hutsemékers D., Manfroid J., Arai A., 2016, MNRAS, 462, 195
- Shimajiri et al. (2008) Shimajiri, Y., Takahashi, S., Takakuwa, S., Saito, M., & Kawabe, R. 2008, ApJ, 683, 255-266
- Taquet et al. (2015) Taquet, V., López-Sepulcre, A., Ceccarelli, C., et al. 2015, ApJ, 804, 81
- Taquet et al. (2016) Taquet, V., Furuya, K., Walsh, C., van Dishoeck, E.F. MNRAS, 462, 99
- Terzieva & Herbst (2000) Terzieva R. & Herbst E., 2000, MNRAS, 317, 563
- Tobin et al. (2016) Tobin, J. J., Looney, L. W., Li, Z.-Y., et al. 2016, ApJ, 818, 73
- Vastel et al. (2014) Vastel, C., Ceccarelli, C., Lefloch, B., Bachiller, R., 2014, ApJ, 795, L2