The Second Nucleus of NGC 7727: Direct Evidence for the Formation and
Evolution of
an Ultracompact Dwarf Galaxy11affiliation: Based in part on data gathered with the 6.5 m Magellan
Telescopes located at Las Campanas Observatory, Chile.
Abstract
We present new observations of the late-stage merger galaxy NGC 7727, including HST/WFPC2 images and long-slit spectra obtained with the Clay telescope. NGC 7727 is relatively luminous (=21.7) and features two unequal tidal tails, various bluish arcs and star clusters, and two bright nuclei 480 pc apart in projection. These two nuclei have nearly identical redshifts, yet are strikingly different. The primary nucleus, hereafter Nucleus 1, fits smoothly into the central luminosity profile of the galaxy and appears—at various wavelengths—“red and dead.” In contrast, Nucleus 2 is very compact, has a tidal radius of 103 pc, and exhibits three signs of recent activity: a post-starburst spectrum, an [O III] emission line, and a central X-ray point source. Its emission-line ratios place it among Seyfert nuclei. A comparison of Nucleus 2 (=15.5) with ultracompact dwarf galaxies (UCDs) suggests that it may be the best case yet for a massive UCD having formed through tidal stripping of a gas-rich disk galaxy. Evidence for this comes from its extended star-formation history, long blue tidal stream, and elevated dynamical-to-stellar-mass ratio. While the majority of its stars formed 10 Gyr ago, 1/3 formed during starbursts in the past 2 Gyr. Its weak AGN activity is likely driven by a black hole of mass . We estimate that the former companion’s initial mass was less than half that of then-NGC 7727, implying a minor merger. By now this former companion has been largely shredded, leaving behind Nucleus 2 as a freshly minted UCD that probably moves on a highly eccentric orbit.
Subject headings:
galaxies: active — galaxies: dwarf — galaxies: formation — galaxies: individual (NGC 7727) — galaxies: interactions — galaxies: nuclei1. INTRODUCTION
The hierarchical assembly of galaxies (White & Rees, 1978) is now widely accepted and has become a paradigm of cold dark matter cosmology (e.g., Frenk & White, 2012; Primack, 2017; Peebles, 2017; Rodriguez-Gomez et al., 2017). In parallel, studies of galaxy interactions and mergers have slowly gained prominence as part of the search for primary drivers of galaxy growth and evolution, both observationally (e.g., Zwicky, 1953; Arp, 1966; Larson & Tinsley, 1978; Schweizer, 1986, 2000; Kennicutt et al., 1998; Bell, 2006) and theoretically (e.g., Toomre & Toomre, 1972; Barnes & Hernquist, 1992, 1996; Hopkins et al., 2006, 2013). Major mergers (i.e., with mass ratios ) seem to be especially involved in the formation of early-type galaxies and may contribute, in ways still poorly understood, to the quenching of star formation (e.g., Faber et al., 2007; Haines et al., 2015). Because in the local universe they often involve a pair of full-grown disk galaxies and generate spectacular phenomena, such as long tidal tails, central starbursts, and active galactic nuclei (AGNs), they have been studied extensively (e.g., Sanders & Mirabel, 1996; Hopkins et al., 2008). The crucial role they play in transforming the morphological types of some galaxies guarantees them continued attention in the future from observers and numerical modelers alike.
In contrast, minor mergers (with mass ratios ) have been studied less and are generally less well understood than major mergers for a variety of reasons. Their effects on galaxies are often less spectacular, whence they can be more difficult to discover and observe. Since they involve galaxies of distinctly different mass, the dynamical friction they experience tends to be less effective than in major mergers, leading to longer accretion times with a strong dependence on the impact parameter. As a result, some minor mergers can lead to prolonged tidal stripping of the intruder in the halo of the main galaxy, with little or no delivery of intruder mass to the center. The stellar tidal streams that such prolonged minor mergers leave behind in the halos of all types of galaxies can be spectacular, once galaxies and their outskirts get imaged to very faint levels of surface brightness. Disk galaxies wrapped in faint tidal streams, such as NGC 5907 (Martínez-Delgado et al., 2008) and M63 (= NGC 5055, Chonis et al. 2011), are being discovered in growing numbers (Martínez-Delgado et al., 2010; Miskolczi et al., 2011; Carlin et al., 2016). Intermediate between them and classical major-merger remnants are early-type galaxies that feature some long filaments, whether tidal streams or parts of former tidal tails, and disturbed-looking bodies, often with ripples and shells (e.g., Arp, 1966; Schweizer, 1980; Malin & Carter, 1983; Tal et al., 2009; Duc et al., 2015). NGC 7727, the Sa pec galaxy that is the subject of the present paper, belongs in this intermediate category.
The discovery of ultracompact dwarf galaxies (UCDs) in the Fornax Cluster (Hilker et al., 1999; Drinkwater et al., 2000) may have originally appeared unrelated to the kind of major and minor mergers just described. Soon, however, some UCDs were linked to nuclei of tidally stripped dwarf galaxies (e.g., Bekki et al., 2001; Haşegan et al., 2005; Pfeffer & Baumgardt, 2013; Liu et al., 2015a) and, possibly, of even larger and more metal-rich galaxies (e.g., Brodie et al., 2011; Norris et al., 2014; Sandoval et al., 2015). Recent findings that some UCDs had extended star-formation histories (Norris et al., 2015), are sometimes associated with tidal stellar streams (Voggel et al., 2016), and can even harbor supermassive black holes (SMBHs) unexpectedly massive for their luminosity (Mieske et al., 2013; Seth et al., 2014; Ahn et al., 2017) have strengthened suspicions that some of them may be the long-lived nuclear remnants of tidally disrupted companion galaxies of considerable mass. Our observations of the intriguing “second nucleus” of NGC 7727 presented here add what may be the strongest evidence yet that this process is still occurring, even in the present-day local universe.
The study of NGC 7727 and its complex structure has an interesting history. Probably because of its bright inner region and unresolved “amorphous spiral arms” (Arp, 1966), now known as likely tidal tails, Hubble (1926) classified it as a normal spiral of type “Sa.” Both G. de Vaucouleurs and A. Sandage stuck to this morphological type, refining it to “SAB(s)a pec” and “Sa pec,” respectively, based on plates of superior resolution (de Vaucouleurs & de Vaucouleurs, 1964; Sandage & Tammann, 1981). Vorontsov-Velyaminov (1959) was the first to point out NGC 7727’s peculiar structure, placing the galaxy among “Fused Systems” in his Atlas and Catalogue of Interacting Galaxies and noting that it might be the result of an interaction between an elliptical and a spiral galaxy. Following up on this tip, Arp (1966) photographed the galaxy with the Hale 5-m telescope and chose to include it as Number 222 in his Atlas of Peculiar Galaxies.
The second nucleus of NGC 7727, hereafter “Nucleus 2” for short, was mistaken by many astronomers to be a Milky Way foreground star or was outright overlooked, including by Arp himself.111 Arp noted on the envelope of his plate PH-4002-A, a 25-min visual exposure of NGC 7727 taken with the Hale 5-m telescope: “Star in interior seems to be sitting on dark nebula — investigate!” This foreground star lies NNW of the primary nucleus, which—like Nucleus 2—is not visible owing to overexposure of the central region; it is this plate that is reproduced in Arp’s Atlas. However, Nucleus 2 is strikingly visible on plate PH-3963-A, a 60-min exposure of NGC 7727 through an interference filter also taken by Arp, yet there is no note on the envelope of this plate, nor are there any markings on the plate itself. After inspecting old Mount Wilson plates, de Vaucouleurs & de Vaucouleurs (1964) noted it as “There is a star or bright knot superimposed.” The first to recognize Nucleus 2 as highly peculiar was A. Sandage, who compared NGC 7727 to the classical merger remnant NGC 7252 (Toomre, 1977; Schweizer, 1982) and then commented: “The merger hypothesis for NGC 7727 is strengthened by the presence of two nuclei near the center of the image seen on short-exposure Mount Wilson 100-inch plates taken by Duncan in 1925 and 1938 and by Hubble in 1946. One of these nuclei is at the center of the bulge plus inner disk of the parent galaxy. The other unresolved bright nucleus is well separated from the primary nucleus by . However, at resolution for the seeing disk, it is not possible to decide if the secondary nucleus is a superposed star or is the nucleus of a proposed, nearly merged previous companion” (Sandage & Bedke, 1994).
Sandage’s description is right on the mark, as two of us (F.S. and B.W.) realized after obtaining images of NGC 7727 with the Hubble Space Telescope (HST) for the purpose of studying the blue star-cluster population (Crabtree & Smecker-Hane, 1994; Trancho et al., 2014) of this merger candidate (Toomre & Toomre, 1972; Schweizer, 1986). It is these HST images and our ground-based follow-up observations that form the basis of the present study focused on Nucleus 2.
NGC 7727, also known as Arp 222, VV 67, and MCG02-60-006, is the dominant member of a small group of three galaxies, the other two members being NGC 7723 and NGC 7724 (Group 1522 in Crook et al. 2007). Its primary nucleus, hereafter “Nucleus 1” for short, is located at , (Section 3.1) and has a recession velocity relative to the Local Group of km s-1 (Karachentsev & Makarov, 1996), which places the galaxy at a distance of Mpc for km s-1 Mpc-1 (Freedman & Madore, 2010). At that distance, adopted throughout the present paper, pc. The corresponding true distance modulus is . The Milky Way foreground extinction is relatively small, with values in the literature ranging between (de Vaucouleurs et al. 1991) and 0.113 (Schlegel et al., 1998). We adopt the latest revised value of (Schlafly & Finkbeiner, 2011), with which the absolute visual magnitude of NGC 7727 becomes (Section 3.3). Finally, with (Jarrett et al., 2003), NGC 7727 has an estimated stellar mass of (Section 4.2.1).
In the following, Section 2 describes our observations and reductions, including imaging and spectroscopy of NGC 7727 and its two nuclei. Section 3 presents results concerning the optical structure of NGC 7727; the nuclei’s positions at optical, X-ray, and radio wavelengths; their radial velocities, velocity dispersions, stellar populations, star formation histories, and dynamical and stellar masses; and the interstellar medium (ISM) of NGC 7727. Section 4 then discusses Nucleus 2 as a smoking gun for UCD formation and evolution, the apparent absence of AGN activity in Nucleus 1 and presence of it in Nucleus 2, and NGC 7727 as an interesting example of the aftermath of ingesting a gas-rich companion. Finally, Section 5 summarizes our main results and conclusions. Two appendices add some details about image-masking techniques used and emission lines measured in the nuclei.
| Date | Telescope | InstrumentaaDC: Direct camera; LDSS-3: Low-Dispersion Survey Spectrograph 3; MagE: Magellan Echellette Spectrograph. | CCD | Filter | P.A. | Total | Wavelength | Seeing | Notes |
|---|---|---|---|---|---|---|---|---|---|
| Detector | Expos. | Coverage | |||||||
| (deg) | (s) | (Å) | (arcsec) | ||||||
| 1999 May 10 | HST | WFPC2 | Loral | F555W | 0.0bbPosition angle of HLA-reprocessed images, not of original WFPC2 frames. | 2693 | 4500–6100 | From HLA | |
| F814W | 0.0bbPosition angle of HLA-reprocessed images, not of original WFPC2 frames. | 3260 | 7100–9600 | From HLA | |||||
| 2008 Aug 23 | du Pont 2.5 m | DC | Tek #5 | 0.0 | 1200 | 5670–7180 | 1.2 | ||
| 2009 Aug 21 | Clay 6.5 m | LDSS-3 | STA0500A | 151.9 | 1380 | 3850–6590 | 0.7 | Slit | |
| 2009 Aug 23 | Clay 6.5 m | MagE | E2V 42-20 | 151.9 | 2160 | 3300–8250 | 0.7–0.8 | Slit |
2. OBSERVATIONS AND REDUCTIONS
Our observations of NGC 7727 described below include images obtained with the Hubble Space Telescope (HST ) and the du Pont 2.5-m telescope at Las Campanas Observatory, as well as spectra taken with the Low-Dispersion Survey Spectrograph (LDSS-3) and the Magellan Echellette (MagE) spectrograph, both on the Clay 6.5-m telescope at Las Campanas. Table 1 presents a log of these observations.
2.1. Imaging
2.1.1 HST/WFPC2 Images
We observed NGC 7727 with the Wide Field and Planetary Camera 2 (WFPC2) aboard HST on 1999 May 10 as part of Program GO-7468 (PI: Schweizer). Five exposures each were taken through filters F555W and F814W (hereafter and , respectively), one short (60 s) and four long and dithered, for a total exposure time of 2693 s in and 3260 s in . Although the various frames were processed in a standard manner at the time (e.g., Trancho et al., 2003), the new measurements presented below (Sections 3.1, 3.3) were made from reprocessed and images downloaded from the Hubble Legacy Archive (hereafter HLA; Whitmore 2007) in 2014 December. The reprocessing, done in 2009 and 2010, included new drizzling that significantly improved the geometric rectification and the accuracy of the coordinate system (Jenkner et al., 2010). This is a crucial advantage when comparing the optical coordinates derived for the two nuclei of the galaxy with coordinates derived from Chandra X-ray and ALMA radio observations, as we do in Section 3.1 below.
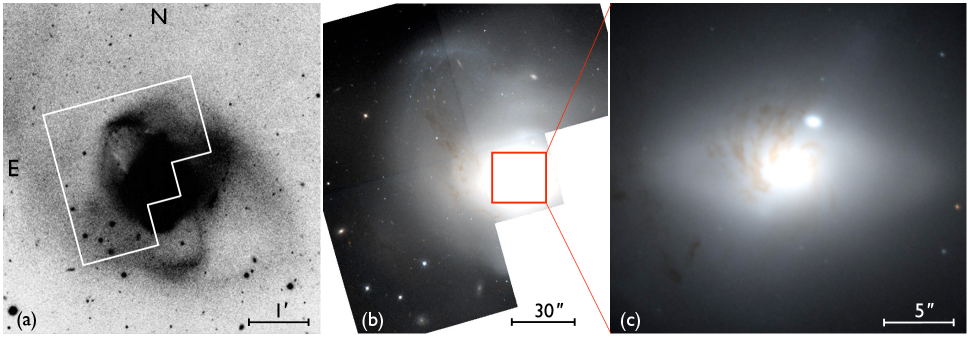
Figure 1 shows a photomontage of one ground-based and two HST/WFPC2 images of NGC 7727 and its two nuclei. The ground-based image (Figure 1(a)) is based on a photograph of this galaxy obtained by A. Sandage with the Hale 5-m telescope at prime focus (Kodak IIIa-J plate, no filter, 75-min exposure) and here reproduced from the Carnegie Atlas of Galaxies (Sandage & Bedke, 1994, Vol. I, Panel 83). On this image the central part of the galaxy’s tidally disturbed body appears “burnt out” owing to overexposure. The two WFPC2 images (Figures 1(b) and (c)) are color renditions prepared by the HLA through a combination of the and exposures obtained with HST. Figure 1(b) shows a large portion of the mosaicked WFPC2 image, reproduced at a contrast that emphasizes faint structures and dust lanes in the outer body at the expense of details in the central region, which again appears burnt out. Finally, Figure 1(c) displays a segment of the central body of NGC 7727, imaged by the PC chip of WFPC2 and centered on Nucleus 1. The contrast has been chosen to show both the bright regions surrounding this nucleus and the slightly elongated Nucleus 2 located about north–northwest of it at P.A. = 332°. Notice the spiral-shaped dust lanes emerging from the bright central region to the northeast, the extended fainter body’s spindle shape which may indicate that it is a stellar disk, and the surprisingly steep brightness drop-off of Nucleus 2. These features and their photometric properties are further discussed in Sections 3.2 and 3.3 below.
2.1.2 Ground-Based Images
Direct, mostly -band images of NGC 7727 were obtained with the CCD camera of the du Pont 2.5-m telescope on 2008 August 23 (Table 1). Conditions were photometric, with a seeing of (FWHM). The -band images were taken through a standard filter designed to match the Kron-Cousins photometric system. The camera was equipped with the chip Tek 5 (20482048 pixels), which yielded a scale of pixel-1 in and a field of view (FOV) of . The CCD frames were flat-fielded, co-added, and reduced in standard manner with IRAF.222 The Image Reduction and Analysis Facility (IRAF) is distributed by the National Optical Astronomy Observatories (NOAO), which are operated by the Association of Universities for Research in Astronomy (AURA), Inc., under a cooperative agreement with the National Science Foundation.
A final -band image of NGC 7727 was produced in two steps. A full-FOV image was first computed as the median of the four best-seeing frames of 180 s exposure each, for a total of 720 s of exposure. Since the very center of NGC 7727 was mildly saturated on each frame, the central region was then excised and replaced with a properly scaled median image computed from five 60 s exposures that were clearly unsaturated even at the nucleus. This composite -band image of NGC 7727 is presented and discussed in Section 3.2 below.
2.2. Spectroscopy
Long-slit spectra of NGC 7727 were obtained both with LDSS-3 (see Allington-Smith et al. 1994 for LDSS-2) at the Clay 6.5-m telescope during the night of 2009 August 21/22 and with the MagE spectrograph (Marshall et al., 2008) at the same telescope two nights later (Table 1).
2.2.1 LDSS-3 Spectra
For the observations with LDSS-3, the slit of the spectrograph was placed at a position angle of P.A. = across the two nuclei of NGC 7727. One exposure of 120 s and three exposures of 420 s each were obtained with the “VHP Blue” grism (1090 g mm-1), yielding a wavelength coverage of 3850–6590 Å and—for uniform illumination—a spectral resolution of (4.0 Å at 5200) after full reduction. The spatial scale along the slit was pixel-1, with the spatial resolution set by the seeing during the observations.
NGC 7727 was observed in the morning hours under somewhat cirrussy conditions, following a prolonged telescope closure due to clouds. To permit at least a relative flux calibration, two standard stars (Feige 110 and LTT 1020) were also observed, one before and the other after the galaxy, using a wide slit at parallactic angle. The subsequent reduction of the various spectra included COSMOS-pipeline processing to flat-field, wavelength-calibrate, and rectify the spectra frame by frame (Oemler et al., 2017). For NGC 7727, the four frames of 120s and s exposure were then co-added and cleaned of cosmic rays with the IRAF task imcombine. Finally, the resulting rectified two-dimensional (2D) spectrum was flux-calibrated and sky-subtracted in preparation for the various object extractions and measurements to follow (see Section 3.4.1). Because of the cirrussy conditions, we estimate that the absolute flux calibration of this spectrum is uncertain by about %, while the relative flux calibration in wavelength is reliable at the few percent level.
2.2.2 MagE Spectrum
For our 2009 August 23 observations of NGC 7727 with the MagE spectrograph, the slit was oriented at P.A. = again and placed across both nuclei. The main goal of taking this spectrum was to measure the radial-velocity difference between the two nuclei and their individual velocity dispersions. The total exposure of 36 minutes was broken into six 6-minute subexposures, during which the airmass increased from 1.30 to 1.49 and the seeing slightly deteriorated from to . A separate sky exposure, also of 6-minute duration, was then obtained with the slit offset to a patch of blank sky 2′ N of Nucleus 1. To calibrate fluxes, several standard stars were observed with a slit at parallactic angle. We also observed two Lick-index standards of spectral types G8 III and A5 V to help measure the systemic velocity of NGC 7727 and permit a simple assessment of the old- and young-star light contributions to the spectra of the two nuclei.
The subsequent reduction of the various MagE spectra included pipeline processing to flat-field and co-add frames, rectify spectral orders, calibrate wavelengths, and subtract the sky spectrum (Kelson et al., 2000; Kelson, 2003). Although MagE covers the wavelength range of 3100 Å – 1.0 m in orders 20–6 (Marshall et al., 2008), the two most ultraviolet orders yielded no signal for the galaxy, and the two most infrared orders could not be reliably processed because of scattered-light problems. Hence, the final spectra, extracted from orders 18–8, cover the wavelength range 3300–8250 Å with a resolution of . The spatial scale along the slit varies slightly from order to order and is pixel-1 at the Mg I triplet ( Å). In a final step, one-dimensional (1D) spectra of the two nuclei of NGC 7727 were extracted from each 2D order spectrum and were spliced together in wavelength to form a single 1D spectrum for each nucleus, as described in more detail in Section 3.4.
3. RESULTS
The following subsections first present our astrometry of NGC 7727’s two nuclei at optical, X-ray, and radio wavelengths, then describe the general optical structure of the galaxy and the detailed photometric structure of both nuclei, and go on to present the nuclei’s velocities, velocity dispersions, stellar populations, star-formation histories, and masses. The final subsection briefly describes some interesting properties of the galaxy’s sparse ISM.
3.1. Positions of the Two Nuclei
We have measured new optical positions for the two nuclei of NGC 7727 from the HST/WFPC2 images obtained in the and passbands (Section 2.1.1) and have compared them with the positions of peaks observed in X-ray and radio images of the galaxy, as described below. Table 2 presents all measured coordinates.
| Telescope/ | Source Image | Nucleus 1 | Nucleus 2 | aaSeparation between Nucleus 1 and Nucleus 2 (in arcseconds). | P.A.bbPosition angle of Nucleus 2 relative to Nucleus 1. | |||||
|---|---|---|---|---|---|---|---|---|---|---|
| Instrument | (″) | (°) | ||||||||
| HST/WFPC2 | PC (F555W) | 23:39:53.796 | 12:17:34.03 | 23:39:53.679 | 12:17:30.83 | 3.63 | 331.8 | |||
| PC (F814W) | 23:39:53.796 | 12:17:34.04 | 23:39:53.679 | 12:17:30.83 | 3.64 | 331.9 | ||||
| Chandra/ACIS | Center-of-field | 23:39:53.804 | 12:17:34.48ccCenter position of diffuse, extended X-ray emission. | 23:39:53.687 | 12:17:31.23ddPosition of bright X-ray point source named “Source 5” by Brassington et al. (2007), who treated its position as being that of the main optical nucleus, which it clearly is not. Instead, Source 5 is here measured to coincide with Nucleus 2 to within 0.42″, which is well within the combined errors of HST and Chandra positions. | 3.67 | 332.2 | |||
| ALMAeeALMA observations from 2011 November made in the Cycle 0 compact configuration (Ueda et al. 2014). | 3 mm continuumffThe radio positions were measured from Figure 1h in Ueda et al. (2014), where high-accuracy coordinate grid marks are provided. | 23:39:53.801 | 12:17:34.67 | |||||||
| CO(1-0) lineffThe radio positions were measured from Figure 1h in Ueda et al. (2014), where high-accuracy coordinate grid marks are provided. | 23:39:53.838 | 12:17:34.42 | ||||||||
The centroids of the optical nuclear light distributions were measured with the IRAF task imexam from the Planetary Camera (PC) frames (scale of per drizzled pixel) and, as a check, also from the WFPC2 mosaics delivered by the HLA. The measurements all agreed with each other to within in each coordinate (R.A., Decl.), much better than the reported typical absolute positional accuracy of per coordinate for HST images reprocessed by the HLA. Table 2 lists the PC coordinates of the two nuclei in and . Note that the near-identity of the nuclear positions in the two passbands suggests that dust extinction near the nuclei is either relatively small or rather uniform across each nucleus.
In order to address the question whether either nucleus of NGC 7727 might show any signs of AGN activity, we also measured the positions of peaks observed in the X-ray count distribution of this galaxy. As Brassington et al. (2007) found from a 19 ks exposure taken with Chandra’s Advanced CCD Imaging Spectrometer (ACIS), the galaxy’s X-ray emission consists of a diffuse photon distribution stemming from the hot ISM and a number of point sources, of which the brightest, Source 5, lies close to the center of the diffuse emission. In their Table 3 Brassington et al. assumed that the center of the diffuse emission coincides with Source 5 and gave it the same coordinates. However, their Figure 14 (right panel) clearly shows a small offset between Source 5 and the peak of the diffuse distribution.
To determine new astrometric positions for the distinct centers of the diffuse X-ray emission and Source 5 we downloaded the reprocessed X-ray images of NGC 7727 from the Chandra Archive. The original exposure (ID: Observation 2045) was obtained on 2001 December 18 with ACIS-S (PI: A. M. Read) and was reprocessed on 2012 October 1 by B. Sundheim. To measure peak positions, we used the so-called “Center image” (ACIS chip S3), which contains count numbers in 1025x1024 square pixels of size summed over a net exposure time of 19.01 ks. The main result of our astrometry is that the centroid of the diffuse X-ray emission lies at , and coincides with the optical position of Nucleus 1 to within , while X-ray Source 5 lies at , and coincides with the optical position of Nucleus 2 to within (see Table 2). We conclude that the hot ISM of NGC 7727 is clearly centered on Nucleus 1, while Source 5 closely coincides with Nucleus 2.
Two arguments strongly support this conclusion. First, the coordinate differences between the measured X-ray and optical positions are nearly identical for the ISM centroid versus Nucleus 1 (, ) and the Source 5 versus Nucleus 2 (, ), clearly suggesting a systematic shift of between the Chandra-based and HST-based coordinate systems. Such a shift falls well within the range of the combined absolute-coordinate uncertainties for Chandra and HST, being radial errors for 68% of all point sources measured from ACIS-S images and typically errors per coordinate for WFPC2 images from the HLA.
Second, as Table 2 shows, the separation and position angle between the two measured X-ray centroids, , are nearly identical to those between the two optical nuclei, . Hence, there can be little doubt about the spatial congruence of the true (i.e., physical) X-ray and optical peaks. Specifically, this implies that X-ray Source 5 probably is coincident with, or lies very close () to, the center of Nucleus 2, a point discussed further in Section 4.2.2.
Finally, we also measured precise positions for the radio peaks of the 3 mm continuum and CO ( = 1–0) line emission observed with ALMA during Cycle 0 by Ueda et al. (2014). These authors found a rotating central molecular-gas disk and remarked that the 3 mm continuum peak is associated with the nucleus and coincides with the peak seen in the CO integrated-intensity map. Since they seemed unaware of the presence of two optical nuclei in NGC 7727 and did not give precise positions for the 3 mm continuum and CO emission peaks, we determined these positions ourselves from the contour map shown in the middle panel of their Figure 1h. This panel measures and is framed with precise coordinate grid marks. Table 2 lists the coordinates measured separately for the 3 mm continuum peak and the CO ( = 1–0) integrated-intensity peak. From the beam size and observational signal-to-noise ratios we estimate the positional uncertainties to be in each coordinate for the 3 mm continuum peak and for the CO emission-line peak. As a comparison of the positions of the radio peaks with those of the optical and X-ray peaks given in the table shows, both the 3 mm continuum peak and the CO emission-line peak coincide clearly with Nucleus 1 (to within the combined errors) and not with Nucleus 2 or X-ray Source 5. Hence, the small central molecular-gas disk found by Ueda et al. (2014) is indeed associated with the main nucleus of NGC 7727.
3.2. Optical Structure of NGC 7727
The optical structure of NGC 7727 is complex and has long been understood to point to a relatively recent gravitational interaction between two galaxies (Vorontsov-Velyaminov 1959; Toomre & Toomre 1972; Schweizer 1986, esp. Fig. 4; Sandage & Bedke 1994). Presciently, Arp (1966) placed this galaxy (Arp 222) in his morphological category named “Galaxies [with] Amorphous Spiral Arms,” which also contains the two merger remnants NGC 3921 (Arp 224) and NGC 7252 (Arp 226). The main difference between NGC 7727 and these two remnants is that it features only one obvious tidal tail, while they clearly feature two such tails each. In the following, we first use ground-based images to describe NGC 7727’s rich inner and outer fine structure, then use HST/PC images to illustrate the dust lanes and two nuclei of the central region at high resolution, and finally present evidence for a tidal stream emanating from Nucleus 2.
3.2.1 Inner and Outer Fine Structure

Figure 2 illustrates the inner and outer fine structure of NGC 7727 with two masked images (panels (a) and (b)) and four direct images (panels (c)–(f)). The scales of the left, middle, and right panels differ and are indicated by 20 kpc () long bars in the top panels.
The inner fine structure, best seen in Figures 2(a) and (b),333 Details about the digital masking process used to produce these two panels are presented in Appendix A. appears chaotic, with various luminous protrusions, ripples, and loop-like arcs interwoven with dust lanes and patches. There are two main such arcs: “Arc 1” extending 11 kpc to the SSW and possibly connecting to the E tail (see esp. Figures 2(b) and (d)), while “Arc 2” appears as a nearly 4 kpc long feature lying about 9 kpc NE of the center of the galaxy. Both arcs are blue in color, making them especially well visible on Sandage’s blue-band photograph reproduced in Figure 1(a). Their blue color also shows nicely in a -index map of NGC 7727 (Ho et al., 2011) and is indicative of young to intermediate-age stellar populations in these arcs. Arc 2, seen faintly in Figures 2(a)–(c) and much better in Figures 1(a) and (b), coincides with an abrupt, probably tidal cutoff in the galaxy’s surface brightness, seen prominently in Figure 2(d). Notice in Figures 2(a) and (b) that while many dust lanes and patches appear chaotic, some do align with luminous matter, like the dust lane 5.4 kpc SW of the center. These aligned dust lanes may well mark gas layers seen nearly edge-on and embedded in sheets of luminous matter, often called “ripples” or “shells” (Schweizer, 1980, 1986; Malin & Carter, 1983; Quinn, 1984).
Perhaps the most obvious outer structure of NGC 7727 is its prominent tidal “E tail,” which measures at least 60 kpc in projected length (Figures 2(d)–(f)). Given the main body’s many ripples and arcs, most presumably consisting of former-disk material, the question is whether there is a second tidal tail that might stem from a second disk galaxy involved in the interaction. A diffuse candidate for such a second tail can be seen in Figures 1(a), 2(c), and 2(d), curving away from the main body first northward, then westward, and finally southward in direction of the bright star near the SW corners of these two panels. If this apparent curved stream of diffuse light indeed is a coherent structure and tidal tail, as we believe, then it forms a roughly symmetric counterpart to the E tail, although clearly less extended than the latter. This “W tail” and the more prominent E tail then indicate that two disk galaxies, likely of unequal mass, were involved in forming the current near-remnant system.
Notice also a faint, 16 kpc ( 120) long ripple about 22 kpc west of NGC 7727’s center (near the W edge of Figure 2(d), marked by the arrow), yet another sign of dynamically cold disk material involved in this messy merger.
The most surprising outer structure is the faint ring-like stream of luminous matter that seems to connect the N end of the E tail with this outer ripple and the westernmost part of the galaxy (Figures 2(e) and (f)). Interestingly, this diffuse stream may continue into a faint giant southern arc passing slightly south of the much brighter Arc 1 (see Figure 2(d)). If the E tail and this ring-like structure were to form a large physical ring (of major-axis diameter 50 kpc), then this ring might indicate that the dense center of one disk galaxy plunged through the disk of another galaxy at some time early during the interaction, forming a classical ring galaxy (Lynds & Toomre 1976; Toomre 1978, esp. Fig. 5). In principle, NGC 7724—the companion galaxy located 97 kpc WNW of NGC 7727 (see Figures 2(e) and (f))—could have been the plunging perturber, yet we see no trace of any luminous connection between the two systems, and NGC 7724 itself looks like a rather normal, unperturbed barred spiral galaxy. For this reason, and also because NGC 7724 is gas-rich and lies far off the minor axis of NGC 7727’s ring, we deem it very unlikely to have been involved in creating the apparent ring-like stream.
Alternatively, this stream might itself be some tidal tail, perhaps indicative of a minor third galaxy having been involved in giving NGC 7727 its present messy outer structure.
3.2.2 Central Dust Lanes
The center region of NGC 7727 is laced with prominent dust lanes that make it difficult to recognize any luminous fine structure.
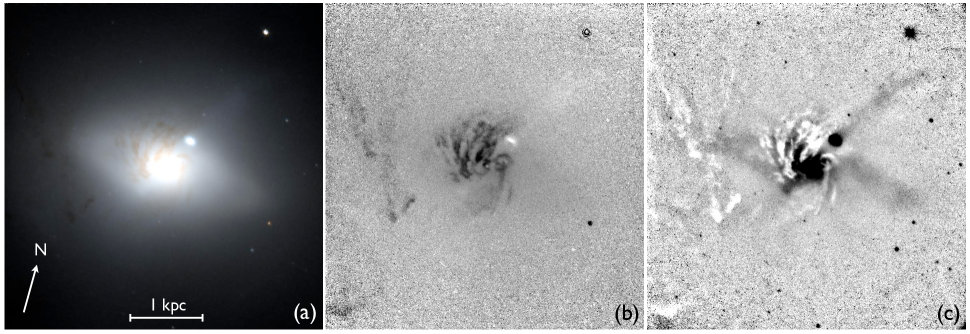
Figure 3 illustrates the structure of these central dust lanes with three derivatives of the and frames obtained with the PC chip of HST/WFPC2 (Section 2.1.1). The color image downloaded from the HLA (Figure 3(a)) shows not only the galaxy’s two nuclei, but also what appears to be an inner lens or bar of 2.7 kpc ( 20″) length. Emerging from the bright center toward the NE are spiral-shaped dust lanes that are more clearly visible in an image displaying the ratio of counts (or flux), shown in Figure 3(b). The fact that these reddish central dust lanes appear strong (i.e., dark) in the half-plane NE of Nucleus 1 and weak in the SW half-plane suggests that they trace an inclined disk of dust and gas with a semimajor axis extending from the NW to the SE and its NE side protruding from the sky plane through Nucleus 1. Assuming that the spirally dust filaments are trailing, this inferred disk geometry predicts that the SE side of the gas disk should be receding. Velocity maps of this disk made in CO(1–0) with ALMA confirm this morphology-based prediction and yield a disk inclination of , major-axis orientation at P.A. = , and maximum rotation velocity of 150 km s-1 (Ueda et al., 2014, esp. Fig. 1h and Table 6).
In an unsharply masked version of the PC image shown in Figure 3(c),444 For details about the masking process, see Appendix A. the dust lanes appear as whitish areas of diminished brightness because they absorb light originating from luminous matter behind them. In two of the strongest dust patches, located 320 pc () N and 290 pc () NNE of Nucleus 1, the measured extinction reaches values of mag and mag. These apparent extinctions in and represent only lower limits to the true extinction caused by the dust since starlight originating in NGC 7727 between the dust patches and us tends to “fill in” some of the observed extinction.
3.2.3 The Blue Tidal Stream of Nucleus 2
Immediately beyond NGC 7727’s central, region messed up by dust lanes there is one luminous fine structure that stands out—despite its faintness—when one inspects the PC color image of the galaxy made by the HLA on a computer screen. It is a 11″ (1.5 kpc) long “plume” or “streamer” of bluish light extending from Nucleus 2 to the NNW. This faint bluish plume is difficult to discern on any printed version of the above color image (Figure 3(a)), but can easily be seen on an unsharply masked version of the PC image, as shown in Figure 3(c).

Given that unsharp masking of images of complex objects can occasionally produce strange artifacts, we convinced ourselves of the reality of this bluish plume by producing various isophotal plots of carefully model-masked and images of NGC 7727 (see Section 3.3 below for details about the computation of the model light distributions). Figure 4 shows two resulting contour plots, in and , of Nucleus 2 and the region NW of it. In both cases the lowest contour was set to 0.040 electrons per second and pixel, which corresponds to surface brightnesses of 21.65 mag arcsec-2 in and 20.74 mag arcsec-2 in . Note that these surface brightnesses pertain to the residual light of NGC 7727 after subtraction of model light distributions computed separately for the and images (Section 3.3). Since the luminous plume extending from Nucleus 2 to the NNW looks very similar in both and , it is unquestionably real. From here on and for reasons to be detailed shortly, we will call it the Blue Tidal Stream (BTS).
Before deriving its photometric properties, we point out two things: (1) the contour plots show the BTS only over its brightest (1.0 kpc) in length, compared to its full 11″ length seen in Figure 3(c); (2) the BTS may have a counterpart to the SE of Nucleus 2, as suggested by what may be a faint bluish streak across the central area of NGC 7727—glimpsed upon visual inspection of the HLA’s color image—and by a rectangular-shaped dark-gray “slab” of extra light seen protruding from the central burnt-out area to the SE in Figure 3(c). However, because of the complex dust lanes and higher surface brightness in that area, we have been unable to convince ourselves of its reality and to produce evidential contour plots. Hence, in the following we describe only the clearly established NNW part of the BTS, but keep in mind that there may be an SSE part to it as well.
We estimate the integrated apparent and magnitudes of the BTS from its isophotal contours shown in Figure 4 as follows. Integrating flux over the entire area of the BTS contained within the contour of lowest surface brightness from Nucleus 2 to the BTS’s NW end while excluding any flux from Nucleus 2 itself (i.e., flux within the second and higher contours), and assuming that the surface brightness within this area is constant at the level of the lowest contour, yields apparent magnitudes of and for the BTS. These values clearly represent upper (i.e., faint) limits to the total magnitudes since (1) the surface brightness within the lowest contour exceeds the contour value and (2) the BTS extends 47% beyond its contour in the NW direction (11″ vs. ). After applying estimated corrections for these two missing contributions to the flux and also correcting for Milky Way foreground extinctions of (), we find integrated true magnitudes for the BTS of and . The corresponding absolute magnitudes are and . Note that when compared to those of Nucleus 2 (Section 3.3, esp. Table 3), these absolute magnitudes for the BTS indicate that its integrated () luminosity corresponds to about 16% (14%) of the luminosity of Nucleus 2.
Perhaps the most interesting photometric property of the BTS is its blue integrated color, , which is 0.18 mag bluer than that of Nucleus 2, , but only by of the combined errors. In contrast, the color of the BTS is 0.48 mag bluer than that of Nucleus 1, , a difference significant at the level. Thus, the blue color of the BTS strongly links the stream to Nucleus 2, its point of apparent origin. Taken together, the apparent physical linkage and the common blue color make a strong case for this stream consisting of stars being tidally stripped from Nucleus 2, which explains our choice of the name Blue Tidal Stream.
3.3. Photometric Structure of the Two Nuclei
Detailed photometric analyses of the main body of NGC 7727 and Nucleus 1 have been published (Ho et al., 2011; Lauer et al., 2005) and will not be repeated here. Instead, we concentrate on a photometric comparison of the galaxy’s two nuclei.
To compare the surface-brightness profile of Nucleus 2 with that of Nucleus 1, we performed and photometry from the PC frames obtained with HST/WFPC2 (Section 2.1.1). We used the task ellipse of the isophote package in IRAF/STSDAS (Busko, 1996) to fit elliptical isophotes via the method developed by Jedrzejewski (1987), itself based on earlier work by Carter (1978) and Lauer (1985). Because of the complex system of dust lanes (Section 3.2) we did the primary ellipse fitting in the band, where the extinction is only 60% of that in the band (Schlegel et al., 1998). In addition, we also used the iterative sigma-clipping option of the task ellipse to reduce the influence of dust lanes when fitting elliptical isophotes in and deriving the mean surface brightness along them. For the photometry in we used the ellipses and the same sigma-clipping algorithm to make the and surface-brightness measurements as congruent as possible. Unlike Lauer et al. (2005), we did not attempt to deconvolve the PC images for the effects of the point-spread function (PSF), again because of the considerable uncertainties that would be introduced by the central dust lanes.
In a first step, the photometric profile of Nucleus 1 and the surrounding body was derived with the region of Nucleus 2 excluded from the fit. In a second step, a model light distribution of the main body based on this profile and computed with the STSDAS task bmodel was subtracted from the and images to produce images of Nucleus 2 alone (plus surrounding brightness residuals). The photometric profiles of Nucleus 2 in and were then again obtained with the task ellipse out to a radius of (= 16 PC pixels), where both profiles drop off sharply and beyond which residuals make measurements unreliable.
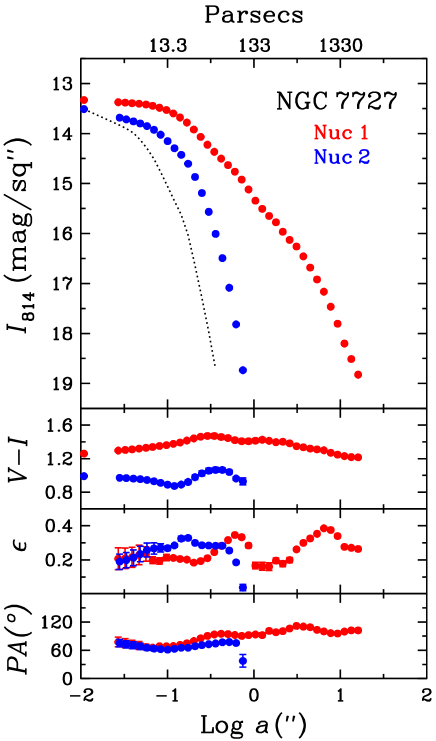
Figure 5 shows the resulting surface-brightness, color, ellipticity , and position-angle profiles for Nucleus 1 and the surrounding body (red data points) and for Nucleus 2 (blue data points), plotted as functions of the semimajor axis (in arcseconds) of the best-fitting ellipses. For comparison, the PSF derived from an star located 17 NNW of Nucleus 1 is also plotted (black dotted line). We note parenthetically that the profile of Nucleus 1 and the surrounding body, not shown in Figure 5, agrees well with the profile derived by Lauer et al. (2005) over the range , where PSF smearing does not seriously affect our profiles of the main body. Figure 5 illustrates several results of interest.
First, the surface-brightness profile of Nucleus 2 drops off very sharply when compared to that of Nucleus 1, yet not as steeply as the stellar PSF; hence, Nucleus 2 is clearly resolved, as further discussed below. Second, Nucleus 2 is about 0.45 mag bluer in than Nucleus 1, with a mean color index of within a radius of compared to within the same radius. Third, given Nucleus 2’s low velocity dispersion when compared to that of Nucleus 1 (Section 3.4), its measured central surface brightness is surprisingly high. In the band, it is only 18% fainter than the measured surface brightness of Nucleus 1, while in the band the center of Nucleus 2 outshines that of Nucleus 1 by 9%. These relative central surface brightnesses could, of course, change after proper deconvolution of the PC and images, but the striking result remains that the two nuclei of NGC 7727 have comparable optical central surface brightnesses.
Fourth, note the rapidly diminishing ellipticity of Nucleus 2 in the outermost part of its measured profile ( to ). As Figure 4 illustrates, this circularization of the isophotes is real and marks the transition region between the bright inner part of Nucleus 2, which appears elliptical with and semimajor axis oriented at P.A., and the BTS, which itself is oriented toward P.A.. The isophotes appear circular () at pc, which we adopt as the tidal cutoff radius of Nucleus 2.
The surface-brightness profiles shown in Figure 5 further allow us to derive photometric structural parameters for both nuclei and global photometric parameters for Nucleus 2. For Nucleus 1, which does not stand out as a separate structure or star cluster (Lauer et al., 2005), and the surrounding main body, we adopt the corresponding global parameters obtained by Ho et al. (2011) from their wide-field photometry of NGC 7727. Table 3 presents the collated measurements, from which we again derive several results.
| Parameter | Symbol | NGC 7727 (Nucleus 1) | Nucleus 2 |
|---|---|---|---|
| Apparent total magnitude | 10.60 magaaValues taken from Ho et al. (2011). | 16.80 mag | |
| Apparent total color index | 1.27 magaaValues taken from Ho et al. (2011). | 0.97 mag | |
| Total magnitudebbCorrected for Milky Way foreground reddening (), but not for internal reddening. | 10.50 mag | 16.70 mag | |
| Total color indexbbCorrected for Milky Way foreground reddening (), but not for internal reddening. | 1.23 mag | 0.93 mag | |
| Absolute magnitudeccFor the adopted distance of Mpc. | 21.69 mag | 15.49 mag | |
| Absolute magnitudeccFor the adopted distance of Mpc. | 22.92 mag | 16.42 mag | |
| Effective radius in passbandddCorrected for PSF smearing (see text for standard deviations). | kpc | pc | |
| Surface brightness at bbCorrected for Milky Way foreground reddening (), but not for internal reddening. | 19.33 mag/″aaValues taken from Ho et al. (2011). | 14.92 mag/″ | |
| Central surface brightnesseeCorrected for Milky Way foreground reddening, but not for internal reddening or PSF smearing. | 14.49 mag/″ | 14.40 mag/″ | |
| Central surface brightnesseeCorrected for Milky Way foreground reddening, but not for internal reddening or PSF smearing. | 13.28 mag/″ | 13.46 mag/″ | |
| Core radius in passbandddCorrected for PSF smearing (see text for standard deviations). | pc | pc | |
| Tidal cutoff radius in passband | pc | ||
| Ellipticity at core radius | () | 0.19 | 0.28 |
| P.A. of semimajor axis at | P.A.() |
With its total apparent magnitude of , measured within , Nucleus 2 appears 6.2 mag fainter than NGC 7727 itself (). Hence, Nucleus 2 contributes only 0.3% to the total optical luminosity of the galaxy despite its high central surface brightness. With its absolute magnitude of , Nucleus 2 is about 2.5 less luminous than M32 (, van den Bergh 2000), the compact elliptical (cE) companion of M31, and 4.3 less luminous than the Small Magellanic Cloud (, van den Bergh 2000). Yet it is clearly over 100 more luminous than any Milky Way globular cluster, of which the most luminous is Cen (, Harris 2010). Hence, there can be little doubt that Nucleus 2 is of a galactic nature.
Yet, the effective (i.e., half-light) radius of Nucleus 2 measured in the band and corrected for the width of the PSF, pc, is very small, especially when compared with that of the main nucleus and body of NGC 7727, kpc (measured from our ground-based image). This small and the absolute magnitude of place Nucleus 2 clearly in the domain of UCDs (see, e.g., Norris et al. 2014). In agreement with this assessment, the surface brightness measured at is also much higher for Nucleus 2, mag arcsec-2, than for NGC 7727 (19.33 mag arcsec-2).
Contrary to the above global photometric parameters, which differ sharply between Nucleus 2 and the main nucleus and body of NGC 7727, the local photometric parameters at the centers of Nucleus 2 and Nucleus 1 are much more similar. As already found above, the apparent central surface brightness in —corrected for Milky-Way foreground reddening but not for internal reddening or PSF smearing—is for Nucleus 2, about 9% higher than that of Nucleus 1. The corresponding central surface brightness in for Nucleus 2 is mag arcsec-2, only 18% less than that of Nucleus 1, which, however, probably suffers some internal extinction. Finally, the apparent core radius in (i.e., the radius at half the apparent peak surface brightness) of Nucleus 2 is pc (corrected for PSF width), not all that different from the apparent core radius of Nucleus 1, pc.
In summary, Nucleus 1 and Nucleus 2 of NGC 7727 have comparable central photometric properties, supporting the notion that Nucleus 2 is galactic in nature. However, Nucleus 1 appears embedded in—and indistinguishable from—the surrounding body of the galaxy (Fig. 5, and Lauer et al. 2005), while Nucleus 2 has a sharp tidal cutoff at pc and shares some photometric properties with UCDs.
3.4. Nuclear Spectra, Velocities, and Velocity Dispersions
The spectra of Nucleus 1 and Nucleus 2 obtained with LDSS-3 and MagE (Section 2.2) are of relatively short total exposure (21 min and 36 min, respectively) and have, hence, limited signal-to-noise ratios, especially in their UV–blue regions. Nevertheless, they yield valuable information concerning the spectral differences between the two nuclei, plus systemic velocities and velocity dispersions for each nucleus.
3.4.1 Comparison of the Nuclear Spectra
Figure 6 shows the spectra of the two nuclei obtained with LDSS-3 and here displayed in the form of logarithmic flux versus rest wavelength. Both spectra were extracted from the same rectified and sky-subtracted 2D spectrum described in Section 2.2.1. The extraction apertures chosen for Nucleus 1 and Nucleus 2 were ( pc) and ( pc), respectively, and were each centered on its nucleus.555 The extractions comprised four spatial pixels of the rectified 2D spectrum (scale of pixel-1) for Nucleus 1 and five spatial pixels for Nucleus 2. For Nucleus 1 no background subtraction was necessary, since it is an integral part of the galaxy and indistinguishable from its surroundings (Section 3.3). However, for Nucleus 2 the surrounding bright background of the main galaxy had to be subtracted, which, because of its curvature and steep gradient, poses a challenge.
We experimented with two background subtraction methods. One was to make separate quadratic fits to the background on either side of Nucleus 2 at each wavelength and subtract the fitted background that falls into the aperture used for Nucleus 2. The second method was to extract a separate spectrum from a patch of the galaxy located SE of the main nucleus, symmetrically opposite from Nucleus 2 and at the same level of surface brightness, and subtract it from the “Nucleus 2 + local background” spectrum. For the LDSS-3 spectrum of Nucleus 2 displayed in Figure 6 we chose this second method, since it yielded clearly more reliable continuum fluxes, although at the price of slightly inferior spectral-line subtraction because of the rotation of the main galaxy. (For the higher-resolution MagE spectrum of Nucleus 2 discussed in Section 3.4.2 below, we chose the first method since good spectral-line subtraction is imperative for measuring accurate velocities and velocity dispersions.)
As Figure 6 shows, the spectra of the two nuclei of NGC 7727 are strikingly different. The spectrum of Nucleus 1 shows the usual absorption lines characteristic of old stellar populations (e.g., Ca II H + K, Mg I b triplet, and Na I D doublet) and thus resembles the nuclear spectra of “red and dead” early-type galaxies. In contrast, the spectrum of Nucleus 2 features a significantly bluer continuum and shows—in addition to the tracers of old stellar populations—strong Balmer absorption lines. The lines , , , and are easily visible in it, as a comparison with the spectrum of the A7 V star HD 111525, taken from the library of stellar spectra by Jacoby et al. (1984), shows. Note that the next two Balmer lines, H8 and H9 (unmarked), are also visible near the blue end of the displayed spectrum (corresponding to the two bluest absorption lines seen in the A7 V spectrum).
Hence, the spectrum of Nucleus 2 is clearly composite in nature and reminiscent of the post-starburst spectra often observed in local merger remnants (e.g., Schweizer, 1978, 1982; Zabludoff et al., 1996; Norton et al., 2001) and sometimes dubbed “E+A” or “K+A” spectra (Dressler & Gunn, 1983; Franx, 1993). We infer from this composite spectrum that Nucleus 2 probably experienced a starburst in the recent past ( 2 Gyr), while Nucleus 1 apparently did not. Section 3.5 below addresses this issue in more quantitative detail via a spectral synthesis leading to approximate star-formation histories for the two nuclei.

3.4.2 Systemic Velocities and Central Velocity Dispersions
To measure the systemic velocities and central velocity dispersions of the two nuclei, we extracted their 1D spectra from the MagE rectified and sky-subtracted 2D spectrum (Section 2.2.2). The extraction was somewhat complex and involved the first method alluded to above. For each of the 11 spectral orders used and each nucleus, we extracted spectral strips 3 spatial pixels () wide and centered each on the brightness peak of its nucleus, using the IRAF task apsum. Counts were summed at each wavelength to form a 1D order spectrum. For Nucleus 1 we again did not subtract any background. For Nucleus 2, on the other hand, we fitted the background spectrum of the main galaxy at each wavelength in the spatial direction with a quadratic function, excluding a 10-pixel () wide stretch centered on Nucleus 2. The fitted background falling into the 3-pixel aperture used for Nucleus 2 was then subtracted from the counts in this aperture to yield the 1D net spectrum of Nucleus 2. In two final steps, each order spectrum was normalized to a continuum level of 1, and the 11 order spectra were spliced into a single 1D spectrum for each nucleus. This spectrum refers to a rectangular area of ( pc) centered on the nucleus.
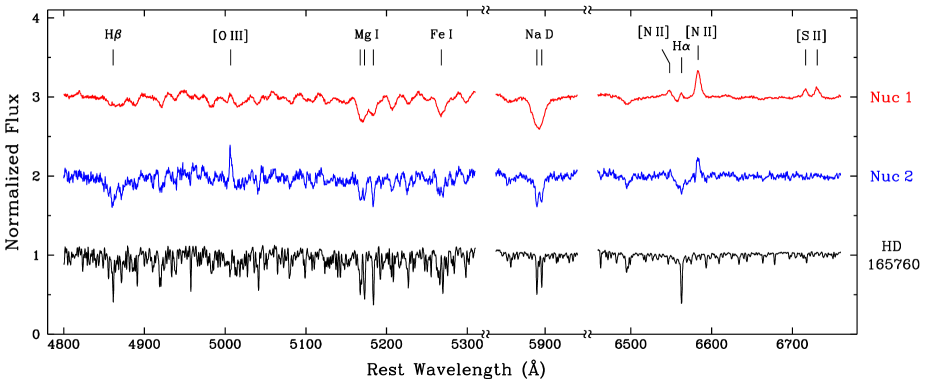
Figure 7 shows segments of the resulting spectra of Nucleus 1 and 2 covering the rest wavelengths 4800–5310 Å, 5830–5950 Å, and 6450–6780 Å. The spectrum of the G8 III star HD 165760, used in the subsequent analysis, is included for comparison. Note the broadening of spectral lines in the two nuclei when compared to the same lines in the G8 III star. This broadening is especially easy to see for the Mg I triplet and the Na I D doublet (both marked).
Using the spectra shown in Figure 7, we measured the systemic heliocentric velocities and central velocity dispersions of each nucleus by cross-correlating its spectrum with the spectrum of HD 165760. We used the technique developed by Tonry & Davis (1979, hereafter TD79) and encoded in the IRAF task fxcor. We experimented with various spectral regions and used the ratio , defined as the height of the true correlation peak divided by the average peak of the correlation function (TD79), to judge the quality of the determined velocities and dispersions. As is often found, a wavelength region centered on the Mg I triplet () yielded measurements with the smallest errors, although differences between results obtained with the adopted region, –5450, and with various other regions up to 1400 Å wide were relatively minor.
The central radial-velocity dispersions measured in the pc apertures were fully corrected for instrumental broadening666 As explained in TD79, measured velocity dispersions have to be corrected for the instrumental broadening of both the template star and the stars in the galaxy. and are km s-1 for Nucleus 1 and km s-1 for Nucleus 2. Note that the velocity dispersion of Nucleus 2 is surprisingly large. Given the ratio (or its inverse, ) and the Faber–Jackson relation (Faber & Jackson, 1976), one would expect Nucleus 2 to be about 33 less luminous than the main galaxy, yet we measured it to be 6.2 mag fainter in (Section 3.3), which means that it is about 300 less luminous. An interesting question, addressed in Section 4 below, is how much of this crass difference may be due to stellar population differences, the presence of an abnormally massive SMBH, and/or tidal stripping.
The systemic heliocentric radial velocities measured for Nucleus 1 and 2 via cross-correlation with HD 165760 are km s-1 and km s-1, respectively. Our systemic velocity for Nucleus 1 and, hence, NGC 7727 agrees well with that measured by Rothberg & Joseph (2006) from the Ca II triplet in the near IR, km s-1.
The difference in line-of-sight (LOS) velocity between Nucleus 2 and the main galaxy, km s-1, is of special interest for two reasons. First, its small value shows that Nucleus 2 is kinematically closely associated with NGC 7727, as we already guessed from its BTS (Section 3.2.3). And second, the quoted value places an essential constraint on acceptable orbital parameters in any future model simulation of this interesting late-stage merger.
The relatively large error in , amounting to more than half the measured value itself, is caused mainly by the 8.4 km s-1 error in , which is 4 larger than the error in . Although this surprisingly large velocity error for Nucleus 1 may, in part, be due to the 190 km s-1 velocity dispersion, it may also be caused by a mismatch of spectral features between Nucleus 1 and the G8 III template star. A K0 III or K2 III star might have provided a better match, but was not observed with MagE. To test this possibility and obtain an improved value of , we cross-correlated the spectrum of Nucleus 1 with that of Nucleus 2, thus making a direct measurement of the velocity difference, km s-1. We adopt this as our final value for , and we also slightly adjust the two measured nuclear recession velocities (in proportion to their errors) to yield this directly measured difference. Table 4 summarizes the results of our various cross-correlation measurements just described.
| Parameter | Symbol | NGC 7727 (Nucleus 1) | Nucleus 2 | (Nuc 2 Nuc 1) |
|---|---|---|---|---|
| Aperture sizeaaLonger dimension oriented at P.A. ; the apertures project to pc. | ||||
| Measured heliocentric velocitybbMeasured by cross-correlation with the spectrum of HD 165760 (G8 III). | ccVelocity difference between the two measured heliocentric velocities. | |||
| Adopted heliocentric velocityddMeasured velocities adjusted to yield exactly the measured velocity difference; see text for details. | eeVelocity difference measured directly by cross-correlation between the spectra of Nucleus 1 and 2. | |||
| Central velocity dispersion |
Note. — All velocities and velocity dispersions are measured from the MagE spectrum and given in km s-1.
3.5. Stellar Populations and Star Formation Histories of the Two Nuclei
As illustrated in Figure 6, the two nuclei of NGC 7727 feature markedly different spectra. Whereas the spectrum of Nucleus 1 is characteristic of old stellar populations, that of Nucleus 2 is of a more composite nature, suggesting the presence of relatively young stars of spectral type A in addition to an old population.
To estimate the proportions of young and old stars in each nucleus, we modeled the two flux-calibrated LDSS-3 spectra with the spectral-synthesis code STARLIGHT (Version 4), developed and made publicly available by Cid Fernandes et al. (2005, 2007, 2009). We used two libraries of model spectra provided with the package, both based on Bruzual & Charlot (2003, hereafter BC03) models and a Chabrier (2003) initial mass function. One library, called BC03.N, contains 45 model spectra for populations of 15 different ages and 3 metallicities, while the other library, BC03.S, contains 150 model spectra for populations of 25 different ages and 6 metallicities. We allowed for internal extinction with a Cardelli et al. (1989) law and experimented with various spectral-line maskings, finding that masking the three emission lines and [O III] 4959, 5007 improved the fits, while masking the Na D absorption doublet made surprisingly little difference (with one exception noted below).
The main difficulty we faced was a slightly incorrect shape of the spectral continuum, especially a drooping of a few percent toward the red ends of the two spectra. This drooping was likely caused by the spectrograph slit deviating from the vertical by 32 during the observation, leading to some light losses caused by differential atmospheric refraction. Since by default the STARLIGHT code gives as much weight to continuum fluxes as to spectral-line fluxes, the poor fits near the ends of the spectra led to relatively large chi-squares per data point used () and to unrealistic, negative values of internal extinction. We minimized the problem by restricting our spectral fits to the rest wavelengths –5950 Å, which led to values of 0.37 for fits to the spectrum of Nucleus 1 and 0.80 for the more noisy spectrum of Nucleus 2. With this restricted wavelength range, we found the results from various STARLIGHT fits remarkably robust against changes in spectral library, extinction law, and initializing random number.
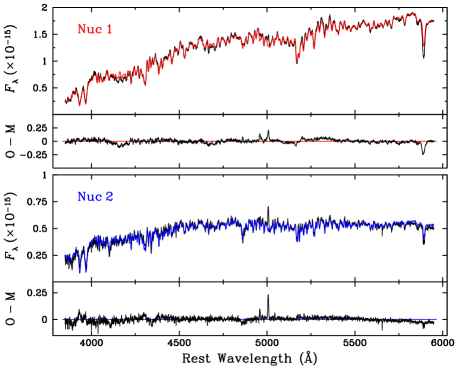
Figure 8 shows the spectra of the two nuclei (black lines), each superposed with one representative model fit (red and blue lines) picked from the 10 final fits with different initializing random numbers. These final fits were all made with the Na D line doublet unmasked, i.e., fully included in the fit, but differ only imperceptibly from those with the doublet masked. To facilitate judging the fits, the residuals “O M” (for Observed minus Model spectrum) are shown below the fit for each nucleus. Notice the and [O III] 4959, 5007 emission lines in the residual spectrum of Nucleus 1 and the same two [O III] emission lines in that of Nucleus 2. Of the absorption lines, the Na D doublet is obviously insufficiently fit by the model spectrum in Nucleus 1, but better—though not completely—fit in Nucleus 2. The poor fit for Nucleus 1 is likely due to a combination of interstellar Na I absorption within the nuclear region of NGC 7727 and, perhaps, a deficiency in giant stars with strong Na D absorption in the stellar model library. In contrast, the Ca II H K lines are well fit in Nucleus 1, but leave considerable residuals in Nucleus 2. Despite these flaws, both the values quoted above and the plotted spectral model fits appear overall satisfactory, given the limited quality of our LDSS-3 spectra and, especially, the challenging subtraction of the bright galaxy background from the spectrum extracted for Nucleus 2 (Section 3.4.1).
The STARLIGHT fits to the nuclear spectra yield interesting information about the stellar populations and star-formation history of each nucleus.
For Nucleus 1, all fits involve only the two oldest stellar populations (11 and 13 Gyr) and the top two metallicities ( and 2.5 ) of the BC03.N model library that we used. Hence, the stellar populations of Nucleus 1 are 100% old, with a formal light-weighted age of Gyr and metallicity of . The small quoted error in age is derived from the 10 final STARLIGHT fits with different random-number initializations and probably underestimates the astrophysical uncertainties by a factor of 10–20. But the main result remains that there is no sign of any young or intermediate-age ( Gyr) stellar population in the primary nucleus of NGC 7727. If present, any such young population would have to be heavily obscured.
The mix of stellar populations in Nucleus 2 is more newsworthy. All STARLIGHT fits reveal the presence of a significant “young” population of stars with a light-weighted mean age of Gyr in addition to the preponderant old stellar population. The latter has itself a slightly younger light-weighted age, Gyr, than the old population of Nucleus 1, as well as a distinctly lower metallicity of . Interestingly, all STARLIGHT fits for Nucleus 2 make use of only 4 of the 15 age components in the BC03.N library: the ages of these four components are 640 Myr and 1.43 Gyr for the young populations and 11 and 13 Gyr for the old populations. Neither the intermediate-age 2.5 and 5 Gyr components in the library nor any of the eight components with very young ages (300 Myr) are involved. Hence, Nucleus 2 appears to have formed the majority of its stars in the distant past ( Gyr) and have then experienced one or perhaps two starbursts during a period that occurred about 0.5–1.8 Gyr ago. These starbursts were metal-rich () and contributed significantly to the present stellar mass in Nucleus 2: about % of the mass is in young stars, while % of it is in old stars. Although a minority in mass, the young stars contribute as much as 80% of the total flux at Å (the default normalization point used by the STARLIGHT code), while the mass-dominant old stars contribute only 20% of it.
These mass and light ratios between young and old stellar populations in Nucleus 2 are rather sensitive to the treatment of the Na D absorption doublet in the model fitting process. If instead of including the doublet in the fit one masks it out, the mass fraction in young stars increases from 38% to 50% (i.e., equal mass in young and old stellar populations), and the violet-light (4020) fraction contributed by the young population increases from 80% to nearly 87% of the total. This suggests that including the Na D doublet in the fit is important for determining the fraction of light from late-type giant stars, even though—if ISM absorption is not the culprit—such stars in the BC03.N and BC03.S libraries seem to possess too weak Na doublets to fully reproduce the observed doublet strength in Nucleus 2 as well as in Nucleus 1.
The recent starburst episode in Nucleus 2 may have consisted of two separate bursts of unequal strength. STARLIGHT fits with both the BC03.N library and the BC03.S library suggest that the main burst occurred about 1.2–1.5 Gyr ago, producing about 98%–99% of the present-day mass in the young stellar population. A second, much weaker burst then occurred about 500–650 Myr ago, producing the remaining 1%–2% of the mass in young stars (corresponding to 0.3%–0.7% of the total stellar mass, young and old). Since with both libraries STARLIGHT made no use of an existing 905 Myr old component (i.e., assigned zero mass to it), we believe that the separation of the recent starburst into a main burst 1.2–1.5 Gyr ago, followed by a weak second burst about 0.7–1.0 Gyr later, may be real. However, new spectra of higher quality and more sophisticated population syntheses will be needed to clarify this issue.
3.6. Dynamical and Stellar Mass of Nucleus 2
The measurements and results presented in Sections 3.3–3.5 above allow us to estimate both the dynamical mass and the stellar mass of Nucleus 2.
For a spherical stellar system in virial equilibrium, the dynamical mass is , where is the half-mass radius, the mean radial velocity dispersion, the gravitational constant, and a profile-dependent numerical factor valid for most globular clusters in our Galaxy (Spitzer 1987, pp. 11–12; Maraston et al. 2004). Approximating with (Spitzer, 1987), we get , which—with the measured values of pc and km s-1 (see Tables 3 and 4)—yields the dynamical mass of Nucleus 2, . This mass is that of Cen, the most massive globular cluster in the Milky Way (e.g., Meylan & Heggie, 1997), and makes Nucleus 2 a close kin of the most massive UCD discovered so far in the Virgo Cluster, M59-UCD3 (, Liu et al. 2015b).
The above estimate of might be questioned on grounds that Nucleus 2 is the remnant of a former galaxy in the process of being stripped and can, therefore, hardly be in virial equilibrium. Yet, various arguments and simulations suggest that the mean velocity dispersion of such a nucleus may change by only a few percent (see Forbes et al. 2014 for a review), presumably especially if the nucleus harbors an SMBH. Here, we simply note that Nucleus 2 and M59-UCD3 have not only similar dynamical masses (4.2 and , respectively), but also similar effective radii ( pc and pc, respectively) and mean velocity dispersions ( km s-1 and km s-1, respectively). Hence, the strength of tidal forces, likely several orders of magnitude stronger in Nucleus 2 than in M59-UCD3, does not seem to make much difference, as expected in galactic nuclei where self-gravitation dominates the dynamics (e.g., Faber, 1973; Pfeffer & Baumgardt, 2013).
To estimate the stellar mass of Nucleus 2, we used two methods, one based on -band photometry and the other on the STARLIGHT analysis of the LDSS-3 spectrum.
For the photometric estimate, we measured the integrated magnitude of Nucleus 2 relative to that of NGC 7727 from a -band image obtained by Knapen et al. (2003) with the William Herschel 4.2 m telescope (WHT) on La Palma, finding a magnitude difference of mag between Nucleus 2 and the entire galaxy.777 The relatively large, 15% error reflects mainly uncertainties in the sky subtraction that are due to the limited, FOV of the image. Since the integrated magnitude of NGC 7727 is (Jarrett et al., 2003), the total apparent magnitude of Nucleus 2 is , yielding an absolute magnitude of at Mpc. This absolute magnitude corresponds to a -band luminosity of and, via the mean relation (van den Bosch, 2016), to a stellar mass for Nucleus 2 of .
For a second estimate, we used the stellar mass of calculated by STARLIGHT in making its best fit to the LDSS-3 spectrum of Nucleus 2 (Fig. 8). As described in Section 3.5, this mass is based on stellar-population libraries and a Chabrier (2003) initial mass function. Two corrections need to be applied to it. First, given the seeing during the LDSS-3 observation, the aperture used to extract the spectrum of Nucleus 2 missed 18% of the integrated light. And second, the % uncertainty in our flux calibration (Section 2.2.1) translates into a similar uncertainty for . With these two corrections applied, the population-synthesis-based estimate of the stellar mass of Nucleus 2 becomes .
Finally, we average the photometric and STARLIGHT-based values of with weights 2:1 and obtain, as our best estimate, .
3.7. The Interstellar Medium of NGC 7727
Given NGC 7727’s system of prominent central dust lanes (Section 3.2.2), it comes as somewhat of a surprise that the galaxy appears to be extremely gas-poor. In the following, we first review the evidence for a paucity of interstellar gas in all its known forms (cold, hot, and warm) and then present evidence that the central diffuse ionized gas counterrotates to the stars.
3.7.1 A Remarkable Paucity of Gas
As already mentioned, the cold gas content of NGC 7727 appears to be abnormally low. In an H I study of 40 Sa galaxies, Bottinelli et al. (1980) found NGC 7727 to have an H I mass of only (converted to the distance scale, as all masses quoted here are). They remarked that this galaxy “appears highly discordant in versus and versus diagrams” of their sample, where is a galaxy’s intrinsic -band luminosity and is the mean H I surface mass density within the optical mag arcsec-2 isophote. Note that is distance independent. In both diagrams, NGC 7727 appears to have an order-of-magnitude lower H I content than other Sa galaxies of comparable luminosity. Even though Huchtmeier (1982) measured a somewhat higher mass of , he—too—found an abnormally low ratio of H I mass to optical luminosity and of H I mass to total dynamical mass, .
Given that the H I content of NGC 7727 seems to have been measured only twice and long ago (Bottinelli et al., 1980; Huchtmeier, 1982), we used data from the H I Parkes All-Sky Survey (HIPASS; Barnes et al. 2001) to check on the published values. From the publicly available HIPASS data grid,888http://www.atnf.csiro.au/research/multibeam/release/ we measured an integrated H I flux of Jy km s-1, corresponding to a mass of or about half the value measured by Bottinelli et al. (1980). Our relatively large error bars reflect the fact that some H I flux from the companion galaxy NGC 7724 (type SBab), located at projected distance from NGC 7727, may contribute to the H I flux measured for the latter. This is because the beam size of the gridded HIPASS data has a FWHM and NGC 7724 contains about 20% more H I than NGC 7727 does. Our low new value for agrees well with the value of derived from homogenized H I data and currently (2017) given in the database HyperLEDA (Paturel et al., 2003).
With the new, HIPASS-based value of we can compare the H I content of NGC 7727 to a sample of Sa, S0/a, and S0 galaxies observed at Arecibo with high sensitivity (Eder et al., 1991). The new value of for NGC 7727 falls, indeed, well below values for Sa galaxies, but is compatible with values observed in S0 and S0/a galaxies, though it is low even there. Specifically, the logarithmic value, , falls below the mean value of (single-object standard deviation) measured for Sa galaxies at Arecibo and completely outside their observed range, but falls only below the mean value of for S0/a galaxies and below that of for S0 galaxies. Overall, this comparison strongly supports the claim made by Bottinelli et al. (1980) that NGC 7727 has an abnormally low H I content for a galaxy of its type and luminosity.
This fact does not change when the molecular gas in the galaxy is included. Recent CO observations of NGC 7727 with ALMA yield a molecular-gas mass of (Ueda et al., 2014), confirming an earlier estimate of by Crabtree & Smecker-Hane (1994). Thus, the total cold gas content of this galaxy appears to be only about .
Interestingly, the hot gas ( K) content of NGC 7727 also appears to be abnormally low when compared to that of eight other well-known mergers and merger remnants (Brassington et al., 2007). After subtracting all X-ray point sources from the 19 ks exposure of NGC 7727 taken with Chandra/ACIS-S (see Section 3.1), these authors find an intrinsic X-ray luminosity for the hot diffuse gas of (0.3–6.0 keV) (adjusted to the here-adopted distance). This luminosity is a factor of 3 lower than that of the hot gas in the optically similarly luminous merger remnant NGC 7252 () and is the lowest value measured for any of the nine mergers studied. It is also at least one order of magnitude lower than values of typically observed in giant ellipticals of similar optical luminosity (Fabbiano, 1989). According to Brassington et al. (2007), the spectrum of the hot gas in NGC 7727 is well fitted by a single-component MeKaL model with a global temperature of keV (corresponding to K), a temperature similar to that observed in the other mergers studied. The hot gas itself appears rather centrally concentrated, with its detected emission extending only to about half the optical radius of the galaxy’s main body. As noted in Section 3.1, this hot gas is centered on Nucleus 1, the primary optical nucleus of NGC 7727, rather than on Nucleus 2.
Finally, NGC 7727 appears to also possess surprisingly little warm gas (104 K). The galaxy is devoid of any giant H II regions, at least out to 7 kpc () radius in its main body. This can be seen from the nice continuum-subtracted image obtained of this region by Knapen et al. (2006) with WHT on La Palma and shown in their Figure 1. The contrast with a similar image of NGC 7723, the SBb galaxy with 60% the optical luminosity of NGC 7727 in the same group (Section 1), is striking. Taken with the same telescope, filter, and exposure time, the image of NGC 7723 shows about 170 distinct giant H II regions, whereas that of NGC 7727 shows none. This severe lack of H II regions in NGC 7727 does not, per se, argue against the presence of cold or warm gas in the galaxy, but shows that—if such gas is present—star formation including massive OB stars is not currently occurring in it.
A small amount of diffuse emission near the center of NGC 7727 is suggested by the Knapen et al. (2006) image and is confirmed spectroscopically (Section 3.7.2). However, as usual the mass of such rarefied H II gas is insignificant (), even in comparison to the small total mass of in atomic and molecular hydrogen mentioned above.
In short, NGC 7727 appears to be unusually gas-poor, ranking low even when compared to S0 galaxies. This suggests that the galaxy may have experienced a gas blowout in the past, possibly associated with the event that led to a starburst in Nucleus 2 about 1.2–1.5 Gyr ago (Section 3.5), but possibly also longer ago.
3.7.2 A Counterrotating Gas Disk
Although our long-slit spectrum of NGC 7727 obtained with LDSS-3 at P.A. across the two nuclei does not fall close to either the major axis of the central body (P.A.(stars) = , Ho et al. 2011) or the minor axis, it yields interesting new information about the relative kinematics of the ionized gas and the stars.
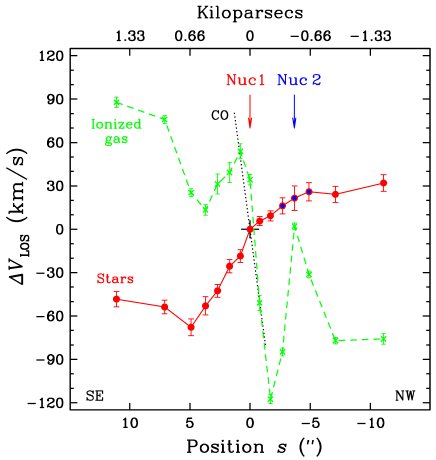
Figure 9 shows radial velocities of the ionized gas and stars, all relative to the systemic velocity of NGC 7727, plotted versus position along the slit. Since our LDSS-3 spectrum does not cover , we measured the ionized-gas velocities from the one easily visible emission line, [O III] 5007, which on our spectrum exposed for 23 minutes could be traced and measured out to (1.6 kpc) from Nucleus 1. The stellar absorption-line velocities were measured by cross-correlating spectra extracted at various positions along the slit with the spectrum of Nucleus 1, using the Mg I triplet region (5120–5540).999 The light from Nucleus 2 was not subtracted for these crosscorrelations. The striking result is that, overall, the ionized gas counterrotates to the stars, at least along the cross section at P.A. . Note that in the central region of 2 radius the ionized gas rotates at the same speed as does the molecular-gas disk, whose velocity gradient measured from the CO(1–0) line by Ueda et al. (2014) is indicated in Figure 9 by the dotted black line. This strongly suggests that in this central region the ionized gas seen in [O III] 5007 emission forms part of the rotating gas disk of NGC 7727.
Yet, the velocity profile of the ionized gas clearly shows strong local deviations from the overall rotation pattern. We believe that the velocity “dip” extending from to (200–860 pc SE) may be caused by obscuring dust that limits the visibility of the [O III] 5007 line to a foreground part of the gas disk, while the major velocity “spike” near Nucleus 2 may be caused by ionized gas associated with Nucleus 2, rather than with the rotating gas disk of NGC 7727. Clearly, deeper spectra obtained with an integral-field-unit (IFU) spectrograph will be needed to further sort out the various possible velocity components of the ionized gas (including any possible in- or outflows).
The counterrotation of the gas disk (both molecular and ionized) to the stars in the central 3 kpc region of NGC 7727 (Figure 9) is very likely real and not just limited to a cross section along P.A. . This is because the major axes of both the gas disk and the stellar light distribution essentially coincide. The major axis of the molecular-gas disk lies at P.A.(gas) (Ueda et al., 2014), while that for the major axis of the stellar distribution lies at P.A.(stars) (Ho et al., 2011). Hence, the slit P.A. of 152 used for obtaining the LDSS-3 spectrum intersected both the gas disk and the stellar body (or disk) at about the same angle of – 40 against the major axes, reducing the true rotation velocity of both structures by the same factor of for our measurements. Of course, we cannot rule out the possibility that some merger-induced chaotic motions are superposed on the central apparently disk-like rotation of the stars or, especially, on stellar motions farther out in the galaxy. Yet, counterrotation of gas to stars in galaxies has long been found to correlate with past accretion or merger events (e.g., Wardle & Knapp, 1986; Bertola et al., 1990; Schweizer, 1990; Kannappan & Fabricant, 2001). Hence, the situation in NGC 7727 clearly fits this well-established pattern.
4. DISCUSSION
The present discussion addresses various issues concerning the nature and recent history of NGC 7727 and its two nuclei. By comparing Nucleus 2 with four well-studied UCDs, we first make the case that it itself is a UCD and a smoking gun for understanding UCD formation and evolution. We then describe our search for nuclear activities in NGC 7727, finding Nucleus 1 to be a weak low-ionization nuclear emission-line region (LINER) in an old stellar population, while Nucleus 2 shows evidence for low-level AGN activity embedded in a post-starburst population. We end this discussion by reviewing the evidence that in NGC 7727 we witness the aftermath of the ingestion—over the past 2 Gyr—of a gas-rich disk companion.
4.1. Nucleus 2: A Smoking Gun for UCD Formation and Evolution
The second nucleus of NGC 7727 is a fascinating object. As described above, it shares several properties with UCDs, but also features some that are unique for a UCD so far: it is very compact ( pc) and massive (), has an elevated ratio of characteristic of massive UCDs, and features a unique post-starburst spectrum and BTS. In combination, these properties suggest that Nucleus 2 is the clearest case yet of a recently formed UCD, besides also being on a par in mass with the most massive UCD currently known, M59-UCD3 (Liu et al., 2015b).
Table 5 compares Nucleus 2 with four well-studied massive UCDs, with the objects listed in order of increasing luminosity and dynamical mass. Note that in the visual passband Nucleus 2 is about twice as luminous as M59-UCD3, in good part because of its major starburst 1.4 Gyr ago (Section 3.5). In that respect it is unique among the five objects, a testimony to its recent formation as a UCD. Because of the significant fraction (38%–50%) of its stellar mass in relatively young stars, there can be little doubt that its parent galaxy contained copious amounts of gas.
| Parameter | VUCD3aaHost galaxy is M87. | M59cO | M60-UCD1 | M59-UCD3 | NGC 7727:Nuc 2 | Units | ||
|---|---|---|---|---|---|---|---|---|
| 12.75 | 13.26 | 14.2 | 14.60 | 15.49 | mag | |||
| DistancebbDistances are from original sources; note different distances used for M59cO and M59-UCD3. | 16.5 | 16.5 | 16.5 | 14.9 | 27.4 | Mpc | ||
| ccProjected distance of object from center of its host galaxy. | 14.4 | 10.2 | 6.6 | 9.4 | 0.48 | kpc | ||
| 18 | 32 | 24 | pc | |||||
| ddVelocity difference in sense “UCD minus host galaxy,” determined from most reliable radial velocity measurements for UCD and host galaxy in the literature. | eeValue is based on velocity from Reference (5); it would be if based on velocity from Reference (4). | km s-1 | ||||||
| ffVelocity dispersion ranges are from published models, with higher value referring to object center, while single values with standard deviations refer to integrated light. | 33–53 | 29–40 | 50–100+ | km s-1 | ||||
| ggTotal dynamical mass, uncorrected for effects of SMBH. | ||||||||
| hhMass of SMBH. | – | |||||||
| iiIntrinsic X-ray luminosity in energy range 0.3–8 keV for M60-UCD1 and M59-UCD3, and 0.3–6 keV for NGC 7727:Nuc 2. | jjX-ray luminosity varies. | erg s-1 | ||||||
| AgekkAges expressed as sums represent results from two-population modeling. | 10 | Gyr | ||||||
| Tidal stream? | no | no | no | no (plume?) | yes (BTS) | |||
| 109 | 109 | (0.4–1.1) | (0.6–6) | |||||
| ReferencesllKey to references: (1) Mieske et al. (2013), (2) Strader et al. (2013), (3) Seth et al. (2014), (4) Sandoval et al. (2015), (5) Liu et al. (2015b), (6) Hou & Li (2016), (7) Ahn et al. (2017). | (1), (7) | (1), (7) | (2), (3), (6) | (4), (5), (6) | this paper |
Note. — Objects are listed in order of increasing -band luminosity.
Table 5 also shows that the projected distance of Nucleus 2 from the center of NGC 7727, kpc, is more than 12 smaller than the projected distances of any of the four UCDs from their host galaxies. In conjunction with the BTS, this small suggests that the tidal stripping is currently strong because Nucleus 2 lies physically close to the center of NGC 7727. Therefore, Nucleus 2 has not only formed recently as a UCD, but it also continues being stripped and, hence, evolving structurally and dynamically.
Yet, despite this tidal stripping, Nucleus 2 has remained very massive so far, as judged by its high , , and (Table 5). As already noted, it is on a par in mass with record-holding M59-UCD3 and well ahead of (M87-)VUCD3, M59cO, and former record holder M60-UCD1. An interesting question is whether, and for how long, Nucleus 2 will keep its high mass. Several studies of “galaxy threshing” suggest that once a galaxy has been tidally whittled down to its nucleus, the resulting UCD manages to survive for a prolonged period because of its high internal binding energy (e.g., Bassino et al., 1994; Bekki et al., 2001; Pfeffer & Baumgardt, 2013). Longevity may also be enhanced for UCDs that form in minor mergers () and for those that harbor an SMBH (e.g., Callegari et al., 2011; Van Wassenhove et al., 2012).
It is, therefore, of interest that Nucleus 2 appears to harbor an AGN, as indicated by its central X-ray source and discussed in detail in Section 4.2.2 below. This AGN is likely driven by an accreting SMBH, whose mass we estimate to lie in the range , with perhaps a most likely range of (4–8). While three of the other four UCDs listed in Table 5 also harbor SMBHs, only the two most massive ones, M60-UCD1 and M59-UCD3, exhibit possible AGN activity through weak central X-ray sources. However, the X-ray source in M60-UCD1 (Strader et al., 2013; Hou & Li, 2016) is 20 less luminous than that of Nucleus 2, while the X-ray source in M59-UCD3 (Hou & Li, 2016) is less luminous.
As various possible formation scenarios for UCDs have been sorted out, a broad consensus has emerged that extended star-formation histories or the presence of tidal streams would be powerful, “smoking gun” signatures in support of at least some UCDs having formed as nuclei stripped of their host galaxies; yet only a few such signatures have been found so far (e.g., Pfeffer & Baumgardt, 2013; Norris et al., 2015; Janz et al., 2016; Voggel et al., 2016; Hilker, 2017). Interestingly, Nucleus 2 sports both of these smoking-gun signatures in extreme forms.
Concerning an extended star-formation history, Nucleus 2 is one of only a handful of UCDs with good evidence for it. Another such UCD is M59cO, which features a bimodal age distribution for its inner and outer components, with mean ages of 5.5 and 11.5 Gyr, respectively (Table 5; from Ahn et al. 2017). Perhaps the best case published so far is NGC 4546-UCD1: its main star formation lasted from 12 Gyr to 2 Gyr ago, with some evidence that it may have continued weakly until 0.6 Gyr ago (Norris et al., 2015, esp. Fig. 3). Yet, Nucleus 2 seems more extreme: it formed nearly of its stars in the distant past ( 9–13 Gyr ago) and then the rest ( 38%) in a major starburst 1.2–1.5 Gyr ago, likely followed by a weak one 500–650 Myr ago (Section 3.5). About 1.5 Gyr ago is when its gas-rich host galaxy likely began the recent strong interaction with NGC 7727, leading to its disintegration except for the nucleus (Section 4.3 below).
Concerning a tidal stream, the BTS associated with Nucleus 2 is nearly unique among UCDs, both for its blue color and for its large extent. With its it is 0.2 mag bluer than the already-blue nucleus, and its measured extent to the NNW is 1.5 kpc, while we suspect—but cannot prove—that it also extends 1.0 kpc to the SE (Section 3.2.3). Although a number of UCDs have been found to feature minor asymmetries that may reflect tidal distortions, few have been found to be associated with clearly extended tidal streams. The best case among them so far is UCD-FORS2 (a.k.a. NGC 1399:78:12), which sports a tidal stream extending 350 pc on either side of its main body (Voggel et al., 2016). Like Nucleus 2, it is blue () and shows strong Balmer absorption lines in its spectrum (Richtler et al., 2005). However, UCD-FORS2 lies at kpc from NGC 1399 and has a luminosity of only , whence it may be an old globular cluster or the nucleus of a former dwarf galaxy in the Fornax Cluster. In either case, its blue color is likely due to low metallicity, whereas the blue color of Nucleus 2 is clearly due to the recent starburst in a former host galaxy of about solar metallicity.
In short, with its extended star-formation history, relative youth, and long BTS, Nucleus 2 really is a “smoking gun” for UCD formation and evolution!
4.2. Activity in the Two Nuclei of NGC 7727
Two questions of interest are as follows: (1) Does NGC 7727 harbor any SMBHs in its two nuclei? And (2), does either nucleus show signs of AGN activity or central star formation? The main observational surprise here is our finding that the one bright X-ray point source in the central region of the galaxy, “Source 5” detected by Brassington et al. (2007), coincides with Nucleus 2 rather than with Nucleus 1 (Section 3.1), which may point toward some AGN activity in Nucleus 2. In the following we discuss any evidence, or the lack thereof, for the presence and activity of SMBHs in both nuclei. We begin with Nucleus 1 and conclude with the more intriguing Nucleus 2.
4.2.1 Nucleus 1: A Weak LINER
An approximate expected mass for the hypothetical SMBH at the center of NGC 7727 can be estimated from the general fundamental-plane relations derived by van den Bosch (2016) as follows. From NGC 7727’s absolute -band magnitude of (Jarrett et al., 2003) we derive a luminosity of and, via the mean relation (van den Bosch, 2016) and the measured km s-1 (Section 3.4.2), a stellar mass for the galaxy of . Inserting this stellar mass and NGC 7727’s effective radius of kpc (Section 3.3) into Equation (5) by van den Bosch (2016) yields an expected SMBH mass of . Hence, Nucleus 1 is expected to host an SMBH in the mass range of –.
In a search for this SMBH, Nucleus 1 was observed with the Space Telescope Imaging Spectrograph (STIS) aboard HST on 2001 September 1 for 5 hrs (Program 9107, PI: D. Richstone), and a future paper describing it and two other program galaxies was announced (Gültekin et al., 2009). However, no mass determination for the expected SMBH has been published to date, possibly because of interpretative difficulties or the lack of supporting ground-based spectra. Hence, there is currently no direct stellar-dynamical evidence for the existence of an SMBH in Nucleus 1.
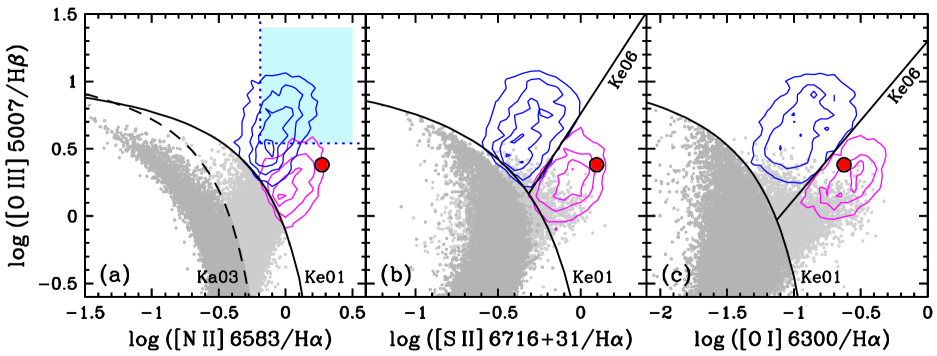
The optical spectrum of Nucleus 1 features several of the well-known emission lines from ionized gas, of which the [N II] 6583 line is the most prominent (see Figures 7 and 8). Based on the relative strength of low-ionization lines from [N II], [O I], [O II], and [S II], the nucleus was identified as a likely LINER already early on (Keel, 1983; Dahari, 1985). To check on these early assessments, we measured emission-line fluxes and widths from our MagE and LDSS-3 spectra as described in Appendix B, where line fluxes and ratios are listed in Table 6. Figure 10 shows the location of Nucleus 1 in the three standard BPT diagrams (Baldwin et al., 1981), based on our measured line ratios corrected for both Milky Way foreground reddening () and internal reddening in NGC 7727 (). As can be seen, Nucleus 1 falls into the LINER region in each of the three diagrams and is, therefore, a LINER beyond any reasonable doubt.
The measured emission lines are relatively weak, and all appear to be narrow, with—after correction for the instrumental FWHM of 58.0 km s-1—a weighted mean width of FWHM km s-1 at rest wavelength. This width corresponds to a central velocity dispersion of km s-1 for the ionized gas of Nucleus 1. Note that this dispersion is only about 2/3 of the velocity dispersion measured for the stars, km s-1 (Section 3.4.2). The difference could be due to a number of causes, including gaseous dissipation and/or the measured ionized gas lying perhaps preferentially in the foreground of the stellar nucleus. The most likely cause seems to be gaseous dissipation, since the central gas must be part of the counterrotating ionized- and molecular-gas disk described in Section 3.7.2.
Note that even after subtraction of the stellar continuum we were unable to detect any broad emission-line components, including in and . However, the wavy zero level and limited signal-to-noise ratio of the spliced and continuum-subtracted MagE spectrum did not permit any reliable multicomponent line decomposition. With this caveat expressed, we conclude that there is no evidence for any AGN activity and, hence, the presence of an SMBH in Nucleus 1 from the ionized-gas kinematics either.
What, then, does the fact that Nucleus 1 is a LINER mean in terms of central accretion and the expected presence of an SMBH? The answer is—very likely—that the ionization of the central gas is due entirely to the exclusively old stellar population of Nucleus 1 (Section 3.5), especially to its hot post-asymptotic-giant-branch (pAGB) stars, as first proposed for elliptical galaxies by Binette et al. (1994) and since demonstrated for E to Sa galaxies in many studies (e.g., Stasińska et al., 2008; Sarzi et al., 2010; Cid Fernandes et al., 2011; Yan & Blanton, 2012). There may also be significant ionization contributions from low-mass X-ray binaries (LMXBs) and diffuse X-ray-emitting plasma (Ho, 2008). As Heckman & Best (2014) nicely review, weak LINERs—defined by equivalent widths Å (Binette et al., 1994) or Å (Sarzi et al., 2010)—form the majority of all LINERs found in the Sloan Digital Sky Survey (SDSS). Their nuclear emission lines are excited neither by shocks nor by any central AGN, but mainly by the above-mentioned old stellar populations.
With its measured properties, Nucleus 1 is clearly a weak LINER. Its equivalent widths of 1.1 Å for and 0.7 Å for [O III] 5007 emission (Table 6) place it at about the upper limit, but well below the upper [O III] 5007 limit quoted above for weak LINERs. Also, the spatial extent of its low-ionization emission lines over several arcseconds in radius (0.5–1 kpc) supports the notion that its ionization sources are spatially extended themselves, whether they be pAGB stars, LMXBs, or X-ray plasma. And third, the Chandra observations by Brassington et al. (2007) do not show any X-ray point source coincident with Nucleus 1 (Section 3.1). Therefore, we lack any evidence of central AGN activity, a central SMBH, or central star formation (Section 3.5) in Nucleus 1. This, of course, does not in any way prove the absence of an SMBH there. Such an SMBH may well exist, but may currently not be accreting or may be heavily obscured.
4.2.2 Nucleus 2: Evidence for an AGN
Although Nucleus 2 has been reduced to UCD status and is still being tidally stripped, it shows at least three signs of recent activity: a post-starburst spectrum, a high-excitation emission-line spectrum, and a luminous X-ray source.
The marked post-starburst spectrum of Nucleus 2 (Fig. 6) points to a relatively recent burst of star formation, with a light-weighted mean age of Gyr and having produced about 1/3 to 1/2 of the present stellar mass (Section 3.5). Although it remains unclear whether a second, much weaker burst of star formation occurred 500–650 Myr ago, there is little question that the entire starburst episode involved significant amounts of gas, at least the several times necessary to produce the currently observed mass of in intermediate-age stars. Presumably, this gas was funneled by tidal torques toward the center of the infalling companion galaxy during its close approaches to NGC 7727, a process well known to occur in strongly interacting galaxies (e.g., Toomre & Toomre, 1972; Noguchi, 1988; Barnes & Hernquist, 1996). Hence, it should not surprise if the same supply of gas also fed an SMBH possibly residing at the center of the infalling companion (e.g., Hopkins & Quataert, 2010).
There is some spectroscopic evidence that Nucleus 2 may indeed be experiencing AGN activity. Based on its measured emission lines (Table 6), Figure 10(a) shows the area (shaded in light blue) where Nucleus 2 is likely to fall in the main BPT diagram that displays the excitation ratio [O III] 5007/ versus the ratio [N II] 6583/ (Baldwin et al., 1981). Although we were unable to measure the flux of the emission line itself, we determined an upper limit for it, leading to a lower limit of (or logarithmically) for the excitation ratio (Table 6). This limit, shown as a horizontal dotted blue line in Figure 10(a), strongly points to Nucleus 2 lying in Seyfert territory, which is outlined by blue isopleths representing 5074 Seyfert galaxies with high S/N-ratio spectra (Fu & Stockton, 2009).
Since an emission-line flux for could not be measured either, we estimated an upper limit for it from the upper limit for and a Balmer decrement of 3.1, assuming no internal extinction in Nucleus 2.101010 Given the blue color of Nucleus 2, (Table 3), this assumption seems justified. This limit yields a lower limit of (or logarithmically), marked by a vertical dotted blue line in Figure 10(a). Although this lower limit could move to the left (i.e., lower) if there were significant internal extinction in Nucleus 2, it would not affect our conclusion that the elevated value of [O III] 5007/ places this nucleus in Seyfert territory. The inferred AGN nature of Nucleus 2 will have to be checked via well-calibrated new spectra of higher S/N ratio, permitting better modeling and subtraction of the underlying starlight. The prediction is that such spectra should feature some broader lines (or line components) characteristic of AGNs.
The strongest evidence for a weak AGN in Nucleus 2 may be the X-ray point source named “Source 5” by Brassington et al. (2007), which coincides to within with the optical center of the nucleus (Section 3.1). Although the intrinsic X-ray luminosity of this source is relatively low, (0.3-6.0 keV) (for Mpc), it does place Source 5 in the category of Ultraluminous X-ray (ULX) sources, defined as having based on assumed isotropic emission (e.g., Fabbiano, 1989, 2006; Kaaret et al., 2017). Such sources exceed the Eddington limit for a 10 black hole and have long been surmised to be associated with black holes of intermediate mass (IMBHs; ). Yet recently some of them have been found to be associated with accreting neutron stars (Bachetti et al., 2014; Kaaret et al., 2017) and others with UCDs (e.g., Soria et al., 2010; Kim et al., 2015; Irwin et al., 2016). Hence, their X-ray luminosities alone do not establish them unambiguously as AGNs.
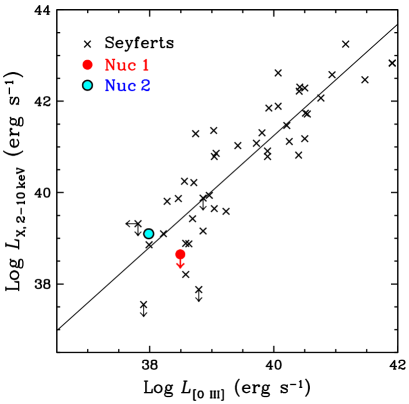
However, for a ULX that lies close to the center of a galactic nucleus or UCD, one way to check on suspected AGN activity is via the well-known correlation between the X-ray and [O III] 5007 luminosities of AGNs, which holds over a range of at least (Mulchaey et al., 1994; Bassani et al., 1999; Heckman et al., 2005; Panessa et al., 2006). Figure 11 shows that Nucleus 2 (blue dot) falls close to the mean relation determined for 45 local Seyfert galaxies by Panessa et al. (2006), near the relation’s low-luminosity end. Since the X-ray luminosities of the Seyfert galaxies were measured in the 2–10 keV energy band, we converted the (0.3–6.0 keV) of Nucleus 2 (Brassington et al., 2007) to (2–10 keV) via the photon index measured by the same authors. To determine the nucleus’s [O III] 5007 luminosity, we used the flux measured with MagE (Table 6) and corrected for Milky-Way foreground extinction, leading to . Clearly, this for Nucleus 2 agrees well with the of Source 5 and the expected relative X-ray and [O III] luminosities of Seyfert galaxies. This greatly strengthens the case for Source 5 being a low-luminosity AGN at the center of Nucleus 2, rather than an accreting neutron star or stellar black hole.
For comparison, an upper limit of (2–10 keV) determined from the Chandra data for Nucleus 1 places this primary nucleus (red dot) clearly below the mean relation for local Seyfert galaxies, in agreement with our conclusion above that it is currently inactive (Section 4.2.1).
Returning to Nucleus 2, note that with a photon index of (Brassington et al., 2007) its X-ray spectrum is unusually soft, suggesting that the inferred AGN is in a high/soft state. This state agrees with the absence of any detectable radio point source at the location of Nucleus 2 in the 3-mm continuum map (Ueda et al., 2014), since AGNs in the high/soft state are well known to be radio quiet (e.g., Svoboda et al., 2017, and references therein).
The mass of the SMBH causing the observed low-level AGN activity in Nucleus 2 is of great interest and can—despite the lack of spatially resolved kinematic information—be bracketed approximately as follows.
First, assume that Nucleus 2 is a bulge-like stellar system in equilibrium, with measured km s-1 (Table 4). The – relation then yields an estimated black hole mass of when computed with Equation (2) by van den Bosch (2016), or one of when computed with Equation (7) by Kormendy & Ho (2013). Since until recently Nucleus 2 was part of a more massive galaxy, we take these two values to represent a likely lower limit in the range of (2–5).
Second, assume that the only reason why the dynamical and stellar masses of Nucleus 2 differ is the presence of an SMBH. Then the difference sets an upper limit to the mass of this SMBH, .
In short, taking the various uncertainties into account, we estimate that probably lies in the range . Although this range is large, it does suggest that the SMBH of Nucleus 2 is at least comparable in mass to that of our own Galaxy (), and possibly an order of magnitude more massive. Specifically, if were to contain 10%–20% of the dynamical mass of Nucleus 2, as has been found for the SMBHs in two massive UCDs of the Virgo Cluster (Ahn et al., 2017), its range would narrow to what we consider more likely values of .
4.3. NGC 7727: The Aftermath of Ingesting a Gas-Rich Disk Companion
In trying to unravel NGC 7727’s recent merger history, we rely on the assumption that its complex structure resulted entirely from one (or possibly two) merger event(s), and not from any tidal interaction with one of the other two main members of this small group. This assumption seems well justified. Based on their relative -band luminosities, NGC 7724 at kpc to the WNW has an of only 9% that of NGC 7727 and itself shows no tidal damage (Figure 2), while the 11 more massive protagonist shows plenty of it. And similarly, NGC 7723 at kpc to the SSW has an of 58% that of NGC 7727, yet itself shows no tidal damage, even on deep exposures. Hence, the history of recent gravitational interactions must be buried in NGC 7727 itself.
A helpful clue is the presence of various blue structures and point-like sources in NGC 7727’s main body in addition to the blue Nucleus 2 and BTS. Foremost are the two major blue arcs described in Section 3.2.1 (Arc 1 and 2), several fainter bluish arcs and shells visible on color-index maps (Ho et al., 2011), and a few dozen star clusters and associations of intermediate age (Crabtree & Smecker-Hane, 1994; Trancho et al., 2003). Whereas the compact star clusters are spread throughout the main body, the associations seem to be located preferentially in blue arcs. A combination of HST photometry and ground-based photometry shows that the compact clusters have ages of Gyr and about solar metallicities (Trancho et al., 2014). Together with Nucleus 2 and its BTS, these various forms of bluish detritus in the otherwise reddish main body of NGC 7727 suggest strongly that we are observing the shredded remains of a gas-rich disk companion that fell into NGC 7727 within the past 2 Gyr.
Knowing the stellar mass of this former companion, host to Nucleus 2, is of interest both in absolute terms and relative to the mass of NGC 7727. Yet any direct estimate of this mass, for example by summing up the various bluish components listed above, is well beyond what our limited data permit. Instead, we use the estimated mass range for the SMBH of Nucleus 2, (Section 4.2.2), to estimate the range of via the – relation (Kormendy & Ho, 2013, Equation (10)). The resulting stellar mass range for the bulge of the former companion is . For comparison, the stellar mass of NGC 7727, estimated from the galaxy’s luminosity and km s-1, is . Hence, the stellar-mass ratio between the bulge of the former companion and NGC 7727 likely lies in the range . Note, however, that since the companion clearly possessed a stellar disk of significant mass in addition to its bulge, a more likely range of mass ratios for the entire companion is (assuming a disk twice as massive as the bulge). By itself, this range suggests that the merger involving the companion hosting Nucleus 2 may have been a minor merger of at least 5% the mass of NGC 7727 up to—possibly—a major merger ().
If, instead of using the full estimated mass range for the SMBH of Nucleus 2 (as done above), we use the more restricted range of its likely mass, (Section 4.2.2), the estimated bulge mass of the former companion becomes , and the corresponding mass ratio for the entire companion becomes (again for D/B ). In that case, the merger involving the host galaxy of Nucleus 2 lies in the transition region between minor and major mergers.
This conclusion agrees with the impression one gets from visual inspection of NGC 7727 images that this messy merger involved two rather massive disk galaxies. Specifically, it agrees with the W Tail appearing to be about 2–3 less luminous than the E Tail, yet of similar color, which might imply a companion 2–3 less massive than the main participant galaxy. Yet, since we cannot directly link the W Tail to the blue arcs and bluish detritus, we cannot currently exclude the possibility that a third galaxy was involved—as an early player—in a triple merger. Nevertheless, the solar metallicity of Nucleus 2 (Section 3.6) and the plentiful detritus make a strong case for the host galaxy of this nucleus having been a relatively massive and gas-rich disk companion, and certainly not a nucleated dwarf elliptical!
The current spatial position and orbit of Nucleus 2 relative to Nucleus 1 are crucial parameters for any successful future simulation of this late-stage merger system. Some limited information is currently available. Because of their blue color, Nucleus 2 and the BTS very likely lie between us and the sky plane containing Nucleus 1, with the surmised SSE leg of the BTS cutting right across the center of NGC 7727. Interestingly, the position angle of the BTS to the NNE, P.A.(BTS) , agrees closely with that between the two optical nuclei, P.A.(21) . Since models of tidal stripping show that tidal streams following and preceding dense star clusters tend to align with the projected orbit rather closely (Odenkirchen et al., 2003; Lux et al., 2013), this suggests that we may be seeing the orbital plane of Nucleus 2 nearly edge-on and at P.A. . Given the measured small km s-1 between Nucleus 2 and Nucleus 1 (Section 3.4.2), our inference that Nucleus 2 probably lies physically close to Nucleus 1 (Section 4.1), and the nearly edge-on view of the orbit, we tentatively conclude that (1) Nucleus 2 lies probably close to its orbit’s present pericenter, and (2) its tangential velocity probably exceeds 100 km s-1.
Given Nucleus 2’s current near-pericentric position and its past one or two starbursts (Section 3.5)—each presumably triggered by a pericentric passage—the present orbital period is probably either 1.4 Gyr, if there was a single starburst, or 0.6 Gyr, if there were two. In either case, the present osculating orbit is likely to be highly eccentric, if our guess is correct that Nucleus 2 lies physically close to Nucleus 1 (say, kpc).111111 For comparison, in our Galaxy the period of an object in circular orbit at the sun’s distance of 8.2 kpc from the center is a mere 0.21 Gyr (for km s-1; see Bland-Hawthorn & Gerhard 2016). The true physical separation between the two nuclei and the direction of motion of Nucleus 2 (to the SSE versus NNW) are perhaps the two most important orbital parameters still missing, but needed to reconstruct the recent history of this late-stage merger.
In short, the one firm conclusion is that until about 2 Gyr ago the NGC 7727 group contained at least four major disk galaxies, of which one harbored Nucleus 2. This gas-rich companion was likely 1/20 – 1/2 as massive as then-NGC 7727 itself and experienced strong gas flows into its center as it interacted gravitationally with NGC 7727. By now most of its disk and bulge has been tidally shredded, leaving its nucleus as a freshly formed and still evolving UCD within NGC 7727.
5. SUMMARY
We have described imaging, photometric, and spectroscopic observations of NGC 7727 (Arp 222), a late-stage merger and dominant member in a nearby small group of galaxies. The observations include images taken with HST/WFPC2 and with the du Pont 2.5 m telescope at Las Campanas Observatory, as well as long-slit spectra obtained there with the LDSS-3 and MagE spectrographs on the Clay 6.5 m telescope. Although hitherto known mainly as an abnormally gas-poor Sa pec galaxy, NGC 7727 features within its complex disturbed body young massive star clusters and a bright second nucleus that has often been mistaken for a Milky Way foreground star.
The main results of our observations and analysis are as follows:
1. NGC 7727 is relatively luminous ( for km s-1 Mpc-1) and located at a distance of 27.4 Mpc ( km s-1) in Aquarius (). Besides a disturbed main body rich in fine structure, it features one prominent tidal tail of projected length 60 kpc, a second, shorter tidal tail, various bluish arcs and luminous star clusters, and two bright nuclei separated by 483 pc in projection near its center, where a small molecular- and ionized-gas disk counterrotates to the stars. Its stellar mass is . Except for the presence of a second nucleus, it shares many properties with recent merger remnants.
2. The two nuclei of NGC 7727 differ in radial velocity by only km s-1, yet are strikingly different. Nucleus 1 appears to fit smoothly into the central luminosity profile of the galaxy, has spectral features characteristic of a weak LINER in an old stellar population, and shows—so far—no signs of AGN activity at X-ray, optical, and radio wavelengths, appearing instead as “red and dead” as can be. In contrast, Nucleus 2—which appears clearly offset from the center—is very compact ( pc), has a tidal-cutoff radius of 103 pc, and shows at least three signs of recent activity: a post-starburst spectrum, an [O III] 5007 emission line indicative of high excitation, and a luminous X-ray source of (0.3–6.0 keV) . Its spectral line ratios place it among Seyfert nuclei, although direct evidence in the form of broad emission lines is currently lacking. The stellar velocity dispersions of the two nuclei are km s-1 and km s-1, respectively, with significantly higher than expected for Nucleus 2, given the nucleus’s luminosity of and stellar mass of .
3. A comparison of Nucleus 2 with well-studied UCDs suggests that it may be the best case yet for a massive UCD having formed recently through tidal stripping of a gas-rich disk galaxy. Evidence for this comes from its extended star-formation history, 1.5 kpc long blue tidal stream (BTS), and elevated ratio of dynamical to stellar mass, , a characteristic of massive UCDs. With , Nucleus 2 is slightly more massive than M59-UCD3, the most massive UCD known so far. While the majority of its stars formed in the distant past ( 10 Gyr), 38%–50% of them by mass formed during one or two starbursts in the past 2 Gyr. Its weak AGN activity is likely driven by an SMBH of mass , with a most likely range of perhaps (4–8).
4. The combined morphological and kinematic evidence suggests that NGC 7727 experienced one or perhaps two mergers during the past few Gyr. The most recent merger involved a gas-rich disk companion and began about 2 Gyr ago, leading to strong gas inflows and one or two starbursts at the center of the companion, as recorded in the post-starburst spectrum of Nucleus 2. The initial mass of this accreted companion was probably between 1/20th and 1/2 that of then-NGC 7727, making for a likely minor merger or—possibly—one near the minor/major merger boundary (). By now most of this former companion has been shredded, leaving behind various forms of blue detritus (BTS, arcs, young clusters) and Nucleus 2 as a freshly minted UCD. This UCD likely moves on a highly eccentric orbit of period 0.6 Gyr (or 1.4 Gyr) and may currently be close to pericenter. The persistence of Nucleus 2 makes NGC 7727 a late-stage merger rather than a merger remnant.
5. Before its most recent merger, NGC 7727 was likely an S0 galaxy. It is the blue detritus of the infallen companion that earned this galaxy an Sa pec classification from the classifiers. Clearly, a mild rejuvenation of the stellar populations took place. A mystery remains why NGC 7727 is so gas-poor and Nucleus 1 appears so inactive. To improve our understanding of the assembly history of this galaxy, kinematic mapping of the stars and gas will be essential. Note that even at only five times its distance, say , figuring out the details of this likely minor, but significant, merger would have been extraordinarily difficult.
Appendix A A. DETAILS ABOUT MASKED IMAGES
Three of the images illustrating the fine structure of NGC 7727 in the present paper—Figures 2(a), 2(b), and 3(c)—have been digitally masked to enhance the visibility of faint small-scale features relative to the strongly varying surface brightness of the galaxy. This appendix provides some details about the adopted algorithms that—at least in part—imitate the “unsharp masking” technique often used for photographic reproductions in the past (e.g., Sandage & Miller, 1964; Mees & James, 1966; Malin, 1977). The main goal of unsharp masking was to diminish large-scale background variations by superposing a photographic negative with an out-of-focus (“unsharp”) positive copy of it and making a photographic print from the negative + positive sandwich placed in an enlarger. This process can be imitated digitally in various ways (e.g., Schweizer & Ford, 1985; Schweizer & Seitzer, 1988; Berry & Burnell, 2005) or can be replaced by the digital subtraction of—or division by—a model light distribution derived from the galaxy image (e.g., Fort et al. 1986; Jedrzejewski 1987; Prieur 1988; and many since).
Figures 2(a) and 2(b) were both produced from the same composite -band image of NGC 7727 obtained with the du Pont 2.5 m telescope (Section 2.1.2) and shown directly (i.e., unmasked) at two different contrasts in Figures 2(c) and 2(d). To produce a mask for them, the -band image was first cleaned of bright stars and Nucleus 2 by local interpolation with the IRAF task imedit. The “mask” was then computed by running a circular median filter of 10″ radius across the precleaned image with task rmedian.121212 Various filter sizes and shapes were tried, with a filled circular median filter of 10″ radius yielding the best displays as judged visually. The resulting smoothed mask image was combined with the original image in two different ways. In Figure 2(a) the original image was divided by the mask image raised to the power of 0.95, while in Figure 2(b) the mask image was first multiplied by 0.90 and then subtracted from the original image. Both techniques accomplish partial masking of the original image and aim at preserving a small fraction of the original brightness gradient in the galaxy image, while enhancing the visibility of fine-structure details. Whereas the division-masked Figure 2(a) shows the inner fine structure better than the subtraction-masked Figure 2(b), the latter shows the outer fine structure at higher contrast. Nevertheless, these two masked versions of the original image of NGC 7727 correspond to each other in considerable detail, emphasizing that the depicted fine structure is real and relatively independent of details in the adopted masking algorithms.
Figure 3(c) was produced from the PC image of NGC 7727 obtained with HST/WFPC2 (Section 2.1.1). This image is implicitly shown in Figure 3(a), which is a color rendition based on the PC and images. To produce a mask for it, the original image was first cleaned of a bright star by linear interpolation with IRAF task imedit and then smoothed by running a circular median filter of radius across it with rmedian. The chosen 2″ radius was sufficiently large to remove not only some point-like sources (globular clusters in NGC 7727 and faint foreground stars), but also the entire Nucleus 2, which is very compact (see Section 3.3). Since the resulting smoothed image still showed some pixelated noise, it was slightly smoothed further by convolving it with a 2D Gaussian function of and limiting radius to form the final mask. The original image was then divided by this mask (this time without exponentiation) to produce the “unsharply masked” image shown in Figure 3(c).
Appendix B B. EMISSION-LINE SPECTRA OF NUCLEI
In support of our discussion of possible AGN activity in the nuclei (Section 4.2), we measured emission-line widths, equivalent widths, and fluxes for each nucleus from our spectra. The main challenge was—in both nuclei—the weakness of the ionized-gas emission lines relative to the underlying bright absorption-line spectrum of the stars.
For Nucleus 1, the broad wavelength coverage of the MagE spectrum permitted measuring the [O II] 3727 doublet and the five , [N II], and [S II] lines, none of which are covered by the LDSS-3 spectrum. However, since for technical reasons we could not reliably flux-calibrate the MagE spectrum, we had to measure emission-line equivalent widths from its continuum-normalized version (Fig. 7) and then convert these widths to line fluxes via the flux-calibrated continuum of our LDSS-3 spectrum (Fig. 8). We did this using slight extrapolations at both ends of the LDSS-3 spectrum, helped by a published spectrum of NGC 7727 (Liu & Kennicutt, 1995). A crucial step to reveal and measure the fainter emission lines was the subtraction of the stellar background spectrum. After some experimentation, and lacking an early-type galaxy spectrum taken with MagE, we subtracted a continuum-normalized spectrum of the G8 III star HD 165760 obtained with MagE on the same night (Fig. 7). To achieve proper subtraction, this spectrum was first convolved with the stellar velocity dispersion measured for Nucleus 1, km s-1, before being subtracted.131313 The spectrum of a K2 III star might have produced a slightly better match, but was not obtained with MagE.
For Nucleus 2, we followed a similar procedure. However, we were unable to subtract the stellar continuum from the normalized MagE spectrum, which is seriously noisy owing to the preceding subtraction of the NGC 7727 background (Section 3.4). As a result, we were able to determine only an upper limit for the flux of the emission line, which is buried in the noisy absorption trough of the post-starburst spectrum (Figs. 6 and 7). The one reliably measured emission feature in Nucleus 2 was the [O III] 5007 line, whose equivalent width and flux strongly peak at the center. For completeness we also measured the [N II] 6583 line, although its flux appears not particularly peaked toward the center of Nucleus 2 and may be contaminated by emission from the ionized-gas disk surrounding Nucleus 1 (Section 3.7.2).
| Ion | Line | aaEquivalent width measured from the normalized MagE spectrum through an aperture of ( pc). | Flux bbObserved flux computed from measured MagE equivalent width and LDSS-3 continuum, in units of erg s-1 cm-2. | ccRatio of fluxes corrected for Milky Way foreground extinction of . | ddRatio of fluxes corrected for total (Milky Way plus internal) extinction . Available only for Nucleus 1, where . | FWHMeeLine widths determined from Gaussian fits and corrected for instrumental broadening; typical errors are %. | ||
|---|---|---|---|---|---|---|---|---|
| (Å) | ( cgs) | (km s-1) | ||||||
| Nucl. 1: | ||||||||
| [O II] | 3727 | |||||||
| 4861 | 282 | |||||||
| [O III] | 5007 | 326 | ||||||
| [O I] | 6300 | 298 | ||||||
| [N II] | 6548 | 271 | ||||||
| 6563 | 298 | |||||||
| [N II] | 6583 | 300 | ||||||
| [S II] | 6716 | 270 | ||||||
| [S II] | 6731 | 283 | ||||||
| Nucl. 2: | ||||||||
| 4861 | ||||||||
| [O III] | 5007 | 226 | ||||||
| [N II] | 6583 | 194 |
Note. — Errors are measuring errors and their propagations. Systematic flux errors are larger, but do not affect flux ratios (see text).
Table 6 presents our measured equivalent widths and computed line fluxes and flux ratios to . For Nucleus 1, the flux ratio corrected for Milky Way foreground reddening,
yielded—when compared to the ratio of 3.1 for a Case B spectrum for K and low density (Osterbrock & Ferland, 2006)—an internal visual extinction of within NGC 7727. Although relatively large, this value is not surprising given the many strong dust lanes and patches visible near the nucleus (Figure 3). The penultimate column of Table 6 gives the fully reddening-corrected (), intrinsic line ratios relative to , . For Nucleus 2, our inability to detect and measure and line emission deprives us of a measure of its total extinction, whence we cannot derive intrinsic line ratios. Finally, the last column of Table 6 gives line widths measured at half-maximum and corrected for instrumental broadening.
References
- Allington-Smith et al. (1994) Allington-Smith, J., Breare, M., Ellis, R., et al. 1994, PASP, 106, 983
- Ahn et al. (2017) Ahn, C. P., Seth, A. C., den Brok, M., et al. 2017, ApJ, 839, 72
- Arp (1966) Arp, H. 1966, Atlas of Peculiar Galaxies (California Institute of Technology, Pasadena); also: ApJS, 14, 1
- Bachetti et al. (2014) Bachetti, M., Harrison, F. A., Walton, D. J., et al. 2014, Nature, 514, 202
- Baldwin et al. (1981) Baldwin, J. A., Phillips, M. M., & Terlevich, R. 1981, PASP, 93, 5 (BPT)
- Barnes et al. (2001) Barnes, D. G., Staveley-Smith, L., de Blok, W. J. G., et al. 2001, MNRAS, 322, 486
- Barnes & Hernquist (1992) Barnes, J. E., & Hernquist, L. 1992, ARA&A, 30, 705
- Barnes & Hernquist (1996) Barnes, J. E., & Hernquist, L. 1996, ApJ, 471, 115
- Bassani et al. (1999) Bassani, L., Dadina, M., Maiolino, R., et al. 1999, ApJS, 121, 473
- Bassino et al. (1994) Bassino, L. P., Muzzio, J. C., & Rabolli, M. 1994, ApJ, 431, 634
- Bekki et al. (2001) Bekki, K., Couch, W. J., & Drinkwater, M. J. 2001, ApJ, 552, L105
- Bell (2006) Bell, E. F. 2006, in Planets to Cosmology: Essential Science in Hubble’s Final Years, ed. M. Livio & S. Casertano (Cambridge: Cambridge Univ. Press), 137 (arXiv:astro-ph/0408023)
- Berry & Burnell (2005) Berry, R., & Burnell, J. 2005, The Handbook of Astronomical Image Processing (Richmond, VA: Willmann-Bell), Sections 14.3 and 14.4
- Bertola et al. (1990) Bertola, F., Bettoni, D., Buson, L. M., & Zeilinger, W. W. 1990, in Dynamics and Interactions of Galaxies, ed. R. Wielen (Berlin: Springer), 249
- Binette et al. (1994) Binette, L., Magris, C. G., Stasińska, G., & Bruzual, A. G. 1994, A&A, 292, 13
- Bland-Hawthorn & Gerhard (2016) Bland-Hawthorn, J., & Gerhard, O. 2016, ARA&A, 54, 529
- Bottinelli et al. (1980) Bottinelli, L., Gouguenheim, L., & Paturel, G. 1980, A&A, 88, 32
- Brassington et al. (2007) Brassington, N. J., Ponman, T. J., & Read, A. M. 2007, MNRAS, 377, 1439
- Brodie et al. (2011) Brodie, J. P., Romanowsky, A. J., Strader, J., & Forbes, D. A. 2011, AJ, 142, 199
- Bruzual & Charlot (2003) Bruzual, G., & Charlot, S. 2003, MNRAS, 344, 1000 (BC03)
- Busko (1996) Busko, I. C. 1996, in ASP Conf. Ser. 101, Astronomical Data Analysis Software and Systems V, ed. G. H. Jacoby & J. Barnes (San Francisco, CA: ASP), 139
- Callegari et al. (2011) Callegari, S., Kazantzidis, S., Mayer, L., et al. 2011, ApJ, 729, 85
- Cardelli et al. (1989) Cardelli, J. A., Clayton, G. C., & Mathis, J. S. 1989, ApJ, 345, 245
- Carlin et al. (2016) Carlin, J. L., Beaton, R. L., Martínez-Delgado, D., & Gabany, R. J. 2016, in Astrophysics and Space Science Library, Vol. 420, Tidal Streams in the Local Group and Beyond, ed. H. J. Newberg & Carlin, J. L. (Springer International Publishing AG Switzerland), 219
- Carter (1978) Carter, D. 1978, MNRAS, 182, 797
- Chabrier (2003) Chabrier, G. 2003, PASP, 115, 763
- Chonis et al. (2011) Chonis, T. S., Martínez-Delgado, D., Gabany, R. J., et al. 2011, AJ, 142, 166
- Cid Fernandes et al. (2005) Cid Fernandes, R., Mateus, A., Sodré, L., Stasińska, G., & Gomes, J. M. 2005, MNRAS, 358, 363
- Cid Fernandes et al. (2007) Cid Fernandes, R., Asari, N. V., Sodré, L., et al. 2007, MNRAS, 375, L16
- Cid Fernandes et al. (2009) Cid Fernandes, R., Schoenell, W., Gomes, J. M., et al. 2009, RevMexAA Conf. Ser., 35, 127
- Cid Fernandes et al. (2011) Cid Fernandes, R., Stasińska, G., Mateus, A., & Vale Asari, N. 2011, MNRAS, 413, 1687
- Crabtree & Smecker-Hane (1994) Crabtree, D. R., & Smecker-Hane, T. 1994, BAAS, 26, 1499
- Crook et al. (2007) Crook, A. C., Huchra, J. P., Martimbeau, N., et al. 2007, ApJ, 655, 790
- Dahari (1985) Dahari, O. 1985, ApJS, 57, 643
- de Vaucouleurs & de Vaucouleurs (1964) de Vaucouleurs, G., & de Vaucouleurs, A. 1964, Reference Catalogue of Bright Galaxies (Austin, TX: Univ. Texas Press)
- de Vaucouleurs et al. (1991) de Vaucouleurs, G., de Vaucouleurs, A., Corwin, H. G., et al. 1991, Third Reference Catalogue of Bright Galaxies (Berlin: Springer)
- Dressler & Gunn (1983) Dressler, A., & Gunn, J. E. 1983, ApJ, 270, 7
- Drinkwater et al. (2000) Drinkwater, M. J., Jones, J. B., Gregg, M. D., & Phillipps, S. 2000, PASA, 17, 227
- Duc et al. (2015) Duc, P.-A., Cuillandre, J.-C., Karabal, E., et al. 2015, MNRAS, 446, 120
- Eder et al. (1991) Eder, J., Giovanelli, R., & Haynes, M. O. 1991, AJ, 102, 572
- Fabbiano (1989) Fabbiano, G. 1989, ARA&A, 27, 87
- Fabbiano (2006) Fabbiano, G. 2006, ARA&A, 44, 323
- Faber (1973) Faber, S. M. 1973, ApJ, 179, 423
- Faber & Jackson (1976) Faber, S. M., & Jackson, R. E. 1976, ApJ, 204, 668
- Faber et al. (2007) Faber, S. M., Willmer, C. N. A., Wolf, C., et al. 2007, ApJ, 665, 265
- Forbes et al. (2014) Forbes, D. A., Norris, M. A., Strader, J., et al. 2014, MNRAS, 444, 2993
- Fort et al. (1986) Fort, B. P., Prieur, J.-L., Carter, D., Meatheringham, S. J., & Vigroux, L. 1986, ApJ, 306, 110
- Franx (1993) Franx, M. 1993, ApJ, 407, L5
- Freedman & Madore (2010) Freedman, W. L., & Madore, B. F. 2010, ARA&A, 48, 673
- Frenk & White (2012) Frenk, C. S., & White, S. D. M. 2012, Ann. der Phys., 524, 507
- Fu & Stockton (2009) Fu, H., & Stockton, A. 2009, ApJ, 690, 953
- Gültekin et al. (2009) Gültekin, K., Richstone, D., Gebhardt, K., et al. 2009, ApJ, 695, 1577
- Haines et al. (2015) Haines, T., McIntosh, D. H., Sánchez, S. F., Tremonti, C., & Rudnick, G. 2015, MNRAS, 451, 433
- Harris (2010) Harris, W. E. 2010, arXiv:1012.3224v1
- Haşegan et al. (2005) Haşegan, M., Jordán, A., Côté, P., et al. 2005, ApJ, 627, 203
- Heckman et al. (2005) Heckman, T. M., Ptak, A., Hornschemeier, A., & Kauffmann, G. 2005, ApJ, 634, 161
- Heckman & Best (2014) Heckman, T. M., & Best, P. N. 2014, ARA&A, 52, 589
- Hilker (2017) Hilker, M. 2017, in IAU Symp. 316, Formation, Evolution, and Survival of Massive Star Clusters, ed. C. Charbonnel & A. Nota (Cambridge, UK: Cambridge Univ. Press), 99
- Hilker et al. (1999) Hilker, M., Infante, L., Vieira, G., Kissler-Patig, M., & Richtler, T. 1999, A&AS, 134, 75
- Ho (2008) Ho, L. C. 2008, ARA&A, 46, 475
- Ho et al. (2011) Ho, L. C., Li, Z.-Y., Barth, A. J., Seigar, M. S., & Peng, C. Y. 2011, ApJS, 197, 21
- Hopkins et al. (2013) Hopkins, P. F., Cox, T. J., Hernquist, L., et al. 2013, MNRAS, 430, 1901
- Hopkins et al. (2006) Hopkins, P. F., Hernquist, L., Cox, T. J., Di Matteo, T., Robertson, B., & Springel, V. 2006, ApJS, 163, 1
- Hopkins et al. (2008) Hopkins, P. F., Hernquist, L., Cox, T. J., & Keres, D. 2008, ApJS, 175, 356
- Hopkins & Quataert (2010) Hopkins, P. F., & Quataert, E. 2010, MNRAS, 407, 1529
- Hou & Li (2016) Hou, M., & Li, Z. 2016, ApJ, 819, 164
- Hubble (1926) Hubble, E. 1926, ApJ, 64, 321
- Huchtmeier (1982) Huchtmeier, W. K. 1982, A&A, 110, 121
- Irwin et al. (2016) Irwin, J. A., Maksym, W. P., Sivakoff, G. R., et al. 2016, Nature, 538, 356
- Jacoby et al. (1984) Jacoby, G. H., Hunter, D. A., & Christian, C. A. 1984, ApJS, 56, 257
- Janz et al. (2016) Janz, J., Norris, M. A., Forbes, D. A., et al. 2016, MNRAS, 456, 617
- Jarrett et al. (2003) Jarrett, T. H., Chester, T., Cutri, R., Schneider, S. E., & Huchra, J. P. 2003, AJ, 125, 525
- Jedrzejewski (1987) Jedrzejewski, R. I. 1987, MNRAS, 226, 747
- Jenkner et al. (2010) Jenkner, H., Miller, W. W., III, & Whitmore, B. C. 2010, in The Impact of HST on European Astronomy, ed. F. D. Macchetto (Berlin: Springer), 281
- Kaaret et al. (2017) Kaaret, P., Feng, H., & Roberts, T. P. 2017, ARA&A, 55, 303
- Kannappan & Fabricant (2001) Kannappan, S. J., & Fabricant, D. G. 2001, AJ, 121, 140
- Karachentsev & Makarov (1996) Karachentsev, I. D., & Makarov, D. A. 1996, AJ, 111, 794
- Kauffmann et al. (2003) Kauffmann, G., Heckman, T. M., Tremonti, C., et al. 2003, MNRAS, 346, 1055
- Keel (1983) Keel, W. C. 1983, ApJS, 52, 229
- Kelson et al. (2000) Kelson, D. D., Illingworth, G. D., van Dokkum, P. G., & Franx, M. 2000, ApJ, 531, 159
- Kelson (2003) Kelson, D. D. 2003, PASP, 115, 688
- Kennicutt et al. (1998) Kennicutt, R. C., Barnes, J. E., & Schweizer, F. 1998, Galaxies: Interactions and Induced Star Formation, ed. D. Friedli, L. Martinet, & D. Pfenniger (Berlin: Springer)
- Kewley et al. (2001) Kewley, L. J., Dopita, M. A., Sutherland, R. S., Heisler, C. A., & Trevena, J. 2001, ApJ, 556, 121
- Kewley et al. (2006) Kewley, L. J., Groves, B., Kauffmann, G., & Heckman, T. 2006, MNRAS, 372, 961
- Kim et al. (2015) Kim, M., Ho, L. C., Wang, J., et al. 2015, ApJ, 814, 12
- Knapen et al. (2003) Knapen, J. H., de Jong, R. S., Stedman, S., & Bramich, D. M. 2003, MNRAS, 344, 527
- Knapen et al. (2006) Knapen, J. H., Mazzuca, L. M., Böker, T., et al. 2006, A&A, 448, 489
- Kormendy & Ho (2013) Kormendy, J., & Ho, L. C. 2013, ARA&A, 51, 511
- Larson & Tinsley (1978) Larson, R. B., & Tinsley, B. M. 1978, ApJ, 219, 46
- Lauer (1985) Lauer, T. R. 1985, ApJS, 57, 473
- Lauer et al. (2005) Lauer, T. R., Faber, S. M., Gebhardt, K., et al. 2005, AJ, 129, 2138
- Liu & Kennicutt (1995) Liu, C. T., & Kennicutt, R. C. 1995, ApJS, 100, 325
- Liu et al. (2015a) Liu, C., Peng, E. W., Côté, P., et al. 2015a, ApJ, 812, 34
- Liu et al. (2015b) Liu, C., Peng, E. W., Toloba, E., et al. 2015b, ApJ, 812, L2
- Lux et al. (2013) Lux, H., Read, J. I., Lake, G., & Johnston, K. V. 2013, MNRAS, 436, 2386
- Lynds & Toomre (1976) Lynds, R., & Toomre, A. 1976, ApJ, 209, 382
- Malin (1977) Malin, D. F. 1977, AAS Photo Bull., 16, 10
- Malin & Carter (1983) Malin, D. F., & Carter, D. 1983, ApJ, 274, 534
- Maraston et al. (2004) Maraston, C., Bastian, N., Saglia, R. P., et al. 2004, A&A, 416, 467
- Marshall et al. (2008) Marshall, J. L., Burles, S., Thompson, I. B., et al. 2008, Proc. SPIE, 7014, 701454
- Martínez-Delgado et al. (2008) Martínez-Delgado, D., Peñarrubia, J., Gabany, R. J., et al. 2008, ApJ, 689, 184
- Martínez-Delgado et al. (2010) Martínez-Delgado, D., Gabany, R. J., Crawford, K., et al. 2010, AJ, 140, 962
- Mees & James (1966) Mees, C. E. K., & James, T. H. 1966, The Theory of the Photographic Process (3rd ed.; New York: Macmillan), 495
- Meylan & Heggie (1997) Meylan, G., & Heggie, D. C. 1997, A&A Rev., 8, 1
- Mieske et al. (2013) Mieske, S., Frank, M. J., Baumgardt, H., et al. 2013, A&A, 558, A14
- Miskolczi et al. (2011) Miskolczi, A., Bomans, D. J., & Dettmar, R.-J. 2011, A&A, 536, A66
- Mulchaey et al. (1994) Mulchaey, J. S., Koratkar, A., Ward, M. J., et al. 1994, ApJ, 436, 586
- Noguchi (1988) Noguchi, M. 1988, A&A, 203, 259
- Norris et al. (2015) Norris, M. A. Escudero, C. G., Faifer, F. R., et al. 2015, MNRAS, 451, 3615
- Norris et al. (2014) Norris, M. A. Kannappan, S. J., Forbes, D. A., et al. 2014, MNRAS, 443, 1151
- Norton et al. (2001) Norton, S. A., Gebhardt, K., Zabludoff, A. I., & Zaritsky, D. 2001, ApJ, 557, 150
- Odenkirchen et al. (2003) Odenkirchen, M., Grebel, E. K., Dehnen, W., et al. 2003, AJ, 126, 2385
- Oemler et al. (2017) Oemler, A., Clardy, K., Kelson, D., Walth, G., & Villanueva, E. 2017, COSMOS: Carnegie Observatories System for MultiObject Spectroscopy, Astrophysics Source Code Library, record ascl:1705.001
- Osterbrock & Ferland (2006) Osterbrock, D. E., & Ferland, G. J. 2006, Astrophysics of Gaseous Nebulae and Active Galactic Nuclei (2nd ed.; Sausalito, CA: Univ. Science Books)
- Panessa et al. (2006) Panessa, F., Bassani, L., Cappi, M., et al. 2006, A&A, 455, 173
- Paturel et al. (2003) Paturel, G., Theureau, G., Bottinelli, L., et al. 2003, A&A, 412, 57
- Peebles (2017) Peebles, P. J. E. 2017, Nature Astr., 1, 57
- Pfeffer & Baumgardt (2013) Pfeffer, J., & Baumgardt, H. 2013, MNRAS, 433, 1997
- Prieur (1988) Prieur, J.-L. 1988 ApJ, 326, 596,
- Primack (2017) Primack, J. R. 2017, in The Philosophy of Science, ed. K. Chamcham et al. (Cambridge: Cambridge Univ. Press), 136 (arXiv:1505.02821)
- Quinn (1984) Quinn, P. J. 1984, ApJ, 279, 596
- Richtler et al. (2005) Richtler, T., Dirsch, B., Larsen, S., Hilker, M., & Infante, L. 2005, A&A, 439, 533
- Rodriguez-Gomez et al. (2017) Rodriguez-Gomez, V., Sales, L. V., Genel, S., et al. 2017, MNRAS, 467, 3083
- Rothberg & Joseph (2006) Rothberg, B., & Joseph, R. D. 2006, AJ, 131, 185
- Sandage & Bedke (1994) Sandage, A., & Bedke, J. 1994, The Carnegie Atlas of Galaxies (Washington, DC: Carnegie Institution of Washington)
- Sandage & Miller (1964) Sandage, A. R., & Miller, W. C. 1964, Science, 144, 405
- Sandage & Tammann (1981) Sandage, A., & Tammann, G. A. 1981, A Revised Shapley-Ames Catalog of Bright Galaxies (Washington, DC: Carnegie Institution of Washington)
- Sanders & Mirabel (1996) Sanders, D. B., & Mirabel, I. F. 1996, ARA&A, 34, 749
- Sandoval et al. (2015) Sandoval, M. A., Vo, R. P., Romanowsky, A. J., et al. 2015, ApJ, 808, L32
- Sarzi et al. (2010) Sarzi, M., Shields, J. C., Schawinski, K., et al. 2010, MNRAS, 402, 2187
- Schlafly & Finkbeiner (2011) Schlafly, E. F., & Finkbeiner, D. P. 2011, ApJ, 737, 103
- Schlegel et al. (1998) Schlegel, D. J., Finkbeiner, D. P., & Davis, M. 1998, ApJ, 500, 525
- Schweizer (1978) Schweizer, F. 1978, in Structure and Properties of Nearby Galaxies, ed. E. M. Berkhuijsen & R. Wielebinski (Dordrecht: Reidel), 279
- Schweizer (1980) Schweizer, F. 1980, ApJ, 237, 303
- Schweizer (1982) Schweizer, F. 1982, ApJ, 252, 455
- Schweizer (1986) Schweizer, F. 1986, Science, 231, 227
- Schweizer (1990) Schweizer, F. 1990, in Dynamics and Interactions of Galaxies, ed. R. Wielen (Berlin: Springer), 60
- Schweizer (2000) Schweizer, F. 2000, Phil. Trans. R. Soc. A, 358, 2063
- Schweizer & Ford (1985) Schweizer, F., & Ford, W. K. 1985, in New Aspects of Galaxy Photometry, ed. J.-L. Nieto (New York: Springer), 145
- Schweizer & Seitzer (1988) Schweizer, F., & Seitzer, P. 1988, ApJ, 328, 88
- Seth et al. (2014) Seth, A. C., van den Bosch, R., Mieske, S., et al. 2014, Nature, 513, 398
- Soria et al. (2010) Soria, R., Hau, G. K. T., Graham, A. W., et al. 2010, MNRAS, 405, 870
- Spitzer (1987) Spitzer, L. 1987, Dynamical Evolution of Globular Clusters (Princeton, NJ: Princeton Univ. Press)
- Stasińska et al. (2008) Stasińska, G., Vale Asari, N., Cid Fernandes, R., et al. 2008, MNRAS, 391, L29
- Strader et al. (2013) Strader, J., Seth, A. C., Forbes, D. A., et al. 2013, ApJ, 775, L6
- Svoboda et al. (2017) Svoboda, J., Guainazzi, M., & Merloni, A. 2017, A&A, 603, A127
- Tal et al. (2009) Tal, T., van Dokkum, P. G., Nelan, J., & Bezanson, R. 2009, AJ, 138, 1417
- Tonry & Davis (1979) Tonry, J., & Davis, M. 1979, AJ, 84, 1511 (TD79)
- Toomre (1978) Toomre, A. 1978, in The Large-Scale Structure of the Universe, ed. M. S. Longair & J. Einasto (Dordrecht: Reidel), 109
- Toomre & Toomre (1972) Toomre, A., & Toomre, J. 1972, ApJ, 178, 623
- Toomre (1977) Toomre, A. 1977, in The Evolution of Galaxies and Stellar Populations, ed. B. M. Tinsley & R. B. Larson (New Haven: Yale Univ. Observatory), 401
- Trancho et al. (2003) Trancho, G., Miller, B., Schweizer, F., & Whitmore, B. 2003, in Extragalactic Globular Cluster Systems, ed. M. Kissler-Patig (Berlin: Springer), 137
- Trancho et al. (2014) Trancho, G., Miller, B. W., Schweizer, F., Burdett, D. P., & Palamara, D. 2014, ApJ, 790, 122
- Ueda et al. (2014) Ueda, J., Iono, D., Yun, M. S., et al. 2014, ApJS, 214, 1
- van den Bergh (2000) van den Bergh, S. 2000, The Galaxies of the Local Group (Cambridge: Cambridge University Press)
- van den Bosch (2016) van den Bosch, R. C. E. 2016, ApJ, 831, 134
- Van Wassenhove et al. (2012) Van Wassenhove, S., Volonteri, M., Mayer, L., et al. 2012, ApJ, 748, L7
- Voggel et al. (2016) Voggel, K., Hilker, M., & Richtler, T. 2016, A&A, 586, A102
- Vorontsov-Velyaminov (1959) Vorontsov-Velyaminov, B. A. 1959, Atlas and Catalog of Interacting Galaxies (Moscow: Sternberg Institute)
- Wardle & Knapp (1986) Wardle, M., & Knapp, G. R. 1986, AJ, 91, 23
- White & Rees (1978) White, S. D. M., & Rees, M. J. 1978, MNRAS, 183, 341
- Whitmore (2007) Whitmore, B. C. 2007, in ASP Conf. Ser. 376, Astronomical Data Analysis Software and Systems XVI, ed. R. A. Shaw, F. Hill, & D. J. Bell (San Francisco, CA: ASP), 185
- Yan & Blanton (2012) Yan, R., & Blanton, M. R. 2012, ApJ, 747, 61
- Zabludoff et al. (1996) Zabludoff, A. I., Zaritsky, D., Lin, H., et al. 1996, ApJ, 466, 104
- Zwicky (1953) Zwicky, F. 1953, Phys. Today, 6, iss. 4, 7