Characterization of catastrophic instabilities: Market crashes as paradigm
Abstract
Catastrophic events, though rare, do occur and when they occur, they have devastating effects. It is, therefore, of utmost importance to understand the complexity of the underlying dynamics and signatures of catastrophic events, such as market crashes. For deeper understanding, we choose the US and Japanese markets from 1985 onward, and study the evolution of the cross-correlation structures of stock return matrices and their eigenspectra over different short time-intervals or “epochs”. A slight non-linear distortion is applied to the correlation matrix computed for any epoch, leading to the emerging spectrum of eigenvalues. The statistical properties of the emerging spectrum display: (i) the shape of the emerging spectrum reflects the market instability, (ii) the smallest eigenvalue may be able to statistically distinguish the nature of a market turbulence or crisis – internal instability or external shock, and (iii) the time-lagged smallest eigenvalue has a statistically significant correlation with the mean market cross-correlation. The smallest eigenvalue seems to indicate that the financial market has become more turbulent in a similar way as the mean does. Yet we show features of the smallest eigenvalue of the emerging spectrum that distinguish different types of market instabilities related to internal or external causes. Based on the paradigmatic character of financial time series for other complex systems, the capacity of the emerging spectrum to understand the nature of instability may be a new feature, which can be broadly applied.
keywords:
Market crash Return correlations Complex Systems Turbulence EigenspectrumIntroduction
A stock market is a fascinating example of a complex system[1, 2, 3], where the coherent collective behavior of the economic agents and their repeated nonlinear interactions, often lead to rich structures of correlations and time-dependencies [4, 5, 6]. The movements in the market prices are often influenced by news or external shocks, which can result in the unforeseen and rapid drop in the prices of a large section of the stock market, labeled as a market crash! On the contrary, the widespread existence of bubbles in financial markets and extreme movements of return series often result from the unstable relationship between macroeconomic fundamentals of the economy and the asset prices [7]. Since the societal impact of an extreme event like a market crash can be catastrophic [9, 8], the understanding of such events [10], the assessment of the associated risks [11], and possible prediction of these events have drawn attention from all quarters: governments, industry participants and academia. Recent research has emphasized the roles played by bounded rationality as important causal factors for the observed disconnect between volatility of asset returns and movements of the underlying fundamentals, or the ‘excess volatility puzzle’ [9, 12]. A recent paper [13] presented the alternative view that the co-movements in financial assets are anchored to the corresponding macroeconomic fundamentals – the nominal returns from individual assets might drift far from what can be predicted using expected cash-flow, while the joint evolution of the co-movements of returns are still related to aggregate size variables like market capitalization, revenue or number of employees. There already exist papers related to economic fluctuations using network theory [14, 15], but there is a lot more to understand about movements and fluctuations of markets.
It is widely accepted that complex financial markets are not amenable to mathematically analytic description nor to computational reduction – financial markets inherently unpredictable and the only way to study their evolution is perhaps to let them evolve in time! However, the detailed evolution of a complex system may not have much significance; it may be more interesting to study certain phases of the evolution, like rare events. A forecasting or prediction algorithm may be required for answering important questions related to rare events – predicting the occurrence of seismic waves or temperature rise, forecasting crashes or bubbles, etc. Such extreme events often reveal underlying dynamical processes and thus provide ground for a better scientific understanding of complex systems like stock markets, fractures or earthquakes [16, 17]. Theories and concepts from statistical physics have often proven to be of much use in studying and understanding the collective behavior in complex financial markets [6]. Tools from random matrix theory (RMT) [18], self-organized criticality [19], networks [20], etc. have been used extensively to model such complex systems [21].
We present a study of the time evolution of the cross-correlation structures of return matrices for stocks, and the eigenspectra over different time-epochs, as traditionally analyzed using tools of RMT. Correlation matrices have been used as a standard tool in the analysis of the time evolution of complex systems, and particularly in financial markets [22, 23]. For this type of analysis, one assumes stationarity of the underlying time series. As this assumption manifestly fails for longer time series, it is often useful to break the long time series of length , into time-epochs of size (such that ). The assumption of stationarity improves for the shorter time-epochs used. However, if there are return time series such that , this implies an analysis of highly singular correlation matrices with zero eigenvalues, which lead to poor statistics. This problem can be avoided by using the non-linear “power map”, which was introduced to reduce noise and break the degeneracy of the zero eigenvalues [24, 25, 26]. In this paper, we have used a small non-linear distortion (foregoing the noise reduction) for each cross-correlation matrix computed within an epoch, giving rise to the “emerging spectrum” of eigenvalues well separated from the original non-zero ones, which can be then used as a “signal” [26]. We then study the statistical properties of the emerging spectrum and show for the first time that: (i) the shape of the emerging spectrum reflects the market turbulence, and (ii) the smallest eigenvalue of the emerging spectrum may be able to statistically distinguish the principal nature of a market turbulence or crisis – internal reaction or external shock. Further, a linear regression model of the mean market cross-correlation as a function of the time-lagged smallest eigenvalue indicates, that the two variables have statistically significant correlation. For the USA, from 2001 onward, the smallest eigenvalue seems to indicate that the financial market has become more turbulent. Similarly for Japan, the nature of the market has changed from 1990 onward. For this, we use the GARCH() model [27] to estimate the volatility of a time series.
Methodology and Results
We take the different time series of the logarithmic returns , of the stocks in the USA and JPN markets (see Data description), and construct the equal-time cross-correlation matrix, with elements: , where and indicates the end date of the time-epoch of size . The correlations are computed over time-epochs of days for the entire return series days for USA, and days for JPN. We study the evolution of the cross-correlation structures of return matrices and the eigenspectra over different overlapping time-epochs (shifted by day).
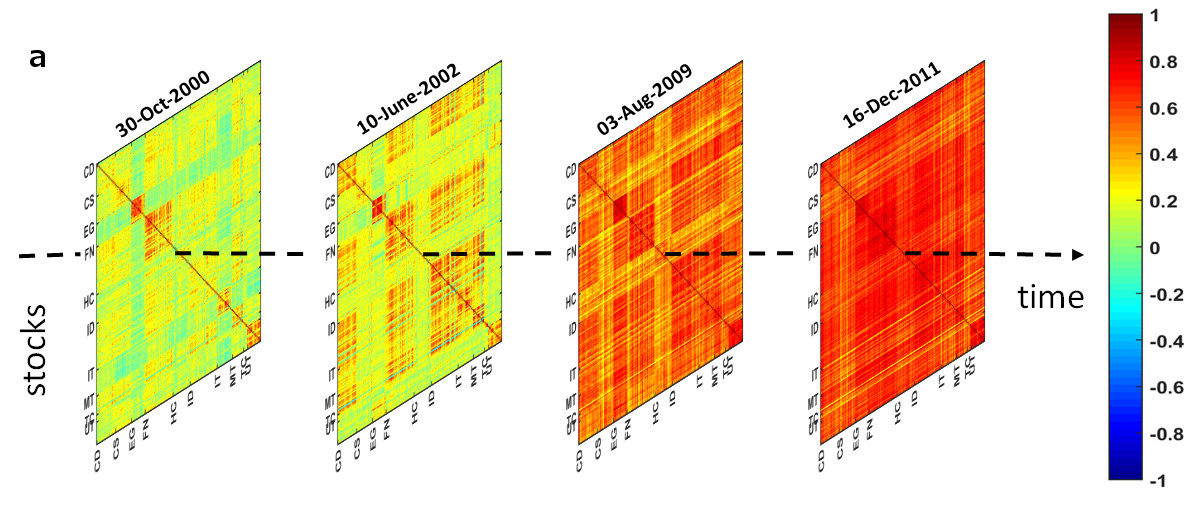
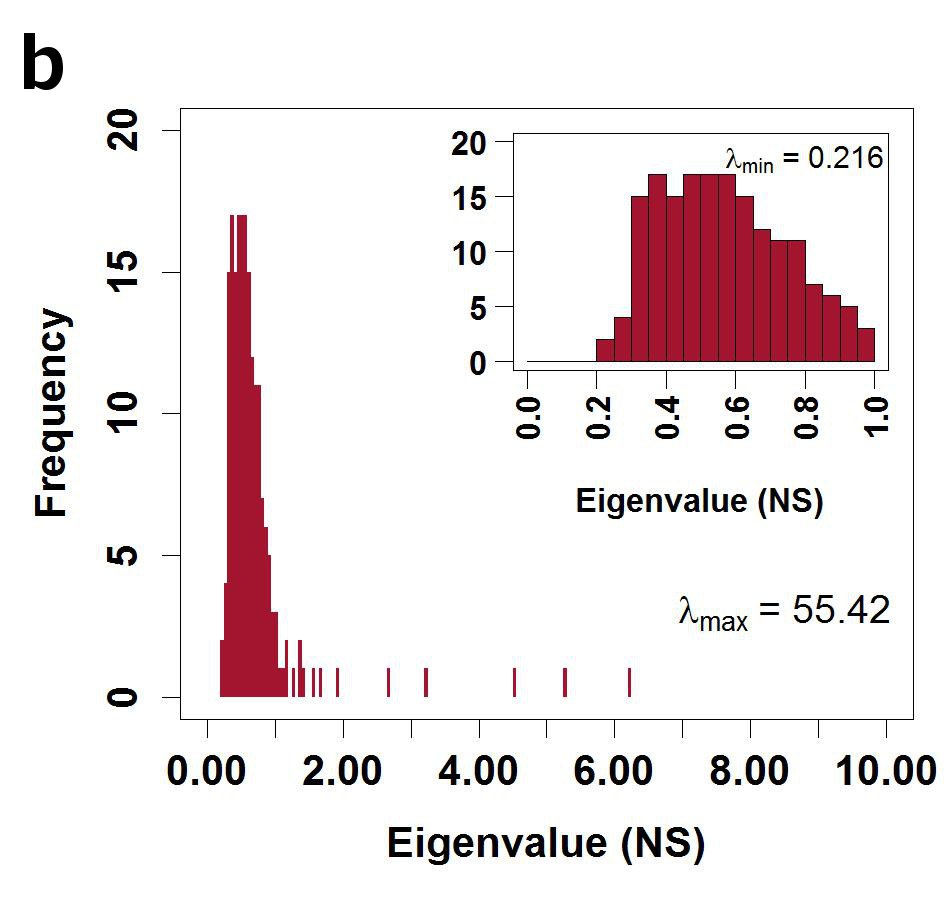
In Figure 1 (a), four correlation structures with (non-singular matrices) are shown for the USA market with stocks, for the periods ending on 30-10-2000, 10-06-2002, 03-08-2009 and 16-12-2011; evidently, the correlation structure varies with time – the market has highly correlated structure during the turbulent period (16-12-2011), and an interesting structure mixed with correlations and anti-correlations during a relatively calm period (30-10-2000), with the mean market correlation varying over time. In Figure 1 (b), the eigenvalue spectrum of the correlation matrix, evaluated for the long time series of returns for the entire period of days, is shown with the maximum eigenvalue of the normal spectrum (not shown). The Inset of Figure 1 (b) shows the empirical Marc̆enko-Pastur distribution [28], with the smallest eigenvalue of the normal spectrum . The maximum eigenvalue essentially captures the mean correlation () in the market. Instead of working with a long time series to determine the correlation matrix for stocks, if we work with a short time series epoch of days, then the correlation matrix would be singular and the eigenvalue spectra would have zero eigenvalues (see Figure 1 (c-d)).
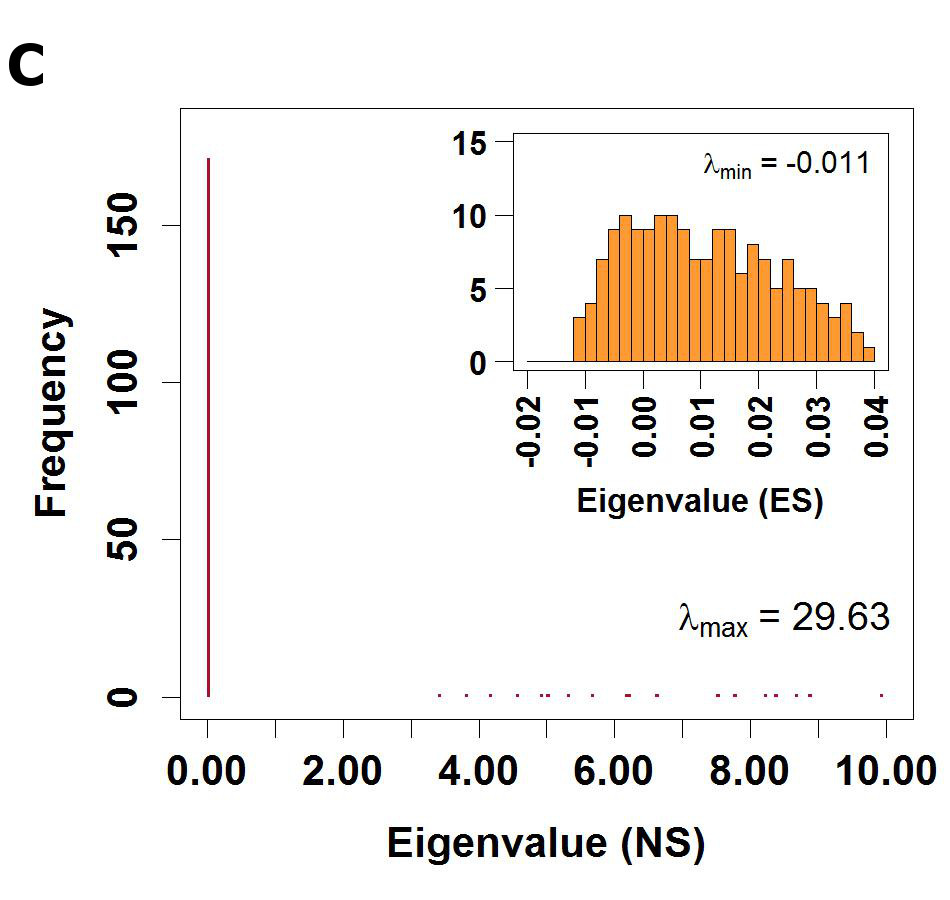
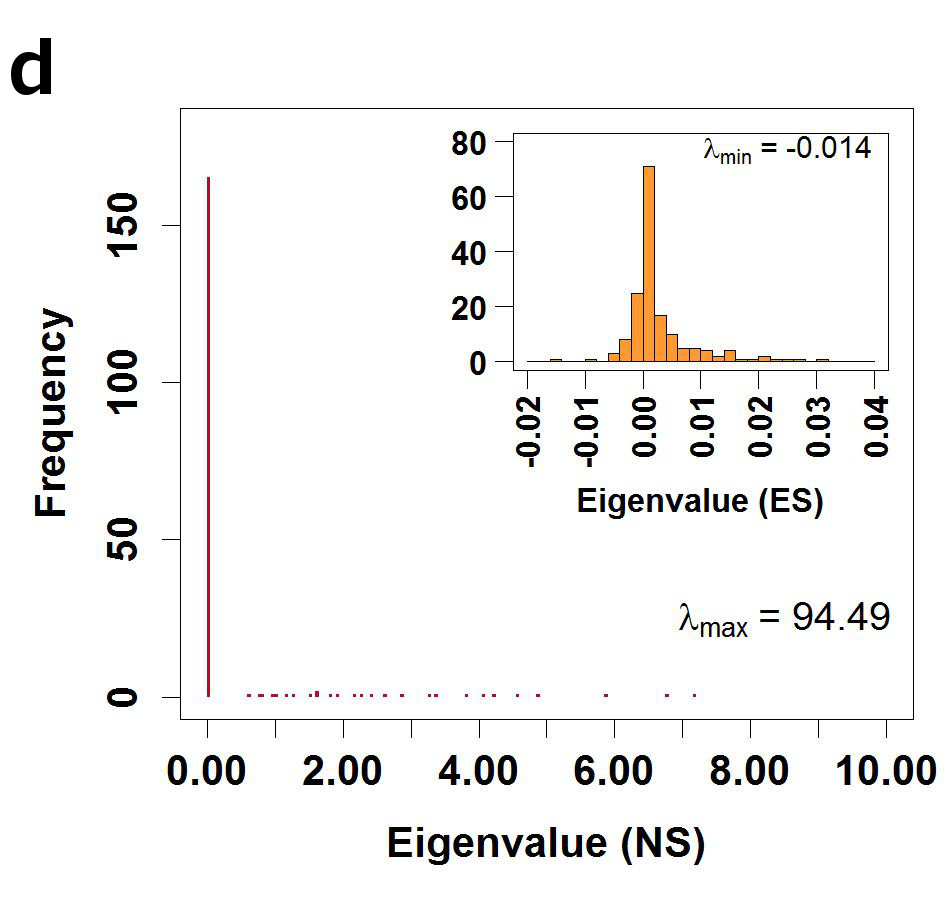
For the short time-epochs of days, following the methodology of the power map by Vinayak et al. [26], we now give a non-linear distortion to each cross-correlation matrix within an epoch: , where . This gives rise to an “emerging spectrum” of eigenvalues. The Insets of Figure 1 (c) and (d) show the emerging spectra, which are considerably different from the non-distorted or normal spectrum. Notably, some of the eigenvalues are now negative! We further observe that the statistical properties of the emerging spectra get affected by market turbulence – the emerging spectrum is distorted semi-circular when the market is normal, while it is Lorentzian when the market is critical (turbulent) with very strong correlations.
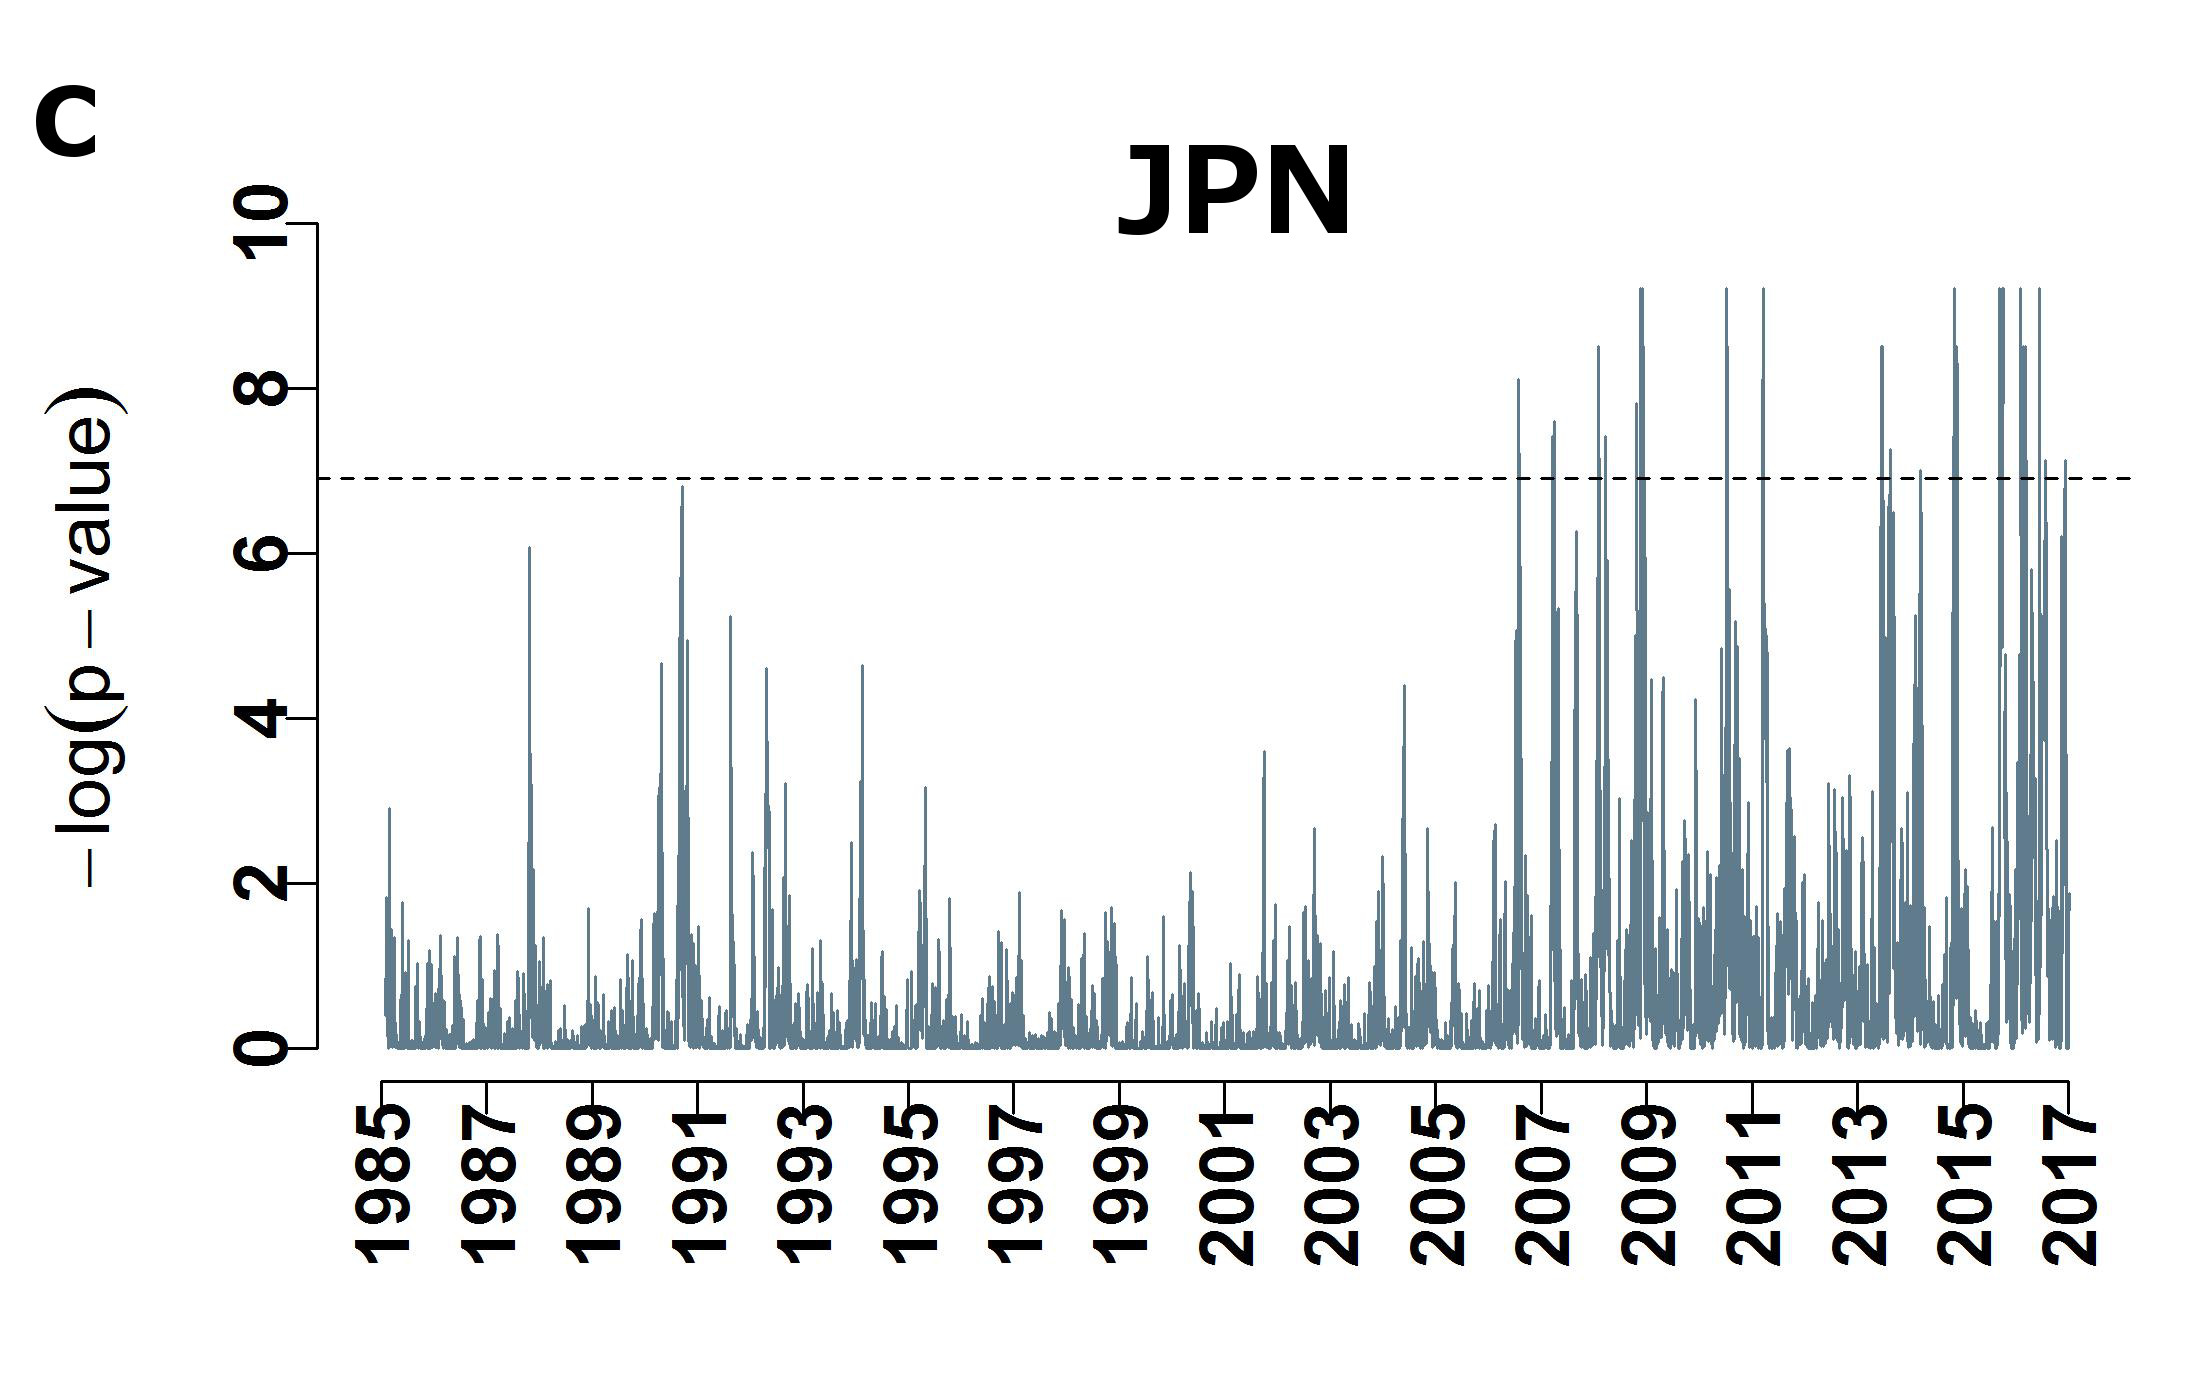
Figure 2 shows for the USA (a-d) and JPN (e-h): (i) market returns , (ii) mean market correlation , (iii) smallest eigenvalue of the emerging spectrum (), and (iv) t-value of the t-test, which tests if lag-1 smallest eigenvalue has statistical effect over mean market correlation (described in Methods section). Using the GARCH() models for volatility modeling (given in Methods section) on all the three variables (especially the smallest eigenvalue of the emerging spectrum), it is evident that for the USA, from 2001 onward, the financial market has become more turbulent. Similarly for Japan, the nature of the market has changed from 1990 onward. The lag-1 smallest eigenvalue seems to pick up (statistically significant at levels or higher) for most of the time, in ahead by one-day, the signal of how correlated the market would be. This feature could shed light and be exploited in designing market strategies, etc. The only periods when the fails to detect, are the broad periods (1990-91, 2000-02, etc.) which act like as bubbles or anomalies. However, the “Dot-com” bubble can be treated as an anomaly, since only a single industry was at crisis. Thus, smallest eigenvalue of the emerging spectrum can be effectively used for the characterization of market crashes and as a signal for market turbulence.
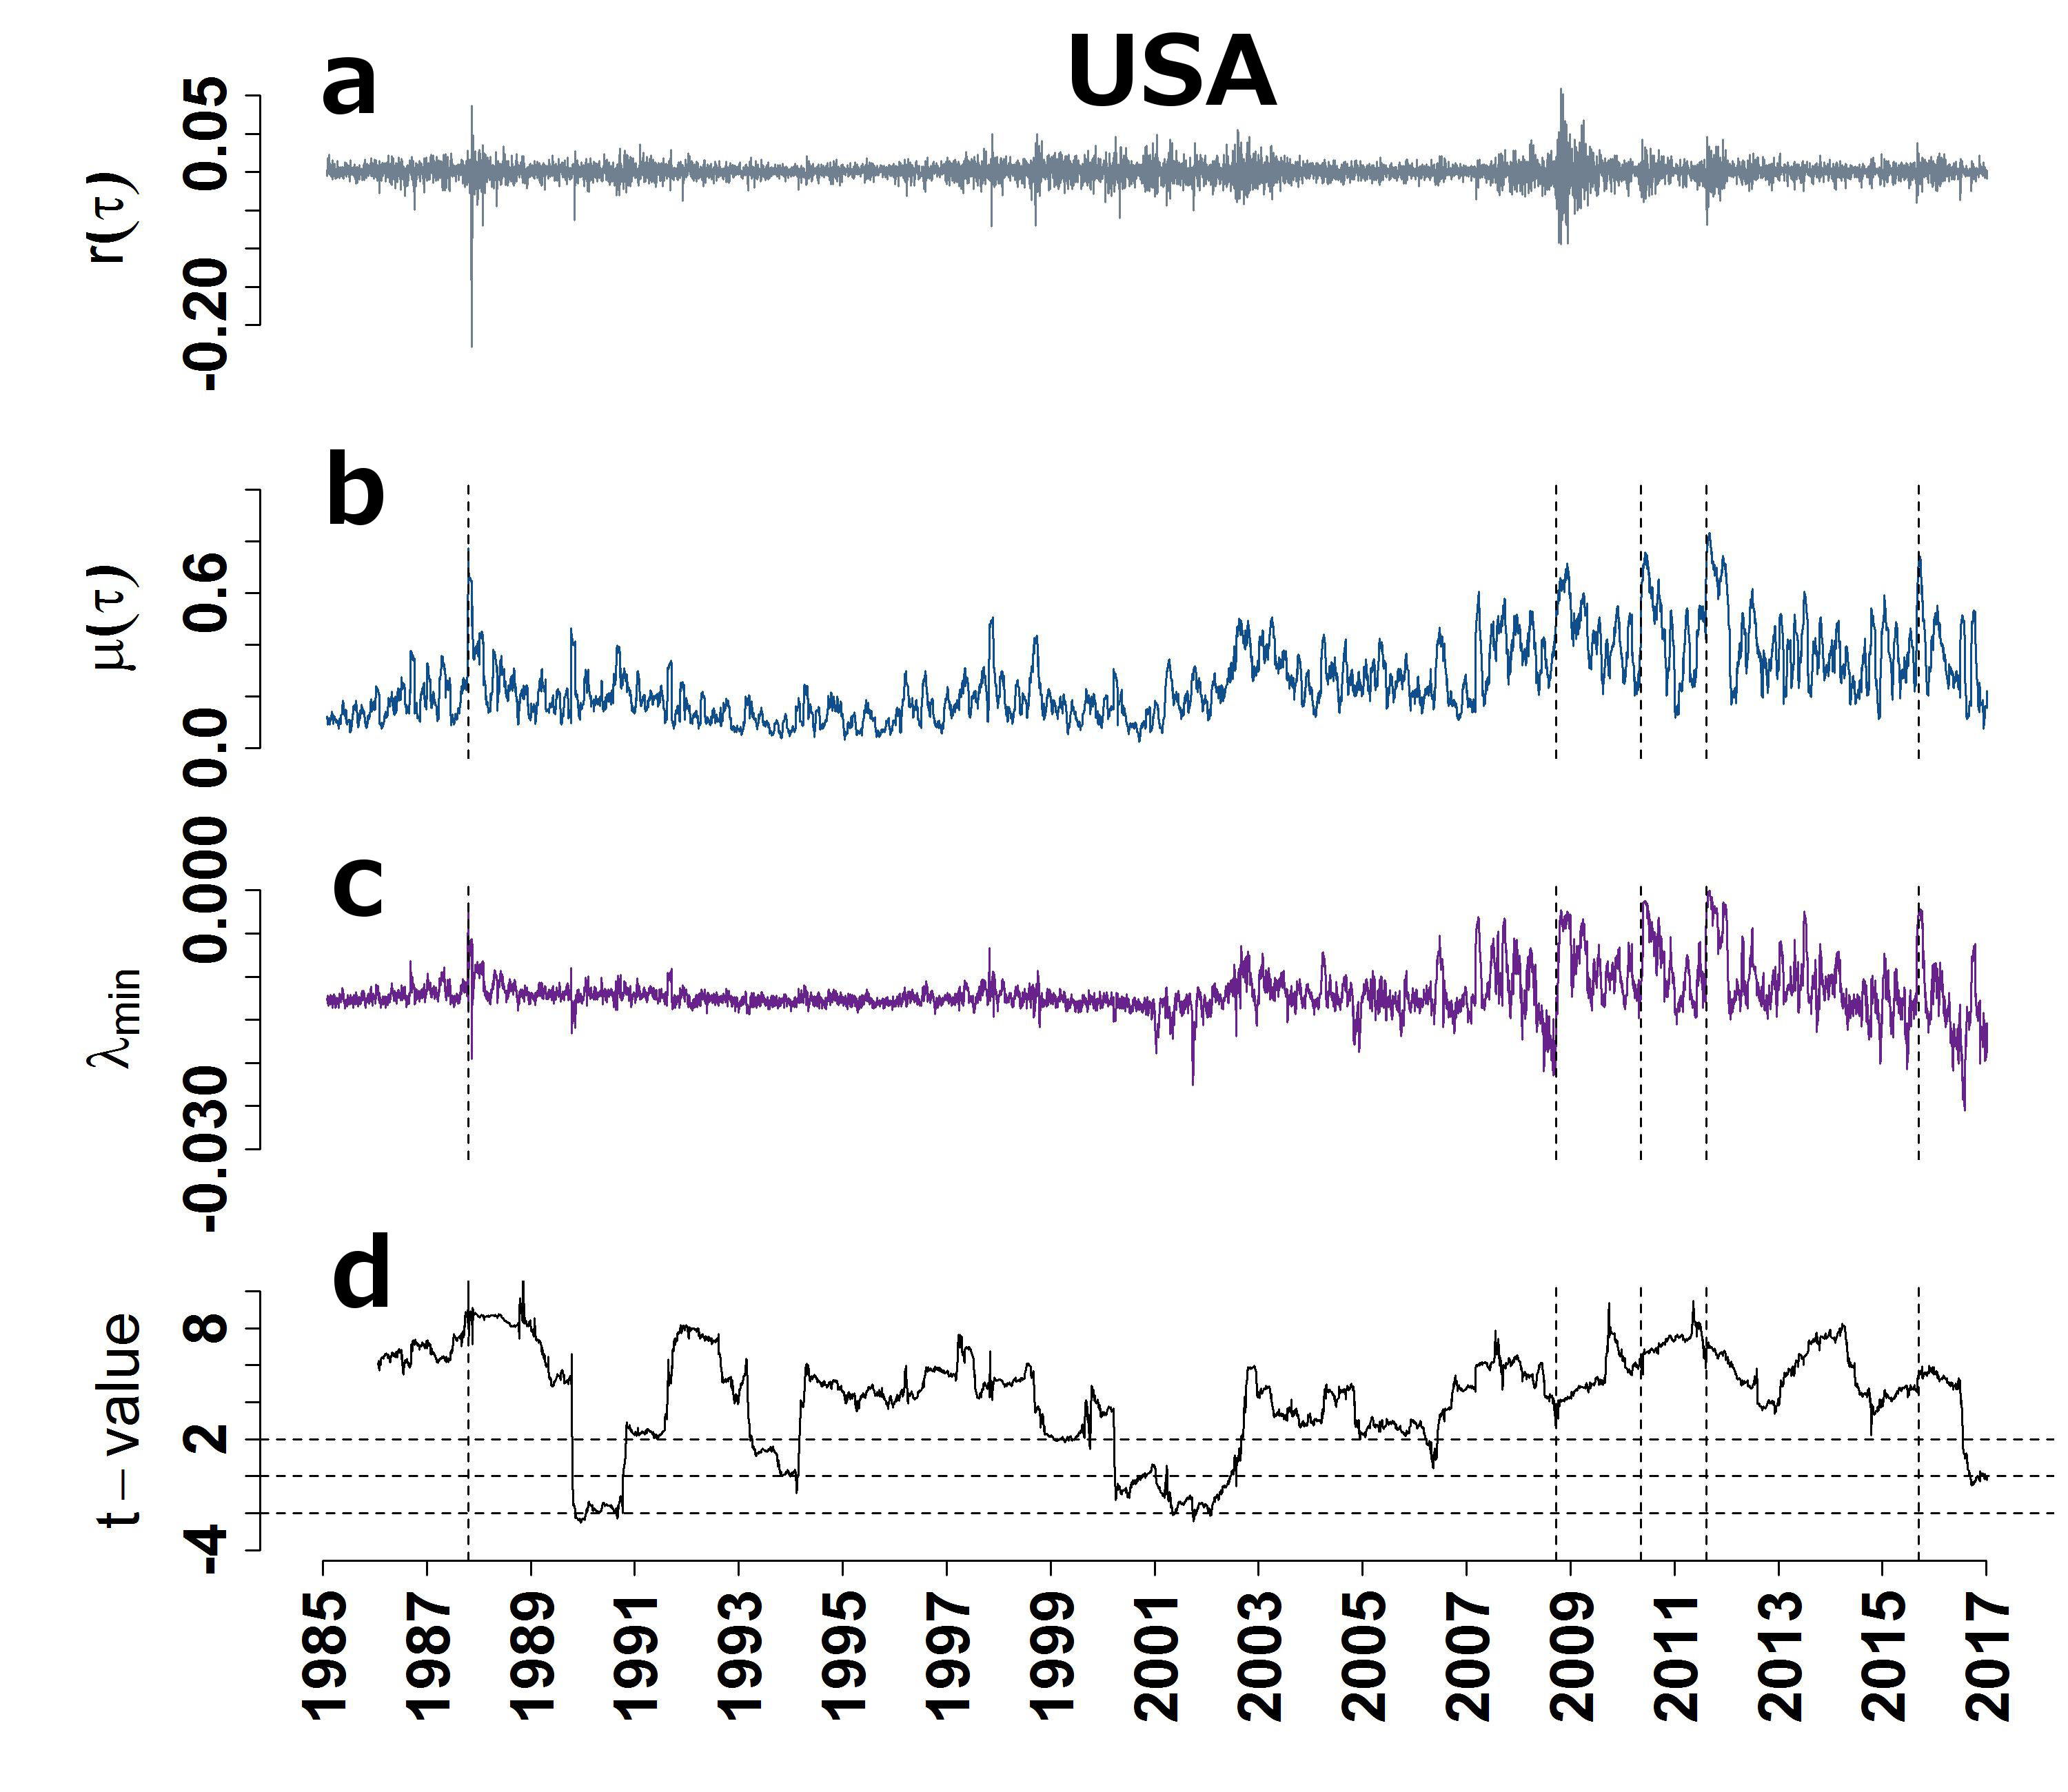
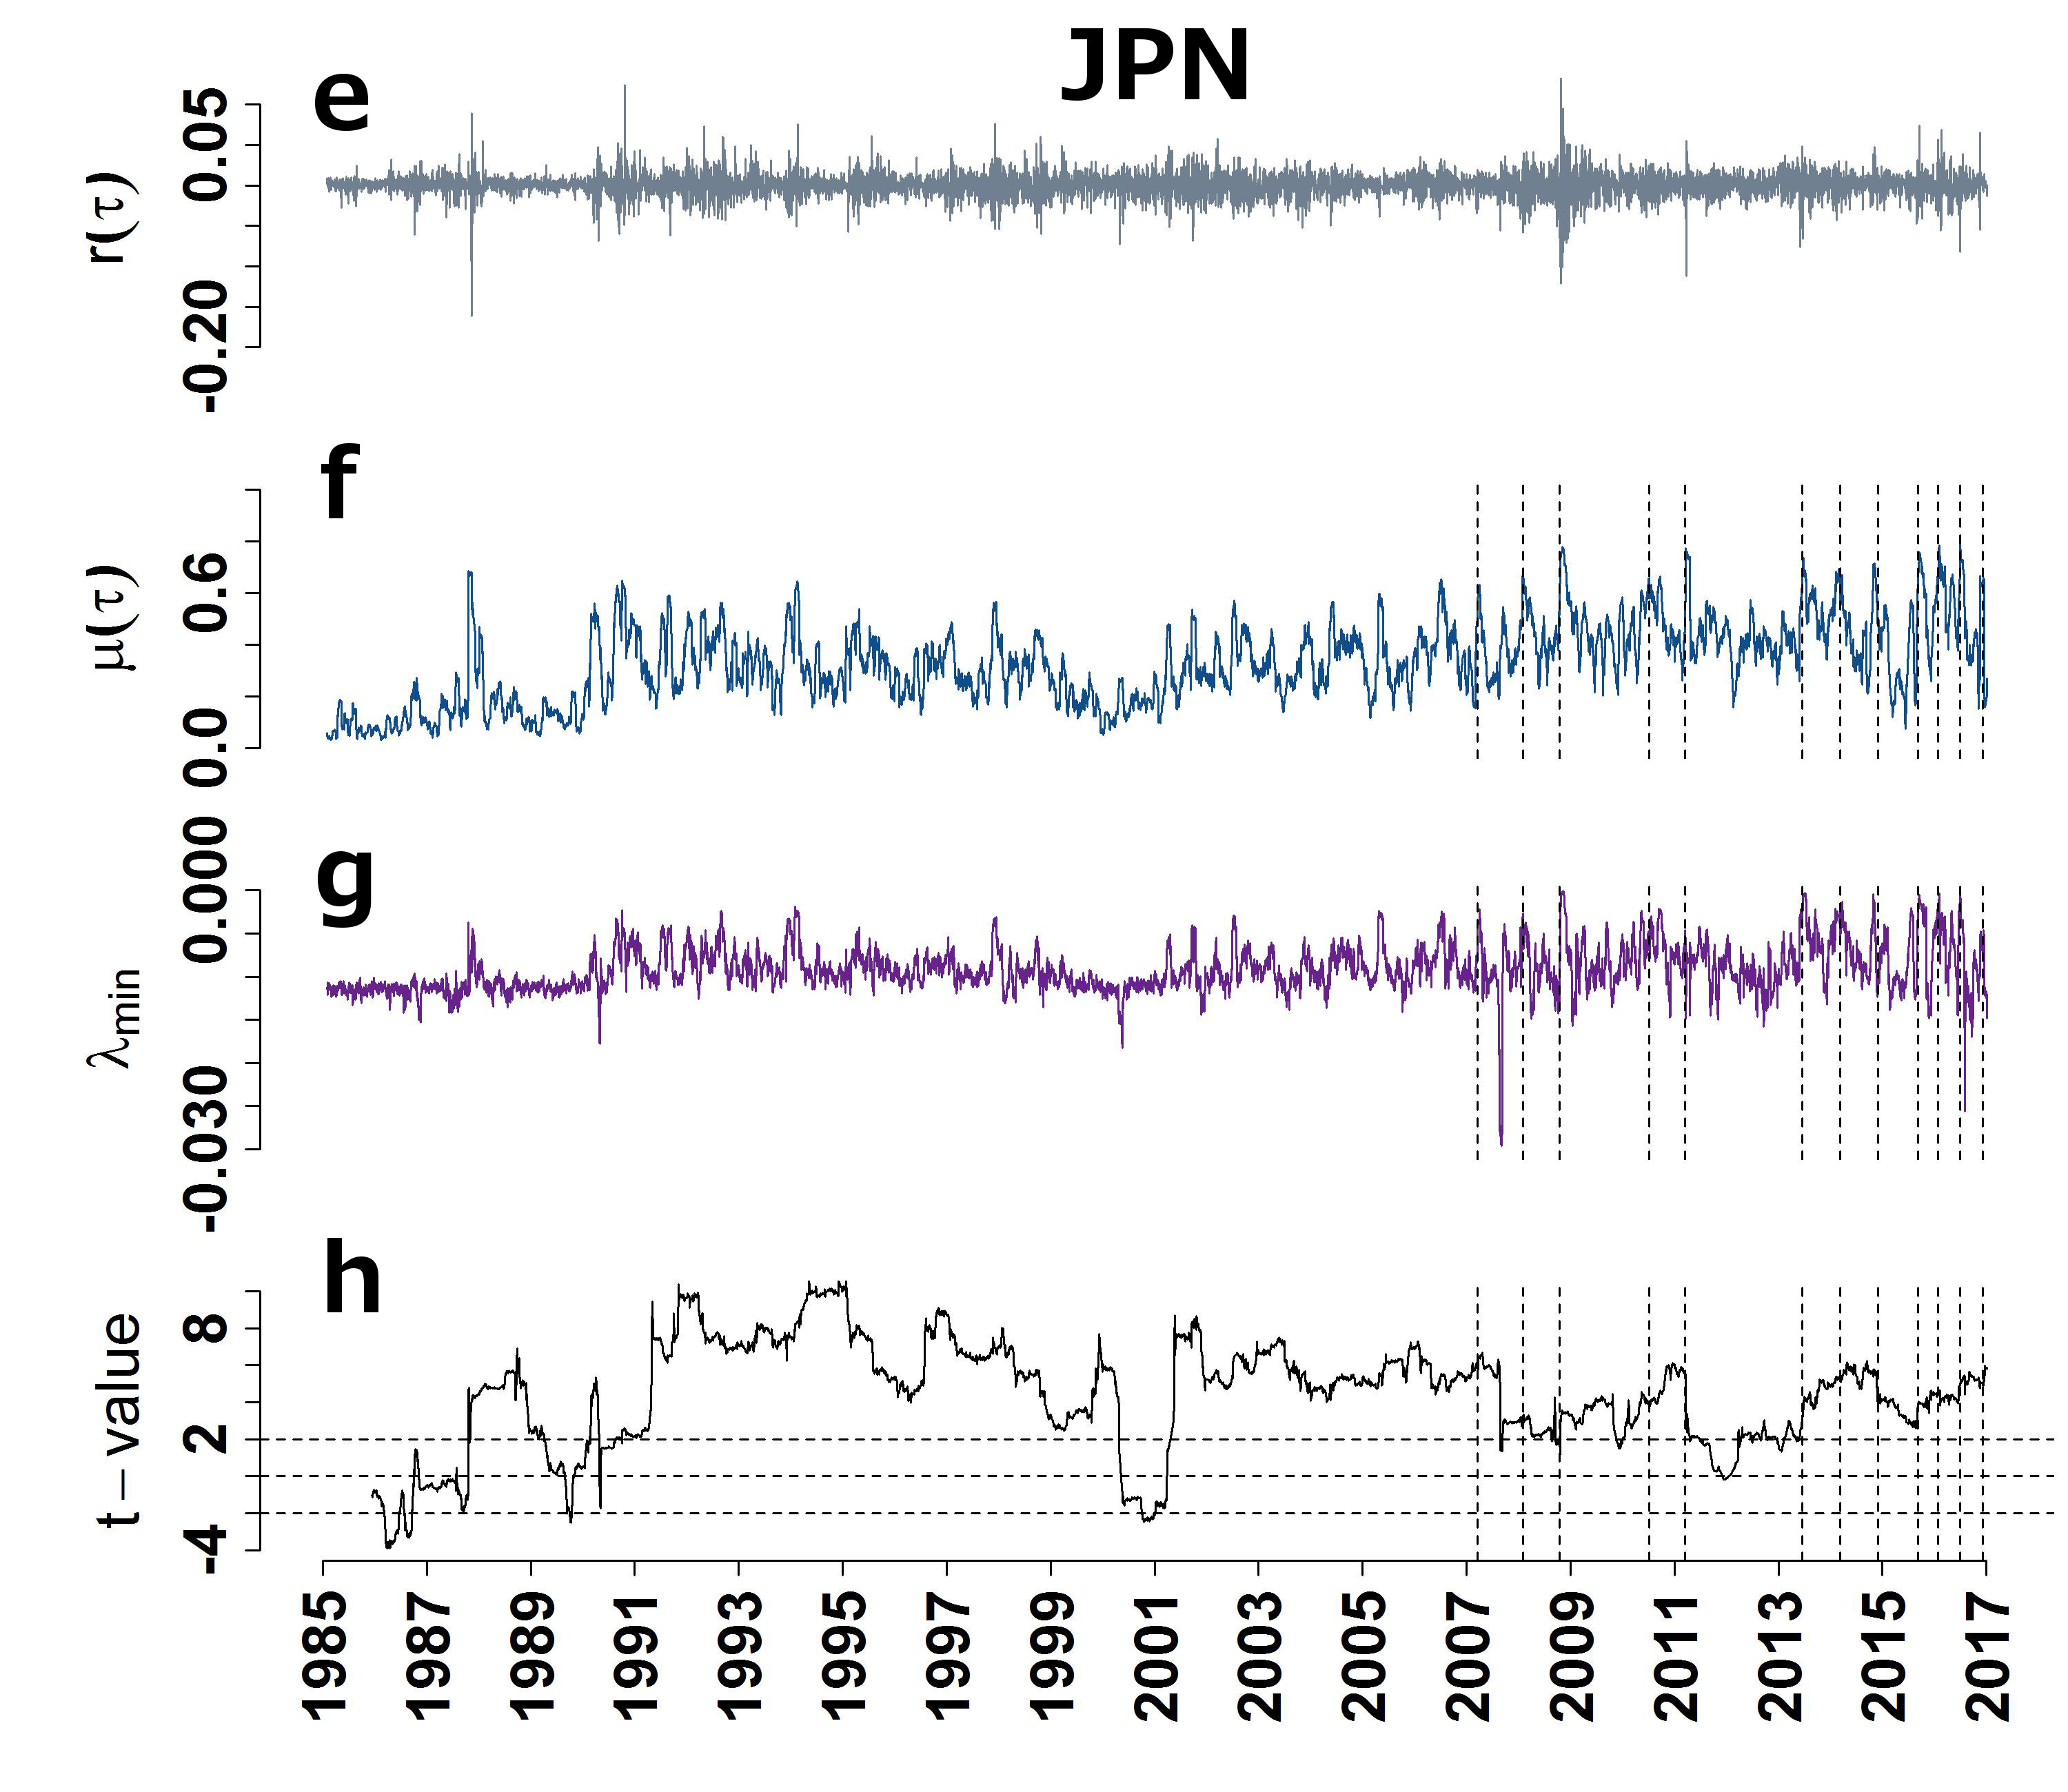
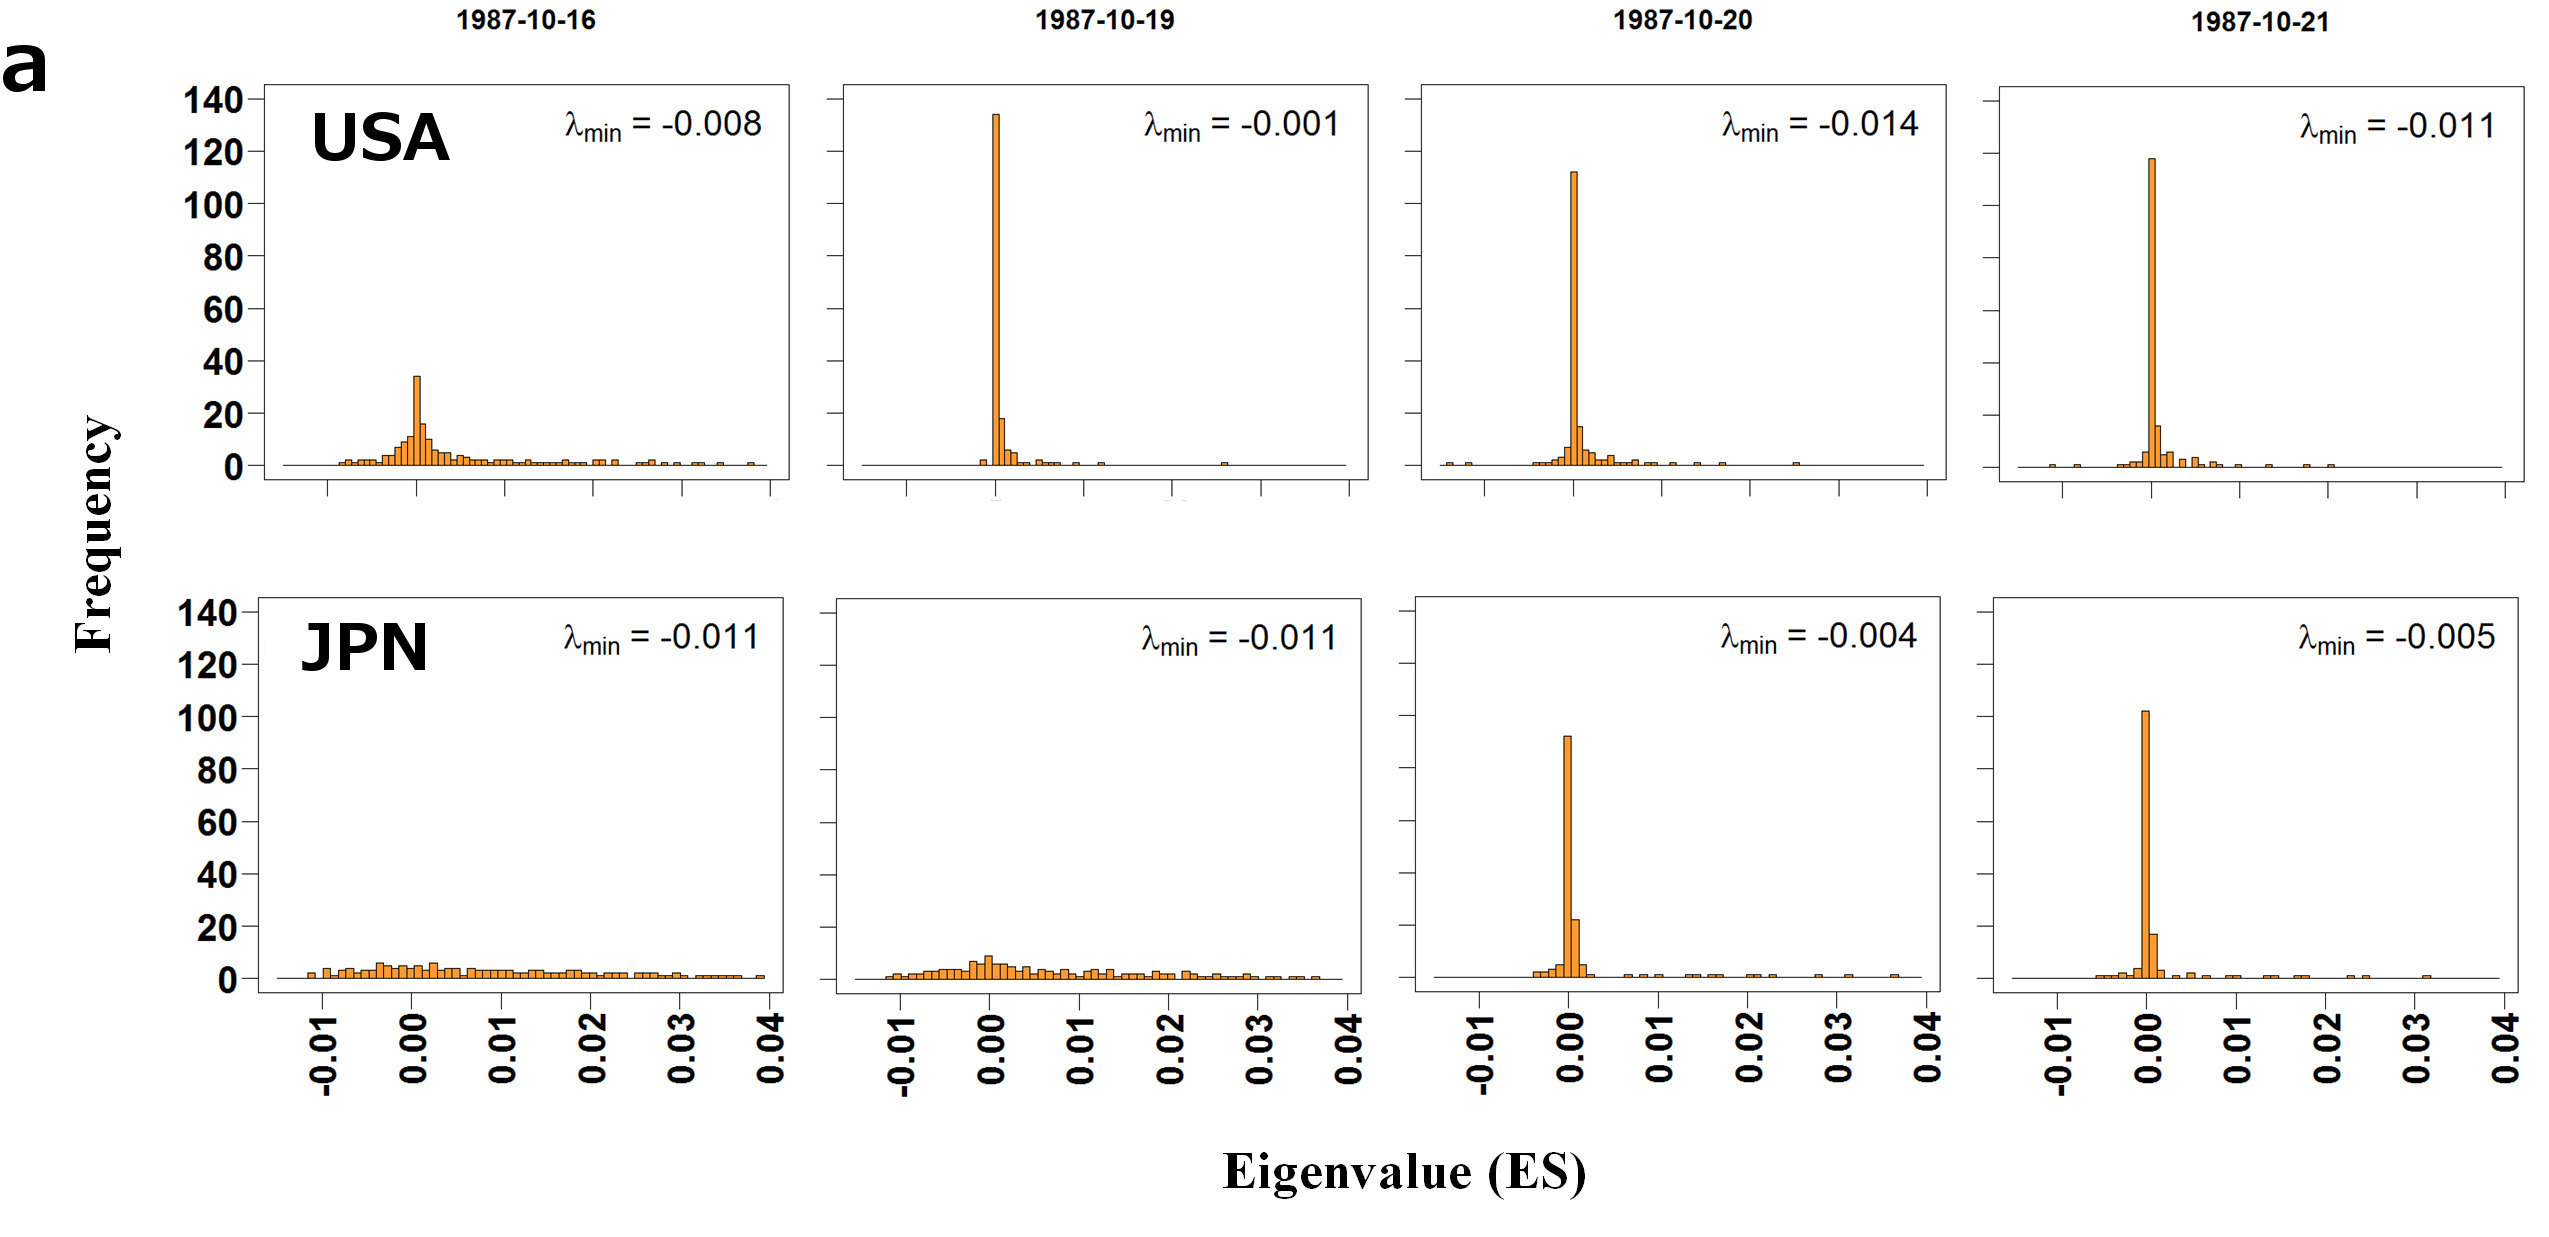
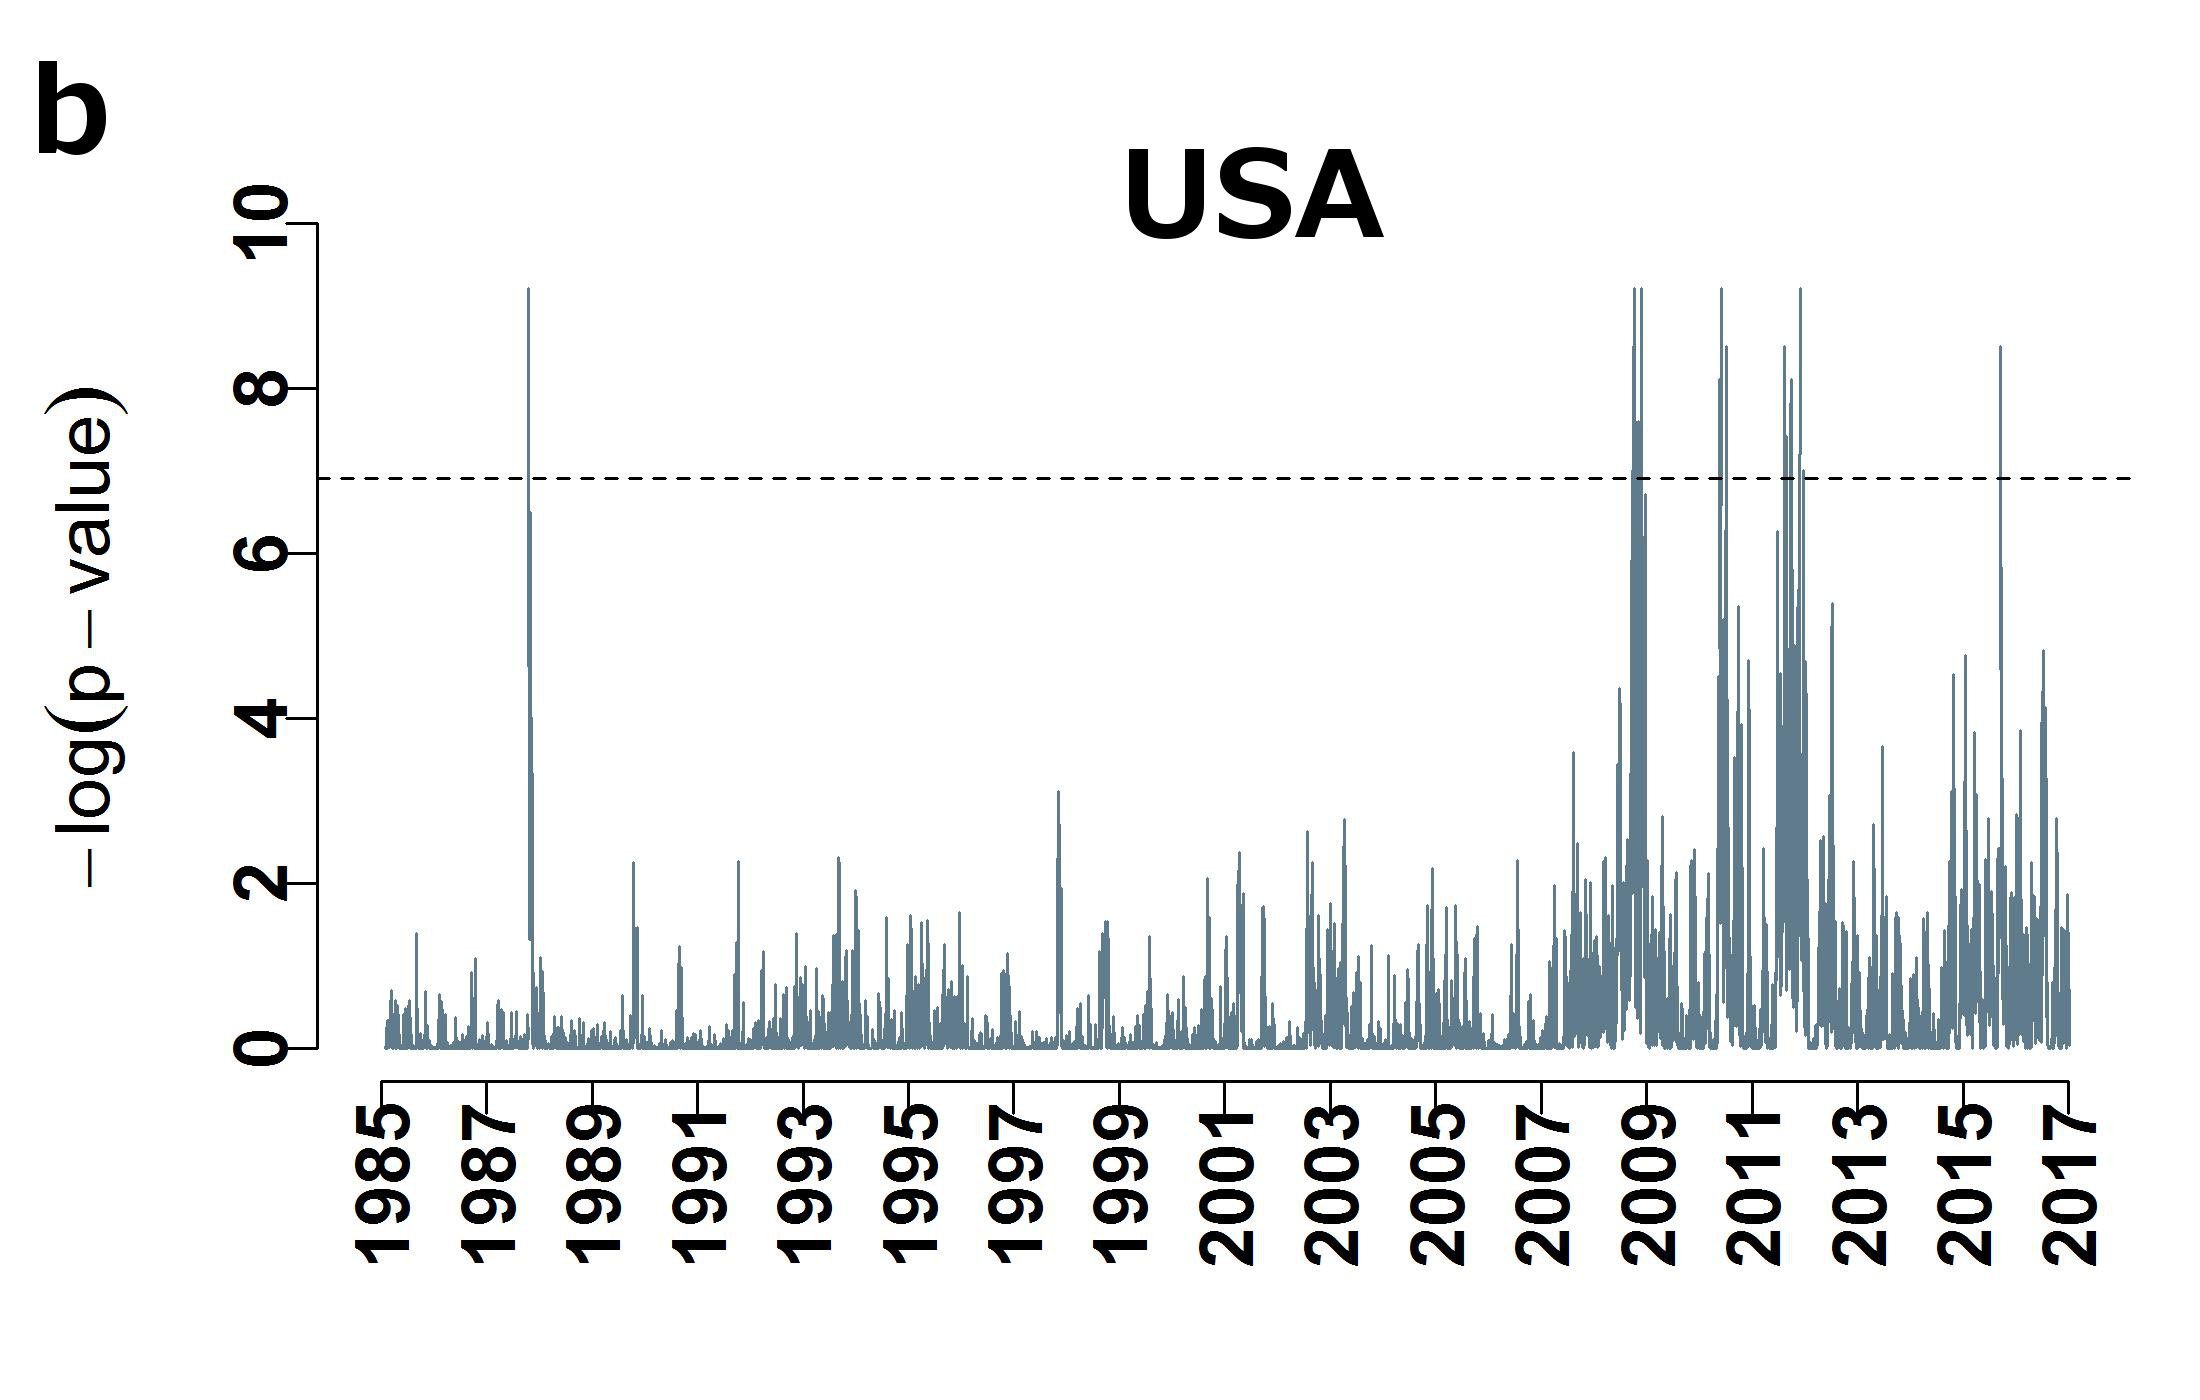
Figure 3 shows that the shapes of the emerging spectra reflect the turbulence in the market. When the market changes from normal to critical periods, the shape (distribution) of the emerging spectra changes from distorted semi-circular (or similar to Marc̆enko-Pastur) to Lorentzian. Also, the smallest eigenvalue of the emerging spectrum () seems to be an outlier whenever the crash brews due to some internal effects. We test whether the smallest eigenvalue of the emerging spectrum () is an outlier or not, using the Silverman method [30] (outlined in the Methods section). We find that most of the recent major USA or JPN crashes are due to internal market reactions. The list of the major crashes is given in Table 1, and the corresponding crashes are also indicated in Figure 2. The Black Monday crash is one of the biggest crashes that occurred, and from the behavior of the , it appears to be due to an internal reaction in USA and an external shock in JPN. There is obviously a delay between the two markets, and the JPN markets reacts after a few days. Thus, the could be used as an indicator to study the lead-lag effects in the markets.
| Period | Region | Affected | Crisis | |
| 1987 | Global | USA | Black Monday | |
| 2007-09 | Global | USA, JPN |
|
|
| 2010-11 | Europe | USA, JPN |
|
|
| 2011 | Asia | JPN | Fukushima Disaster | |
| 2013-14 | Europe | JPN | Russian Ruble Crisis | |
| 2015 | Asia | JPN, USA | Chinese Stock Market Crisis | |
| 2016 | Asia | JPN |
|
Summary and discussions
In this paper, we studied the statistical properties of the emerging spectra and showed for the first time that: (i) the shape of the emerging spectrum reflects the market turbulence, and (ii) the smallest eigenvalue of the emerging spectrum may be able to statistically distinguish the principal nature of a market turbulence or crisis – internal reaction or external shock. Further, when we ran a linear regression model for the mean market cross-correlation as function of the time-lagged smallest eigenvalue, we found that the two variables have statistically significant correlation. The surprising and far reaching result we find is that the smallest eigenvalue (of the emerging spectrum) does not only anti-correlate trivially with the largest one, and thus with the average correlation, but in certain instabilities the anti-correlation turns into positive correlation. This change can reasonably be associated to the question whether a crash is associated to intrinsic market conditions (e.g., a bubble) or to external events (e.g., the Fukushima meltdown). Furthermore, the time-lagged correlation between the smallest eigenvalue and the highest one is not always very small and thus an indicator function may exist. These resuls are of deep significance for the undertstanding of financial markets but beyond that open a new window to the exploration of other complex systems that display catastrophic instabilities.
Methods
Data Description
We have used the adjusted closure price time series from the Yahoo finance database [29], for two countries: United States of America (USA) S&P-500 index and Japan (JPN) Nikkei-225 index, for the period 02-01-1985 to 30-12-2016, and for the corresponding stocks as follows:
-
•
USA — 02-01-1985 to 30-12-2016 ( days); Number of stocks ;
-
•
JPN — 04-01-1985 to 30-12-2016 ( days); Number of stocks ,
where we have included the stocks which are present in the index for the entire duration. The list of stocks (along with the sectors) for the two markets are given in the Tables 2 and 3 in Supplementary information.
Cross-correlation Matrix
Returns series are constructed as , where is the adjusted closure price of stock in day . Then the equal time Pearson correlation coefficients between stocks and is defined as , where represents the expectation computed over the time-epochs of size and the day ending on , and represents standard deviation of the -th stock evaluated for the same time-epochs. We use to denote the return correlation matrix for the time-epochs ending on day .
Test for Outliers
Silverman [30] proposed a technique for using kernel density estimates to investigate the number of modes in a population. This technique can be used to identify if there is an outlier in the data. If there exists one or more outliers, then we can say that outliers are generating a separate (and distinct) minor mode other than the major mode, and the distribution would have more than a single mode. On the other hand, if there does not exist any outlier, then the distribution would have only one mode and all samples would be generated from a uni-modal distribution.
We wish to find if the smallest eigenvalue () is an outlier or not. So we set up the null hypothesis as – is not an outlier, and the alternative hypothesis as – is an outlier. Further, as indicated in the Lorentzian distribution of Figure 3 (a), we are interested in the lower part of the emerging eigenspectra which has the . So, we consider only the conditional distribution of given the median eigenvalue , i.e., . Hence, the equivalent null hypothesis can be stated as has a single mode. Mathematically,
The alternative hypothesis is
The Silverman test chooses the amount of smoothening automatically. Throughout, we set the level of significance at level. That is, if the p-value is less than 0.001, then only we reject the null hypothesis.
Linear regression Model for market correlation on lagged Smallest Eigenvalue
We consider a linear regression model for (mean market correlation):
where the ’s are the coefficients to be estimated, is the white noise, is the mean market correlation at time point , is the lag- smallest eigenvalue, is the lag- smallest eigenvalue, and is the lag- smallest eigenvalue. Here, we choose for our model.
We then perform the t-test, which tests if lag-1 smallest eigenvalue has statistical effect of mean market correlation ; so, the null hypothesis and the alternate hypothesis can be stated mathematically as:
The -value for estimated is calculated as
where is the standard error in statistics. If the value of , we can say that the last day’s SEV () has statistically significant effect over today’s mean correlation (). The value of itself signifies the strength of the signal. The t-value for estimated over time is presented in Figure 2.
GARCH()
The ARCH() process [27] is defined by the equation
| (1) |
where the are positive parameters and is a random variable with zero mean and variance , characterized by a conditional probability distribution function , which may be chosen as Gaussian. The nature of the memory of the variance is determined by the parameter .
The generalized ARCH process GARCH() was introduced by Bollerslev [31, 27] and is defined by the equation
| (2) |
where are additional control parameters.
The simplest GARCH process is the GARCH(1,1) process, with Gaussian conditional probability distribution function,
| (3) |
The random variable can be written in term of defining , where is a random Gaussian process with zero mean and unit variance. One can rewrite Eq. 3 as a random multiplicative process
| (4) |
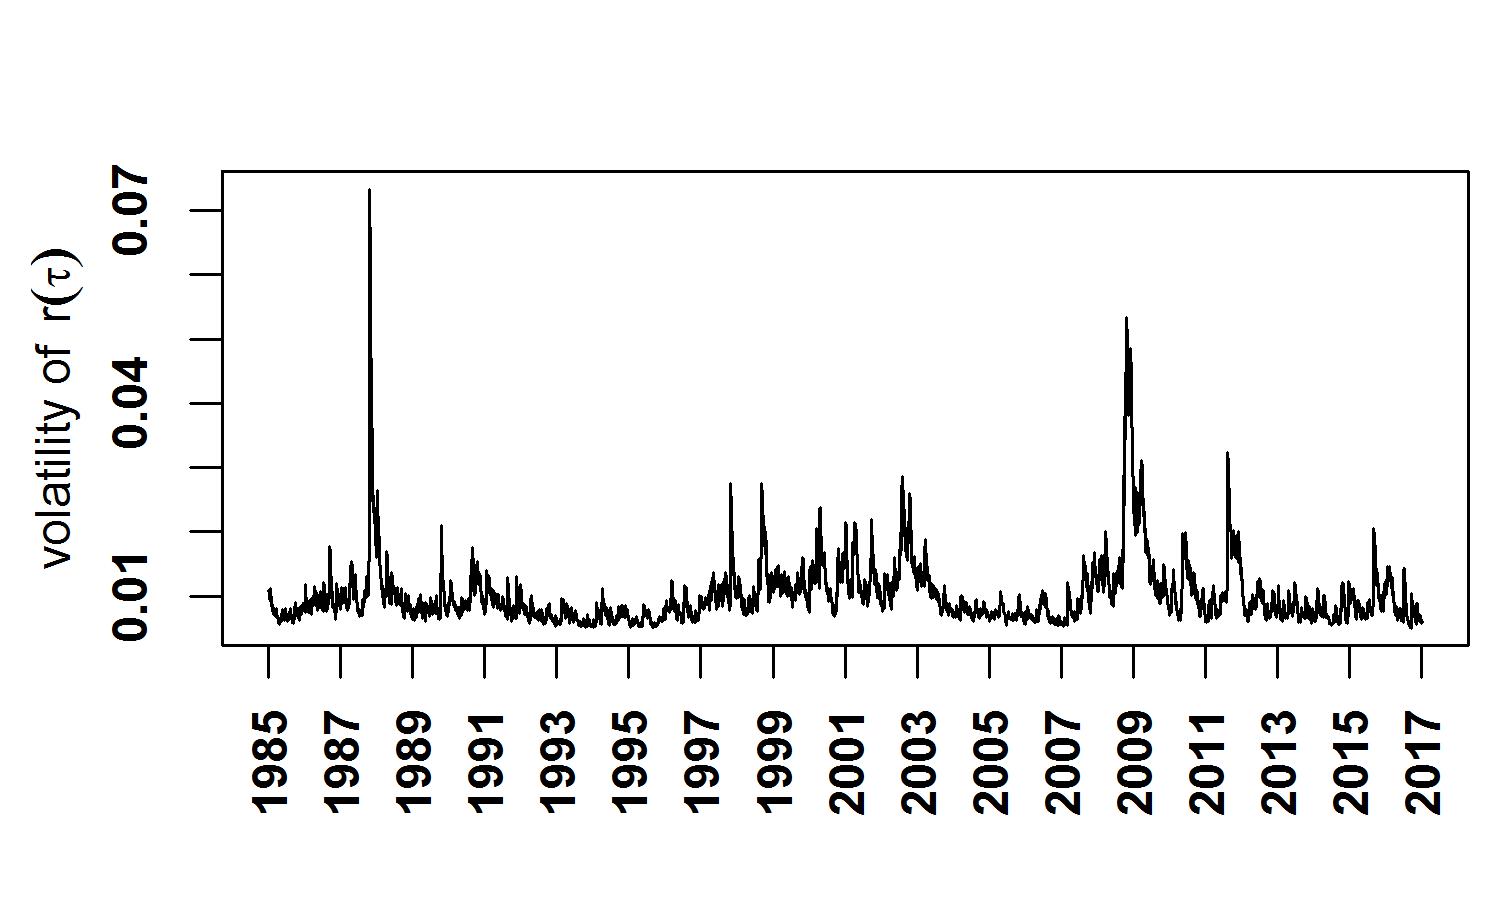
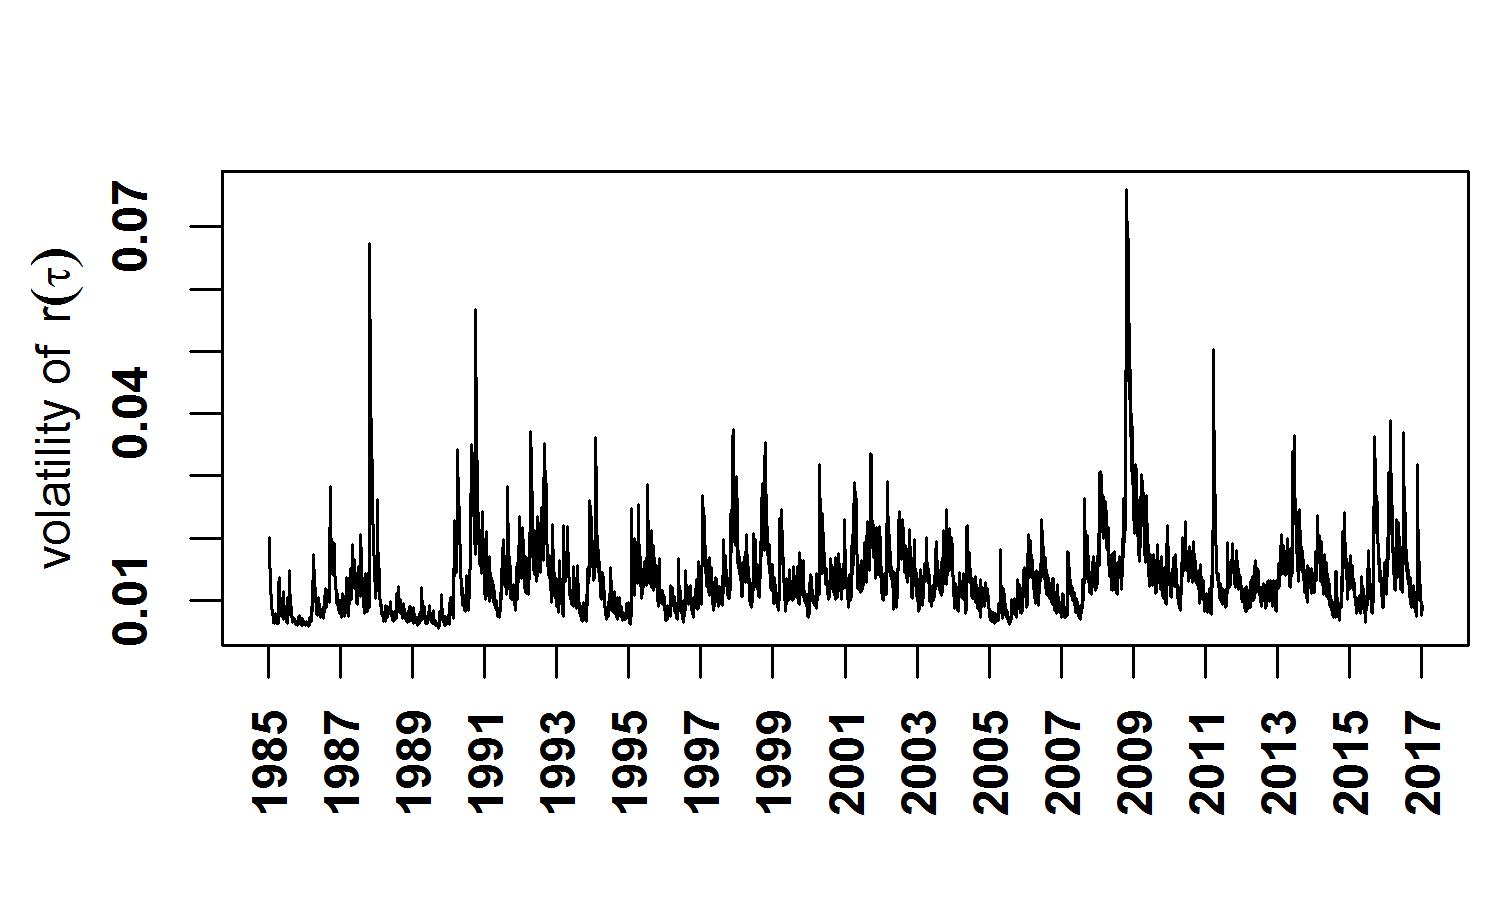
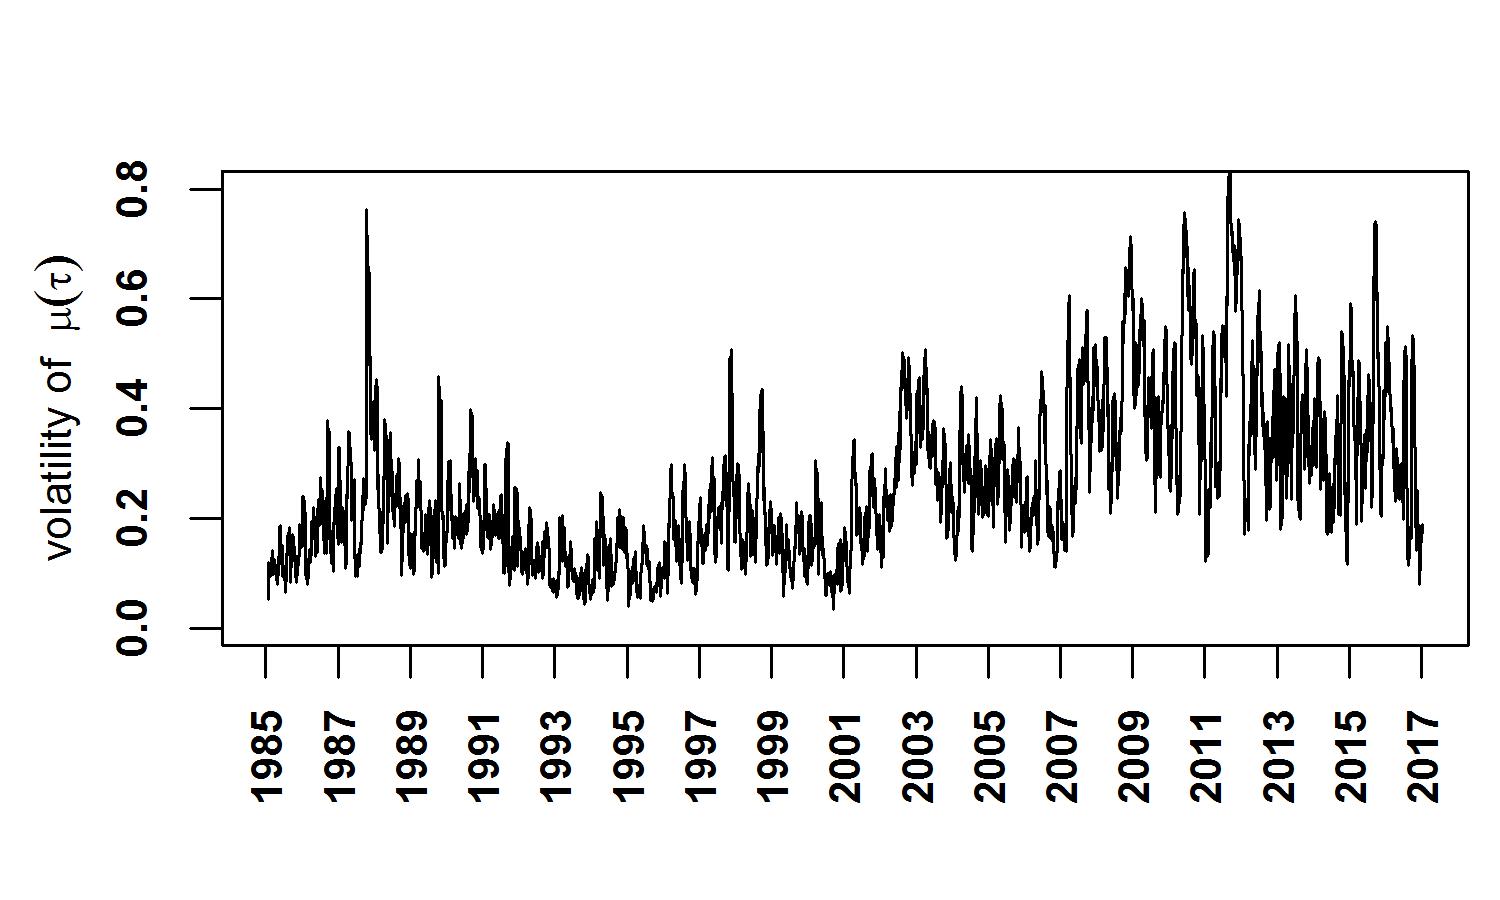
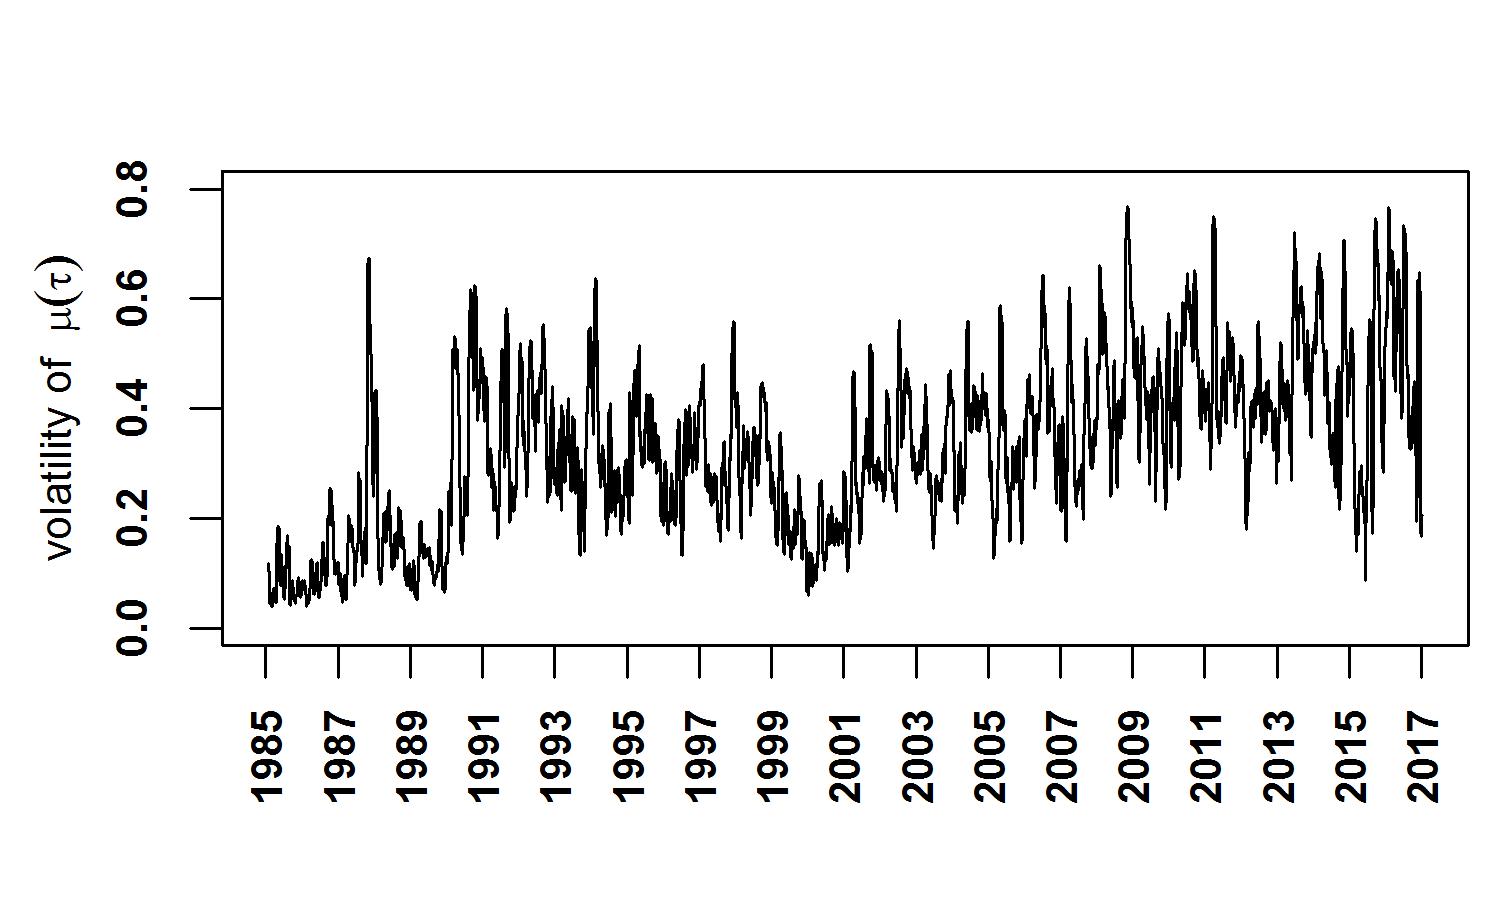
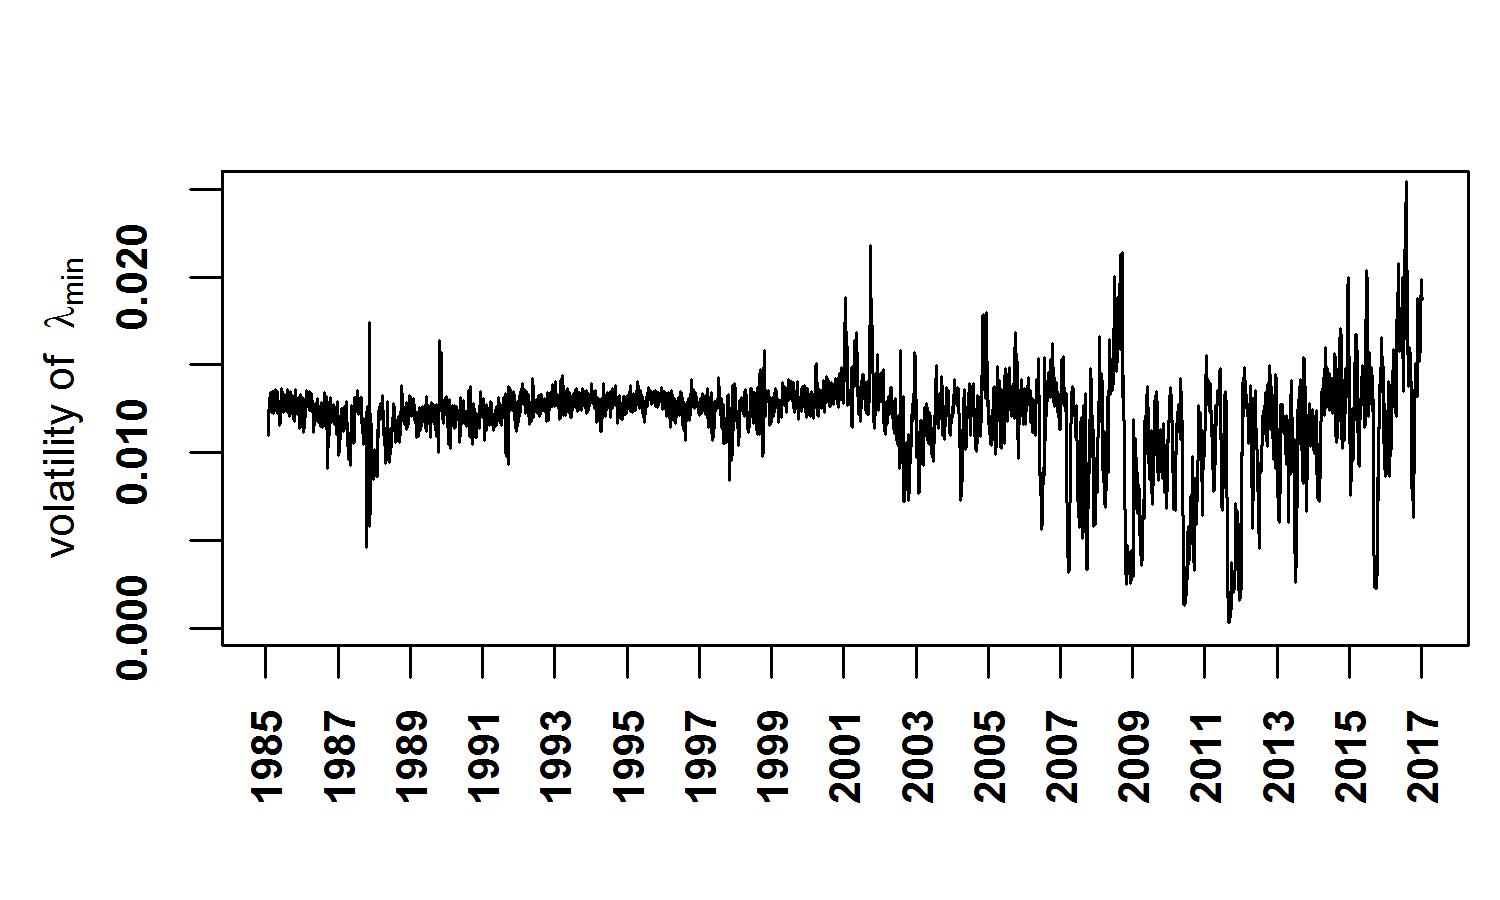
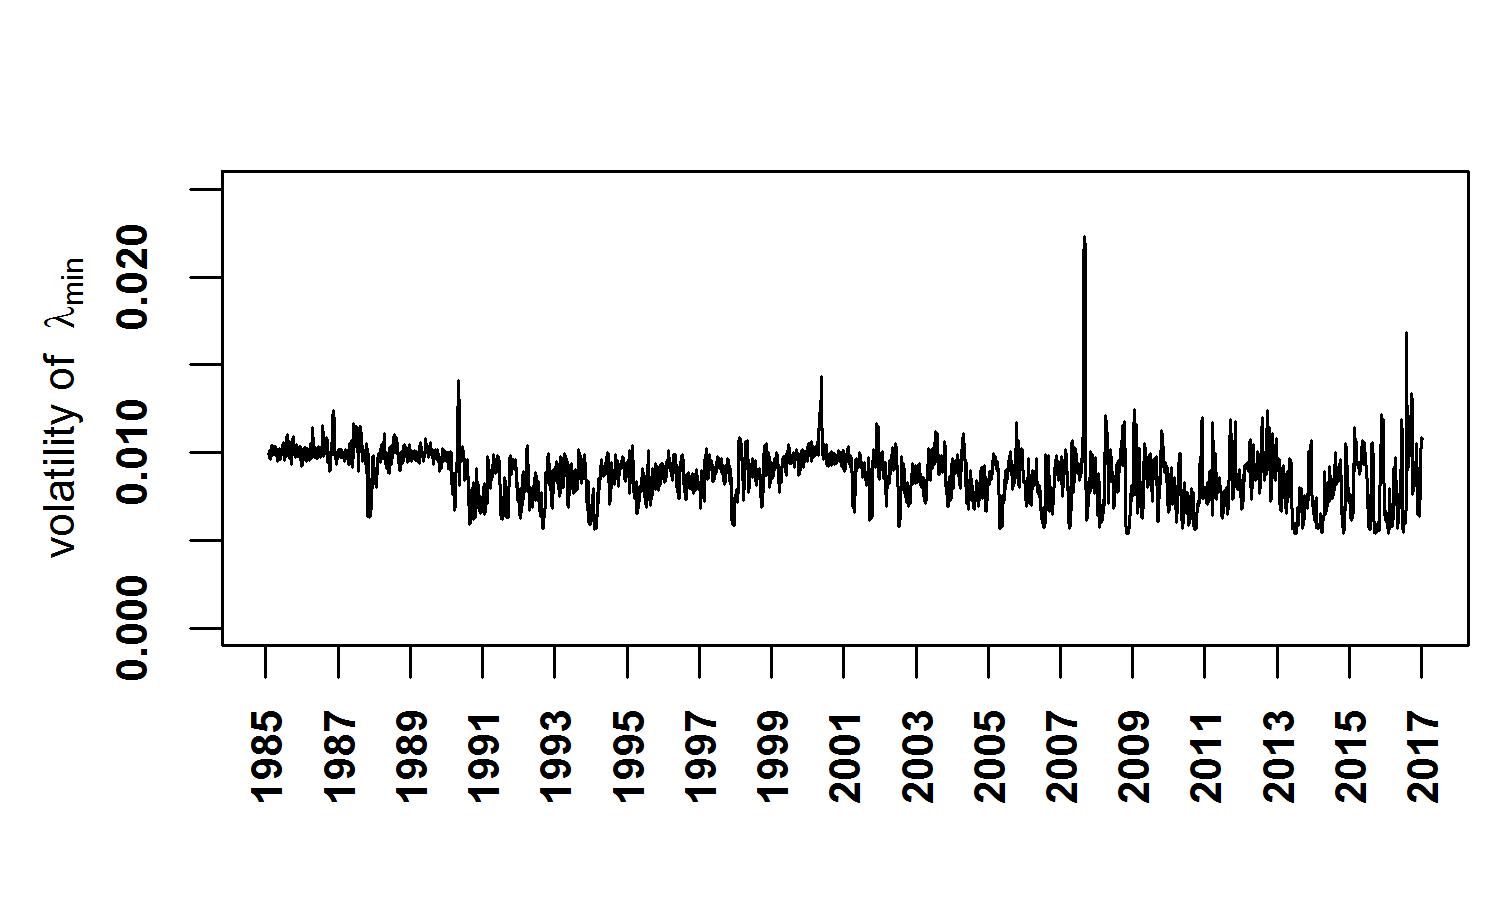
The results for the GARCH(1,1) model fitted on the three variables are shown in the Figure 4.
References
- [1] Vemuri, V. Modeling of Complex Systems: An Introduction (Academic Press, New York, 1978).
- [2] Gell-Mann, M. What is Complexity? Complexity 1, 16–19 (1995).
- [3] Bar-Yam, Y. General Features of Complex Systems. (Encyclopedia of Life Support Systems, EOLSS UNESCO Publishers, Oxford, UK, 2014).
- [4] Mantegna, R. N. & Stanley, H. E. An Introduction to Econophysics: Correlations and Complexity in Finance (Cambridge University Press, Cambridge, 2007).
- [5] Bouchaud, J.-P. & Potters, M. Theory of Financial Risk and Derivative Pricing: From Statistical Physics to Risk Management (Cambridge University Press, Cambridge, 2003).
- [6] Sinha, S., Chatterjee, A., Chakraborti, A. & Chakrabarti, B. Econophysics: An Introduction (Wiley-VCH, Weinheim, 2010).
- [7] Shiller, R. J. Do stock prices move too much to be justified by subsequent changes in dividends? The American Economic Review 71, 421–436 (1981).
- [8] Buchanan, M. Ubiquity: Why Catastrophes Happen (Three Rivers Press, New York, 2000).
- [9] Sornette, D. Why Stock Markets Crash: Critical Events in Complex Financial Systems (Princeton University Press, 2004).
- [10] Sorkin, A. R. Too Big to Fail: The Inside Story of How Wall Street and Washington Fought to Save the Financial System – and Themselves (Viking, New York, 2009).
- [11] Acemoglu, D., Ozdaglar, A. & Tahbaz-Salehi, A. Systemic risk and stability in financial networks. American Economic Review 105, 564–608 (2015).
- [12] Gabaix, X. Variable rare disasters: an exactly solved framework for ten puzzles in macro-finance. The Quarterly Journal of Economics 127, 645–700 (2012).
- [13] Sharma, K., Gopalakrishnan, B., Chakrabarti, A. S. & Chakraborti, A. Financial fluctuations anchored to economic fundamentals: A mesoscopic network approach. Scientific Reports 7, 8055 (2017).
- [14] Acemoglu, D., Carvalho, V. M., Ozdaglar, A. & Tahbaz-Salehi, A. The network origin of aggregate economic fluctuations. Econometrica 80, 1977–2016 (2012).
- [15] Acemoglu, D., Akcigit, U. & Kerr, W. Networks and the macroeconomy: An empirical exploration. NBER Macroeconomics Annual 30, 273–335 (2016).
- [16] Kawamura, H., Hatano, T., Kato, N., Biswas, S., & Chakrabarti, B. K. Statistical physics of fracture, friction, and earthquakes. Rev. Mod. Phys. 84, 839–884 (2012).
- [17] Flores, J., Novaro, O., & Seligman, T. H. Possible resonance effect in the distribution of earthquake damage in Mexico City. Nature 326, 783–785 (1987).
- [18] Mehta, M. L. Random Matrices (Academic press, 2004).
- [19] Bak, P. How Nature Works: The Science of Self-Organized Criticality (Copernicus Press, New York, 1996).
- [20] Albert, R. & Barabási, A.-L. Statistical mechanics of complex networks. Reviews of Modern Physics 74, 47–97 (2002).
- [21] Goldenfeld, N. & Kadanoff, L. P. Simple lessons from complexity. Science 284, 87–89 (1999).
- [22] Onnela, J.-P., Chakraborti, A., Kaski, K., Kertész, J. & Kanto, A. Dynamics of market correlations: taxonomy and portfolio analysis. Physical Review E 68, 056110 (2003).
- [23] Münnix, M. C., Shimada, T., Schäfer, R., Leyvraz, F., Seligman, T. H., Guhr, T. & Stanley, H. E. Identifying states of a financial market. Scientific Reports 2, 644 (2012).
- [24] Guhr, T. & Kälber, B. A new method to estimate the noise in financial correlation matrices. Journal of Physics A: Mathematical and General 36, 3009–3032 (2003).
- [25] Schäfer, R., Nilsson, N. F., & Guhr, T. Power mapping with dynamical adjustment for improved portfolio optimization. Quantitative Finance 10, 107–119 (2010).
- [26] Vinayak, Schäfer, R. & Seligman, T. H. Emerging spectra of singular correlation matrices under small power-map deformations. Physical Review E 88, 032115 (2013).
- [27] Tsay, R. S. Analysis of Financial Time Series (Wiley, 2010).
- [28] Marčenko, V. A. & Pastur, L. A. Distribution of eigenvalues for some sets of random matrices. Mathematics of the USSR-Sbornik 1, 457–483 (1967).
- [29] Yahoo Finance Database (2017). URL https://finance.yahoo.co.jp/. Accessed on 7th July, 2017, using the R open source programming language and software environment for statistical computing and graphics.
- [30] Silverman, B. W. Using kernel density estimates to investigate multimodality. Journal of the Royal Statistical Society B 43, 97–99 (1981).
- [31] Bollerslev, T. Generalized Autoregressive Conditional Heteroskedasticity. J. Econometrics 31, 307–327 (1986).
Acknowledgements
The authors are grateful to Anindya S. Chakrabarti, Sujoy Chakravarty and Francois Leyvraz for their critical inputs and suggestions. A.C. and K.S. acknowledge the support by grant number BT/BI/03/004/2003(C) of Govt. of India, Ministry of Science and Technology, Department of Biotechnology, Bioinformatics division, University of Potential Excellence-II grant (Project ID-47) of JNU, New Delhi, and the DST-PURSE grant given to JNU by the Department of Science and Technology, Government of India. K.S. acknowledges the University Grants Commission (Ministry of Human Research Development, Govt. of India) for her senior research fellowship. S.D. is partially supported by the Infosys grant to CMI. H.K.P. and R.C. are grateful for postdoctoral fellowships provided by UNAM-DGAPA. T.H.S. acknowledges the support grant by CONACyT through Project FRONTERAS 201. A.C., K.S. and T.H.S. acknowledge support from the project UNAM-DGAPA-PAPIIT IG 100616.
Author contributions statement
A.C. and T.H.S. designed research; A.C., K.S., H.K.P., and S.D. performed research; K.S., H.K.P. and R.C. processed and analyzed data; K.S. prepared all the figures, and A.C. and T.H.S. wrote the manuscript with input from all authors.
Supplementary information: Lists of stocks along with sectors
| S.No. | Code | Company Name | Sector | Abbrv |
|---|---|---|---|---|
| 1 | CMCSA | Comcast Corp. | Consumer Discretionary | CD |
| 2 | DIS | The Walt Disney Company | Consumer Discretionary | CD |
| 3 | F | Ford Motor | Consumer Discretionary | CD |
| 4 | GPC | Genuine Parts | Consumer Discretionary | CD |
| 5 | GPS | Gap Inc. | Consumer Discretionary | CD |
| 6 | GT | Goodyear Tire & Rubber | Consumer Discretionary | CD |
| 7 | HAS | Hasbro Inc. | Consumer Discretionary | CD |
| 8 | HD | Home Depot | Consumer Discretionary | CD |
| 9 | HRB | Block H&R | Consumer Discretionary | CD |
| 10 | IPG | Interpublic Group | Consumer Discretionary | CD |
| 11 | JCP | J. C. Penney Company, Inc. | Consumer Discretionary | CD |
| 12 | JWN | Nordstrom | Consumer Discretionary | CD |
| 13 | LEG | Leggett & Platt | Consumer Discretionary | CD |
| 14 | LEN | Lennar Corp. | Consumer Discretionary | CD |
| 15 | LOW | Lowe’s Cos. | Consumer Discretionary | CD |
| 16 | MAT | Mattel Inc. | Consumer Discretionary | CD |
| 17 | MCD | McDonald’s Corp. | Consumer Discretionary | CD |
| 18 | NKE | Nike | Consumer Discretionary | CD |
| 19 | SHW | Sherwin-Williams | Consumer Discretionary | CD |
| 20 | TGT | Target Corp. | Consumer Discretionary | CD |
| 21 | VFC | V.F. Corp. | Consumer Discretionary | CD |
| 22 | WHR | Whirlpool Corp. | Consumer Discretionary | CD |
| 23 | ADM | Archer-Daniels-Midland Co | Consumer Staples | CS |
| 24 | AVP | Avon Products, Inc. | Consumer Staples | CS |
| 25 | CAG | Conagra Brands | Consumer Staples | CS |
| 26 | CL | Colgate-Palmolive | Consumer Staples | CS |
| 27 | CPB | Campbell Soup | Consumer Staples | CS |
| 28 | CVS | CVS Health | Consumer Staples | CS |
| 29 | GIS | General Mills | Consumer Staples | CS |
| 30 | HRL | Hormel Foods Corp. | Consumer Staples | CS |
| 31 | HSY | The Hershey Company | Consumer Staples | CS |
| 32 | K | Kellogg Co. | Consumer Staples | CS |
| 33 | KMB | Kimberly-Clark | Consumer Staples | CS |
| 34 | KO | Coca-Cola Company (The) | Consumer Staples | CS |
| 35 | KR | Kroger Co. | Consumer Staples | CS |
| 36 | MKC | McCormick & Co. | Consumer Staples | CS |
| 37 | MO | Altria Group Inc | Consumer Staples | CS |
| 38 | SYY | Sysco Corp. | Consumer Staples | CS |
| 39 | TAP | Molson Coors Brewing Company | Consumer Staples | CS |
| 40 | TSN | Tyson Foods | Consumer Staples | CS |
| 41 | WMT | Wal-Mart Stores | Consumer Staples | CS |
| 42 | APA | Apache Corporation | Energy | EG |
| 43 | COP | ConocoPhillips | Energy | EG |
| 44 | CVX | Chevron Corp. | Energy | EG |
| 45 | ESV | Ensco plc | Energy | EG |
| 46 | HAL | Halliburton Co. | Energy | EG |
| 47 | HES | Hess Corporation | Energy | EG |
| 48 | HP | Helmerich & Payne | Energy | EG |
| 49 | MRO | Marathon Oil Corp. | Energy | EG |
| 50 | MUR | Murphy Oil Corporation | Energy | EG |
| 51 | NBL | Noble Energy Inc | Energy | EG |
|---|---|---|---|---|
| 52 | NBR | Nabors Industries Ltd. | Energy | EG |
| 53 | SLB | Schlumberger Ltd. | Energy | EG |
| 54 | TSO | Tesoro Corp | Energy | EG |
| 55 | VLO | Valero Energy | Energy | EG |
| 56 | WMB | Williams Cos. | Energy | EG |
| 57 | XOM | Exxon Mobil Corp. | Energy | EG |
| 58 | AFL | AFLAC Inc | Financials | FN |
| 59 | AIG | American International Group, Inc. | Financials | FN |
| 60 | AON | Aon plc | Financials | FN |
| 61 | AXP | American Express Co | Financials | FN |
| 62 | BAC | Bank of America Corp | Financials | FN |
| 63 | BBT | BB&T Corporation | Financials | FN |
| 64 | BEN | Franklin Resources | Financials | FN |
| 65 | BK | The Bank of New York Mellon Corp. | Financials | FN |
| 66 | C | Citigroup Inc. | Financials | FN |
| 67 | CB | Chubb Limited | Financials | FN |
| 68 | CINF | Cincinnati Financial | Financials | FN |
| 69 | CMA | Comerica Inc. | Financials | FN |
| 70 | EFX | Equifax Inc. | Financials | FN |
| 71 | FHN | First Horizon National Corporation | Financials | FN |
| 72 | HBAN | Huntington Bancshares | Financials | FN |
| 73 | HCN | Welltower Inc. | Financials | FN |
| 74 | HST | Host Hotels & Resorts, Inc. | Financials | FN |
| 75 | JPM | JPMorgan Chase & Co. | Financials | FN |
| 76 | L | Loews Corp. | Financials | FN |
| 77 | LM | Legg Mason, Inc. | Financials | FN |
| 78 | LNC | Lincoln National | Financials | FN |
| 79 | LUK | Leucadia National Corp. | Financials | FN |
| 80 | MMC | Marsh & McLennan | Financials | FN |
| 81 | MTB | M&T Bank Corp. | Financials | FN |
| 82 | PSA | Public Storage | Financials | FN |
| 83 | SLM | SLM Corporation | Financials | FN |
| 84 | TMK | Torchmark Corp. | Financials | FN |
| 85 | TRV | The Travelers Companies Inc. | Financials | FN |
| 86 | USB | U.S. Bancorp | Financials | FN |
| 87 | VNO | Vornado Realty Trust | Financials | FN |
| 88 | WFC | Wells Fargo | Financials | FN |
| 89 | WY | Weyerhaeuser Corp. | Financials | FN |
| 90 | ZION | Zions Bancorp | Financials | FN |
| 91 | ABT | Abbott Laboratories | Health Care | HC |
| 92 | AET | Aetna Inc | Health Care | HC |
| 93 | AMGN | Amgen Inc | Health Care | HC |
| 94 | BAX | Baxter International Inc. | Health Care | HC |
| 95 | BCR | Bard (C.R.) Inc. | Health Care | HC |
| 96 | BDX | Becton Dickinson | Health Care | HC |
| 97 | BMY | Bristol-Myers Squibb | Health Care | HC |
| 98 | CAH | Cardinal Health Inc. | Health Care | HC |
| 99 | CI | CIGNA Corp. | Health Care | HC |
| 100 | HUM | Humana Inc. | Health Care | HC |
| 101 | JNJ | Johnson & Johnson | Health Care | HC |
|---|---|---|---|---|
| 102 | LLY | Lilly (Eli) & Co. | Health Care | HC |
| 103 | MDT | Medtronic plc | Health Care | HC |
| 104 | MRK | Merck & Co. | Health Care | HC |
| 105 | MYL | Mylan N.V. | Health Care | HC |
| 106 | SYK | Stryker Corp. | Health Care | HC |
| 107 | THC | Tenet Healthcare Corp | Health Care | HC |
| 108 | TMO | Thermo Fisher Scientific | Health Care | HC |
| 109 | UNH | United Health Group Inc. | Health Care | HC |
| 110 | VAR | Varian Medical Systems | Health Care | HC |
| 111 | AVY | Avery Dennison Corp | Industrials | ID |
| 112 | BA | Boeing Company | Industrials | ID |
| 113 | CAT | Caterpillar Inc. | Industrials | ID |
| 114 | CMI | Cummins Inc. | Industrials | ID |
| 115 | CSX | CSX Corp. | Industrials | ID |
| 116 | CTAS | Cintas Corporation | Industrials | ID |
| 117 | DE | Deere & Co. | Industrials | ID |
| 118 | DHR | Danaher Corp. | Industrials | ID |
| 119 | DNB | The Dun & Bradstreet Corporation | Industrials | ID |
| 120 | DOV | Dover Corp. | Industrials | ID |
| 121 | EMR | Emerson Electric Company | Industrials | ID |
| 122 | ETN | Eaton Corporation | Industrials | ID |
| 123 | EXPD | Expeditors International | Industrials | ID |
| 124 | FDX | FedEx Corporation | Industrials | ID |
| 125 | FLS | Flowserve Corporation | Industrials | ID |
| 126 | GD | General Dynamics | Industrials | ID |
| 127 | GE | General Electric | Industrials | ID |
| 128 | GLW | Corning Inc. | Industrials | ID |
| 129 | GWW | Grainger (W.W.) Inc. | Industrials | ID |
| 130 | HON | Honeywell Int’l Inc. | Industrials | ID |
| 131 | IR | Ingersoll-Rand PLC | Industrials | ID |
| 132 | ITW | Illinois Tool Works | Industrials | ID |
| 133 | JEC | Jacobs Engineering Group | Industrials | ID |
| 134 | LMT | Lockheed Martin Corp. | Industrials | ID |
| 135 | LUV | Southwest Airlines | Industrials | ID |
| 136 | MAS | Masco Corp. | Industrials | ID |
| 137 | MMM | 3M Company | Industrials | ID |
| 138 | ROK | Rockwell Automation Inc. | Industrials | ID |
| 139 | RTN | Raytheon Co. | Industrials | ID |
| 140 | TXT | Textron Inc. | Industrials | ID |
| 141 | UNP | Union Pacific | Industrials | ID |
| 142 | UTX | United Technologies | Industrials | ID |
| 143 | AAPL | Apple Inc. | Information Technology | IT |
| 144 | ADI | Analog Devices, Inc. | Information Technology | IT |
| 145 | ADP | Automatic Data Processing | Information Technology | IT |
| 146 | AMAT | Applied Materials Inc | Information Technology | IT |
| 147 | AMD | Advanced Micro Devices Inc | Information Technology | IT |
| 148 | CA | CA, Inc. | Information Technology | IT |
| 149 | HPQ | HP Inc. | Information Technology | IT |
| 150 | HRS | Harris Corporation | Information Technology | IT |
| 151 | IBM | International Business Machines | Information Technology | IT |
|---|---|---|---|---|
| 152 | INTC | Intel Corp. | Information Technology | IT |
| 153 | KLAC | KLA-Tencor Corp. | Information Technology | IT |
| 154 | LRCX | Lam Research | Information Technology | IT |
| 155 | MSI | Motorola Solutions Inc. | Information Technology | IT |
| 156 | MU | Micron Technology | Information Technology | IT |
| 157 | TSS | Total System Services, Inc. | Information Technology | IT |
| 158 | TXN | Texas Instruments | Information Technology | IT |
| 159 | WDC | Western Digital | Information Technology | IT |
| 160 | XRX | Xerox Corp. | Information Technology | IT |
| 161 | AA | Alcoa Corporation | Materials | MT |
| 162 | APD | Air Products & Chemicals Inc | Materials | MT |
| 163 | BLL | Ball Corp | Materials | MT |
| 164 | BMS | Bemis Company, Inc. | Materials | MT |
| 165 | CLF | Cleveland-Cliffs Inc. | Materials | MT |
| 166 | DD | DuPont | Materials | MT |
| 167 | ECL | Ecolab Inc. | Materials | MT |
| 168 | FMC | FMC Corporation | Materials | MT |
| 169 | IFF | Intl Flavors & Fragrances | Materials | MT |
| 170 | IP | International Paper | Materials | MT |
| 171 | NEM | Newmont Mining Corporation | Materials | MT |
| 172 | PPG | PPG Industries | Materials | MT |
| 173 | VMC | Vulcan Materials | Materials | MT |
| 174 | CTL | CenturyLink Inc | Telecommunication Services | TC |
| 175 | FTR | Frontier Communications Corporation | Telecommunication Services | TC |
| 176 | S | Sprint Nextel Corp. | Telecommunication Services | TC |
| 177 | T | AT&T Inc | Telecommunication Services | TC |
| 178 | VZ | Verizon Communications | Telecommunication Services | TC |
| 179 | AEP | American Electric Power | Utilities | UT |
| 180 | CMS | CMS Energy | Utilities | UT |
| 181 | CNP | CenterPoint Energy | Utilities | UT |
| 182 | D | Dominion Energy | Utilities | UT |
| 183 | DTE | DTE Energy Co. | Utilities | UT |
| 184 | ED | Consolidated Edison | Utilities | UT |
| 185 | EIX | Edison Int’l | Utilities | UT |
| 186 | EQT | EQT Corporation | Utilities | UT |
| 187 | ETR | Entergy Corp. | Utilities | UT |
| 188 | EXC | Exelon Corp. | Utilities | UT |
| 189 | NEE | NextEra Energy | Utilities | UT |
| 190 | NI | NiSource Inc. | Utilities | UT |
| 191 | PNW | Pinnacle West Capital | Utilities | UT |
| 192 | SO | Southern Co. | Utilities | UT |
| 193 | WEC | Wec Energy Group Inc | Utilities | UT |
| 194 | XEL | Xcel Energy Inc | Utilities | UT |
| S.No. | Code | Company Name | Sector | Abbrv |
|---|---|---|---|---|
| 1 | S-8801 | MITSUI FUDOSAN CO., LTD. | Capital Goods | CG |
| 2 | S-8802 | MITSUBISHI ESTATE CO., LTD. | Capital Goods | CG |
| 3 | S-8804 | TOKYO TATEMONO CO., LTD. | Capital Goods | CG |
| 4 | S-8830 | SUMITOMO REALTY & DEVELOPMENT CO., LTD. | Capital Goods | CG |
| 5 | S-7003 | MITSUI ENG. & SHIPBUILD. CO., LTD. | Capital Goods | CG |
| 6 | S-7012 | KAWASAKI HEAVY IND., LTD. | Capital Goods | CG |
| 7 | S-9202 | ANA HOLDINGS INC. | Capital Goods | CG |
| 8 | S-1801 | TAISEI CORP. | Capital Goods | CG |
| 9 | S-1802 | OBAYASHI CORP. | Capital Goods | CG |
| 10 | S-1803 | SHIMIZU CORP. | Capital Goods | CG |
| 11 | S-1808 | HASEKO CORP. | Capital Goods | CG |
| 12 | S-1812 | KAJIMA CORP. | Capital Goods | CG |
| 13 | S-1925 | DAIWA HOUSE IND. CO., LTD. | Capital Goods | CG |
| 14 | S-1928 | SEKISUI HOUSE, LTD. | Capital Goods | CG |
| 15 | S-1963 | JGC CORP. | Capital Goods | CG |
| 16 | S-5631 | THE JAPAN STEEL WORKS, LTD. | Capital Goods | CG |
| 17 | S-6103 | OKUMA CORP. | Capital Goods | CG |
| 18 | S-6113 | AMADA HOLDINGS CO., LTD. | Capital Goods | CG |
| 19 | S-6301 | KOMATSU LTD. | Capital Goods | CG |
| 20 | S-6302 | SUMITOMO HEAVY IND., LTD. | Capital Goods | CG |
| 21 | S-6305 | HITACHI CONST. MACH. CO., LTD. | Capital Goods | CG |
| 22 | S-6326 | KUBOTA CORP. | Capital Goods | CG |
| 23 | S-6361 | EBARA CORP. | Capital Goods | CG |
| 24 | S-6366 | CHIYODA CORP. | Capital Goods | CG |
| 25 | S-6367 | DAIKIN INDUSTRIES, LTD. | Capital Goods | CG |
| 26 | S-6471 | NSK LTD. | Capital Goods | CG |
| 27 | S-6472 | NTN CORP. | Capital Goods | CG |
| 28 | S-6473 | JTEKT CORP. | Capital Goods | CG |
| 29 | S-7004 | HITACHI ZOSEN CORP. | Capital Goods | CG |
| 30 | S-7011 | MITSUBISHI HEAVY IND., LTD. | Capital Goods | CG |
| 31 | S-7013 | IHI CORP. | Capital Goods | CG |
| 32 | S-7911 | TOPPAN PRINTING CO., LTD. | Capital Goods | CG |
| 33 | S-7912 | DAI NIPPON PRINTING CO., LTD. | Capital Goods | CG |
| 34 | S-7951 | YAMAHA CORP. | Capital Goods | CG |
| 35 | S-1332 | NIPPON SUISAN KAISHA, LTD. | Consumer Goods | CN |
| 36 | S-2002 | NISSHIN SEIFUN GROUP INC. | Consumer Goods | CN |
| 37 | S-2282 | NH FOODS LTD. | Consumer Goods | CN |
| 38 | S-2501 | SAPPORO HOLDINGS LTD. | Consumer Goods | CN |
| 39 | S-2502 | ASAHI GROUP HOLDINGS, LTD. | Consumer Goods | CN |
| 40 | S-2503 | KIRIN HOLDINGS CO., LTD. | Consumer Goods | CN |
| 41 | S-2531 | TAKARA HOLDINGS INC. | Consumer Goods | CN |
| 42 | S-2801 | KIKKOMAN CORP. | Consumer Goods | CN |
| 43 | S-2802 | AJINOMOTO CO., INC. | Consumer Goods | CN |
| 44 | S-2871 | NICHIREI CORP. | Consumer Goods | CN |
| 45 | S-8233 | TAKASHIMAYA CO., LTD. | Consumer Goods | CN |
| 46 | S-8252 | MARUI GROUP CO., LTD. | Consumer Goods | CN |
| 47 | S-8267 | AEON CO., LTD. | Consumer Goods | CN |
| 48 | S-9602 | TOHO CO., LTD | Consumer Goods | CN |
| 49 | S-9681 | TOKYO DOME CORP. | Consumer Goods | CN |
| 50 | S-9735 | SECOM CO., LTD. | Consumer Goods | CN |
| 51 | S-8331 | THE CHIBA BANK, LTD. | Financials | FN |
|---|---|---|---|---|
| 52 | S-8355 | THE SHIZUOKA BANK, LTD. | Financials | FN |
| 53 | S-8253 | CREDIT SAISON CO., LTD. | Financials | FN |
| 54 | S-8601 | DAIWA SECURITIES GROUP INC. | Financials | FN |
| 55 | S-8604 | NOMURA HOLDINGS, INC. | Financials | FN |
| 56 | S-3405 | KURARAY CO., LTD. | Materials | MT |
| 57 | S-3407 | ASAHI KASEI CORP. | Materials | MT |
| 58 | S-4004 | SHOWA DENKO K.K. | Materials | MT |
| 59 | S-4005 | SUMITOMO CHEMICAL CO., LTD. | Materials | MT |
| 60 | S-4021 | NISSAN CHEMICAL IND., LTD. | Materials | MT |
| 61 | S-4042 | TOSOH CORP. | Materials | MT |
| 62 | S-4043 | TOKUYAMA CORP. | Materials | MT |
| 63 | S-4061 | DENKA CO., LTD. | Materials | MT |
| 64 | S-4063 | SHIN-ETSU CHEMICAL CO., LTD. | Materials | MT |
| 65 | S-4183 | MITSUI CHEMICALS, INC. | Materials | MT |
| 66 | S-4208 | UBE INDUSTRIES, LTD. | Materials | MT |
| 67 | S-4272 | NIPPON KAYAKU CO., LTD. | Materials | MT |
| 68 | S-4452 | KAO CORP. | Materials | MT |
| 69 | S-4901 | FUJIFILM HOLDINGS CORP. | Materials | MT |
| 70 | S-4911 | SHISEIDO CO., LTD. | Materials | MT |
| 71 | S-6988 | NITTO DENKO CORP. | Materials | MT |
| 72 | S-5002 | SHOWA SHELL SEKIYU K.K. | Materials | MT |
| 73 | S-5201 | ASAHI GLASS CO., LTD. | Materials | MT |
| 74 | S-5202 | NIPPON SHEET GLASS CO., LTD. | Materials | MT |
| 75 | S-5214 | NIPPON ELECTRIC GLASS CO., LTD. | Materials | MT |
| 76 | S-5232 | SUMITOMO OSAKA CEMENT CO., LTD. | Materials | MT |
| 77 | S-5233 | TAIHEIYO CEMENT CORP. | Materials | MT |
| 78 | S-5301 | TOKAI CARBON CO., LTD. | Materials | MT |
| 79 | S-5332 | TOTO LTD. | Materials | MT |
| 80 | S-5333 | NGK INSULATORS, LTD. | Materials | MT |
| 81 | S-5706 | MITSUI MINING & SMELTING CO. | Materials | MT |
| 82 | S-5707 | TOHO ZINC CO., LTD. | Materials | MT |
| 83 | S-5711 | MITSUBISHI MATERIALS CORP. | Materials | MT |
| 84 | S-5713 | SUMITOMO METAL MINING CO., LTD. | Materials | MT |
| 85 | S-5714 | DOWA HOLDINGS CO., LTD. | Materials | MT |
| 86 | S-5715 | FURUKAWA CO., LTD. | Materials | MT |
| 87 | S-5801 | FURUKAWA ELECTRIC CO., LTD. | Materials | MT |
| 88 | S-5802 | SUMITOMO ELECTRIC IND., LTD. | Materials | MT |
| 89 | S-5803 | FUJIKURA LTD. | Materials | MT |
| 90 | S-5901 | TOYO SEIKAN GROUP HOLDINGS, LTD. | Materials | MT |
| 91 | S-3865 | HOKUETSU KISHU PAPER CO., LTD. | Materials | MT |
| 92 | S-3861 | OJI HOLDINGS CORP. | Materials | MT |
| 93 | S-5101 | THE YOKOHAMA RUBBER CO., LTD. | Materials | MT |
| 94 | S-5108 | BRIDGESTONE CORP. | Materials | MT |
| 95 | S-5401 | NIPPON STEEL & SUMITOMO METAL CORP. | Materials | MT |
| 96 | S-5406 | KOBE STEEL, LTD. | Materials | MT |
| 97 | S-5541 | PACIFIC METALS CO., LTD. | Materials | MT |
| 98 | S-3101 | TOYOBO CO., LTD. | Materials | MT |
| 99 | S-3103 | UNITIKA, LTD. | Materials | MT |
| 100 | S-3401 | TEIJIN LTD. | Materials | MT |
| 101 | S-3402 | TORAY INDUSTRIES, INC. | Materials | MT |
|---|---|---|---|---|
| 102 | S-8001 | ITOCHU CORP. | Materials | MT |
| 103 | S-8002 | MARUBENI CORP. | Materials | MT |
| 104 | S-8015 | TOYOTA TSUSHO CORP. | Materials | MT |
| 105 | S-8031 | MITSUI & CO., LTD. | Materials | MT |
| 106 | S-8053 | SUMITOMO CORP. | Materials | MT |
| 107 | S-8058 | MITSUBISHI CORP. | Materials | MT |
| 108 | S-4151 | KYOWA HAKKO KIRIN CO., LTD. | Pharmaceuticals | PH |
| 109 | S-4503 | ASTELLAS PHARMA INC. | Pharmaceuticals | PH |
| 110 | S-4506 | SUMITOMO DAINIPPON PHARMA CO., LTD. | Pharmaceuticals | PH |
| 111 | S-4507 | SHIONOGI & CO., LTD. | Pharmaceuticals | PH |
| 112 | S-4519 | CHUGAI PHARMACEUTICAL CO., LTD. | Pharmaceuticals | PH |
| 113 | S-4523 | EISAI CO., LTD. | Pharmaceuticals | PH |
| 114 | S-7201 | NISSAN MOTOR CO., LTD. | Information Technology | IT |
| 115 | S-7202 | ISUZU MOTORS LTD. | Information Technology | IT |
| 116 | S-7205 | HINO MOTORS, LTD. | Information Technology | IT |
| 117 | S-7261 | MAZDA MOTOR CORP. | Information Technology | IT |
| 118 | S-7267 | HONDA MOTOR CO., LTD. | Information Technology | IT |
| 119 | S-7270 | SUBARU CORP. | Information Technology | IT |
| 120 | S-7272 | YAMAHA MOTOR CO., LTD. | Information Technology | IT |
| 121 | S-3105 | NISSHINBO HOLDINGS INC. | Information Technology | IT |
| 122 | S-6479 | MINEBEA MITSUMI INC. | Information Technology | IT |
| 123 | S-6501 | HITACHI, LTD. | Information Technology | IT |
| 124 | S-6502 | TOSHIBA CORP. | Information Technology | IT |
| 125 | S-6503 | MITSUBISHI ELECTRIC CORP. | Information Technology | IT |
| 126 | S-6504 | FUJI ELECTRIC CO., LTD. | Information Technology | IT |
| 127 | S-6506 | YASKAWA ELECTRIC CORP. | Information Technology | IT |
| 128 | S-6508 | MEIDENSHA CORP. | Information Technology | IT |
| 129 | S-6701 | NEC CORP. | Information Technology | IT |
| 130 | S-6702 | FUJITSU LTD. | Information Technology | IT |
| 131 | S-6703 | OKI ELECTRIC IND. CO., LTD. | Information Technology | IT |
| 132 | S-6752 | PANASONIC CORP. | Information Technology | IT |
| 133 | S-6758 | SONY CORP. | Information Technology | IT |
| 134 | S-6762 | TDK CORP. | Information Technology | IT |
| 135 | S-6770 | ALPS ELECTRIC CO., LTD. | Information Technology | IT |
| 136 | S-6773 | PIONEER CORP. | Information Technology | IT |
| 137 | S-6841 | YOKOGAWA ELECTRIC CORP. | Information Technology | IT |
| 138 | S-6902 | DENSO CORP. | Information Technology | IT |
| 139 | S-6952 | CASIO COMPUTER CO., LTD. | Information Technology | IT |
| 140 | S-6954 | FANUC CORP. | Information Technology | IT |
| 141 | S-6971 | KYOCERA CORP. | Information Technology | IT |
| 142 | S-6976 | TAIYO YUDEN CO., LTD. | Information Technology | IT |
| 143 | S-7752 | RICOH CO., LTD. | Information Technology | IT |
| 144 | S-8035 | TOKYO ELECTRON LTD. | Information Technology | IT |
| 145 | S-4543 | TERUMO CORP. | Information Technology | IT |
| 146 | S-4902 | KONICA MINOLTA, INC. | Information Technology | IT |
| 147 | S-7731 | NIKON CORP. | Information Technology | IT |
| 148 | S-7733 | OLYMPUS CORP. | Information Technology | IT |
| 149 | S-7762 | CITIZEN WATCH CO., LTD. | Information Technology | IT |
| 150 | S-9501 | TOKYO ELECTRIC POWER COMPANY HOLDINGS, I | Transportation & Utilities | TU |
| 151 | S-9502 | CHUBU ELECTRIC POWER CO., INC. | Transportation & Utilities | TU |
|---|---|---|---|---|
| 152 | S-9503 | THE KANSAI ELECTRIC POWER CO., INC. | Transportation & Utilities | TU |
| 153 | S-9531 | TOKYO GAS CO., LTD. | Transportation & Utilities | TU |
| 154 | S-9532 | OSAKA GAS CO., LTD. | Transportation & Utilities | TU |
| 155 | S-9062 | NIPPON EXPRESS CO., LTD. | Transportation & Utilities | TU |
| 156 | S-9064 | YAMATO HOLDINGS CO., LTD. | Transportation & Utilities | TU |
| 157 | S-9101 | NIPPON YUSEN K.K. | Transportation & Utilities | TU |
| 158 | S-9104 | MITSUI O.S.K.LINES, LTD. | Transportation & Utilities | TU |
| 159 | S-9107 | KAWASAKI KISEN KAISHA, LTD. | Transportation & Utilities | TU |
| 160 | S-9001 | TOBU RAILWAY CO., LTD. | Transportation & Utilities | TU |
| 161 | S-9005 | TOKYU CORP. | Transportation & Utilities | TU |
| 162 | S-9007 | ODAKYU ELECTRIC RAILWAY CO., LTD. | Transportation & Utilities | TU |
| 163 | S-9008 | KEIO CORP. | Transportation & Utilities | TU |
| 164 | S-9009 | KEISEI ELECTRIC RAILWAY CO., LTD. | Transportation & Utilities | TU |
| 165 | S-9301 | MITSUBISHI LOGISTICS CORP. | Transportation & Utilities | TU |