Fano description of single-hydrocarbon fluorescence excited by a scanning tunneling microscope
Abstract
The detection of fluorescence with submolecular resolution enables the exploration of spatially varying photon yields and vibronic properties at the single-molecule level. By placing individual polycyclic aromatic hydrocarbon molecules into the plasmon cavity formed by the tip of a scanning tunneling microscope and a NaCl-covered Ag(111) surface, molecular light emission spectra are obtained that unravel vibrational progression. In addition, light spectra unveil a signature of the molecule even when the tunneling current is injected well separated from the molecular emitter. This signature exhibits a distance-dependent Fano profile that reflects the subtle interplay between inelastic tunneling electrons, the molecular exciton and localized plasmons in at-distance as well as on-molecule fluorescence. The presented findings open the path to luminescence of a different class of molecules than investigated before and contribute to the understanding of single-molecule luminescence at surfaces in a unified picture.
Keywords: STM-induced luminesence, single-molecule fluorescence, Fano, polyaromatic hydrocarbon {tocentry}
![[Uncaptioned image]](/html/1801.07143/assets/x1.png)
On sabbatical leave; permanent address: Institut für Physik, Technische Universität Ilmenau, D-98693 Ilmenau, Germany
Exploring single-molecule luminescence with a scanning tunneling microscope (STM) is an emergent and rapidly evolving research field. The combination of high spatial resolution in imaging and high energy resolution in optical spectroscopy opens the path to atomic-scale investigations into quantum optics at surfaces. Since its first observation from molecular crystals 1 and from single molecules 2 many other examples for light emission at the molecular scale followed and are summarized in excellent review articles 3, 4.
In STM-induced light emission (STM-LE) of adsorbed molecules the tip-induced plasmon that forms between the tip and the metal surface 5, 6, 7 plays a pivotal role. As a consequence of the Purcell effect 8 it enhances the density of optical modes the molecular excitations may radiatively decay into and, thus, increases the emitted photon intensity. Therefore, the majority of single-molecule luminescence studies were performed on metal surfaces. At the same time a seemingly counter-running prerequisite for the observation of the radiative decay of genuine molecular excitations is the efficient reduction of the interaction between the adsorbed molecule and the metal substrate. It was previously recognized that the contact to a metal surface quenches intramolecular transitions since the fast charge transfer channel to the metal substrate dominates the slow luminescence channel 9. Indeed, the STM-LE of molecules adsorbed on metal surfaces reflects the modified radiation of the tip-induced plasmon rather than the sought molecular luminescence 10. Therefore, accessing the quantum optical properties of a single molecule requires the careful engineering of a suitable platform. Strategies for a successful electronic decoupling of an adsorbed molecule from the metal surface have been developed, e. g., ultrathin films of oxides 2, 11, 12, 13 and salt 14, 15, 16, 17, 18, molecular buffer layers 19, 20, 21, 22, 23, 24, 25, 26, 27, 28, lifted 29 and suspended 30, 31, 32, 33 molecules.
Somewhat surprisingly, STM-induced fluorescence of isolated single molecules has exclusively been reported for porphyrins 2, 11, 12, 31 and phthalocyanines 15, 14, 16, 34, 17, 18 to date and it remains an open question whether other classes of molecules are suitable for the observation of electroluminescence induced by an STM. An increased number of classes giving rise to single-molecule luminescence is highly desirable to develop a clear picture of the mechanism of light emission at the molecular scale. Currently, two competing scenarios are being discussed. The first model 2, 11, 12, 30, 14, 34 requires the attachment of electrons and holes to, respectively, unoccupied and occupied states of the molecule by aligning the electrode Fermi levels with the molecular resonances. The resulting electron-hole pair radiatively recombines and gives rise to the molecular fluorescence. The second model, in contrast, does not require the alignment of electronic levels. Rather, it relies on an energy transfer – possibly mediated by the localized tip-induced plasmon – from the inelastic tunneling electrons to the molecular emitter for subsequent radiative exciton decay 21, 32, 31, 16, 35. In both models, the tip-induced plasmon enhances the light emission 8.
Here, we report luminescence from single ,,,-tetraphenylbisbenz,indeno,,-cd:,,-lmperylene (C64H36, DBP), which is currently attracting attention as an organic electron donor in photovoltaic applications due to its high absorption coefficient 36, 37, 38, 39 and as an assistant dopant in organic light-emitting diodes for its high fluorescence quantum yield 40, 37, 41. In addition – as we demonstrate in this work – it represents a new class of molecules for STM-LE. Indeed, it belongs to the family of polycyclic aromatic hydrocarbons, which has revealed fluorescence in frozen matrices 42, 43 suggesting its potential suitability in STM-LE. The most appealing property of DBP is the presence of a single transition dipole moment that is oriented along the long symmetry axis of the molecule. This helps reducing the complexity of luminescence spectra, which may be a superposition of photon emission from more than a single transition dipole moment in the cases of porphyrins 2, 11, 12, 31 and phthalocyanines 15, 14, 16, 17, 18. The present experiments further unveil the dependence of the photon yield on the intramolecular site as well as the occurrence of vibrational progression. More importantly, by varying the lateral tip–molecule distance photon spectra were recorded from at-distance to on-molecule excitation of light. The spectroscopic line shape of the emitted light exhibits a Fano profile whose detailed shape progressively evolves with the lateral tip–DBP separation. This observation hints at describing both on-molecule and at-distance excitation of molecular fluorescence within the Fano picture.
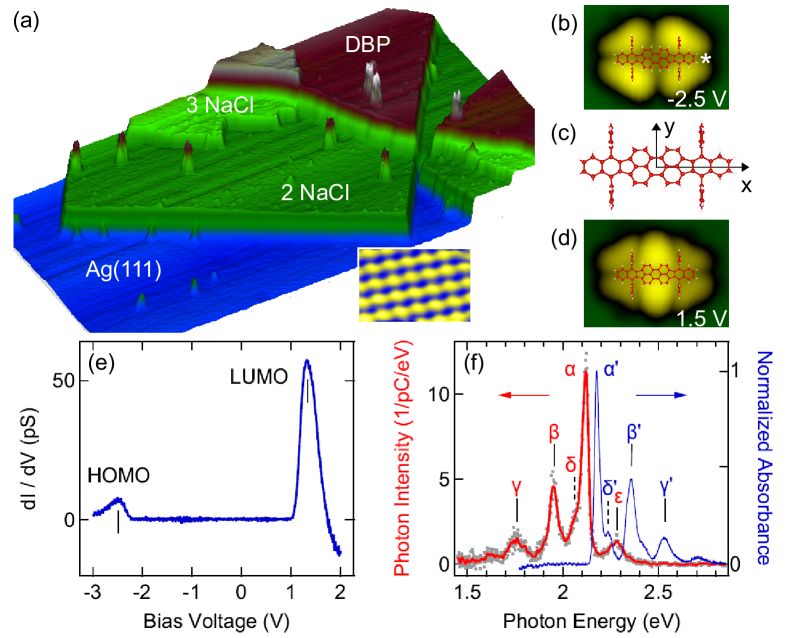
Figure 1(a) shows an STM image of NaCl-covered Ag(111) with individual DBP molecules atop -layer and -layer NaCl islands. Low-temperature deposition of DBP led to separately dispersed monomer molecules on the different NaCl islands. Occasionally, clusters of DBP with different sizes (dimers, trimers) were imaged.
Depending on the bias voltage polarity, individual DBP molecules appear with different internal structure. At [Fig. 1(b)] the molecule appears with four bright protrusions that are separated by two crossing nodal lines. The bright protrusions exhibit their strongest weight in the vicinity of the phenyl groups. The long nodal line coincides with the long symmetry axis of the molecule [ in Fig. 1(c)]. The short nodal line [along in Fig. 1(c)] is perpendicular to the long molecular axis and intersects it at the DBP center. STM images of DBP at [Fig. 1(d)] reveal two additional protrusions at the DBP center. The nodal line along the axis is preserved and two additional nodal lines oriented nearly parallel to separate the central protrusions from the protrusions that are almost centered at the phenyl groups. Owing to the NaCl film, which acts as a buffer layer, the DBP molecules are well decoupled from the Ag(111) surface. Therefore, it is likely that the adsorbed DBP molecules adopt the vacuum structure [Fig. 1(c)].
In order to identify the orbital origin of the structural motifs visible in the STM images at different bias voltage, spectra were acquired. Figure 1(e) shows a spectrum that was recorded atop the DBP center. Peaks at and are separated by a gap region of where the signal vanishes. We attribute the peaks at negative and positive bias voltage to the signatures of the frontier orbitals, i. e., to the highest occupied molecular orbital (HOMO) and the lowest unoccupied molecular orbital (LUMO), respectively. Consequently, the submolecular patterns visible at negative [Fig. 1(b)] and positive [Fig. 1(d)] bias voltage are related to the spatial density-of-states (DOS) distribution of the HOMO and LUMO, respectively. The peak positions of HOMO and LUMO vary by about across the molecule, which may be related to spatially varying intramolecular charge distribution that entails different extents of screening 46. Variations of orbital energies in a single molecule were likewise reported for C60 47, 48, 49 and endohedral C82 50. In addition, HOMO and LUMO signatures appear with different strengths in spectra acquired at different positions atop the molecule, which reflects the spatial distribution of the frontier orbital DOS within the molecule.
Figure 1(f) shows a fluorescence spectrum acquired at one of the ends of the molecular backbone [asterisk in Fig. 1(b)]. Well discriminable peaks are observed at (), () and (). The principal peak additionally exhibits a shoulder at (). Except for the peak at (), the fluorescence peaks — correspond to the intramolecular transitions that were previously probed in absorption spectra of DBP isolated in rare-gas (Ar, Ne) matrices at cryogenic temperatures 45 [ — , blue line in Fig. 1(f)]. In particular, the main peak appearing in the luminescence spectra [Fig. 1(f)] corresponds to the transition ( denote the vibrational ground states of , ), which in the absorption spectrum occurs at (). The difference of may be rationalized in terms of the different dielectric environments probed in the luminescence and optical absorption experiments. The red-shift of peaks , , with respect to in the fluorescence spectrum essentially matches the blue-shift of the vibronic features (), () and () with respect to () in the absorbance spectrum. Therefore, the peak and the shoulder to the principal peak are due to transitions involving several fundamental vibrations [] closely spaced in energy 45. In addition, following the findings of the aforementioned absorption experiment 45, combinations of fundamental vibrations as well as second harmonics [] contribute to .
The energy of the weak fluorescence peak at (), which was not reported in the absorption experiments 45, is compatible with light emission from non-thermalized excitons, a photon emission process that is generally referred to as hot electroluminescence where vibrationally excited states of relax to the vibrational ground state of , i. e., . The apparent violation of the empirical Kasha rule 51, which forbids molecular luminescence due to non-thermalized excitons may be rationalized in terms of a strongly reduced fluorescence lifetime. Conventional chromophores in solution or in the condensed phase exhibit a fluorescence relaxation time on the order of , while the vibrational relaxation time in an electronic state can be an order of magnitude smaller 52, 53. The Purcell effect (vide supra) entails a strong reduction of the fluorescence lifetime in plasmonic environments. Similar observations of luminescence peaks blue-shifted from the transition were reported from multilayers of phthalocyanines 21 and single-porphyrin molecular devices 31. The spectral line shape of the tip-induced plasmon may likewise contribute to . In the Supporting Information, molecular fluorescence spectra are shown for different plasmon line shapes (Fig. S1, S2).
Luminescence and fluorescence spectra presented in this work were acquired at . We found that bias voltages led to fluorescence light with virtually identical quantum yield (Fig. S3). Therefore, resonant tunneling of a hole into the HOMO whose signature peaks at [Fig. 1(e)] is not required. For voltages the tunneling junction exhibited instabilities which may be traced to the HOMO–LUMO gap and the concomitantly reduced tip–DBP distance at these voltages. At positive bias voltage, molecular fluorescence was quenched while plasmonic luminescence was not. We will tentatively rationalize this observation after introducing the Fano picture of fluorescence (vide infra).
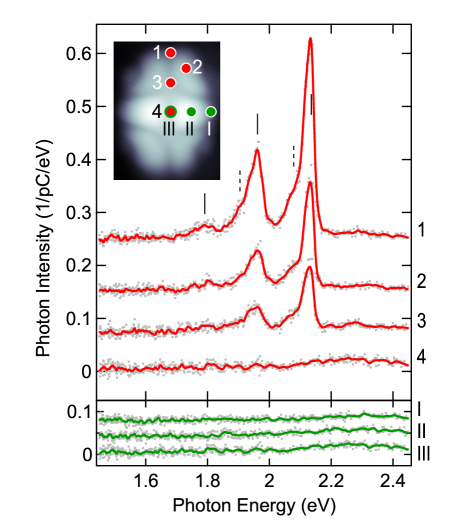
Spatially resolved DBP luminescence spectra are collected in Fig. 2. The strongest emission is observed from the ends of the long molecular axis (position in the inset to Fig. 2). This result may have been expected since the symmetry of the first excited singlet state is while the ground state exhibits symmetry 45; that is, the transition dipole moment is oriented along the long axis of DBP and, thus, parallel to the surface. In accordance with a previously disseminated idea 12, 14, 18, 54 the net transition dipole moment of the entire tip–molecule–surface cavity is nonzero at the ends of the molecular backbone, while it vanishes at its center. Indeed, the luminescence intensity is attenuated towards the center of DBP ( — ) where it becomes too small to be detected. Possibly emitted light stays below the detection limit, too, along the short axis (I — III).
The spectra of Fig. 2 were acquired with a tip exhibiting a different plasmonic signature than for the spectra of Fig. 1(f), which was modified by intentional changes in the microscopic structure of the tip apex 55, 56, 57. The peak at [ in Fig. 1(f)] is hardly visible and light from non-thermalized excitons [ in Fig. 1(f)] does not surmount the detection limit in this case. While the fluorescence spectra depicted in Fig. 1(f) and Fig. 2 represent raw data, the Supporting Information shows the effect of normalizing raw light spectra by the plasmon signature (Fig. S1, S2).
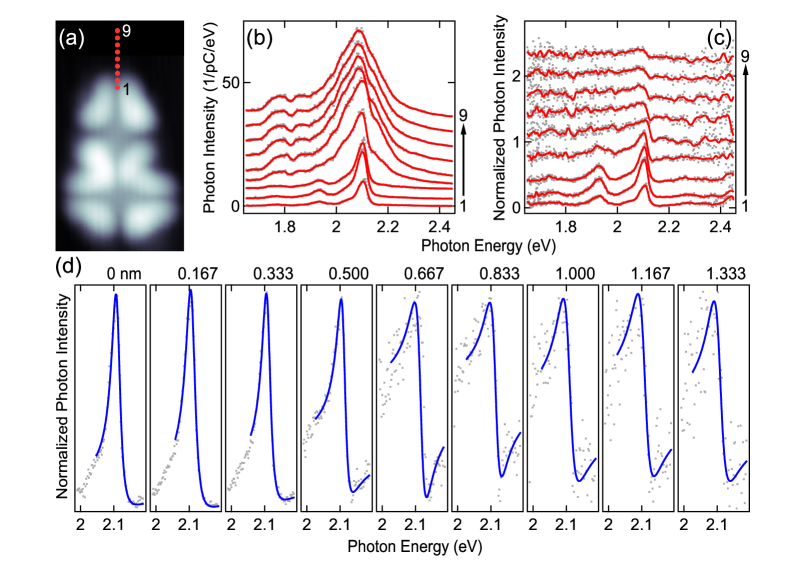
The results to be discussed next represent the most important result of this work. They address the nature of the complex interplay between the inelastic tunneling current, the tip-induced plasmon and the molecular exciton. To this end, molecular fluorescence was excited by injecting the tunneling current at a finite lateral distance from the molecular emitter. For single DBP on NaCl-covered Ag(111) these experiments were challenging due to the mobility of the monomer molecule. At the elevated bias voltage () that is required for the observation of the luminescence signal, monomers of DBP tend to be displaced when the tip is close to the ends of the long molecular axis at tunneling currents exceeding . In order to probe plasmon–exciton interactions with the tip laterally off the DBP, however, elevated currents are required for a decent signal-to-noise ratio. Fortunately, DBP dimers [Fig. 3(a)] are less mobile than monomers and exhibit similar electronic and optical properties as their monomer counterparts. In particular, the strongest photon emission is observed at the ends of the molecular backbone in both cases. The Supporting Information contains a comparison of monomer and dimer electronic and optical properties (Fig. S4–S6). Therefore, the luminescence spectra presented in Fig. 3(a) were acquired for a DBP dimer.
The light spectra presented in Fig. 3(b) were recorded along the axis [vertically arranged red dots in Fig. 3(a)] starting atop a site well inside the molecule (bottom spectrum) and progressively moving outside the molecule. Inside the molecule and at its outermost boundary (three bottom spectra) the photon spectra are dominated by the transitions (vide supra). The fourth spectrum from the bottom was recorded slightly outside the molecule and is strongly broadened. The broadening and the overall intensity increase of the luminescence spectra with increasing tip–molecule distance signals the light emission due to the tip-induced plasmon. At a distance of (top spectrum) from the first acquisition site inside the molecule, the spectral line shape of the tip-induced plasmon is nearly recovered For distances (not shown) molecular transitions are no longer discernible and the plasmonic luminescence line shape does not change any more. Intriguingly, in a photon energy range extending from to where the intensity of the transition drops from its maximum to essentially zero the plasmon spectral line shape is distorted even several tenths of a nanometer outside the molecule. These findings are compatible with results obtained for phthalocyanine molecules 17, 18. In the Supporting Information the evolution of luminescence spectra along the axis are presented (Fig. S7).
To see the distance-dependent line shape variations of the transition peak along the axis more clearly the influence of the tip-induced plasmon is reduced by dividing the luminescence data by the (smoothed) plasmon line shape. These normalized data are plotted in Fig. 3(c) on the same photon energy interval as Fig. 3(b). Besides a strong intensity reduction of the molecular fluorescence the peak due to the transition is discernible even well apart from the molecular emitter. Moreover, it exhibits a characteristic line shape, which is best seen on a smaller energy range. Figure 3(d) displays the evolution of the principal fluorescence peak ranging from to for distances (first acquisition site inside the molecule) up to outside the molecule. Obviously, the line shape of the principal peak at undergoes characteristic variations upon changing the distance between the emitter and the excitation source. All distance-dependent line shapes were reproduced by fitting
| (1) |
(: amplitude; : horizontal background; : photon energy) with the Fano function 58
| (2) |
[ (): energy (full width at half maxium) of the transition peak; : asymmetry parameter of the Fano theory 58] to the experimental data. A more sophisticated parameterization of the Fano function was not required owing to the sufficiently asymmetric spectral line shape 59. The graph of appears as a solid line in each spectrum of Fig. 3(d).
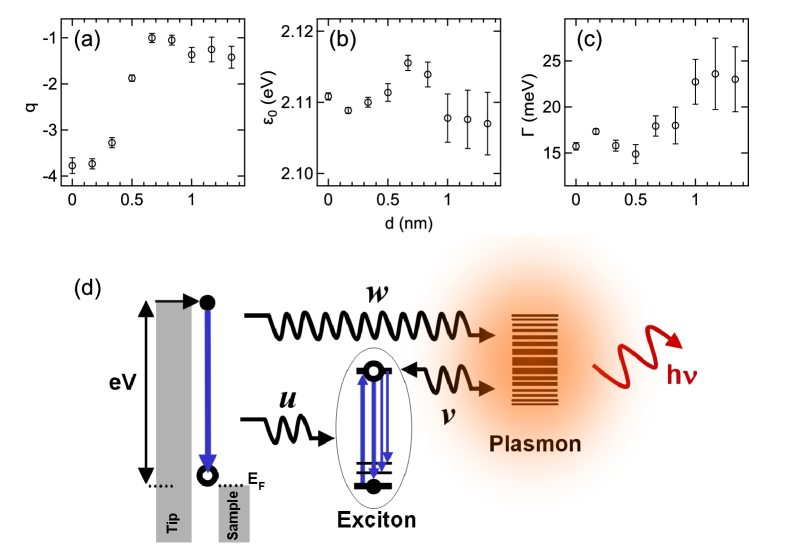
The variations of are shown in Fig. 4(a). Inside the DBP molecule, at distances and , stays at a constant value of . Upon increasing the distance, increases strongly and levels off at an average value of for distances larger than . The parameters [Fig. 4(b)] and [Fig. 4(c)] stay essentially invariant. While the actual values of differ for different tips and, thus, tip-induced plasmons, the trend shown in Fig. 4(a) is reproduced. The Supporting Information collects data sets obtained with different tips and different dimers (Fig. S8, S9). The sign of depends on the detuning of plasmonic and molecular light spectra. In our case, the maximum of plasmonic luminescence is at lower energy than the transition. In agreement with a previous report, 17 the asymmetry factor therefore adopts a negative value.
The use of the Fano picture for both on-molecule and at-distance excitation of fluorescence represents an original idea of this work and shall be discussed in the following. To this end the plasmonic environment shall be defined as a continuum of states to which both the inelastic tunneling electron and the molecular exciton may couple with strengths and , respectively [Fig. 4(d)]. In addition, the inelastic tunneling electron is coupled to the exciton with strength ; that is, our model is based on the assumption that the molecule is excited by direct — rather than indirect plasmon-mediated — energy transfer from the injected electron. This is the physical situation covered by the Fano theory 58 giving rise to the spectral line shape with the asymmetry parameter . The changes in the asymmetry parameter are induced by a variation of these coupling strengths. Far away from DBP the inelastic tunneling electron dominantly couples to the plasmon, and the signature of the molecule results from the plasmon–exciton coupling with strength . In the simple model proposed here the plasmon is considered as a continuum and, therefore, the normalized spectra should reveal a symmetric dip when the tip is positioned sufficiently far away from the molecule. 60 However, the luminescence line shape adopts a steplike profile, which results from the detuning of the plasmon resonance with respect to the molecular exciton energy. 17 Decreasing the lateral distance between the tip and DBP leads to a reduction of , i. e., a trading of the coupling strength from to , and a concomitant increase of , as observed experimentally [Fig. 4(a)]. The gradual variation of and the essential invariance of , with changing suggests — besides the gradual increase of at the expense of w — that the overall luminescence mechanism is the same both atop and aside the molecule. In particular, the plasmon–exciton coupling is always present, independent of the lateral tip–DBP distance. The relative weight of the coupling strengths changes, which leads to a peak-like line shape atop the molecule and to a step-like profile off the molecule. In the former case, is large, i. e., the electron–exciton coupling dominates the electron–plasmon interaction; in the latter case the situation is reversed.
Before concluding we remind that the molecular fluorescence observed for negative bias voltage is suppressed at positive bias voltage to an extent that prevents it from being detected; that is, bipolar electroluminescence is seemingly absent for DBP on NaCl-covered Ag(111). In at-distance luminescence spectroscopy the plasmon line shape stays essentially invariant at positive bias voltage and does not exhibit the characteristic Fano profiles observed for negative polarity. In the Fano picture conveyed above [Fig. 4(d)] this observation may be explained by a small value of , i. e., the inelastic tunneling current only leads to plasmon excitation and its radiative decay. Both the electron–exciton and the plasmon–exciton interaction are too weak to effectively induce molecular fluorescence. Details of the underlying mechanisms have not been understood yet.
In conclusion, STM-induced luminescence has been probed for a polycyclic aromatic hydrocarbon molecule, which represents a new class of molecules suitable for electroluminescence with an STM. The spatially resolved photon yield across the molecule reflects the presence of the uniaxial transition dipole moment. The on-molecule as well as the at-distance excitation of molecular fluorescence gives rise to a characteristic modification of the plasmon emission, which may be described by the Fano theory. The proposed model of single-molecule fluorescence is based on an energy transfer from the inelastic tunneling electrons to the molecular exciton and / or the localized plasmon. It shows that the tip–molecule–surface complex acts as an entity in photon emission with a subtle interplay of electron–exciton, electron–plasmon and plasmon–exciton interactions.
Experimental method
Experiments were performed with a low-temperature STM operated at and in ultrahigh vacuum (). Ag(111) surfaces were prepared by Ar+ ion bombardment and annealing. High-purity NaCl was deposited from a heated crucible onto clean Ag(111) at room temperature, while the cold () surface was exposed to a beam of DBP sublimated from molecular powder. STM images were acquired at constant current and with the bias voltage applied to the sample. Spectra of the differential conductance () were recorded by modulating the bias voltage (, ) and measuring the current response of the tunneling junction with a lock-in amplifier. The light collection optics and detector is based on a design described in extenso elsewhere 32, 61.
The authors thank Virginie Speisser and Michelangelo Romeo for technical assistance. Financial support by the Deutsche Forschungsgemeinschaft through Grant No. KR 2912/12-1, the Agence Nationale de la Recherche (project SMALL’LED No. ANR-14-CE26-0016-01, project Labex NIE No. ANR-11-LABX-0058_NIE), and the Centre International de Recherche aux Frontières de la Chimie is acknowledged.
The Supporting Information is available free of charge on the ACS Publications website at DOI: Normalization of raw fluorescence spectroscopy data by the plasmon line shape, comparison of DBP monomer and dimer electronic and optical properties, raw fluorescence line shape variations with lateral tip–emitter distance, fluorescence intensity change with tunneling current
References
- Berndt et al. 1993 Berndt, R.; Gaisch, R.; Gimzewski, J. K.; Reihl, B.; Schlittler, R. R.; Schneider, W. D.; Tschudy, M. Photon Emission at Molecular Resolution Induced by a Scanning Tunneling Microscope. Science 1993, 262, 1425–1427
- Qiu et al. 2003 Qiu, X. H.; Nazin, G. V.; Ho, W. Vibrationally Resolved Fluorescence Excited with Submolecular Precision. Science 2003, 299, 542–546
- Rossel et al. 2010 Rossel, F.; Pivetta, M.; Schneider, W.-D. Luminescence experiments on supported molecules with the scanning tunneling microscope. Surface Science Reports 2010, 65, 129 – 144
- Kuhnke et al. 2017 Kuhnke, K.; Große, C.; Merino, P.; Kern, K. Atomic-Scale Imaging and Spectroscopy of Electroluminescence at Molecular Interfaces. Chemical Reviews 2017, 117, 5174–5222, PMID: 28294599
- Berndt et al. 1991 Berndt, R.; Gimzewski, J. K.; Johansson, P. Inelastic tunneling excitation of tip-induced plasmon modes on noble-metal surfaces. Phys. Rev. Lett. 1991, 67, 3796–3799
- Johansson and Monreal 1991 Johansson, P.; Monreal, R. Theory for photon emission from a scanning tunneling microscope. Zeitschrift für Physik B Condensed Matter 1991, 84, 269–275
- Uehara et al. 1992 Uehara, Y.; Kimura, Y.; Ushioda, S.; Takeuchi, K. Theory of Visible Light Emission from Scanning Tunneling Microscope. Japanese Journal of Applied Physics 1992, 31, 2465
- Purcell et al. 1946 Purcell, E. M.; Torrey, H. C.; Pound, R. V. Resonance Absorption by Nuclear Magnetic Moments in a Solid. Phys. Rev. 1946, 69, 37–38
- Avouris and Persson 1984 Avouris, P.; Persson, B. N. J. Excited states at metal surfaces and their non-radiative relaxation. The Journal of Physical Chemistry 1984, 88, 837–848
- Hoffmann et al. 2002 Hoffmann, G.; Libioulle, L.; Berndt, R. Tunneling-induced luminescence from adsorbed organic molecules with submolecular lateral resolution. Phys. Rev. B 2002, 65, 212107
- Wu et al. 2008 Wu, S. W.; Nazin, G. V.; Ho, W. Intramolecular photon emission from a single molecule in a scanning tunneling microscope. Phys. Rev. B 2008, 77, 205430
- Chen et al. 2010 Chen, C.; Chu, P.; Bobisch, C. A.; Mills, D. L.; Ho, W. Viewing the Interior of a Single Molecule: Vibronically Resolved Photon Imaging at Submolecular Resolution. Phys. Rev. Lett. 2010, 105, 217402
- Lee et al. 2014 Lee, J.; Perdue, S. M.; Rodriguez Perez, A.; Apkarian, V. A. Vibronic Motion with Joint Angstrom-Femtosecond Resolution Observed through Fano Progressions Recorded within One Molecule. ACS Nano 2014, 8, 54–63, PMID: 24261832
- Zhang et al. 2016 Zhang, Y.; Luo, Y.; Zhang, Y.; Yu, Y.-J.; Kuang, Y.-M.; Zhang, L.; Meng, Q.-S.; Luo, Y.; Yang, J.-L.; Dong, Z.-C.; Hou, J. G. Visualizing coherent intermolecular dipole-dipole coupling in real space. Nature 2016, 531, 623–627
- Imada et al. 2016 Imada, H.; Miwa, K.; Imai-Imada, M.; Kawahara, S.; Kimura, K.; Kim, Y. Real-space investigation of energy transfer in heterogeneous molecular dimers. Nature 2016, 538, 364–367
- Doppagne et al. 2017 Doppagne, B.; Chong, M. C.; Lorchat, E.; Berciaud, S.; Romeo, M.; Bulou, H.; Boeglin, A.; Scheurer, F.; Schull, G. Vibronic Spectroscopy with Submolecular Resolution from STM-Induced Electroluminescence. Phys. Rev. Lett. 2017, 118, 127401
- Zhang et al. 2017 Zhang, Y.; Meng, Q.-S.; Zhang, L.; Luo, Y.; Yu, Y.-J.; Yang, B.; Zhang, Y.; Esteban, R.; Aizpurua, J.; Luo, Y.; Yang, J.-L.; Dong, Z.-C.; Hou, J. G. Sub-nanometre control of the coherent interaction between a single molecule and a plasmonic nanocavity. Nature Communications 2017, 8, 15225
- Imada et al. 2017 Imada, H.; Miwa, K.; Imai-Imada, M.; Kawahara, S.; Kimura, K.; Kim, Y. Single-Molecule Investigation of Energy Dynamics in a Coupled Plasmon-Exciton System. Phys. Rev. Lett. 2017, 119, 013901
- Dong et al. 2004 Dong, Z.-C.; Guo, X.-L.; Trifonov, A. S.; Dorozhkin, P. S.; Miki, K.; Kimura, K.; Yokoyama, S.; Mashiko, S. Vibrationally Resolved Fluorescence from Organic Molecules near Metal Surfaces in a Scanning Tunneling Microscope. Phys. Rev. Lett. 2004, 92, 086801
- Ćavar et al. 2005 Ćavar, E.; Blüm, M.-C.; Pivetta, M.; Patthey, F.; Chergui, M.; Schneider, W.-D. Fluorescence and Phosphorescence from Individual Molecules Excited by Local Electron Tunneling. Phys. Rev. Lett. 2005, 95, 196102
- Dong et al. 2009 Dong, Z. C.; Zhang, X. L.; Gao, H. Y.; Luo, Y.; Zhang, C.; Chen, L. G.; Zhang, R.; Tao, X.; Zhang, Y.; Yang, J. L.; Hou, J. G. Generation of molecular hot electroluminescence by resonant nanocavity plasmons. Nature Photonics 2009, 4, 50–54
- Rossel et al. 2009 Rossel, F.; Pivetta, M.; Patthey, F.; Schneider, W.-D. Plasmon enhanced luminescence from fullerene molecules excited by local electron tunneling. Opt. Express 2009, 17, 2714–2721
- Kabakchiev et al. 2010 Kabakchiev, A.; Kuhnke, K.; Lutz, T.; Kern, K. Electroluminescence from Individual Pentacene Nanocrystals. ChemPhysChem 2010, 11, 3412–3416
- Schneider and Berndt 2012 Schneider, N. L.; Berndt, R. Plasmonic excitation of light emission and absorption by porphyrine molecules in a scanning tunneling microscope. Phys. Rev. B 2012, 86, 035445
- Lutz et al. 2013 Lutz, T.; Große, C.; Dette, C.; Kabakchiev, A.; Schramm, F.; Ruben, M.; Gutzler, R.; Kuhnke, K.; Schlickum, U.; Kern, K. Molecular Orbital Gates for Plasmon Excitation. Nano Letters 2013, 13, 2846–2850, PMID: 23688309
- Merino et al. 2015 Merino, P.; Große, C.; Rosławska, A.; Kuhnke, K.; Kern, K. Exciton dynamics of C60-based single-photon emitters explored by Hanbury Brown-Twiss scanning tunnelling microscopy. Nature Communications 2015, 6, 8461
- Große et al. 2016 Große, C.; Gunnarsson, O.; Merino, P.; Kuhnke, K.; Kern, K. Nanoscale Imaging of Charge Carrier and Exciton Trapping at Structural Defects in Organic Semiconductors. Nano Letters 2016, 16, 2084–2089, PMID: 26871739
- Große et al. 2017 Große, C.; Merino, P.; Roslawska, A.; Gunnarsson, O.; Kuhnke, K.; Kern, K. Submolecular Electroluminescence Mapping of Organic Semiconductors. ACS Nano 2017, 11, 1230–1237, PMID: 28085244
- Zhu et al. 2013 Zhu, S.-E. et al. Self-Decoupled Porphyrin with a Tripodal Anchor for Molecular-Scale Electroluminescence. Journal of the American Chemical Society 2013, 135, 15794–15800, PMID: 24066644
- Reecht et al. 2014 Reecht, G.; Scheurer, F.; Speisser, V.; Dappe, Y. J.; Mathevet, F.; Schull, G. Electroluminescence of a Polythiophene Molecular Wire Suspended between a Metallic Surface and the Tip of a Scanning Tunneling Microscope. Phys. Rev. Lett. 2014, 112, 047403
- Chong et al. 2016 Chong, M. C.; Sosa-Vargas, L.; Bulou, H.; Boeglin, A.; Scheurer, F.; Mathevet, F.; Schull, G. Ordinary and Hot Electroluminescence from Single-Molecule Devices: Controlling the Emission Color by Chemical Engineering. Nano Letters 2016, 16, 6480–6484, PMID: 27652517
- Chong et al. 2016 Chong, M. C.; Reecht, G.; Bulou, H.; Boeglin, A.; Scheurer, F.; Mathevet, F.; Schull, G. Narrow-Line Single-Molecule Transducer between Electronic Circuits and Surface Plasmons. Phys. Rev. Lett. 2016, 116, 036802
- Chong et al. 2018 Chong, M. C.; Afshar-Imani, N.; Scheurer, F.; Cardoso, C.; Ferretti, A.; Prezzi, D.; Schull, G. Bright Electroluminescence from Single Graphene Nanoribbon Junctions. Nano Letters 2018, 18, 175–181, PMID: 29215893
- Zhang et al. 2017 Zhang, L.; Yu, Y.-J.; Chen, L.-G.; Luo, Y.; Yang, B.; Kong, F.-F.; Chen, G.; Zhang, Y.; Zhang, Q.; Luo, Y.; Yang, J.-L.; Dong, Z.-C.; Hou, J. Electrically driven single-photon emission from an isolated single molecule. Nature Communications 2017, 8, 580
- Tian and Luo 2011 Tian, G.; Luo, Y. Electroluminescence of molecules in a scanning tunneling microscope: Role of tunneling electrons and surface plasmons. Phys. Rev. B 2011, 84, 205419
- Hirade and Adachi 2011 Hirade, M.; Adachi, C. Small molecular organic photovoltaic cells with exciton blocking layer at anode interface for improved device performance. Appl. Phys. Lett. 2011, 99, 153302
- Xiao et al. 2013 Xiao, X.; Zimmerman, J. D.; Lassiter, B. E.; Bergemann, K. J.; Forrest, S. R. A hybrid planar-mixed tetraphenyldibenzoperiflanthene/C70 photovoltaic cell. Appl. Phys. Lett. 2013, 102, 073302
- Zheng et al. 2013 Zheng, Y.-q.; Potscavage Jr, W. J.; Komino, T.; Hirade, M.; Adachi, J.; Adachi, C. Highly efficient bulk heterojunction photovoltaic cells based on C70 and tetraphenyldibenzoperiflanthene. Appl. Phys. Lett. 2013, 102, 143304
- Chen et al. 2014 Chen, C.-W.; Huang, Z.-Y.; Lin, Y.-M.; Huang, W.-C.; Chen, Y.-H.; Strzalka, J.; Chang, A. Y.; Schaller, R. D.; Lee, C.-K.; Pao, C.-W. Morphology, molecular stacking, dynamics and device performance correlations of vacuum-deposited small-molecule organic solar cells. Phys. Chem. Chem. Phys. 2014, 16, 8852–8864
- Fujishima et al. 2009 Fujishima, D.; Kanno, H.; Kinoshita, T.; Maruyama, E.; Tanaka, M.; Shirakawa, M.; Shibata, K. Organic thin-film solar cell employing a novel electron-donor material. Solar Energy Materials and Solar Cells 2009, 93, 1029 – 1032, 17th International Photovoltaic Science and Engineering Conference
- Nakanotani et al. 2014 Nakanotani, H.; Higuchi, T.; Furukawa, T.; Masui, K.; Morimoto, K.; Numata, M.; Tanaka, H.; Sagara, Y.; Yasuda, T.; Adachi, C. High-efficiency organic light-emitting diodes with fluorescent emitters. Nat. Commun. 2014, 5, 4016
- Tamarat et al. 2000 Tamarat, P.; Maali, A.; Lounis, B.; Orrit, M. Ten Years of Single-Molecule Spectroscopy. The Journal of Physical Chemistry A 2000, 104, 1–16
- Moerner 2002 Moerner, W. E. A Dozen Years of Single-Molecule Spectroscopy in Physics, Chemistry, and Biophysics. The Journal of Physical Chemistry B 2002, 106, 910–927
- Kirchhuebel et al. 2016 Kirchhuebel, T.; Gruenewald, M.; Sojka, F.; Kera, S.; Bussolotti, F.; Ueba, T.; Ueno, N.; Rouillé, G.; Forker, R.; Fritz, T. Self-Assembly of Tetraphenyldibenzoperiflanthene (DBP) Films on Ag(111) in the Monolayer Regime. Langmuir 2016, 32, 1981–1987, PMID: 26844381
- Rouillé et al. 2015 Rouillé, G.; Kirchhuebel, T.; Rink, M.; Gruenewald, M.; Kröger, J.; Forker, R.; Fritz, T. Identification of vibrational excitations and optical transitions of the organic electron donor tetraphenyldibenzoperiflanthene (DBP). Phys. Chem. Chem. Phys. 2015, 17, 30404–30416
- Torrente et al. 2008 Torrente, I. F.; Franke, K. J.; Pascual, J. I. Spectroscopy of C 60 single molecules: the role of screening on energy level alignment. Journal of Physics: Condensed Matter 2008, 20, 184001
- Grobis et al. 2002 Grobis, M.; Lu, X.; Crommie, M. F. Local electronic properties of a molecular monolayer: on Ag(001). Phys. Rev. B 2002, 66, 161408
- Lu et al. 2003 Lu, X.; Grobis, M.; Khoo, K. H.; Louie, S. G.; Crommie, M. F. Spatially Mapping the Spectral Density of a Single Molecule. Phys. Rev. Lett. 2003, 90, 096802
- Lu et al. 2004 Lu, X.; Grobis, M.; Khoo, K. H.; Louie, S. G.; Crommie, M. F. Charge transfer and screening in individual molecules on metal substrates: A scanning tunneling spectroscopy and theoretical study. Phys. Rev. B 2004, 70, 115418
- Grobis et al. 2005 Grobis, M.; Khoo, K. H.; Yamachika, R.; Lu, X.; Nagaoka, K.; Louie, S. G.; Crommie, M. F.; Kato, H.; Shinohara, H. Spatially Dependent Inelastic Tunneling in a Single Metallofullerene. Phys. Rev. Lett. 2005, 94, 136802
- Kasha 1950 Kasha, M. Characterization of electronic transitions in complex molecules. Discuss. Faraday Soc. 1950, 9, 14–19
- Baskin et al. 2002 Baskin, J. S.; Yu, H.-Z.; Zewail, A. H. Ultrafast Dynamics of Porphyrins in the Condensed Phase:I. Free Base Tetraphenylporphyrin. The Journal of Physical Chemistry A 2002, 106, 9837–9844
- Kumar et al. 2015 Kumar, P. H.; Venkatesh, Y.; Siva, D.; Ramakrishna, B.; Bangal, P. R. Ultrafast Relaxation Dynamics of 5,10,15,20-meso-Tetrakis Pentafluorophenyl Porphyrin Studied by Fluorescence Up-Conversion and Transient Absorption Spectroscopy. The Journal of Physical Chemistry A 2015, 119, 1267–1278, PMID: 25633537
- Neuman et al. 2018 Neuman, T.; Esteban, R.; Casanova, D.; García-Vidal, F. J.; Aizpurua, J. Coupling of Molecular Emitters and Plasmonic Cavities beyond the Point-Dipole Approximation. Nano Letters 2018, 18, 2358–2364, PMID: 29522686
- Aizpurua et al. 2002 Aizpurua, J.; Hoffmann, G.; Apell, S. P.; Berndt, R. Electromagnetic Coupling on an Atomic Scale. Phys. Rev. Lett. 2002, 89, 156803
- Zhang et al. 2009 Zhang, Y.; Tao, X.; Gao, H. Y.; Dong, Z. C.; Hou, J. G.; Okamoto, T. Modulation of local plasmon mediated emission through molecular manipulation. Phys. Rev. B 2009, 79, 075406
- Meguro et al. 2002 Meguro, K.; Sakamoto, K.; Arafune, R.; Satoh, M.; Ushioda, S. Origin of multiple peaks in the light emission spectra of a Au(111) surface induced by the scanning tunneling microscope. Phys. Rev. B 2002, 65, 165405
- Fano 1935 Fano, U. Sullo spettro di assorbimento dei gas nobili presso il limite dello spettro d’arco. Il Nuovo Cimento (1924-1942) 1935, 12, 154–161
- Meierott et al. 2016 Meierott, S.; Hotz, T.; Néel, N.; Kröger, J. Asymmetry parameter of peaked Fano line shapes. Review of Scientific Instruments 2016, 87, 103901
- Cohen-Tannoudjii et al. 1988 Cohen-Tannoudjii, C.; Dupont-Roc, J.; Grynberg, G. Processus d’interaction entre photons et atomes; InterEdition/Editions du CNRS: Paris, 1988
- Keizer et al. 2009 Keizer, J. G.; Garleff, J. K.; Koenraad, P. M. Simple and efficient scanning tunneling luminescence detection at low-temperature. Review of Scientific Instruments 2009, 80, 123704