H-band discovery of additional Second-Generation stars in the Galactic Bulge Globular Cluster NGC 6522 as observed by APOGEE and Gaia
We present elemental abundance analysis of high-resolution spectra for five giant stars, deriving Fe, Mg, Al, C, N, O, Si and Ce abundances, and spatially located within the innermost regions of the bulge globular cluster NGC 6522, based on H-band spectra taken with the multi-object APOGEE-north spectrograph from the SDSS-IV Apache Point Observatory Galactic Evolution Experiment (APOGEE) survey. Of the five cluster candidates, two previously unremarked stars are confirmed to have second-generation (SG) abundance patterns, with the basic pattern of depletion in C and Mg simultaneous with enrichment in N and Al as seen in other SG globular cluster populations at similar metallicity. In agreement with the most recent optical studies, the NGC 6522 stars analyzed exhibit (when available) only mild overabundances of the s-process element Ce, contradicting the idea of the NGC 6522 stars being formed from gas enriched by spinstars and indicating that other stellar sources such as massive AGB stars could be the primary intra-cluster medium polluters. The peculiar abundance signature of SG stars have been observed in our data, confirming the presence of multiple generations of stars in NGC 6522.
Key Words.:
Stars: abundances - Stars: Population II - Globular Clusters: individual: NGC 6522 - Galaxy: structure - Galaxy: formation1 Introduction
The presence of multiple populations (MPs) with distinctive light-element abundances were recently identified in several bulge globular clusters (see, Schiavon et al., 2017a; Recio-Blanco et al., 2017; Tang et al., 2018; Muñoz et al., 2017, for instance). In particular, Schiavon et al. (2017a) have studied the chemical composition of a few red giant stars within the bulge globular clusters (GCs) NGC 6553, NGC 6528, Terzan 5, Palomar 6, and NGC 6522, using near infrared (1.5-1.7m) high-resolution (R22,000) APOGEE spectra from the 12th data release (DR12, Alam et al., 2015). These studies have also included the re-reduced and re-calibrated spectra of the latest APOGEE DR13111APOGEE field – BAADEWIN_001-04: Particularly in this field, APOGEE/DR13/DR14 have the same targets as APOGEE DR12, but the data reduction and calibration have been improved in several ways. For more details we refer the reader to a forthcoming paper (Holtzman et al. in preparation). data release (Albareti et al., 2017) for the globular cluster NGC 6553 (e.g., Tang et al., 2018), where we have included more chemical species with reliable light-element abundances (namely O, Na, Si, Ca, Cr, Mn, and Ni). Schiavon et al. (2017a) and Tang et al. (2018) have provided useful chemical ”tags” in several elemental abundances for several Milky Way bulge globular cluster stars with clear signatures of polluted chemistry; i.e., they have found the distinctive chemical patterns characterising multiple populations, with comparable chemical behavior to what is reported in extensive spectroscopic and photometry survey of GCs in general (see Gratton et al., 2004, 2007; Carretta et al., 2007, 2009a, 2009b, 2010; Gratton et al., 2012; Mészáros et al., 2015; García-Hernández et al., 2015; Carretta, 2016; Recio-Blanco et al., 2017; Pancino et al., 2017; Schiavon et al., 2017a; Mészáros et al., 2018; Tang et al., 2018; Bastian & Lardo, 2018; Tang2018; Kerber et al., 2018).
Large-scale spectroscopic surveys like APOGEE (see Majewski et al., 2017) have confirmed that several bulge GCs exhibit significant star-to-star abundance variations in their light-element content (see Schiavon et al., 2017a; Tang et al., 2018), with the usual anti-correlations between pairs of light elements, such as C-N and Al-N. This behaviour demonstrates that the CNO, NeNa, and MgAl cycles took place in these GCs (see, e.g., Mészáros et al., 2015; Schiavon et al., 2017a; Tang et al., 2018; Pancino et al., 2017; Ventura et al., 2016; Dell’Agli et al., 2018).
Following this line of investigation, we turn our attention to the low-mass (5.93 M⊙: Gnedin & Ostriker, 1997) and old ( 12.5 and 13.0 Gyr: Kerber et al., 2018) bulge globular cluster NGC 6522. Earlier studies show that this ancient Milky Way globular cluster hosts remarkably high abundances of slow neutron-capture (s-process) elements (e.g., Chiappini et al., 2011). Chiappini et al. (2011) interpreted this observation as evidence of NGC 6522 stars being formed from gas enriched by massive fast-rotating stars (spinstars; see Pignatari et al., 2008), which possibly makes NGC 6522 distinct from other GCs.
However, more recent chemical re-analysis by Ness et al. (2014) and Barbuy et al. (2014) found no enhancement in the s-process elements for the same stars previously studied by Chiappini et al. (2011). ). The abundances they find can be explained by mass transfer from s-process-rich asymptotic giant branch (AGB) stars or alternative self-enrichment scenarios (e.g., the massive AGBs self-enrichment scenario) without invoking massive fast-rotating stars. Kerber et al. (2018), based on detailed analysis of HST proper-motion-cleaned color-magnitude diagrams, found that NGC 6522 exhibits at least two stellar populations with an intrinsically wide subgiant branch, consistent with a first and second stellar generation.
Here we carry out a detailed re-analysis of the NGC 6522 field to search for abundance anomalies through the line-by-line spectrum synthesis calculations for the full set of (atomic and molecular) lines (particularly CN, OH, CO, Al, Mg, and Si) in the re-reduced APOGEE DR14 spectra (Abolfathi et al., 2018). The phenomenon of star-to-star light-element abundance variations in NGC 6522 indicates the presence of multiple stellar populations, such as those claimed by Schiavon et al. (2017a) and Recio-Blanco et al. (2017), and provides crucial observational evidence that NGC 6522 could be the fossil relic of one of the structures that contributed to generate the N-rich population towards the Milky Way bulge (Schiavon et al., 2017b). It also reinforces the link between GCs and the chemical anomalies (second-generation field stars222Here, the term second-generation refers to groups of stars in globular clusters that display altered light-element abundances (C, N, O, Na, Al, and Mg).) recently found toward the Galactic bulge field (e.g., Fernández-Trincado et al., 2017b, 2019d), as well as that with the N-rich moderately metal-poor halo stars (Martell & Grebel, 2010; Martell et al., 2011, 2016; Tang et al., 2019), mimicking the chemical abundance patterns of the second-generation population of globular clusters (see Fernández-Trincado et al., 2016a, 2019c, 2019b, 2019d, 2019a). More recently, observations extending the analysis to other elements have already detected departures from what seemed to be a simple chemical evolutionary path, like the existence of a Na-rich population toward the outer bulge likely originated from disrupted GCs (e.g, Lee et al., 2019).
This article is structured as follows. We describe the data in Section 2. We describe the cluster membership selection in Section 3. In Section 4 and 5 we provide our abundance analysis for light and heavy elements, respectively. In Section 6 we discuss the results. We present our conclusions in Section 7.
2 APOGEE DATA
High-resolution (R22,500) H-band spectroscopic ( 1.51 - 1.69m) observations were obtained with the Apache Point Observatory Galactic Evolution Experiment (APOGEE), as part of Sloan Digital Sky Survey IV that observed 277,000 stars in the Milky Way (see Gunn et al., 2006; Eisenstein et al., 2011; Wilson et al., 2012; Majewski et al., 2017). Here we use the most recent re-reduced and re-calibrated APOGEE spectra from the 14th data release of SDSS (DR14, Abolfathi et al., 2018).
We have re-analyzed available APOGEE spectra towards the Baade’s window (APOGEE field: BAADEWIN_001-04) region around (l, b)(1∘, -4∘) with a field of view of 3 sq. degree, comprising 460 stars (for details, see Zasowski et al., 2013, 2017).
One of our stars in the BAADEWIN_001-04 field, 2M18032356-3001588, was recently studied in Schiavon et al. (2017a) using the DR12 datasets throught ASPCAP333ASPCAP: The APOGEE Stellar Parameter and Chemical Abundances Pipeline results (García Pérez et al., 2016). The same authors have suggested the presence of MPs in NGC 6522 based on the polluted chemistry (high Al and N) observed in 2M18032356-3001588, this hypothesis has been recently supported by similar analysis from the Gaia-ESO survey (see Recio-Blanco et al., 2017). Here we present an independent analysis using the newly released APOGEE DR14 stellar spectra towards NGC 6522, and report the identification of four new potential cluster members with polluted chemistry towards the innermost regions of the cluster.
It is to be noted here that the new highest likelihood cluster members (4 stars) were originally missed by Schiavon et al. (2017a), because they adopted more rigorous limits on the NGC 6522 parameter space (radial velocity, metallicity, Teff, etc) as well as higher restrictions on the signal-to-noise (S/N) ratio ( 70 pixel-1) of the APOGEE spectra. In the next section, we present our adopted softer limits that take into account the updated parameter space of NGC 6522 and that have allowed us to identify new potential cluster members based on APOGEE data.
3 CLUSTER MEMBERSHIP SELECTION
We selected probable cluster members based on the revised version of the structural parameters of NGC 6522, i.e., the cluster center (, ) (270.896805∘, -30.034204∘), with an uncertainty of 0.3 arcsec, from ellipse fitting to density maps from HST PSF photometry, and the tidal radius of the cluster, arcmin. For a more detailed discussion, we refer the readers to a forthcoming paper (Cohen et al. 2018, in preparation).
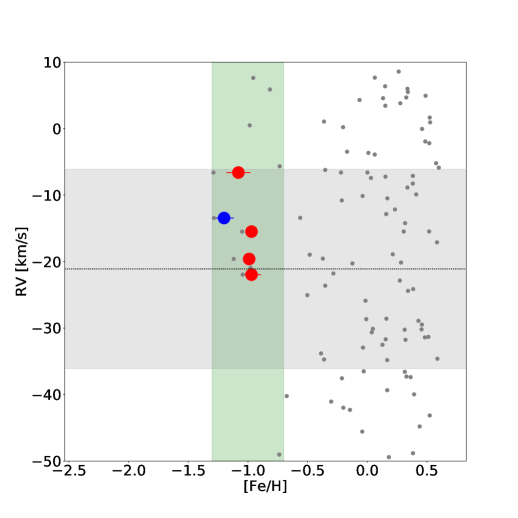
To select the highest likelihood cluster members we also adopt a radial velocity range of km s-1 (Harris, 1996). We have adopted a metallicity range of [Fe/H] dex (e.g., Barbuy et al., 2009, 2014); our stars are also recovered even adopting the cluster metallicity as reported in Ness et al. (2014), [Fe/H]. The radial velocity and metallicity of our stellar sample have been displayed in Figure 1, which shows that most stars have radial velocities and metallicities very close to the mean cluster values.
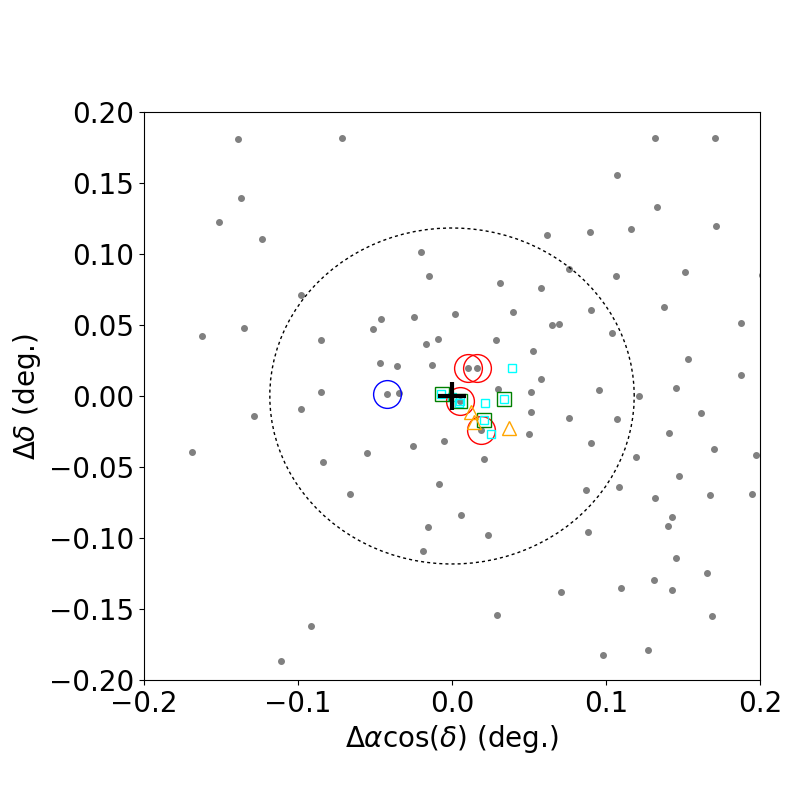
In Figure 2, we plot the spatial distribution of four new potential cluster members (2M180338193000515, 2M180339653000521, 2M180340523003281, and 2M180336603002164) against one star previously identified on APOGEE (2M180323563001588), which clearly lie near the cluster centre (all our candidate members fall within a relatively small radius, arcmin), as illustrated in the same figure. It is important to note that a detailed chemical analysis has not been done so far for these objects, except for: (i) 2M180336603002164, which was analyzed in Chiappini et al. (2011) and Ness et al. (2014) from GIRAFFE/VLT spectra. Unfortunately, this is the fainter star in our sample (see Table 1) and its low-S/N APOGEE spectrum does not permit us to carry out a reliable and conclusive abundance analysis, especially for Al I lines; (ii) 2M180323563001588, was already studied by Schiavon et al. (light elements: 2017a) and Cunha et al. (heavy elements: 2017). We note, however, that we carry out an independent chemical analysis of 2M18032356-3001588 (Schiavon et al., 2017a), which permit us to revisit its chemical composition.
It is instructive to contrast the potential cluster candidate stars with those for NGC 6522 in the Gaia DR2 database (Gaia Collaboration et al., 2018). Since NGC 6522 is relatively far ( kpc), we decided to pay particular attention to avoid contamination by data processing artifacts and/or spurious measurements. Therefore, we adopted the following conservative cuts on the columns of the Gaia DR2 GAIA_SOURCE catalogue:
-
(1.)
ASTROMETRIC_GOF_AL 8. This cut ensures that the statistics astrometric model resulted in a good fit to the data;
-
(2.)
ASTROMETRIC_EXCESS_NOISE_SIG 2. This criterion ensured that the selected stars were astrometrically well-behaved sources;
-
(3.)
0.23 MEAN_VARPI_FACTOR_AL 0.32 AND VISIBILITY_PERIODS_USED > 7. These cuts were used to exclude stars with parallaxes more vulnerable to errors;
-
(4.)
G 19 mag. This criterion minimized the chance of foreground contamination.
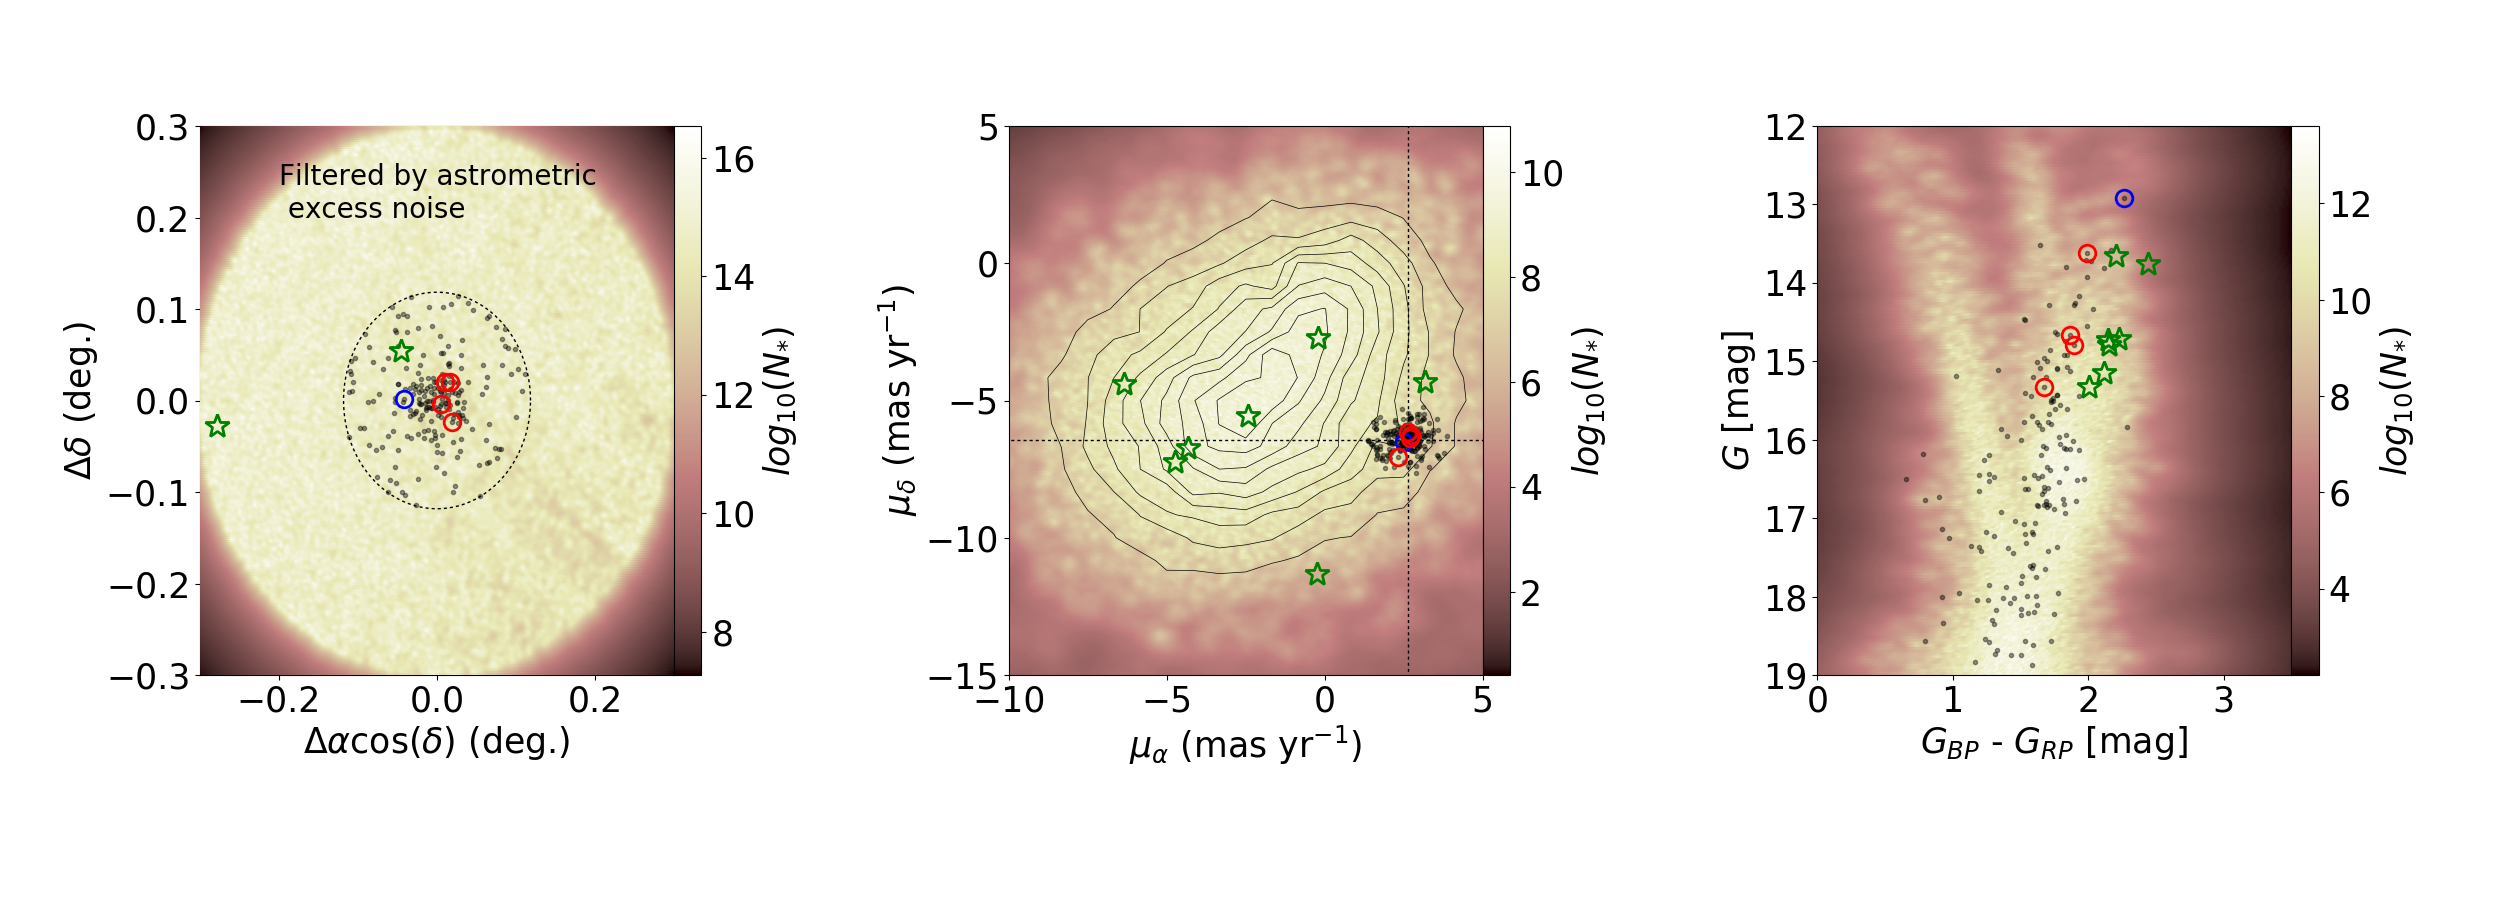
The final sample so selected amounts to a total of 45,683 stars, which lie in a radius of 0.3 degree around the NGC 6522. Figure 3 shows the spatial distribution, proper motion distribution and colour-magnitude diagram of the Gaia DR2 stars labeled as members (black dots) of NGC 6522 as well as Gaia DR2 field stars and the newly identified second-generation stars (blue and red unfilled circles). To select Gaia DR2 stars as potential members, we adopt as the total uncertainty in quadrature obtained from a 2-dimensional Gaussian fit. For this purpose, a 2-dimensional Gaussian smoothing routine was applied in proper motion space for stars with mag within the cluster tidal radius. A 2D Gaussian was fitted to this sample and membership probabilities are assigned. With this procedure, we found: mas yr-1 and mas yr-1, and mas yr-1, our results also agree remarkably well with the more recent measurements of PMs for NGC 6522, e.g.: mas yr-1, and from Vasiliev (2019). A star was considered to be a GC member if its proper motion differs from that of NGC 6522 by not more than 3. One can see that the newly identified N-rich stars from the APOGEE survey are distributed along inside the tidal radius of the cluster and the proper motions of those stars match the nominal proper motion of NGC 6522, and the Gaia DR2 colour-magnitude diagram contains the stars with highest [N/Fe] in our sample along the red giant branch of NGC 6522. Based on the Gaia DR2 (,) space, we rule out other possible cluster candidates in our APOGEE sample, which are highlighted by green unfilled symbols in Figure 3 and lie in the green shadow region (grey dots) in Figure 1.
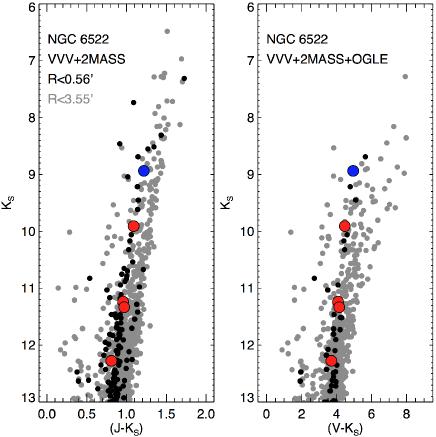
The position on the color-magnitude diagram (CMD) of the likely candidate members of NGC 6522 analyzed in this paper are shown in Figure 4. One can immediately notice that the selected stars from the APOGEE survey lie in the upper part of the red giant branch (RGB) indicated by red and blue filled symbols, and occupy the same locus that other potential stellar cluster candidates inside the half-light radius arcmin —see Cohen et al. (2017) for details about VVV+2MASS (Skrutskie et al., 2006; Minniti et al., 2010) CMDs of this cluster. The faintest star in these diagrams correspond to the star 2M180336603002164 ( and ), while 2M180323563001588 ( and ) is the brightest star as listed in Table 1.
4 LIGHT-ELEMENT abundances in NGC 6522
In this work, we employed the Brussels Automatic Stellar Parameter (BACCHUS)444The previous (DR12) and current (DR13/14) version of ASPCAP does not determine the abundances of the neutron-capture elements Ce and Nd, but the recent characterization (e.g., oscillator strenghts) of the H-band Nd II and Ce II lines (Hasselquist et al., 2016; Cunha et al., 2017), permits, in principle, their abundances derivation by using a spectral synthesis code like BACCHUS (see text for more details). For consistency (among other reasons), we re-derived all abundances with BACCHUS. code (see Masseron et al., 2016; Hawkins et al., 2016) to derive chemical abundances for up to eight chemical elements that are typical indicators of stars with ”polluted chemistry” in GCs (C, N, O, Al, Mg, and Si) (see, e.g., Tang et al., 2018; Schiavon et al., 2017a). The synthetic spectra were based on 1D Local Thermodynamic Equilibrium (LTE) model atmospheres calculated with MARCS (Gustafsson et al., 2008) using the solar abundance table from Asplund et al. (2005), except for Ce, which we have adopted the abundance table from Grevesse et al. (2015).
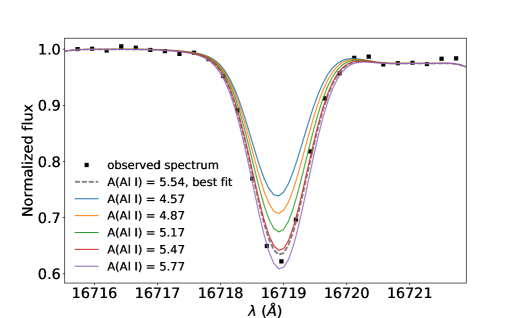
All the chemical species were first visually inspected line-by-line and rejected if they were found to be problematic, i.e., lines heavily blended by telluric features were rejected. Note that, in contrast to ASPCAP pipeline (which employ KURUCZ atmospheric models, e.g., see García Pérez et al., 2016), we provide a line-by-line analysis based on MARCS model atmosphere grid. Table 4 lists the wavelength regions used to obtain the individual abundances, while Figure 5 plots an example of the best fits obtained using MARCS/BACCHUS synthetic spectra around the Al I line, 16718.957 Å. BACCHUS software provides four different abundance determinations: (i) line-profile fitting; (ii) core line intensity comparison; (iii) global goodness-of-fit estimate (); and (iv) equivalent width comparison; and each diagnostic yields validation flags. Based on these flags, a decision tree then rejects the line or accept it, keeping the best-fit abundance (see, e.g., Hawkins et al., 2016). Then, following the suggestion by Hawkins et al. (2016), we adopt the diagnostic as the abundance, which is the most robust.
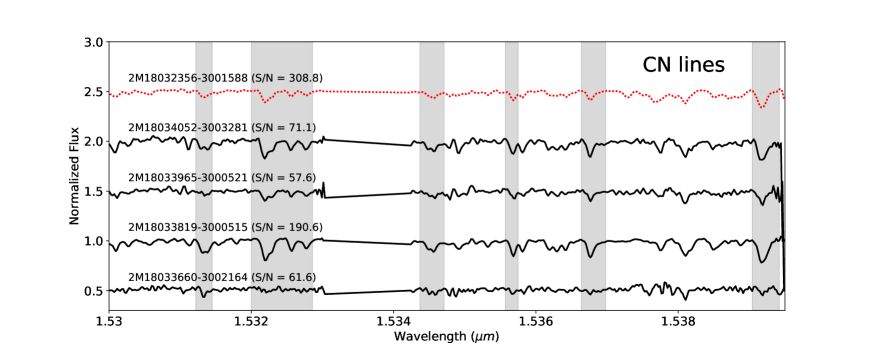
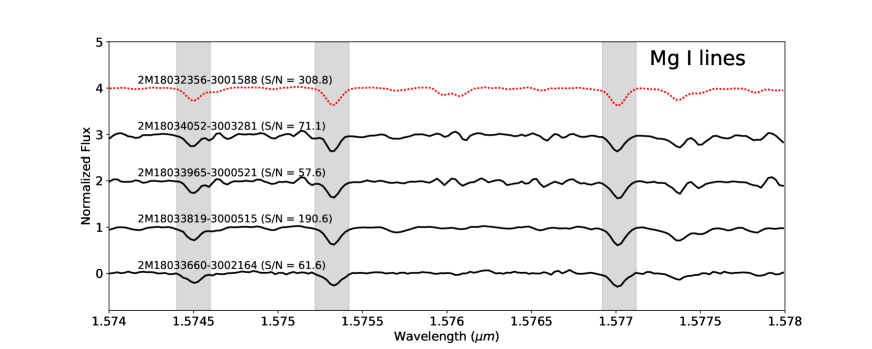
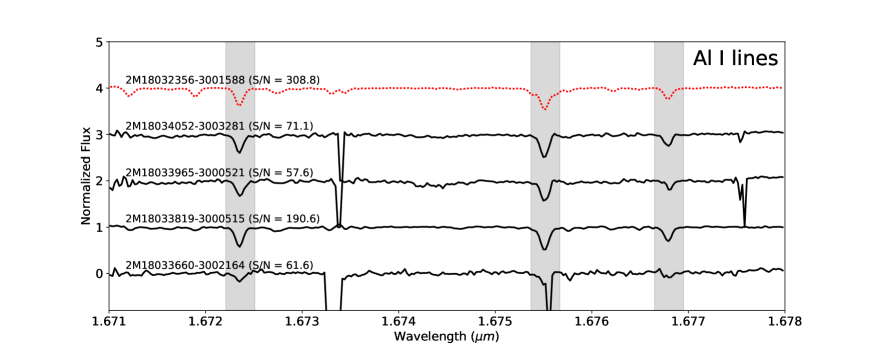
In Figure 6, we plot several portions of the observed APOGEE spectra, showing examples of the windonws used in our chemical analysis to extract the N, Al, and Mg abundances from the CN lines, Al I, and Mg I spectral features, respectively. The 12C14N and Al I lines are strong for the Teff, log g and metallicity range of our sample stars, already indicating that they are enhanced in N and Al. The only exception, as expected, is the hottest star in our sample (2M18033660-3002164), which displays much weaker CN, Al I, and Mg I spectral lines in its relatively low-S/N spectrum that makes their abundances more uncertain (in particular for N; see e.g., Mészáros et al., 2015).
To avoid any spurious results, we rejected the two sodium lines at 1.6373m and 1.6388 m, as they are very weak in the typical Teff, log g and metallicity range of our sample, leading to unreliable [Na/Fe] abundances. In addition, lines such as Nd II, Na I, Cr I, Mn I, Ni I, and other chemical species were rejected, as they were found to be weak and heavily blended by other features, which can alter the abundances.
For each star, the abundances are then derived by means of a line-by-line analysis using the BACCHUS pipeline and MARCS model atmospheres (Gustafsson et al., 2008). The line list adopted in this work is the version linelist.20150714, which was used for the DR14 results (Abolfathi et al., 2018), and it includes both atomic and molecular species. For a more detailed description of these lines, we refer the reader to a forthcoming paper (Holtzman et al. in preparation).
For each sample star, we need Teff and log g as input parameters in BACCHUS. Thus, we decided to use the DR14 ASPCAP uncalibrated effective temperature (T)555In contrast to Mészáros et al. (2015), we chose not to estimate the Teff values from any empirical color-temperature relation; this is highly uncertain due to the relatively high NGC 6522 reddening, E(J-K) 0.25 (see e.g., Schultheis et al., 2017). that comes from the best ASPCAP global fit to the observed spectra as well as independent surface gravities from PARSEC (Bressan et al. 2012) isochrones (chosen to be 12 Gyr). With fixed Teff and log g, the first step consists of determining the metallicity, and parameter, and the convolution parameter, i.e., the metallicity provided is the average abundance of selected Fe lines, and the is obtained by minimising the trend of Fe abundances against their reduced equivalent width, while the convolution parameter stands fro the total effect of the instrument resolution, the macroturbulence, and sin i on the line broadening (e.g., Hawkins et al., 2016). In addition, we have adopted the C, N and O abundances that satisfy the fitting of all molecular lines consistently; i.e., we first derive O abundances from OH, then derive C from CO and N from CN lines and the CNO abundances are derived several times to minimize the OH, CO, and CN dependences (see e.g., Smith et al., 2013; Souto et al., 2016). The mean abundances determined with these input atmospheric parameters and the BACCHUS pipeline are listed in Table 2.
In Table 3, we indicate the typical uncertainty of our abundance determinations, i.e., the uncertainty in each of the atmospheric parameters. The final uncerntainty for each element was calculated as the root squared sum of the individual uncertainties due to the errors in each atmospheric parameter under the assumption that these individual uncertainties are independent. The reported uncertainty for each chemical species is: ; where is calculated using the standard deviation from the different abundances of the different lines for each element, while , , and are derived for each chemical specie while varying by 100 K, log by dex, and by km s-1. These values were chosen as they represent the typical uncertainty in the atmospheric parameters for our sample.
It is important to note that our line-by-line abundances provides evidence that the new NGC 6522 members reported here are enriched in N and Al, probing the second-generation nature of these stars.
| APOGEE ID | J2MASS | H2MASS | Ks2MASS | JVVV | HVVV | KsVVV | V | Vscatter | Nvisits | S/N | |||
|---|---|---|---|---|---|---|---|---|---|---|---|---|---|
| (km s-1) | (km s-1) | pixel-1 | |||||||||||
| 2M180323563001588 | 12.920 | 14.109 | 11.847 | 10.1530.022 | 9.1740.025 | 8.9360.023 | 10.1710.001 | 9.3810.001 | 9.1570.001 | 13.450.01 | 2.59 | 3 | 308.8 |
| 2M180340523003281 | 14.789 | 15.679 | 13.781 | 12.1090.025 | 11.2980.027 | 11.1130.027 | 12.2910.002 | 11.7150.002 | 11.4060.002 | 21.970.02 | 0.32 | 7 | 71.1 |
| 2M180339653000521 | 14.661 | 15.484 | 13.618 | 11.8360.034 | 11.1040.035 | 10.8970.034 | 12.1980.002 | … | 11.3290.002 | 19.610.03 | 0.11 | 4 | 57.6 |
| 2M180338193000515 | 13.618 | 14.569 | 12.577 | 10.9960.028 | 10.1060.026 | 9.9070.03 | 11.1950.001 | 11.2010.001 | 10.0300.001 | 15.490.01 | 0.05 | 3 | 190.6 |
| 2M180336603002164 | 15.322 | 15.818 | 14.144 | 13.0060.045 | 11.803 | 11.574 | 13.0220.004 | 12.4430.004 | 12.2720.005 | 6.610.06 | 0.27 | 7 | 61.6 |
5 Cerium abundances in NGC 6522
As we have mentioned above, the two neutron-capture elements Ce and Nd have been detected in APOGEE spectra until now (via their Nd II and Ce II H-band absorption lines; Hasselquist et al., 2016; Cunha et al., 2017), providing an unique opportunity to determine the elemental abundances of these elements from H-band spectra. Unfortunately, the ten Nd II lines between 15284.5 and 16634.7 Å(see Table 3 in Hasselquist et al. 2016) are too weak (and/or heavily affected by telluric features) in the APOGEE spectra of our sample stars, being not useful for the Nd abundance determination. However, four strong/clean Ce II lines (see Table 4) are clearly detected in two sample stars (2M18032356-3001588 and 2M18033819-3000515), which permit us to estimate their Ce abundances.
The star 2M18032356-3001588 was previously analyzed by (Schiavon et al., 2017a) and its Ce abundance ([Ce/Fe]=0.10 dex) has been provided by Cunha et al. (2017). We measure a BACCHUS-based mean Ce abundance of [Ce/Fe]=0.090.04, which is in excellent agreement with the one reported by Cunha et al. (2017), while our C, Fe, Al, and Mg abundances agree by 0.1 dex with the DR12 abundances reported by (Schiavon et al., 2017a); the only exception is N, for which we find a higher N abundance (by 0.25 dex; [N/Fe]=1.29). Thus, 2M18032356-3001588 displays a chemical composition somehow intermediate between the first generation and second-generation stars in the Mg-Al plane as compared to other GCs at similar metallicity (see Figure 7, left panel).
The star 2M18033819-3000515 shows also a N-enrichment very similar to 2M18032356-3001588. Contrary to 2M18032356-3001588, the star 2M18033819-3000515 displays a mildly enhanced Ce abundance of [Ce/Fe]=+0.230.03, which is accompanied by a higher Al content (and lower Mg) that is consistent with a second-generation nature.
For 2M180339653000521, 2M180340523003281 and 2M180336603002164, the Ce II absortion lines are heavily affected by telluric features and too weak to be derived, and were not well reproduced by the synthesis. Thus, we do not provide the [Ce/Fe] abundance ratios for these stars.
6 Discussion
Two of the stars analyzed in the present sample (2M180338193000515 and 2M180340523003281) show high Al abundances ([Al/Fe]), potentially associated with a second stellar generation. This is also corroborated by the high N ([N/Fe]), indicating a clear correlation between these two elements. This is in good agreement with the self-enrichment scenario where the origin of the SG chemical pattern is attributed to the pollution with gas reprocessed by proton-capture nucleosynthesis (see Mészáros et al., 2015). The other three stars in the sample (2M180323563001588, 2M180339653000521, and 2M18033660-3002164) exhibit lower Al enhancement ( dex) with respect to the solar-scaled Al-abundance, while they are clearly highly N enhanced ([N/Fe]), and occupy the locus dominated by second-generation globular cluster stars at similar metallicity, and separated relatively cleanly in the [N/Fe]–[Fe/H] plane; see Figure 7.
We caution on the accuracy of [Al/Fe] for 2M18033660-3002164, whose Al I line in Å is weaker; while it has a high N abundance, we warn that these lines are nor reliable. For 12C16O and 16OH the lines are weak and heavily blended by telluric features. At this time, we cannot guarantee the quality of the [C/Fe] and [O/Fe] abundances for 2M18033660-3002164, this is not the case for 12C14N and therefore the [N/Fe] abundance ratio have been derived by fixing A(C) and A(O) using the reported [O/Fe] and [C/Fe] from Chiappini et al. (2011); star B107 (2M18033660-3002164) in that work.
Any conclusion given on the basis of the Mg abundances is less trivial. The small size of the APOGEE sample discussed here limits the possibility of clearly identifying stars of the first generation (FG). This affects, in particular, any conclusion on the presence or not of Mg depletion in this cluster based solely on APOGEE data. In clusters of similar metallicities, the Mg variation between FG and SG members is generally smaller ( dex, see, e.g. Mészáros et al., 2015) than what is observed in Al and N. More caution must be taken when considering that such Mg variation is comparable with the abundance uncertainties. Nevertheless, the APOGEE data suggest the presence of a Mg-Al anticorrelation. This Mg-Al anticorrelation has also been observed by (Ness et al., 2014), where abundances for a larger sample of stars (8) have been measured. From Figure 7, however, the Mg measurements from Ness et al. seem to be systematically higher than the present APOGEE sample and the Recio-Blanco et al. (2017) sample. This is also confirmed by Barbuy et al. (2014), where they found [Mg/Fe] systematically higher (+0.2 dex) for 4 stars in common with the Ness et al. (2014) sample. A larger stellar sample, analyzed in a homogeneous fashion, with more accurate abundances, is needed to further confirm the presence of a possible Mg spread between FG and SG stars. This is also what is needed in order to directly compare these observations with any GC formation/evolution scenario so far proposed to explain the origin of the multiple populations (see, e.g., Bastian & Lardo, 2018, for a general review). Most the stars in our final dataset lie in a group with super-solar [N/Fe] and [Al/Fe], and clearly extend beyond of the typical chemical abundances observed in Milky Way field stars.
The [O/Fe] abundance ratios, listed in Table 2, are generally higher compared with APOGEE-DR14/ASPCAP results, by 0.15 dex, showing that [O/Fe] abundance ratios are particularly sensitive to log g. As the abundances of C and O affect CN lines (see Schiavon et al., 2017a), it can seen in Table 2 that the variations in [O/Fe] does not affect significantly the [N/Fe] abundance ratios in our sample, which turn out to be nitrogen rich, with remarkably stronger CN lines with non-enhanced carbon abundances ([C/Fe] +0.15). In other words, these stars exhibit clear N enhancements, even when [O/Fe] is slightly sensitive to log g.
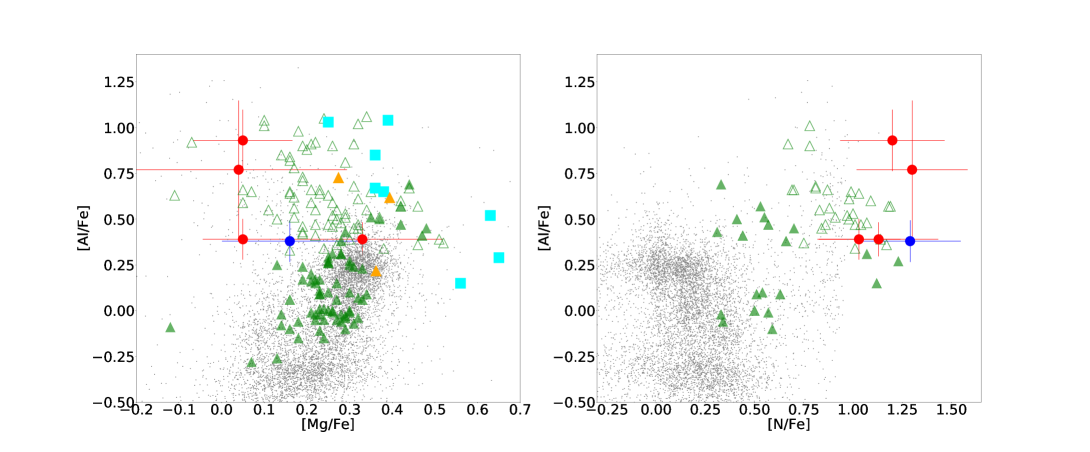
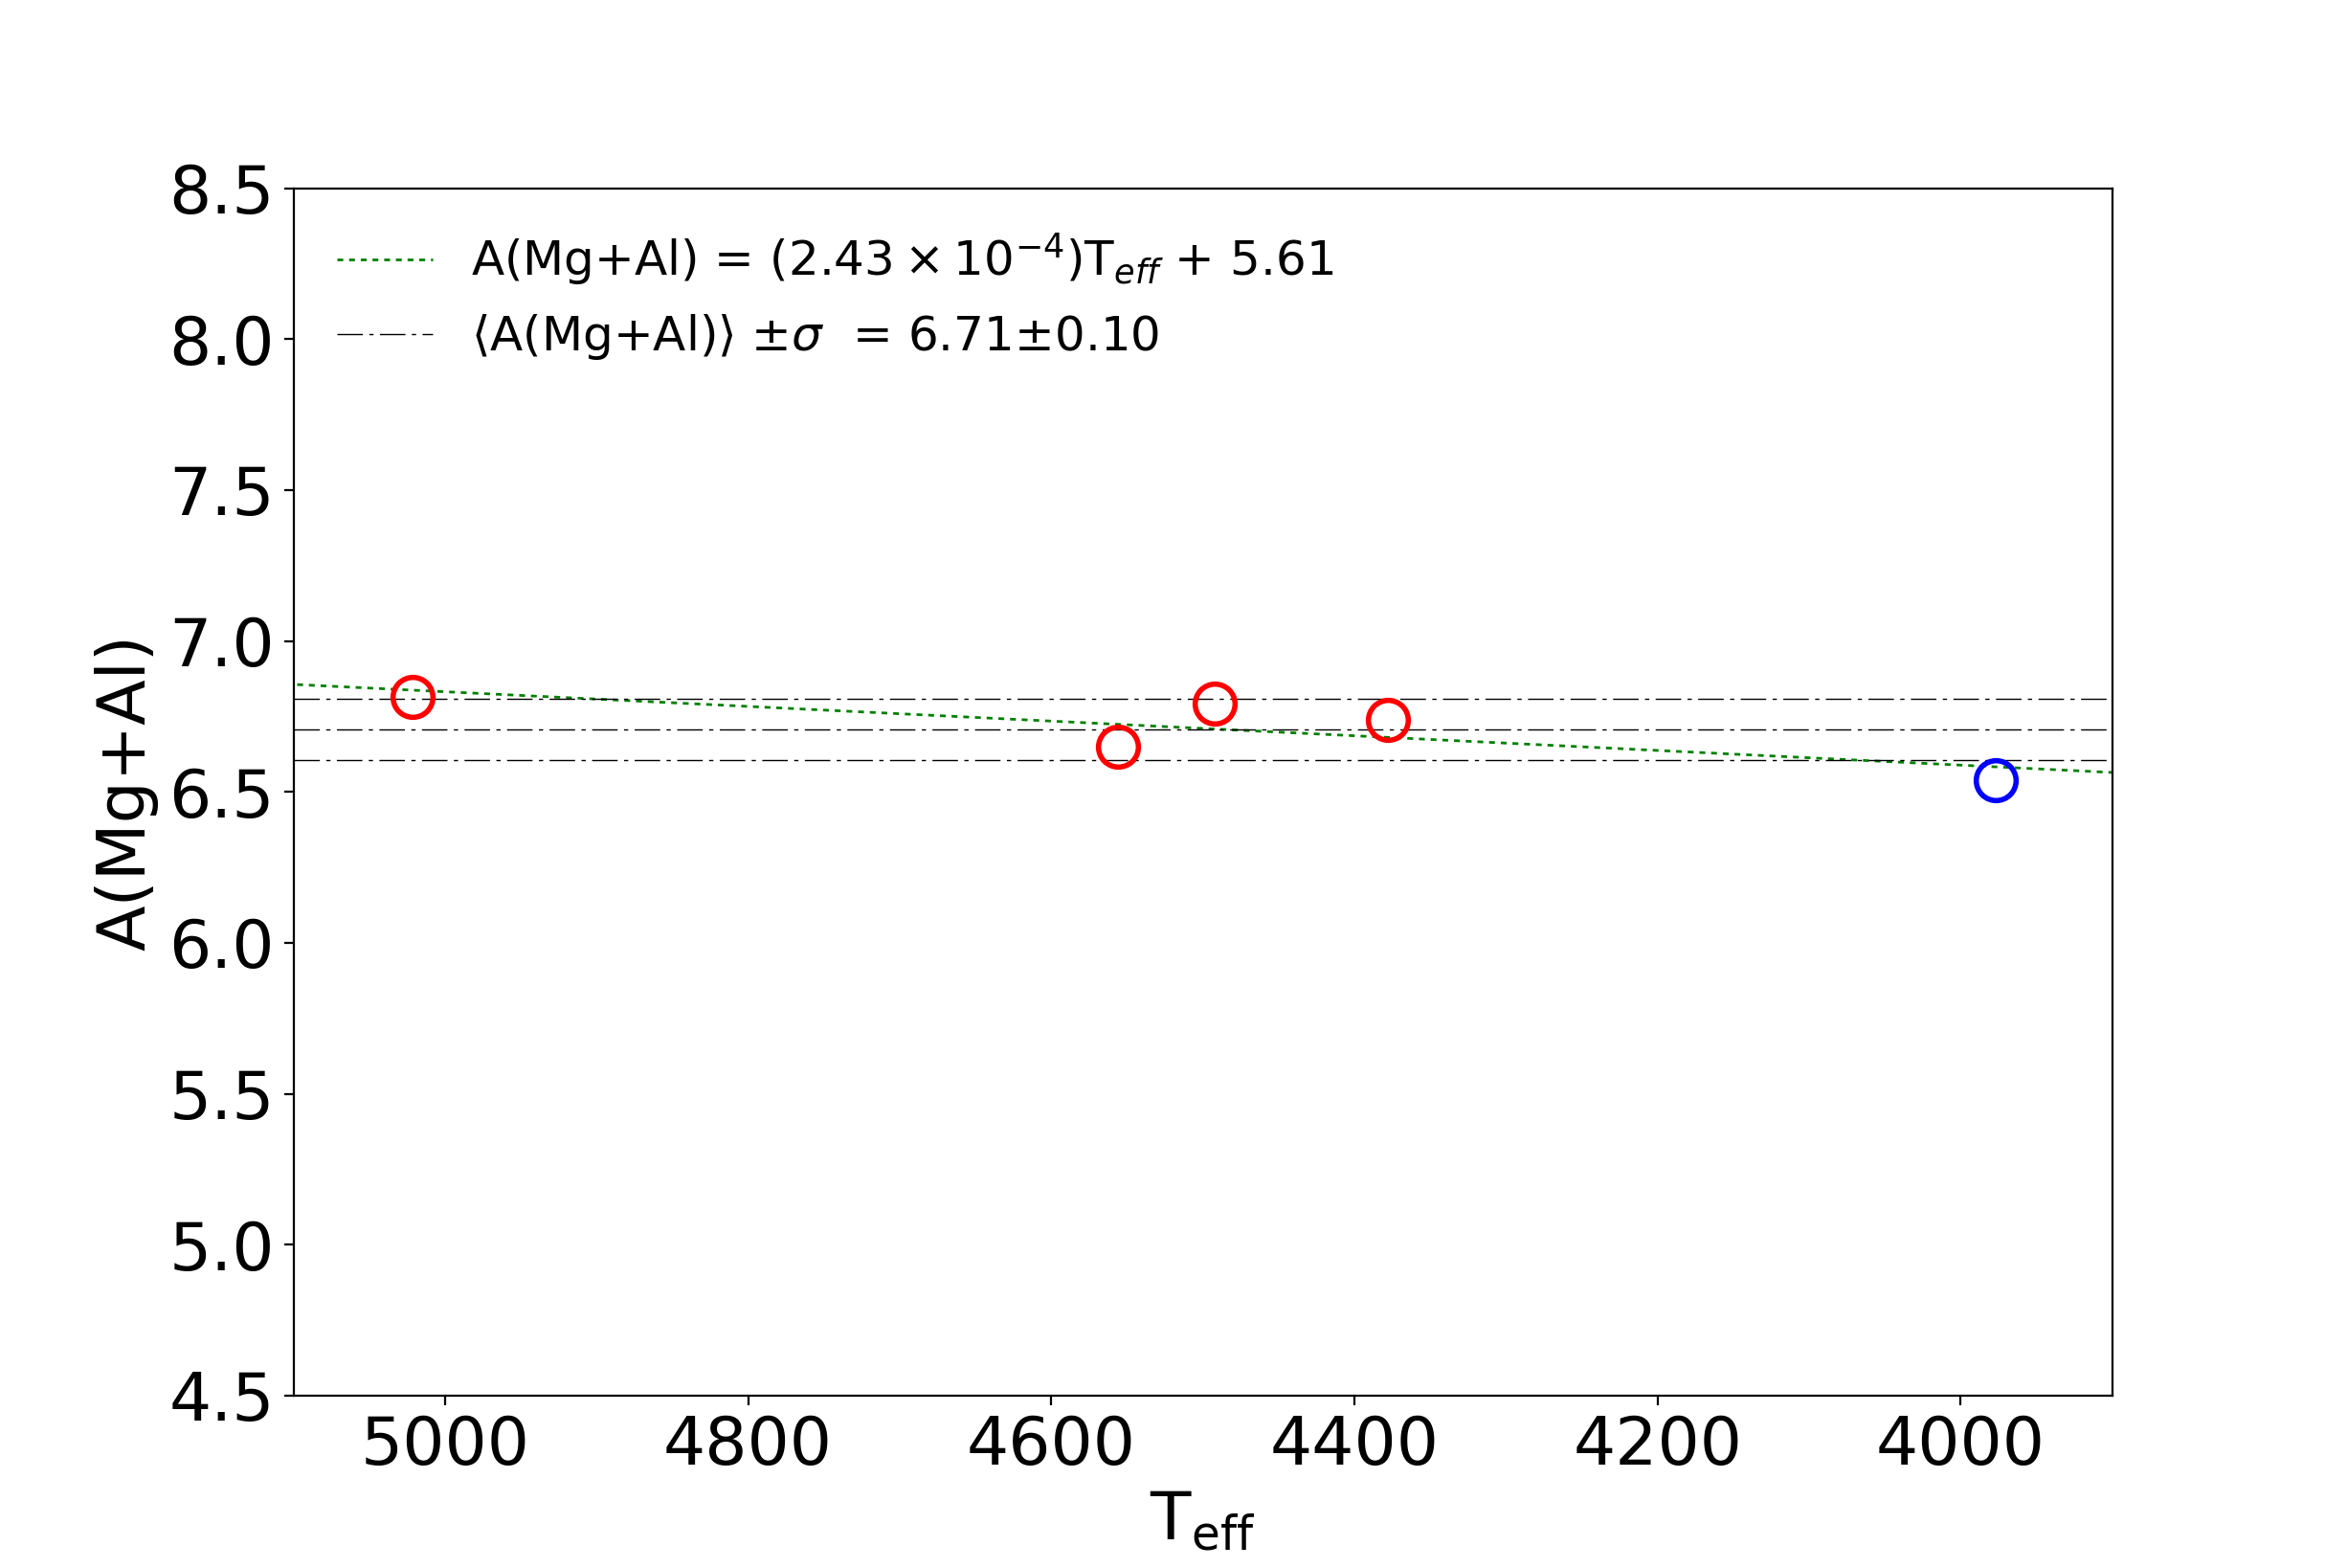
As mentioned above, the newly identified stellar members of NGC 6522 display enhancements in [Al/Fe], suggesting that NGC 6522 exhibits large scatter in its Al abundance ratios. Combining our results with the abundances analysis from Ness et al. (2014) and Recio-Blanco et al. (2017), we infer Al variations to be [Al/Fe] 1 dex. Such Al enhancements provide an indication that multiple populations with distinctive chemistry are present in NGC 6522, and that the MgAl cycles have been activated. Figure 7 clearly shows the Mg-Al anti-correlation in our sample, and the [Mg/Fe] abundances show a much smaller variation ([Mg/Fe]+0.2 dex) in our MARCS/BACCHUS determinations. However, the combined datasets show that Mg exhibits significantly larger scatter than any implicit systematic error. This comparison allows us to confirm the conversion of Mg into Al during the MgAl cycles, which is present in NGC 6522. The summed abundance A(Mg+Al) is expected to be constant as a function of Teff when material is completely processed through the MgAl cycle, and that is what our results show in Figure 8. This finding is a clear confirmation of the results reported in our previous work (see Schiavon et al., 2017a; Recio-Blanco et al., 2017).
Concerning silicon, we found over-abundances of [Si/Fe] ratios, on the order of 0.3, which is similar to APOGEE-DR14/ASPCAP values, with a reasonably small scatter, within our measurement errors. So far, our abundance values fall into acceptable ranges with the literature on abundance studies in globular cluster stars (e.g., see Carretta et al., 2012; Mészáros et al., 2015; Recio-Blanco et al., 2017). We find that the Si-Al correlation is also weak in our data. This could be interpreted as evidence for Si leaking from the Mg-Al cycle (for discussion and references, see, e.g., Tang et al., 2018), i.e., one would expect the Si enhancement to be correlated with Al in metal-poor globular clusters, where the AGB stars burn slightly hotter or in high-mass clusters, where the chemical enrichment is more efficient (see Carretta et al., 2009a; Mészáros et al., 2015).
Radial velocity variation: The stars 2M180338193000515, 2M180339653000521, 2M180340523003281, and 2M180336603002164 were visited 3, 4, 7, and 7 times, respectively, by the APOGEE survey. This allow us to identify any significant variation in their radial velocities, in order to add empirical constraints to the origin of the observed N and Al over-abundances. Thus, given that the typical variation in radial velocity measured for these stars is of the order of V 0.4 km s-1 (see Nidever et al., 2015), this rules out the binary mass-transfer hypothesis (see Schiavon et al., 2017b) as possible polluters.
It is important to note that the derived [Ce/Fe] ratios are compatible with previous works that found low s-process abundances, as (e.g., Ness et al., 2014). Our results reinforce the hypothesis that the s-process rich material in NGC6522 could have been formed due to the pollution of the pristine gas by a former population of massive AGB stars (e.g., Ventura et al., 2016; Dell’Agli et al., 2018; Fishlock et al., 2014) and, on the other side, they do not support an scenario in which the spinstars are the main polluters.
Finally, Fernández-Trincado et al. (2017b, a, 2019d) have recently discovered a new N- and Al-rich ([N/Fe] and [Al/Fe] ratios around +1.0 dex) population of stars on very eccentric orbits (e0.65) in the Milky Way field (towards the bulge, the disk, and the halo), passing through the inner regions of the Milky Way bulge. Whether globular clusters at similar metallicities are able to kick out stars with similar chemical behavior, as seen in the innermost regions of NGC 6522, we would expect that a few field stars with similar chemistry patterns (Schiavon et al., 2017b; Fernández-Trincado et al., 2017b, 2019c, 2019b, 2019d, 2019a, for instance) could have been ejected from these bulge cluster enviroments with a relative velocity greater that the escape velocity of the GCs, particularly being ejected from some scenarios involving binary systems or black hole interactions (see, e.g., Hut, 1983; Heggie et al., 1996; Pichardo et al., 2012; Fernández Trincado et al., 2013; Fernández-Trincado et al., 2015b, a, 2016b), or due to simple tidal forces (Küpper et al., 2012; Lane et al., 2012). In turn, these could be capable of exceeding the escape velocity at the radius of the bulge ( km s-1), this means that we would expect a few of the N-rich stars with enhanced Al abundances ([Al/Fe]+0.6) not to be part of the Milky Way bulge and would therefore describe eccentric orbits, as recently found. More accurate distances and proper motions are needed to confirm this hypothesis.
7 Concluding remarks
We have used an independent pipeline called BACCHUS (see Masseron et al., 2016; Hawkins et al., 2016), an updated line list and careful line selection to explore the chemical abundance patterns of five potential members of the globular cluster NGC 6522.
The distinctive chemical patterns characterising multiple populations, specially enrichment in nitrogen and aluminium, simultaneous with low carbon-abundance ratios ([C/Fe] +0.15) have been measured in our sample, thus confirming the presence of multiple populations in NGC 6522.
The main results of our chemical abundance analysis from high-resolution APOGEE spectra in NGC 6522 potential members can be summarised as follows:
-
•
We report the identification of three new potential stellar members (2M18033819-3000515, 2M18033965-3000521 and 2M18034052-3003281) of NGC 6522 in the Apache Point Observatory Galactic Evolution Experiment (APOGEE) survey (Majewski et al., 2017). The spectra analyzed in this work have a signal-to-noise ratios larger than 50, exhibiting very similar line strengths (namely CN bands, Al I and Mg I lines) to that of 2M18032356-3001588 (see Schiavon et al., 2017b), making also them ideal for line-by-line spectrum synthesis calculations of selected clean features. These spectral properties suggest that this group of stars share a common formation history, and spatial relationship on the sky, and are therefore gravitationally bound to NGC 6522.
-
•
We have measured significant N and Al over-abundances, with carbon depletion in NGC 6522 members, suggesting that the distinctive chemical patterns characterising multiple stellar populations is present within NGC 6522, it reinforces the recent claims in the literature (Schiavon et al., 2017a; Recio-Blanco et al., 2017; Kerber et al., 2018).
-
•
Lastly, we do not find any enhancement in heavy elements measured from APOGEE spectrum (Ce II). We have measured only mildly enhanced [Ce/Fe]0.25 abundance ratios, in agreement with recent optical studies, which contradict previous observational evidence for the chemical signatures of rapidly rotating Population III stars (”spinstars”) in NGC 6522. Such low s-process abundances could still be consistent with other intra-cluster medium polluters such as massive AGB stars.
| APOGEE ID | 2M18032356- | 2M18033819- | 2M18033965- | 2M18034052- | 2M18033660- |
|---|---|---|---|---|---|
| 3001588 | 3000515 | 3000521 | 3003281 | 3002164 | |
| Teff (K) | 3977.2 | 4378.1 | 4555.8 | 4492.3 | 5021.1 |
| log g (dex) | 0.50 | 1.09 | 1.35 | 1.26 | 1.99 |
| (km s-1) | 2.46 | 2.67 | 2.43 | 1.92 | 1.37 |
| 1.20 | 0.97 | 0.99 | 0.97 | 1.08 | |
| 0.48 | 0.33 | 0.29 | 0.24 | … | |
| 1.29 | 1.30 | 1.03 | 1.20 | 1.13 | |
| 0.39 | 0.30 | 0.29 | 0.35 | … | |
| 0.38 | 0.77 | 0.39 | 0.93 | 0.39 | |
| 0.16 | 0.04 | 0.05 | 0.05 | 0.33 | |
| 0.28 | 0.17 | 0.18 | 0.37 | 0.51 | |
| 0.09 | 0.23 | … | … | … |
| APOGEEID | ||||||
|---|---|---|---|---|---|---|
| 2M180323563001588 | Fe | 0.055 | 0.033 | 0.041 | 0.050 | 0.091 |
| 2M180323563001588 | C | 0.038 | 0.132 | 0.081 | 0.030 | 0.162 |
| 2M180323563001588 | N | 0.172 | 0.135 | 0.122 | 0.060 | 0.257 |
| 2M180323563001588 | O | 0.141 | 0.075 | 0.076 | 0.070 | 0.190 |
| 2M180323563001588 | Mg | 0.092 | 0.097 | 0.071 | 0.050 | 0.159 |
| 2M180323563001588 | Al | 0.075 | 0.053 | 0.067 | 0.010 | 0.114 |
| 2M180323563001588 | Si | 0.022 | 0.017 | 0.021 | 0.100 | 0.106 |
| 2M180323563001588 | Ce | 0.044 | 0.072 | 0.039 | 0.040 | 0.101 |
| 2M180340523003281 | Fe | 0.054 | 0.035 | 0.024 | 0.080 | 0.105 |
| 2M180340523003281 | C | 0.084 | 0.121 | 0.040 | 0.020 | 0.154 |
| 2M180340523003281 | N | 0.190 | 0.151 | 0.039 | 0.100 | 0.265 |
| 2M180340523003281 | O | 0.146 | 0.049 | 0.017 | 0.020 | 0.156 |
| 2M180340523003281 | Mg | 0.060 | 0.066 | 0.044 | 0.060 | 0.116 |
| 2M180340523003281 | Al | 0.118 | 0.098 | 0.031 | 0.060 | 0.168 |
| 2M180340523003281 | Si | 0.033 | 0.025 | 0.014 | 0.090 | 0.100 |
| 2M180340523003281 | Ce | … | …. | … | … | … |
| 2M180339653000521 | Fe | 0.032 | 0.041 | 0.008 | 0.040 | 0.066 |
| 2M180339653000521 | C | 0.071 | 0.092 | 0.116 | 0.040 | 0.169 |
| 2M180339653000521 | N | 0.121 | 0.071 | 0.149 | 0.050 | 0.211 |
| 2M180339653000521 | O | 0.121 | 0.053 | 0.027 | 0.020 | 0.136 |
| 2M180339653000521 | Mg | 0.068 | 0.037 | 0.019 | 0.050 | 0.094 |
| 2M180339653000521 | Al | 0.099 | 0.041 | 0.021 | 0.02 | 0.111 |
| 2M180339653000521 | Si | 0.032 | 0.067 | 0.024 | 0.06 | 0.098 |
| 2M180339653000521 | Ce | … | …. | … | … | |
| 2M180338193000515 | Fe | 0.061 | 0.092 | 0.011 | 0.050 | 0.122 |
| 2M180338193000515 | C | 0.020 | 0.133 | 0.017 | 0.040 | 0.141 |
| 2M180338193000515 | N | 0.148 | 0.234 | 0.010 | 0.050 | 0.282 |
| 2M180338193000515 | O | 0.149 | 0.025 | 0.003 | 0.070 | 0.166 |
| 2M180338193000515 | Mg | 0.128 | 0.201 | 0.034 | 0.080 | 0.254 |
| 2M180338193000515 | Al | 0.244 | 0.277 | 0.037 | 0.070 | 0.378 |
| 2M180338193000515 | Si | 0.163 | 0.214 | 0.046 | 0.080 | 0.284 |
| 2M180338193000515 | Ce | 0.045 | 0.143 | 0.004 | 0.030 | 0.153 |
| 2M180336603002164 | Fe | 0.049 | 0.018 | 0.037 | 0.100 | 0.119 |
| 2M180336603002164 | C | … | … | … | … | … |
| 2M180336603002164 | N | 0.247 | 0.103 | 0.059 | 0.130 | 0.303 |
| 2M180336603002164 | O | … | … | … | … | … |
| 2M180336603002164 | Mg | 0.071 | 0.077 | 0.044 | 0.150 | 0.188 |
| 2M180336603002164 | Al | 0.065 | 0.033 | 0.057 | … | 0.093 |
| 2M180336603002164 | Si | 0.043 | 0.018 | 0.025 | 0.290 | 0.295 |
| 2M180336603002164 | Ce | … | … | … | … | … |
Acknowledgements.
We would like to thank the referee for insightful comments that helped to improve this work. J.G.F-T, P.L-P, and J.A-G were supported by MINEDUC-UA project, code ANT 1855. J.G.F-T also acknowledges financial support from the FONDECYT No. 3180210 and the ChETEC COST Action (CA16117), supported by COST (European Cooperation in Science and Technology). D.G. gratefully acknowledges support from the Chilean Centro de Excelencia en Astrofísica y Tecnologías Afines (CATA) BASAL grant AFB-170002. D.G. also acknowledges financial support from the Dirección de Investigación y Desarrollo de la Universidad de La Serena through the Programa de Incentivo a la Investigación de Académicos (PIA-DIDULS). S.V gratefully acknowledges the support provided by Fondecyt reg. n. 1170518. Szabolcs Mészáros has been supported by the Premium Postdoctoral Research Program of the Hungarian Academy of Sciences, and by the Hungarian NKFI Grants K-119517 of the Hungarian National Research, Development and Innovation Office. R.E.M. acknowledges project fondecyt 1190621. D.M. and J.A-G. are supported also by FONDECYT No. 1170121 and 11150916 respectively, and by the Ministry of Economy, Development, and Tourism’s Millennium Science Initiative through grant IC120009, awarded to the Millennium Institute of Astrophysics (MAS). DAGH, OZ, FDA, and TM acknowledge support from the State Research Agency (AEI) of the Spanish Ministry of Science, Innovation and Universities (MCIU) and the European Regional Development Fund (FEDER) under grant AYA2017-88254-P. T.C.B. acknowledges partial support from grant PHY 14-30152: Physics Frontier Center/JINA Center for the Evolution of the Elements (JINA-CEE), awarded by the US National Science Foundation.BACCHUS have been executed on computers from the Institute of Astronomy and Planetary Sciences at Universidad de Atacama.
This work has made use of results from the European Space Agency (ESA) space mission Gaia, the data from which were processed by the Gaia Data Processing and Analysis Consortium (DPAC). Funding for the DPAC has been provided by national institutions, in particular the institutions participating in the Gaia Multilateral Agreement. The Gaia mission website is http://www.cosmos.esa.int/gaia. Funding for the Sloan Digital Sky Survey IV has been provided by the Alfred P. Sloan Foundation, the U.S. Department of Energy Office of Science, and the Participating Institutions. SDSS- IV acknowledges support and resources from the Center for High-Performance Computing at the University of Utah. The SDSS web site is www.sdss.org. SDSS-IV is managed by the Astrophysical Research Consortium for the Participating Institutions of the SDSS Collaboration including the Brazilian Participation Group, the Carnegie Institution for Science, Carnegie Mellon University, the Chilean Participation Group, the French Participation Group, Harvard-Smithsonian Center for Astrophysics, Instituto de Astrofìsica de Canarias, The Johns Hopkins University, Kavli Institute for the Physics and Mathematics of the Universe (IPMU) / University of Tokyo, Lawrence Berkeley National Laboratory, Leibniz Institut für Astrophysik Potsdam (AIP), Max-Planck-Institut für Astronomie (MPIA Heidelberg), Max-Planck-Institut für Astrophysik (MPA Garching), Max-Planck-Institut für Extraterrestrische Physik (MPE), National Astronomical Observatory of China, New Mexico State University, New York University, University of Dame, Observatório Nacional / MCTI, The Ohio State University, Pennsylvania State University, Shanghai Astronomical Observatory, United Kingdom Participation Group, Universidad Nacional Autónoma de México, University of Arizona, University of Colorado Boulder, University of Oxford, University of Portsmouth, University of Utah, University of Virginia, University of Washington, University of Wisconsin, Vanderbilt University, and Yale University.
References
- Abolfathi et al. (2018) Abolfathi, B., Aguado, D. S., Aguilar, G., et al. 2018, ApJS, 235, 42
- Alam et al. (2015) Alam, S., Albareti, F. D., Allende Prieto, C., et al. 2015, ApJS, 219, 12
- Albareti et al. (2017) Albareti, F. D., Allende Prieto, C., Almeida, A., et al. 2017, ApJS, 233, 25
- Alonso-García et al. (2012) Alonso-García, J., Mateo, M., Sen, B., et al. 2012, AJ, 143, 70
- Asplund et al. (2005) Asplund, M., Grevesse, N., & Sauval, A. J. 2005, in Astronomical Society of the Pacific Conference Series, Vol. 336, Cosmic Abundances as Records of Stellar Evolution and Nucleosynthesis, ed. T. G. Barnes, III & F. N. Bash, 25
- Barbuy et al. (2014) Barbuy, B., Chiappini, C., Cantelli, E., et al. 2014, A&A, 570, A76
- Barbuy et al. (2009) Barbuy, B., Zoccali, M., Ortolani, S., et al. 2009, A&A, 507, 405
- Bastian & Lardo (2018) Bastian, N. & Lardo, C. 2018, ARA&A, 56, 83
- Carretta (2016) Carretta, E. 2016, ArXiv e-prints [arXiv:1611.04728]
- Carretta et al. (2009a) Carretta, E., Bragaglia, A., Gratton, R., & Lucatello, S. 2009a, A&A, 505, 139
- Carretta et al. (2010) Carretta, E., Bragaglia, A., Gratton, R., et al. 2010, ApJ, 712, L21
- Carretta et al. (2009b) Carretta, E., Bragaglia, A., Gratton, R. G., et al. 2009b, A&A, 505, 117
- Carretta et al. (2012) Carretta, E., Bragaglia, A., Gratton, R. G., Lucatello, S., & D’Orazi, V. 2012, ApJ, 750, L14
- Carretta et al. (2007) Carretta, E., Bragaglia, A., Gratton, R. G., et al. 2007, A&A, 464, 967
- Chiappini et al. (2011) Chiappini, C., Frischknecht, U., Meynet, G., et al. 2011, Nature, 472, 454
- Cohen et al. (2017) Cohen, R. E., Moni Bidin, C., Mauro, F., Bonatto, C., & Geisler, D. 2017, MNRAS, 464, 1874
- Cunha et al. (2017) Cunha, K., Smith, V. V., Hasselquist, S., et al. 2017, ApJ, 844, 145
- Dell’Agli et al. (2018) Dell’Agli, F., García-Hernández, D. A., Ventura, P., et al. 2018, MNRAS, 475, 3098
- Eisenstein et al. (2011) Eisenstein, D. J., Weinberg, D. H., Agol, E., et al. 2011, AJ, 142, 72
- Fernández-Trincado et al. (2019a) Fernández-Trincado, J. G., Beers, T. C., Placco, V. M., et al. 2019a, arXiv e-prints [arXiv:1904.05884]
- Fernández-Trincado et al. (2019b) Fernández-Trincado, J. G., Beers, T. C., Tang, B., et al. 2019b, arXiv e-prints [arXiv:1904.05369]
- Fernández-Trincado et al. (2017a) Fernández-Trincado, J. G., Geisler, D., Moreno, E., et al. 2017a, in SF2A-2017: Proceedings of the Annual meeting of the French Society of Astronomy and Astrophysics, ed. C. Reylé, P. Di Matteo, F. Herpin, E. Lagadec, A. Lançon, Z. Meliani, & F. Royer, 199–202
- Fernández-Trincado et al. (2019c) Fernández-Trincado, J. G., Mennickent, R., Cabezas, M., et al. 2019c, arXiv e-prints [arXiv:1902.10635]
- Fernández-Trincado et al. (2019d) Fernández-Trincado, J. G., Ortigoza-Urdaneta, M., Moreno, E., Pérez-Villegas, A., & Soto, M. 2019d, arXiv e-prints [arXiv:1904.05370]
- Fernández-Trincado et al. (2016a) Fernández-Trincado, J. G., Robin, A. C., Moreno, E., et al. 2016a, ApJ, 833, 132
- Fernández-Trincado et al. (2016b) Fernández-Trincado, J. G., Robin, A. C., Reylé, C., et al. 2016b, MNRAS, 461, 1404
- Fernández-Trincado et al. (2015a) Fernández-Trincado, J. G., Robin, A. C., Vieira, K., et al. 2015a, A&A, 583, A76
- Fernández Trincado et al. (2013) Fernández Trincado, J. G., Vivas, A. K., Mateu, C. E., & Zinn, R. 2013, Mem. Soc. Astron. Italiana, 84, 265
- Fernández-Trincado et al. (2015b) Fernández-Trincado, J. G., Vivas, A. K., Mateu, C. E., et al. 2015b, A&A, 574, A15
- Fernández-Trincado et al. (2017b) Fernández-Trincado, J. G., Zamora, O., García-Hernández, D. A., et al. 2017b, ApJ, 846, L2
- Fishlock et al. (2014) Fishlock, C. K., Karakas, A. I., Lugaro, M., & Yong, D. 2014, ApJ, 797, 44
- Gaia Collaboration et al. (2018) Gaia Collaboration, Brown, A. G. A., Vallenari, A., et al. 2018, AAP, 616, A1
- García-Hernández et al. (2015) García-Hernández, D. A., Mészáros, S., Monelli, M., et al. 2015, ApJ, 815, L4
- García Pérez et al. (2016) García Pérez, A. E., Allende Prieto, C., Holtzman, J. A., et al. 2016, AJ, 151, 144
- Gnedin & Ostriker (1997) Gnedin, O. Y. & Ostriker, J. P. 1997, ApJ, 474, 223
- Gratton et al. (2004) Gratton, R., Sneden, C., & Carretta, E. 2004, ARA&A, 42, 385
- Gratton et al. (2012) Gratton, R. G., Carretta, E., & Bragaglia, A. 2012, A&A Rev., 20, 50
- Gratton et al. (2007) Gratton, R. G., Lucatello, S., Bragaglia, A., et al. 2007, A&A, 464, 953
- Grevesse et al. (2015) Grevesse, N., Scott, P., Asplund, M., & Sauval, A. J. 2015, A&A, 573, A27
- Gunn et al. (2006) Gunn, J. E., Siegmund, W. A., Mannery, E. J., et al. 2006, AJ, 131, 2332
- Gustafsson et al. (2008) Gustafsson, B., Edvardsson, B., Eriksson, K., et al. 2008, A&A, 486, 951
- Harris (1996) Harris, W. E. 1996, AJ, 112, 1487
- Hasselquist et al. (2016) Hasselquist, S., Shetrone, M., Cunha, K., et al. 2016, ApJ, 833, 81
- Hawkins et al. (2016) Hawkins, K., Masseron, T., Jofré, P., et al. 2016, A&A, 594, A43
- Heggie et al. (1996) Heggie, D. C., Hut, P., & McMillan, S. L. W. 1996, ApJ, 467, 359
- Hut (1983) Hut, P. 1983, ApJ, 272, L29
- Kerber et al. (2018) Kerber, L. O., Nardiello, D., Ortolani, S., et al. 2018, ApJ, 853, 15
- Küpper et al. (2012) Küpper, A. H. W., Lane, R. R., & Heggie, D. C. 2012, MNRAS, 420, 2700
- Lane et al. (2012) Lane, R. R., Küpper, A. H. W., & Heggie, D. C. 2012, MNRAS, 423, 2845
- Lee et al. (2019) Lee, Y.-W., Kim, J. J., Johnson, C. I., et al. 2019, ApJ, 878, L2
- Majewski et al. (2017) Majewski, S. R., Schiavon, R. P., Frinchaboy, P. M., et al. 2017, AJ, 154, 94
- Martell & Grebel (2010) Martell, S. L. & Grebel, E. K. 2010, A&A, 519, A14
- Martell et al. (2016) Martell, S. L., Shetrone, M. D., Lucatello, S., et al. 2016, ApJ, 825, 146
- Martell et al. (2011) Martell, S. L., Smolinski, J. P., Beers, T. C., & Grebel, E. K. 2011, A&A, 534, A136
- Masseron et al. (2016) Masseron, T., Merle, T., & Hawkins, K. 2016, BACCHUS: Brussels Automatic Code for Characterizing High accUracy Spectra, Astrophysics Source Code Library
- Mészáros et al. (2018) Mészáros, S., García-Hernández, D. A., Cassisi, S., et al. 2018, MNRAS, 475, 1633
- Mészáros et al. (2015) Mészáros, S., Martell, S. L., Shetrone, M., et al. 2015, AJ, 149, 153
- Minniti et al. (2010) Minniti, D., Lucas, P. W., Emerson, J. P., et al. 2010, New A, 15, 433
- Muñoz et al. (2017) Muñoz, C., Villanova, S., Geisler, D., et al. 2017, A&A, 605, A12
- Ness et al. (2014) Ness, M., Asplund, M., & Casey, A. R. 2014, MNRAS, 445, 2994
- Nidever et al. (2015) Nidever, D. L., Holtzman, J. A., Allende Prieto, C., et al. 2015, AJ, 150, 173
- Pancino et al. (2017) Pancino, E., Romano, D., Tang, B., et al. 2017, A&A, 601, A112
- Pichardo et al. (2012) Pichardo, B., Moreno, E., Allen, C., et al. 2012, AJ, 143, 73
- Pignatari et al. (2008) Pignatari, M., Gallino, R., Meynet, G., et al. 2008, ApJ, 687, L95
- Recio-Blanco et al. (2017) Recio-Blanco, A., Rojas-Arriagada, A., de Laverny, P., et al. 2017, A&A, 602, L14
- Schiavon et al. (2017a) Schiavon, R. P., Johnson, J. A., Frinchaboy, P. M., et al. 2017a, MNRAS, 466, 1010
- Schiavon et al. (2017b) Schiavon, R. P., Zamora, O., Carrera, R., et al. 2017b, MNRAS, 465, 501
- Schultheis et al. (2017) Schultheis, M., Rojas-Arriagada, A., García Pérez, A. E., et al. 2017, A&A, 600, A14
- Skrutskie et al. (2006) Skrutskie, M. F., Cutri, R. M., Stiening, R., et al. 2006, AJ, 131, 1163
- Smith et al. (2013) Smith, V. V., Cunha, K., Shetrone, M. D., et al. 2013, ApJ, 765, 16
- Souto et al. (2016) Souto, D., Cunha, K., Smith, V., et al. 2016, ApJ, 830, 35
- Tang et al. (2017) Tang, B., Cohen, R. E., Geisler, D., et al. 2017, MNRAS, 465, 19
- Tang et al. (2018) Tang, B., Cohen, R. E., Geisler, D., et al. 2018, ApJ, 855, 38
- Tang et al. (2019) Tang, B., Liu, C., Fernández-Trincado, J. G., et al. 2019, ApJ, 871, 58
- Vasiliev (2019) Vasiliev, E. 2019, MNRAS, 484, 2832
- Ventura et al. (2016) Ventura, P., García-Hernández, D. A., Dell’Agli, F., et al. 2016, ApJ, 831, L17
- Wilson et al. (2012) Wilson, J. C., Hearty, F., Skrutskie, M. F., et al. 2012, in Proc. SPIE, Vol. 8446, Ground-based and Airborne Instrumentation for Astronomy IV, 84460H
- Zasowski et al. (2017) Zasowski, G., Cohen, R. E., Chojnowski, S. D., et al. 2017, AJ, 154, 198
- Zasowski et al. (2013) Zasowski, G., Johnson, J. A., Frinchaboy, P. M., et al. 2013, AJ, 146, 81
Appendix A Line-by-line abundance determination
| Element | 2M180323563001588 | 2M180340523003281 | 2M180339653000521 | 2M180338193000515 | 2M180336603002164 | |
|---|---|---|---|---|---|---|
| Fe I | 15194.492 | 6.23 | - | 6.43 | 6.49 | - |
| 15207.526 | 6.15 | 6.36 | 6.50 | 6.51 | 6.17 | |
| 15395.718 | 6.35 | 6.49 | 6.52 | - | 6.38 | |
| 15490.339 | 6.24 | 6.42 | 6.52 | 6.58 | - | |
| 15648.510 | 6.23 | 6.38 | 6.46 | 6.50 | - | |
| 15964.867 | 6.31 | 6.57 | 6.44 | 6.42 | 6.49 | |
| 16040.657 | 6.20 | 6.54 | 6.39 | 6.42 | 6.38 | |
| 16153.247 | 6.25 | 6.50 | 6.45 | 6.50 | 6.46 | |
| 16165.032 | 6.23 | 6.57 | 6.42 | 6.43 | 6.35 | |
| 6.250.05 | 6.480.08 | 6.460.04 | 6.480.05 | 6.370.10 | ||
| Al I | 16719.0 | 5.54 | 6.41 | 5.75 | 6.16 | 5.68 |
| 16750.0 | 5.56 | 6.32 | 5.78 | 6.09 | - | |
| 16763.0 | - | 6.26 | - | 6.26 | - | |
| 5.550.01 | 6.330.06 | 5.770.02 | 6.170.07 | 5.68 | ||
| Mg I | 15740.7 | 6.53 | 6.63 | 6.58 | 6.64 | 6.99 |
| 15748.9 | 6.52 | 6.68 | 6.59 | 6.68 | 6.72 | |
| 15765.8 | 6.41 | 6.53 | - | 6.49 | 6.63 | |
| 6.490.05 | 6.610.06 | 6.590.05 | 6.600.08 | 6.780.15 | ||
| Si I | 15361.1 | - | - | - | - | - |
| 15376.8 | - | - | - | - | - | |
| 15557.8 | 6.62 | 6.86 | - | 6.68 | - | |
| 15884.5 | 6.39 | 6.76 | 6.63 | 6.63 | - | |
| 15960.1 | 6.53 | 7.10 | 6.65 | 6.67 | 6.82 | |
| 16060.0 | 6.64 | 6.97 | 6.82 | 6.71 | - | |
| 16094.8 | 6.61 | 6.92 | 6.72 | 6.79 | 6.66 | |
| 16129.0 | - | - | - | - | - | |
| 16163.7 | 6.71 | 7.00 | - | 6.79 | - | |
| 16170.2 | - | - | - | - | - | |
| 16215.7 | 6.53 | 6.92 | 6.70 | 6.68 | - | |
| 16241.8 | - | 6.83 | 6.65 | 6.63 | - | |
| 16680.8 | 6.56 | 6.88 | 6.74 | 6.64 | 7.33 | |
| 16828.2 | 6.74 | 6.89 | - | 6.89 | - | |
| 6.590.10 | 6.910.09 | 6.700.06 | 6.710.08 | 6.940.29 | ||
| Ce II | 15277.65 | - | - | - | - | - |
| 15784.75 | 0.48 | - | - | - | - | |
| 15958.40 | 0.50 | - | - | 0.88 | - | |
| 15977.12 | - | - | - | 0.83 | - | |
| 16327.32 | - | - | - | - | - | |
| 16376.48 | 0.40 | - | - | 0.81 | - | |
| 16595.18 | 0.50 | - | - | 0.84 | - | |
| 16722.51 | - | - | - | - | - | |
| 0.470.04 | - | - | 0.840.03 | - | ||
| 12C from 12C16O lines | 15774 15787 | 6.67 | - | - | 7.10 | - |
| 15976 16000 | 6.75 | 7.20 | 7.15 | 7.13 | - | |
| 16183 16196 | 6.71 | 7.16 | 7.07 | 7.04 | - | |
| 6.710.03 | 7.180.02 | 7.110.04 | 7.090.04 | - | ||
| 14N from 12C14N lines | 15260. | 7.88 | 8.01 | - | 8.14 | - |
| 15322. | 7.97 | 8.08 | 7.83 | 8.18 | - | |
| 15397. | - | - | - | 8.06 | - | |
| 15332. | 7.86 | 8.10 | 7.88 | 8.10 | 7.70 | |
| 15410. | 7.88 | 8.11 | 7.87 | 8.13 | - | |
| 15447. | 7.82 | 7.80 | - | 8.09 | - | |
| 15466. | 7.78 | 7.89 | 7.78 | 8.05 | 7.95 | |
| 15472. | 7.92 | 8.04 | - | 8.17 | - | |
| 15482. | 7.81 | 8.04 | 7.76 | 8.06 | - | |
| 7.870.06 | 8.010.10 | 7.820.05 | 8.110.05 | 7.830.13 | ||
| 16O from 16OH lines | 15278.524 | 7.93 | - | - | 7.87 | - |
| 15281.052 | 7.86 | 8.02 | - | 8.10 | - | |
| 15390.8 | 7.81 | - | 7.97 | 8.02 | - | |
| 15568.780 | 7.95 | 8.06 | - | 8.04 | - | |
| 16190.132 | 7.76 | - | 7.94 | 7.94 | - | |
| 16192.130 | 7.80 | - | - | 7.98 | - | |
| 7.850.07 | 8.040.02 | 7.960.02 | 7.990.07 | - |