Broad-line type Ic Supernova SN 2014ad
Abstract
We present optical and ultraviolet photometry, and low resolution optical spectroscopy of the broad-line type Ic supernova SN 2014ad in the galaxy PGC 37625 (Mrk 1309), covering the evolution of the supernova during 5 to +87 d with respect to the date of maximum in -band. A late phase spectrum obtained at +340 d is also presented. With an absolute band magnitude at peak of = 18.86 0.23 mag, SN 2014ad is fainter than Gamma Ray Burst (GRB) associated supernovae, and brighter than most of the normal and broad-line type Ic supernovae without an associated GRB. The spectral evolution indicates the expansion velocity of the ejecta, as measured using the Si ii line, to be as high as 33500 km s-1 around maximum, while during the post-maximum phase it settles down at 15000 km s-1. The expansion velocity of SN 2014ad is higher than all other well observed broad-line type Ic supernovae except the GRB associated SN 2010bh. The explosion parameters, determined by applying the Arnett’s analytical light curve model to the observed bolometric light curve, indicate that it was an energetic explosion with a kinetic energy of (1 0.3)1052 ergs, a total ejected mass of (3.3 0.8) M⊙, and 0.24 M⊙ of 56Ni was synthesized in the explosion. The metallicity of the host galaxy near the supernova region is estimated to be 0.5 Z⊙.
keywords:
supernovae: general – supernovae: individual: SN 2014ad – galaxies: individual : Mrk 1309 – techniques: photometric – techniques: spectroscopy1 Introduction
Core-collapse supernovae (CCSNe) arising from progenitors which are stripped of hydrogen and/or helium are known as stripped-envelope supernovae (SE-SNe). This includes types IIb, Ib and Ic supernovae (SNe). For type IIb SNe, the progenitor retains a thin layer of hydrogen at the time of explosion, whereas in type Ib, the hydrogen envelope is completely removed. Type Ic SNe show neither hydrogen nor helium in their spectra around maximum brightness, indicating that both hydrogen and helium envelopes of the progenitor stars are removed before the explosion (Filippenko 1997; Turatto 2003). The exact nature of the progenitors and the process operational in removing the outer envelopes is not fully understood. The progenitors of type Ic SNe are thought to be either a massive Wolf-Rayet (WR) star, or a less massive star in a binary system. In the case of WR stars, the helium envelope is removed by powerful stellar winds, and in a binary system, mass transfer to the companion helps in removing the helium envelope (see Langer 2012 for a recent review).
A relatively small fraction ( 4% ; Shivvers et al. 2017) of type Ic SNe show very broad lines in their spectra obtained close to maximum light, indicating very high expansion velocity ( 15000–30000 km s-1) of the ejecta. These are known as broad-line type Ic SNe. The association of the nearby GRB 980425 (Galama et al., 1998) with SN 1998bw indicated that the GRB associated SNe are of broad-line Ic type. This was later established by subsequent discovery of many other broad-line SNe associated with GRBs/XRFs (Hjorth et al. 2003; Stanek et al. 2003; Malesani et al. 2004; Pian et al. 2006; Bufano et al. 2012; Toy et al. 2016). The broad-line type Ic SNe associated with GRB/XRF, are also known as engine driven supernovae. These have a rapidly rotating central compact object powered by accretion, and often associated with relativistic outflow. However, there are some broad-line SNe which are not associated with GRBs/XRFs (Sanders et al. 2012; Mazzali et al. 2013; Walker et al. 2014). A possible interpretation of the absence of an observed GRB with some broad-line type Ic SNe is a relativistic jet initially beamed away from the line of sight of the observer (Rhoads, 1999). As the decelerating jet spreads laterally, the emission becomes effectively isotropic and shifts to longer wavelengths. Irrespective of the initial viewing angle, the afterglow emission in radio is expected to increase rapidly on a time scale of few weeks to several years (Perna & Loeb 1998; Waxman 2004). Thus late phase observation in radio can be used to search for an evidence of off-axis GRB (Soderberg et al. 2006, and references therein). The non-detection of late time radio emission from a sample of type Ibc SNe, including broad-line type Ic led Soderberg et al. (2006) to conclude that every broad-line type Ic supernova does not harbour a GRB.
In a systematic study by Modjaz et al. (2016), it was shown that type Ic SNe with GRBs have higher expansion velocities as well as broader line widths than SNe Ic without an observed GRB. Based on this, it was suggested that the broad-line SNe Ic without an observed GRB may have had lower energy and/or choked jet that imparted lower velocities to the supernova ejecta. Recently, two energetic broad-line Ic SNe 2009bb (Pignata et al., 2011) and 2012ap (Milisavljevic et al., 2015), showed mildly relativistic ejecta coupled with strong radio emission. The pre-maximum spectra of both the objects show the presence of helium, leading Margutti et al. (2014) to suggest the jet might have failed because it was damped by the additional helium layer in the progenitor. These objects appear to act as a bridge between the highly relativistic, collimated GRBs and more normal type Ic SNe.
SN 2014ad was discovered on March 12.4, 2014 by the Catalina Real-Time Transient Survey, in PGC 37625 (Mrk 1309) at RA = 11 57 44.44, Dec = 10∘ 10′ 15′′.7 (Howerton et al., 2014). The object was located at 3.5′′ West and 7.2′′ North of the center of the host galaxy. Howerton et al. (2014) reported that the early spectrum taken on March 14.9 and 15.9 with the South African Large Telescope, showed a blue continuum and broad lines with minima near 4400 Å and 5100 Å. It was suggested that it could be peculiar type Ia supernova, either a type Iax event or similar to SN 2002bj and SN 2005ek, or perhaps something unique (Howerton et al., 2014). Further spectroscopic observations of this object on March 16.9, 17.9 and 18.9 revealed the development of broad lines and its resemblance to broad-line type Ic SNe like SN 1998bw and SN 2002ap, though with some differences in the line velocities and shapes. Recently Stevance et al. (2017) have presented spectropolarimetric study of SN 2014ad. In this paper we present results of optical imaging and spectrosopy, together with the Swift UVOT data from the archives.
2 The light curve
2.1 Optical observations
Optical imaging of SN 2014ad was carried out in Bessell’s , , , and bands, using the Himalayan Faint Object Spectrograph Camera (HFOSC) mounted on the Himalayan Chandra Telescope (HCT). The photometric monitoring of this object started on 2014 March 13 (JD 245,6730.41), soon after the discovery and was continued until 2014 June 11 (JD 245,6820), when the object went into Solar conjunction. The central 2K2K region of 2K4K pixels CCD chip was used for imaging observations. With a plate scale of 0.296 arcsec pixel-1, the central 2K2K pixels cover a field of view of 1010 arcmin2. Gain and readout noise of the CCD camera are 1.22 electron ADU-1 and 4.87 electrons, respectively. Further details about the telescope and instrument can be obtained from http://www.iiap.res.in/centers/iao. On each night several calibration frames e.g. bias frames, twilight sky flat frames were taken. The observed data was reduced in a standard manner, using various tasks available within Image Reduction and Analysis Facility (iraf111iraf is distributed by the National Optical Astronomy Observatories, which are operated by the Association of Universities for Research in Astronomy, Inc., under cooperative agreement with the National Science Foundation) package.
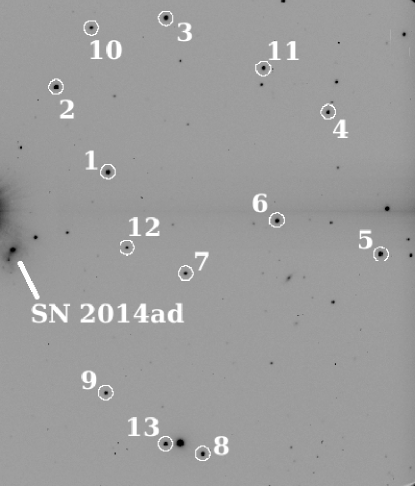
Photometric standard regions PG1323-085, PG1525-071, PG1633+099 and PG2213-006 from the list of Landolt (1992) were observed on 2014 March 21, March 29, April 27, May 17 and June 04 under photometric sky conditions. Aperture photometry was performed to estimate the instrumental magnitudes of Landolt’s standard stars. The aperture photometry was done at two apertures, at an optimal aperture determined using the aperture growth curve and an aperture close to full width half maximum (FWHM) of stellar profile. Bright stars in the field were used to determine an aperture correction between the two different apertures. This correction was applied to the magnitude obtained at smaller aperture. The average extinction co-efficients for the site (Stalin et al., 2008), were used for atmospheric extinction correction. The average colour terms for the system were used to determine the photometric zero points by fitting a linear relation between the observed and standard colours. A sequence of secondary standards in the supernova field, was calibrated using the estimated zero points and average colour terms. Calibrated magnitudes of the secondary standards, averaged over 5 nights are given in Table 1 and have been marked in Fig. 1. To avoid saturation due to a very bright star next to the host galaxy, the supernova was placed close to the edge of the field of view.
The aperture and profile fitting photometry of the supernova suffer due to the complex background of the host galaxy at supernova location. Subtraction of the host galaxy image (template subtraction) works well in removing the galaxy background and results in accurate photometry. Deep template images of the host galaxy were obtained with the same instrumental setup, once the supernova faded sufficiently. The template images in different bands were subtracted from the corresponding supernova frames and aperture photometry was performed on the residual frames to estimate instrumental magnitude of the supernova. The magnitudes of the secondary standards were measured using aperture photometry. Finally, the calibrated magnitudes of the supernova were obtained differentially with respect to the set of secondary standard stars in the supernova field. The supernova magnitudes in , , , and bands have been listed in Table 2. The errors reported in Table 2 are estimated by taking into account the photometric error (computed by iraf) and the calibration error.
| ID | U | B | V | R | I |
|---|---|---|---|---|---|
| 1 | 15.559 0.023 | 15.160 0.015 | 14.370 0.017 | 13.895 0.022 | 13.464 0.016 |
| 2 | 15.194 0.016 | 15.009 0.020 | 14.356 0.004 | 13.963 0.016 | 13.607 0.009 |
| 3 | 15.717 0.021 | 15.544 0.022 | 14.863 0.008 | 14.458 0.029 | 14.072 0.025 |
| 4 | 16.078 0.016 | 15.759 0.018 | 15.021 0.014 | 14.590 0.014 | 14.196 0.017 |
| 5 | 15.271 0.007 | 15.387 0.017 | 14.838 0.005 | 14.463 0.006 | 14.076 0.018 |
| 6 | 16.319 0.031 | 15.891 0.014 | 15.116 0.013 | 14.672 0.018 | 14.264 0.015 |
| 7 | 16.918 0.016 | 16.438 0.017 | 15.534 0.015 | 15.019 0.022 | 14.524 0.017 |
| 8 | 16.008 0.033 | 15.928 0.012 | 15.298 0.012 | 14.920 0.009 | 14.542 0.012 |
| 9 | 19.799 0.099 | 18.573 0.003 | 17.051 0.024 | 16.003 0.011 | 14.850 0.013 |
| 10 | 16.746 0.020 | 16.228 0.027 | 15.421 0.005 | 14.925 0.004 | 14.481 0.023 |
| 11 | 16.651 0.009 | 16.438 0.022 | 15.749 0.006 | 15.338 0.018 | 14.954 0.022 |
| 12 | 16.739 0.034 | 16.829 0.015 | 16.290 0.030 | 15.944 0.034 | 15.611 0.034 |
| 13 | 14.951 0.033 | 15.145 0.002 | 14.839 0.005 | 14.630 0.012 | 14.379 0.012 |
| Date | JDa | Phaseb | U | B | V | R | I |
|---|---|---|---|---|---|---|---|
| 13/03/2014 | 730.407 | 5 | 14.489 0.010 | 15.237 0.027 | 15.099 0.013 | 14.934 0.025 | 14.859 0.028 |
| 14/03/2014 | 731.423 | 4 | 15.065 0.030 | 14.781 0.015 | 14.697 0.023 | 14.706 0.027 | |
| 18/03/2014 | 735.273 | 14.595 0.020 | 14.705 0.020 | 14.084 0.061 | 13.992 0.043 | 13.882 0.082 | |
| 19/03/2014 | 736.206 | +1 | 14.756 0.013 | 14.105 0.020 | 13.908 0.020 | 13.803 0.019 | |
| 21/03/2014 | 738.376 | +3 | 14.985 0.018 | 15.000 0.009 | 14.003 0.005 | 13.815 0.019 | 13.733 0.004 |
| 25/03/2014 | 742.316 | +7 | 15.479 0.015 | 15.257 0.008 | 13.93 0.006 | 13.771 0.010 | 13.69 0.006 |
| 26/03/2014 | 743.317 | +8 | 15.572 0.061 | 15.392 0.010 | 13.960 0.013 | 13.777 0.006 | 13.716 0.008 |
| 27/03/2014 | 744.250 | +9 | 15.705 0.029 | 15.669 0.009 | 14.074 0.012 | 13.815 0.007 | 13.747 0.013 |
| 28/03/2014 | 745.217 | +10 | 15.919 0.014 | 15.593 0.006 | 14.064 0.007 | 13.726 0.014 | 13.769 0.019 |
| 29/03/2014 | 746.212 | +11 | 15.973 0.019 | 15.784 0.005 | 14.142 0.011 | 13.866 0.021 | 13.787 0.011 |
| 30/03/2014 | 747.144 | +12 | 16.133 0.018 | 15.803 0.014 | 14.202 0.013 | 13.931 0.009 | 13.832 0.014 |
| 01/04/2014 | 749.385 | +14 | 99.999 0.999 | 15.989 0.010 | 14.359 0.011 | 14.048 0.010 | 13.923 0.012 |
| 03/04/2014 | 751.157 | +16 | 16.515 0.007 | 16.165 0.006 | 14.489 0.016 | 99.999 0.999 | 14.024 0.013 |
| 09/04/2014 | 757.151 | +22 | 16.925 0.007 | 16.628 0.008 | 15.010 0.010 | 14.593 0.018 | 14.369 0.009 |
| 11/04/2014 | 759.195 | +24 | 16.616 0.029 | 15.074 0.060 | 14.710 0.010 | 14.490 0.013 | |
| 14/04/2014 | 762.179 | +27 | 16.748 0.042 | 15.222 0.019 | 14.901 0.017 | 14.627 0.016 | |
| 17/04/2014 | 765.141 | +30 | 17.039 0.017 | 16.902 0.019 | 15.407 0.013 | 15.027 0.018 | 14.771 0.017 |
| 18/04/2014 | 766.094 | +31 | 16.944 0.010 | 15.580 0.017 | 15.107 0.020 | 14.819 0.027 | |
| 19/04/2014 | 767.128 | +32 | 16.943 0.012 | 15.481 0.015 | 15.139 0.022 | 14.843 0.025 | |
| 23/04/2014 | 771.104 | +36 | 17.259 0.018 | 17.019 0.019 | 15.717 0.019 | 15.308 0.019 | 14.978 0.022 |
| 27/04/2014 | 775.162 | +40 | 17.523 0.016 | 17.334 0.027 | 15.918 0.015 | 15.481 0.022 | 15.106 0.024 |
| 30/04/2014 | 778.113 | +43 | 17.500 0.014 | 17.199 0.018 | 15.900 0.018 | 15.509 0.019 | 15.160 0.021 |
| 03/05/2014 | 781.162 | +46 | 17.611 0.014 | 17.423 0.014 | 15.936 0.010 | 15.598 0.010 | 15.226 0.013 |
| 07/05/2014 | 785.108 | +50 | 17.583 0.023 | 17.340 0.012 | 16.036 0.031 | 15.685 0.023 | 15.298 0.025 |
| 14/05/2014 | 792.112 | +57 | 17.784 0.035 | 17.419 0.016 | 16.241 0.007 | 15.870 0.012 | 15.489 0.022 |
| 15/05/2014 | 793.135 | +58 | 17.766 0.054 | 17.389 0.018 | 16.232 0.010 | 15.894 0.021 | 15.508 0.012 |
| 17/05/2014 | 795.110 | +60 | 17.718 0.018 | 17.372 0.010 | 16.323 0.012 | 15.906 0.013 | 15.538 0.012 |
| 04/06/2014 | 813.130 | +78 | 17.989 0.038 | 17.540 0.013 | 16.627 0.010 | 16.300 0.014 | 15.949 0.006 |
| 11/06/2014 | 820.162 | +85 | 17.937 0.080 | 17.657 0.026 | 16.861 0.011 | 16.469 0.021 | 16.005 0.034 |
| a245 6000+; bObserved phase with respect to the epoch of band maximum: JD = 245,6735.11. | |||||||
2.2 Swift UVOT observations
The ground based data on SN 2014ad is supplemented by data obtained by the Ultra Violet Optical Telescope (UVOT) on-board the Swift satellite, and retrieved from the Swift data archive. SN 2014ad was observed during JD 245,6735 to JD 245,6754 in optical broad band filter u (3465 Å) and three UV filters uvw2 (1928 Å), uvm2 (2246 Å) and uvw1 (2600 Å). The data were reduced using various modules in HEASoft (the High Energy Astrophysics Software) following Poole et al. (2008) and Brown et al. (2009). The magnitude of the supernova was obtained using uvotsource task. This task performs aperture photometry at a user defined aperture after taking into account the coincidence losses. Aperture photometry with an aperture of 5 arcsec is recommended. However, as the supernova was faint, photometry at a smaller aperture of 3 arcsec, having high signal-to-noise ratio, is performed and aperture correction provided by Poole et al. (2008) is applied to the extracted magnitudes. The background counts are estimated from the nearby region, using an aperture of size similar to that used for the supernova. Swift photometry of the supernova is reported in Table 3.
| Date | JDa | Phaseb | ||||
|---|---|---|---|---|---|---|
| 19/03/2014 | 735.69 | 0 | 17.667 0.19 | 17.346 0.13 | 16.010 0.08 | 14.730 0.04 |
| 21/03/2014 | 738.10 | 3 | 17.159 0.14 | 17.154 0.11 | 16.127 0.08 | 14.971 0.04 |
| 23/03/2014 | 740.36 | 5 | 17.233 0.14 | 17.223 0.08 | 16.467 0.09 | 15.244 0.04 |
| 25/03/2014 | 741.93 | 7 | 17.428 0.18 | 17.515 0.11 | 16.560 0.10 | 15.651 0.06 |
| 27/03/2014 | 743.96 | 9 | 16.653 0.10 | 15.872 0.16 | ||
| 29/03/2014 | 746.02 | 11 | 17.349 0.16 | 17.608 0.15 | 17.076 0.14 | 16.074 0.06 |
| 31/03/2014 | 747.91 | 13 | 17.183 0.14 | 17.566 0.17 | 17.062 0.18 | 16.090 0.11 |
| 03/04/2014 | 751.29 | 16 | 17.617 0.17 | 17.591 0.15 | 17.331 0.20 | 16.293 0.11 |
| 04/04/2014 | 751.63 | 16 | 18.037 0.25 | 17.503 0.13 | 17.182 0.16 | |
| 06/04/2014 | 754.04 | 19 | 17.496 0.13 | 17.369 0.11 | 17.059 0.12 | 16.529 0.10 |
| a245,6000+; bObserved phase with respect to the epoch of band maximum: JD = 245,6735.11. | ||||||
2.3 Light curve evolution
The optical and UV light curves of SN 2014ad are presented in Fig. 2. The optical observations started well before the phase of maximum light in different bands, while the Swift UV observation covers only the first 20 days since maximum. The light curve evolution of SN 2014ad in the and bands is similar and shows a fast decline soon after peak, whereas the , and light curves exhibit a slow decline. The and light curves do not show any considerable evolution and they are almost flat. A similar flat behaviour was reported in the band light curve of SN 2009bb (Pignata et al., 2011), and was interpreted as due to the dominance of the background flux a few days after maximum. In the absence of reference images in the Swift UV filters, a proper background subtraction is difficult.
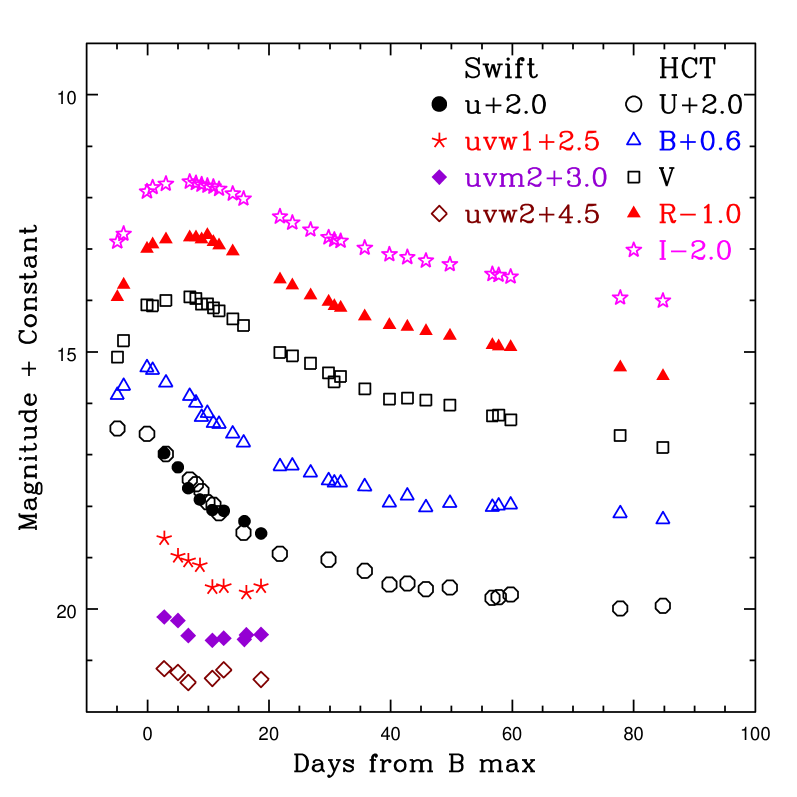
The date of maximum light in different bands is estimated by fitting a cubic spline to the observed data points around maximum light. The peak in bluer bands occurred earlier than the redder bands. The date of maximum and peak magnitude in the band could not be determined, as we do not have enough pre-maximum data points. The peak in the band occurred on JD 245,6735.110.25 with an apparent magnitude 14.787 0.025 mag. The peak in the band occurred at 5.5 days and the peak in the and bands occurred at 6.2 days after the band maximum.
SN 2014ad was discovered on March 12.40, 2014 (JD 245,6728.9) at an apparent magnitude of 15.7 mag. It was not detected in the image of the host galaxy obtained on March 06.37 (JD 245,6722.87), down to a limiting magnitude of 19.0 mag. This can be used to constrain the date of explosion of SN 2014ad as JD 245,6725 3 days. Further, the observed dates of maximum brightness indicate a rapid rise to maximum in the band in 10 3 days and the band rise time as 16 3 days.
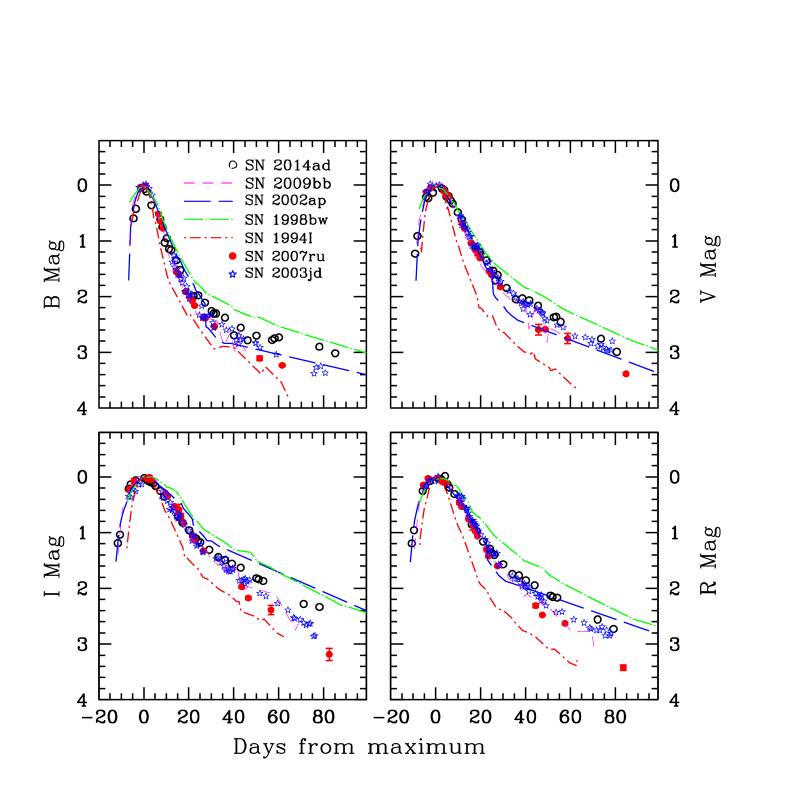
The light curve of SN 2014ad is plotted along with other well studied SNe Ic SN 1994I (Richmond et al., 1996); broad-line SNe Ic SN 2009bb (Pignata et al., 2011), SN 2007ru (Sahu et al., 2009), SN 2003jd (Valenti et al., 2008), SN 2002ap (Foley et al. 2003; Pandey et al. 2003) and GRB 980425/SN 1998bw (Galama et al., 1998) in Fig. 3. The rising part of the light curve of SN 2014ad is faster than SN 1998bw and similar to those of SN 2002ap and SN 2009bb. The light curve decline in 15 days from the peak is estimated as = 1.310.03, = 0.950.06, = 0.770.03 and = 0.620.02.
The light curve of SN 2014ad in all the bands is broader than type Ic SN 1994I. Except for SN 1998bw, the post-maximum evolution of the light curve of SN 2014ad is slower than other SNe used for comparison. During the early post-maximum phase ( 20 days after maximum in the -band) , and band light curves of SN 2014ad match well with SN 1998bw and after that SN 2014ad declines faster than SN 1998bw. The band light curve of SN 2014ad is similar to that of SN 2007ru and SN 2003jd, and narrower than SN 1998bw. The band decline rate of SN 2014ad is comparable to that of SN 2002ap, faster than SN 1998bw and slower than SN 2003jd, SN 2007ru and SN 2009bb.
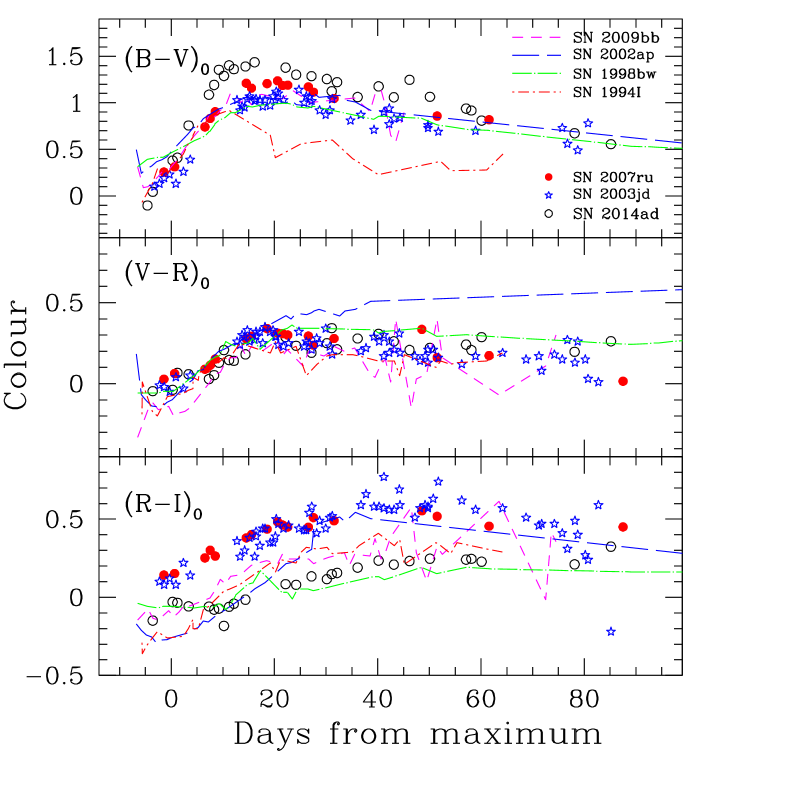
The de-reddened colour curves of SN 2014ad are plotted in Fig. 4 with those of SN 2009bb, SN 2007ru, SN 2003jd, SN 2002ap, SN 1998bw and SN 1994I. The colour curves of SN 2014ad have been corrected for colour excess = 0.22 mag (refer Section 2.4) while value for other supernovae is taken from their respective references. The colour evolution of SN 2014ad is similar to other broad-line type Ic SNe in comparison and different from the type Ic supernova SN 1994I. The colour evolution of SN 2014ad is similar to other broad-line Ic and type Ic SNe. The colour of type Ic SNe shows considerable dispersion, with SN 2014ad lying at the bluer end. The colour evolution of SN 2014ad is similar to that of SN 1998bw.
2.4 Reddening, distance and absolute magnitudes
The Galactic reddening in the direction of Mrk 1309, estimated from the infrared dust map of Schlegel et al. (1998) is = 0.045 mag. The low resolution spectrum of SN 2014ad around epoch of maximum light shows a strong Na i D absorption line due to interstellar matter within the Milky Way, and a weaker absorption at the rest wavelength of the host galaxy. The five spectra of SN 2014ad, obtained close to maximum light, were averaged to improve the signal-to-noise ratio for measuring the equivalent width of the Na i D absorption line. The average equivalent width of the Galactic component of the Na i D line is 0.98 0.06 Å and from the host galaxy is 0.06 0.01 Å. Using the relation between the equivalent width of Na i D line and reddening (Poznanski et al., 2012), we estimate = 0.20 0.06 mag, = 0.02 mag and total reddening = 0.22 0.06 mag. The estimated is high as compared to the value reported by Schlegel et al. (1998). The estimated higher of SN 2014ad is consistent with colour evolution, the reddening corrected and colours of SN 2014ad are similar to other broad-line type Ic SNe (see Fig. 4). For further analysis, we have adopted = 0.22 0.06 mag.
The distance to the host galaxy Mrk 1309 of SN 2014ad is estimated using the radial velocity of the host, corrected for the local group infall onto the Virgo cluster V = 1904 32 km s-1 (Mould et al., 2000). For = 72 km s-1 Mpc-1, the distance to SN 2014ad is 26.44 Mpc and distance modulus is 32.11 0.15 mag.
The peak absolute magnitude of SN 2014ad in different bands has been estimated using the reddening and distance modulus mentioned above. With band absolute magnitude of 18.86 0.23 mag, SN 2014ad is more luminous than type Ic SNe 1994I ( = 17.62 0.3 mag; Richmond et al. 1996; Sauer et al. 2006), 2004aw ( = 18.02 0.3 mag; Taubenberger et al. 2006), 2007gr ( = 17.22 0.18 mag; Hunter et al. 2009), broad-line SNe 2012ap ( = 18.67 0.08 mag; Milisavljevic et al. 2015), 2009bb ( = 18.65 0.34 mag; Pignata et al. 2011), 2002ap ( = 17.37 0.05 mag; Foley et al. 2003; Pandey et al. 2003), and XRF 060218/SN 2006aj ( = 18.67 0.08 mag; Modjaz et al. 2006) and fainter than GRB 980425/SN 1998bw ( = 19.12 0.05 mag; Galama et al. 1998), GRB 031203/SN 2003lw ( = 19.75 0.5 mag; Malesani et al. 2004). The band absolute magnitude of SN 2014ad is, however, comparable to those of broad-line SNe 2007ru ( = 19.06 0.2 mag; Sahu et al. 2009) and 2003jd ( = 18.9 0.3 mag; Valenti et al. 2008). Our estimate of for SN 2014ad is consistent with that reported by Stevance et al. (2017).
The band absolute magnitude of SN 2014ad 18.87 0.3 mag, is comparable to those of broad-line Ic SNe (MR = 19.0 1.1 mag) and engine driven SNe (MR = 18.9 0.4 mag), and brighter than normal Ic SNe (MR = 18.3 0.6 mag) from the sample of Drout et al. (2011).
3 The optical spectrum
3.1 Observations
Spectroscopic observations of SN 2014ad were performed during 2014 March 13 (JD 245,6730.35) to 2014 June 13 (JD 245,6822.17) using the HCT. To cover the entire optical waveband, the observations were carried out using grisms Gr#7 (wavelength range 3500–7800 Å) and Gr#8 (5200–9250 Å), available with the HFOSC. The spectral resolution is 7 Å. A late phase spectrum was obtained with the 8.2 m Subaru Telescope equipped with the Faint Object Camera and Spectrograph (FOCAS; Kashikawa et al. 2002) on 2015 February 22. A 0′′.8 slit and B300 grism, covering 4700–9000 Å, were used for this observation. The journal of spectroscopic observations is given in Table 4. Spectroscopic data reduction was carried out using tasks available within IRAF. The spectra were bias subtracted and flat-fielded. The one dimensional spectra were extracted using the optimal extraction method. The one dimensional spectra obtained with the HCT were wavelength calibrated using the arc lamp spectra of FeAr and FeNe. The wavelength calibration for Subaru data was obtained using ThAr arc lamp spectrum. The wavelength calibrated spectra were cross checked using bright night sky emission lines and whenever required, a small shift was applied. The spectrum of spectrophotometric standard stars, observed on the same night, was used to correct for the instrumental response and flux calibrate the supernova spectra. The spectra in the two different regions were combined, scaled to a weighted mean, to give the final spectrum on a relative flux scale. Except for the late phase spectrum obtained using Subaru, other spectra were brought to an absolute flux scale using the magnitudes. The supernova spectra were corrected for the host galaxy redshift of = 0.01546 (from NED) and dereddened by the total reddening = 0.22 mag as estimated in Section 2.4. The telluric lines have not been removed from the spectra.
| Date | JDa | Phaseb | Range (Å) |
|---|---|---|---|
| 13/03/2014 | 730.35 | 5 | 3500-7800; 5200-9250 |
| 14/03/2014 | 731.34 | 4 | 3500-7800; 5200-9250 |
| 18/03/2014 | 735.31 | 0 | 3500-7800; 5200-9250 |
| 19/03/2014 | 736.22 | +1 | 3500-7800; 5200-9250 |
| 21/03/2014 | 738.40 | +3 | 3500-7800; 5200-9250 |
| 25/03/2014 | 742.34 | +7 | 3500-7800; 5200-9250 |
| 27/03/2014 | 744.22 | +9 | 3500-7800; 5200-9250 |
| 28/03/2014 | 745.37 | +10 | 3500-7800; 5200-9250 |
| 29/03/2014 | 746.34 | +11 | 3500-7800; 5200-9250 |
| 31/03/2014 | 748.12 | +13 | 3500-7800; 5200-9250 |
| 04/04/2014 | 752.20 | +17 | 3500-7800; 5200-9250 |
| 14/04/2014 | 762.13 | +27 | 3500-7800; 5200-9250 |
| 16/04/2014 | 764.25 | +29 | 3500-7800; 5200-9250 |
| 23/04/2014 | 771.30 | +36 | 3500-7800; 5200-9250 |
| 27/04/2014 | 775.23 | +40 | 3500-7800; 5200-9250 |
| 03/05/2014 | 781.14 | +46 | 3500-7800; 5200-9250 |
| 17/05/2014 | 795.13 | +60 | 3500-7800; 5200-9250 |
| 27/05/2014 | 805.19 | +70 | 3500-7800; 5200-9250 |
| 04/06/2014 | 813.14 | +78 | 3500-7800; 5200-9250 |
| 13/06/2014 | 822.17 | +87 | 3500-7800; 5200-9250 |
| 22/02/2015c | 1075.43 | +340 | 4700-9000 |
| a245,6000+; bin days relative to band maximum. | |||
| cObservation taken with Subaru Telescope. | |||
3.2 Spectral Evolution
3.2.1 Pre-maximum spectral evolution
The spectral evolution of SN 2014ad in the pre-maximum phase is presented in Fig 5. The first two spectra obtained on 5 and 4 d with respect to the band maximum show a blue continuum with two distinct broad absorptions at 3800 Å and at 4400 Å. Weak notches are also seen at 4800 Å and at 5800 Å in both the spectra. The absorption at 3800 Å is due to Ca ii, and the absorptions at 4400 Å and 4800Å are due to Mg ii and Fe ii, respectively (Walker et al., 2014). In the 4 d spectrum, a depression is seen at 7300 Å which was not present in the spectrum taken on day 5. This feature is due to heavily blended O i and Ca ii NIR triplet, and requires presence of sufficient material at velocity higher than 30000 km s-1 (Mazzali et al. 2002). The apparent broad emission-like features at 4000 Å and 4600 Å in the early phase spectra of SN 2014ad do not result from discrete emission lines, but they are merely the regions of low opacity, from where photons have higher probability of escaping (Iwamoto et al., 1998; Mazzali et al., 2000).
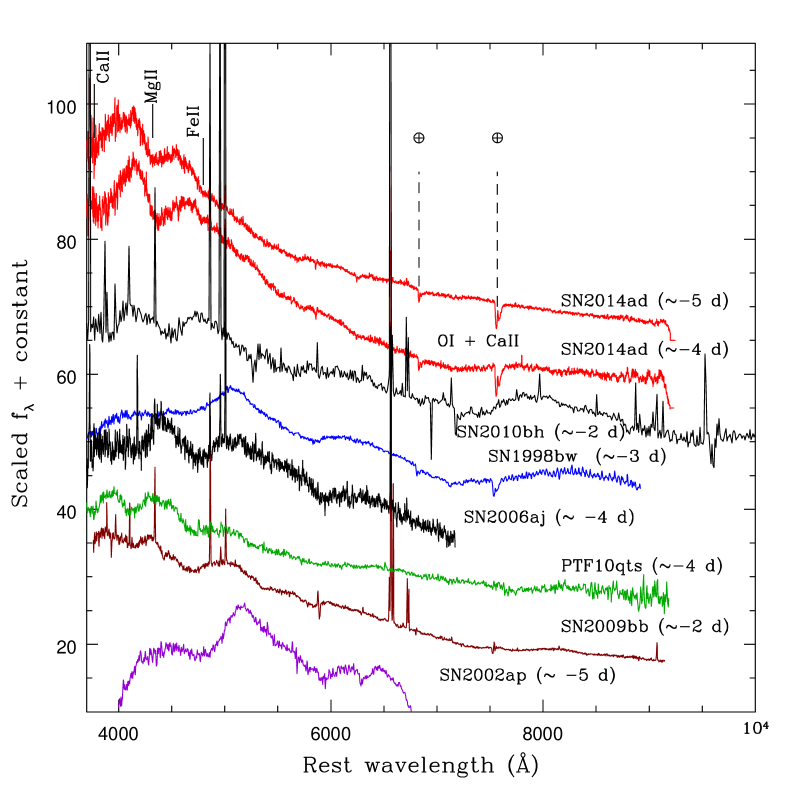
The pre-maximum spectra of SN 2014ad is compared with the spectrum of other broad-line type Ic SNe 1998bw (Patat et al., 2001), PTF10qts (Walker et al., 2014), 2009bb (Pignata et al., 2011), 2010bh (Bufano et al., 2012) and 2002ap (Foley et al., 2003) obtained at similar epoch, in Fig. 5. The shape of the spectrum of SN 2014ad is very similar to the spectra of PTF10qts, SN 2010bh and SN 2009bb, however, the features in the spectrum of SN 2014ad are blueshifted more. Except SN 2002ap, all other SNe show a blue continuum in the pre-maximum phase. There are noticable differences between the spectrum of SN 2014ad and SN 1998bw: the spectrum of SN 1998bw does not show the pseudo-emission peak at 4400 Å seen in SN 2014ad, which is due to higher metal content at high velocity (Mazzali et al., 2013). The pseudo-emission peak at 6300 Å seen in the spectrum of SN 1998bw is absent in the spectrum of SN 2014ad and the strong absorption at 7300 Å is less pronounced in the spectrum of SN 2014ad. Features similar to those seen in SN 2014ad have also been noted in the pre-maximum spectra of GRB 130702A/SN 2013dx (D’Elia et al., 2015).
3.2.2 Spectral evolution during maximum and post-maximum phase
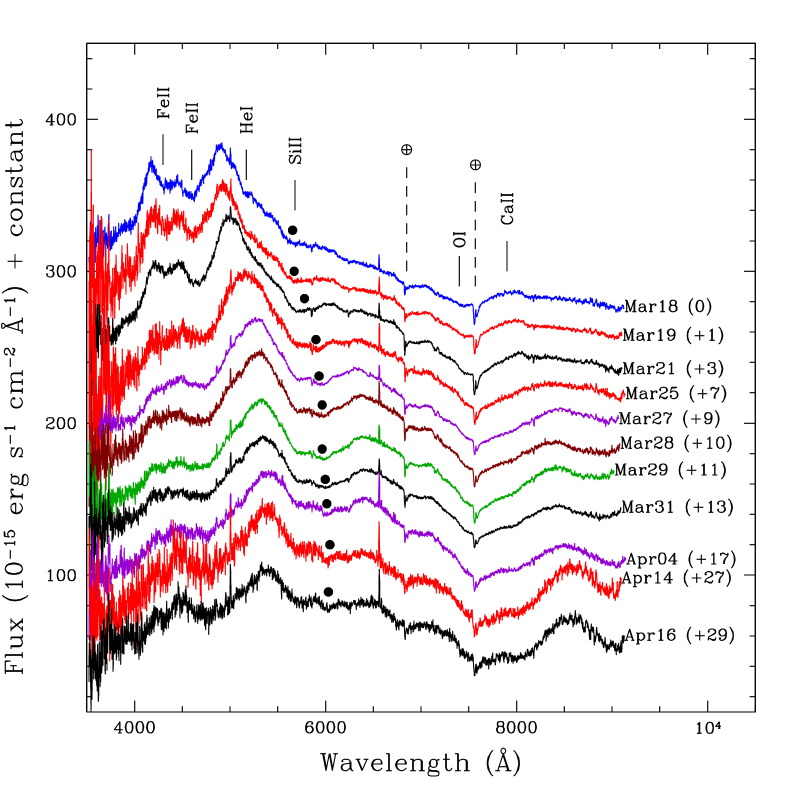
The spectral evolution during the first month, when the light curve shows steep decline from maximum light, is shown in Fig. 6. The spectrum at band maximum shows a significant evolution as compared to the pre-maximum spectra. The continuum becomes redder with emission peaks at 4200 Å and 4900 Å. The peak at 4200 Å weakens after first few days, whereas the peak at 4900 Å continues to be there with a gradual redshift. A small number of broad features are seen in the spectrum, which become increasingly dominant.
The main features in the spectra are due to lines of Si ii, O i, Ca ii and Fe ii. The weak notch seen in the pre-maximum spectra at 5800 Å appears to become stronger, which is most likely due to Si ii 6355 Å line. In the redder part of the spectrum, the O i line becomes stronger and is heavily blended with the Ca ii NIR triplet.
The spectrum of SN 2014ad obtained close to maximum light shows a depression at 5200 Å. A similar feature was noticed in the spectrum of SN 2009bb, and was identified with He i 5876 Å line (Pignata et al., 2011). If this feature is indeed due to He i 5876 Å feature, it corresponds to a velocity of 37000 km s-1, which is consistent with the photospheric velocity deduced from the absorption trough of Si ii 6355 Å line (refer Section 3.3). The broad absorption feature between 7300 Å to 8000 Å is similar to that seen in SN 2012ap, identified with multiple components of Ca ii, including a detached component of high velocity (HV) and very high velocity (VHV) (Milisavljevic et al., 2015).
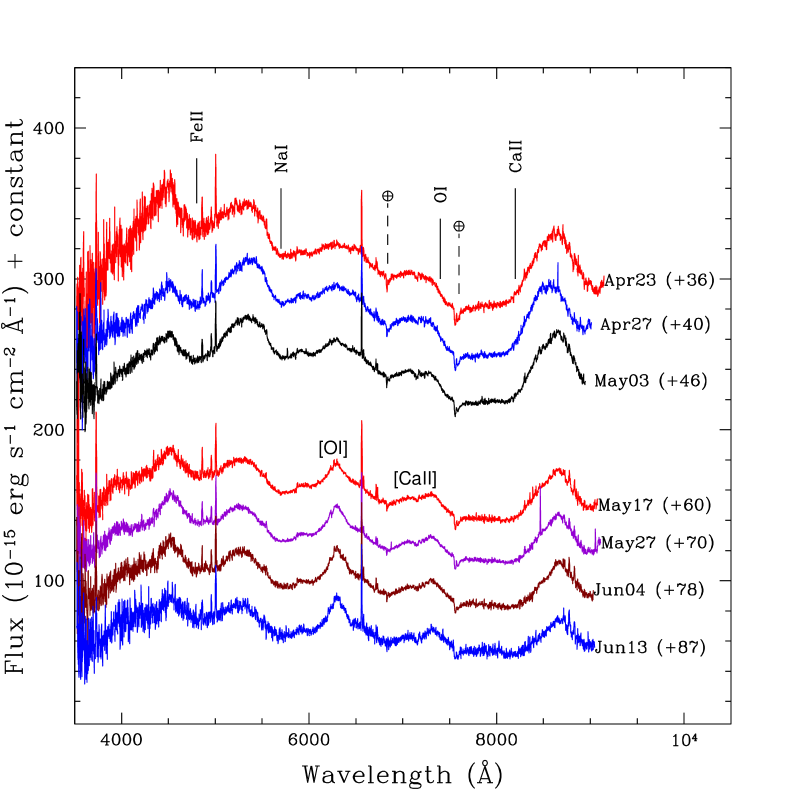
Spectral evolution of SN 2014ad during +36 d to +87 d, is shown in Fig. 7. During this phase the absorption dominated spectrum gradually changes to an emission dominated spectrum, indicating the ongoing transition to the nebular phase. The blue part of the spectrum gets increasingly supressed and the strength of the emission component of Ca ii NIR triplet increases. The absorption due to Na i D line becomes increasingly stronger. All the lines are still broad, indicating persistence of high expansion velocity of the ejecta.
The characteristic nebular lines due to [Mg i] 4571 Å, [O i] 6300, 6363 Å and [Ca ii] 7291, 7324 Å, superimposed on the continuum are seen in our spectrum obtained on +87 d. The presence of continuum shows that the transition to the nebular phase is not yet complete.
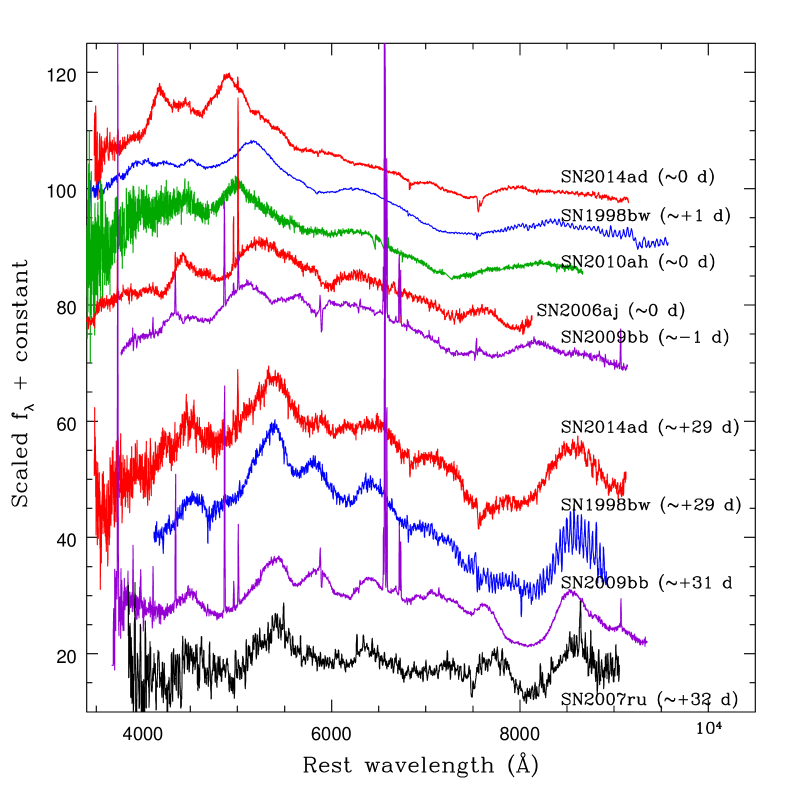
The spectrum of SN 2014ad around maximum light is compared with the spectrum of other broad-line objects obtained at similar epoch in Fig. 8. With broad spectral features, the spectrum of SN 2014ad is very similar to those of SN 1998bw and SN 2010ah. A comparison of +30 d spectrum of SN 2014ad with those of SN 1998bw, SN 2007ru and SN 2009bb, shows that the spectra of all the SNe in comparison look similar except for the difference in the line broadening due to differences in the expansion velocities (refer Fig. 8). They are all dominated by the P-Cygni profile of Ca ii NIR triplet. The O i 7774 Å line in the spectra of SN 2014ad and SN 1998bw is weak, it is even weaker in SN 2007ru, but in SN 2009bb it is stronger as compared to SN 2014ad.
3.2.3 Spectral evolution during nebular phase
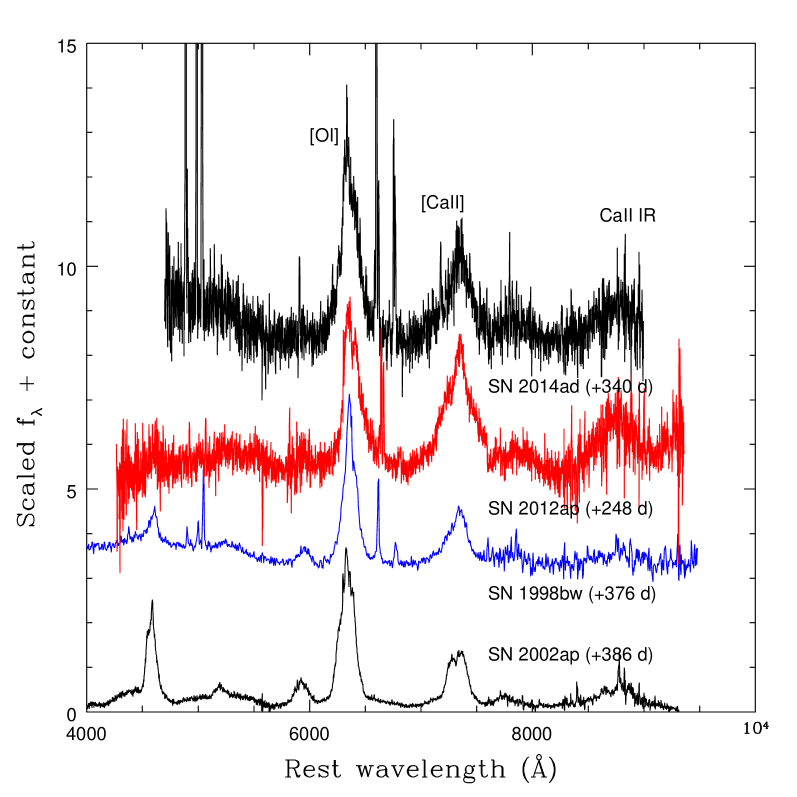
The spectrum of SN 2014ad obtained at +340 d is plotted in Fig. 9. This spectrum is dominated by [O i] 6300, 6363 Å and [Ca ii] 7291, 7324 Å possibly blended with [O ii] 7320, 7330 Å forbidden emission lines. Narrow emission lines from the host galaxy are also prominently seen in this spectrum. Nebular spectrum of SN 1998bw, SN 2002ap and SN 2012ap, around similar epoch, have also been plotted in the same figure for comparison.
The [O i] 6300, 6363 Å/[Ca ii] 7291, 7324 Å emission line ratio is found to be 1.54. This line ratio is important as it can be used as a good diagnostic of the main-sequence mass (M) of the progenitor star (Maeda et al., 2007). The mass of O in the ejecta of core-collapse SNe is very sensitive to the M of the progenitor and it increases with M, whereas mass of the explosively synthesized Ca is insensitive to the M of the progenitor, making the [O i]/[Ca ii] line ratio higher for massive progenitor star (Nomoto et al., 2006). Kuncarayakti et al. (2015) have compiled the [O i]/[Ca ii] line ratio for several core-collapse SNe of similar age during nebular phase. The line ratio is 1 for type IIP SNe included in their plot. For stripped envelope core-collapse SNe, Kuncarayakti et al. (2015) find that depending on whether the progenitor star is in a binary system or a single star, the ratio is found to be different. The [O i]/[Ca ii] line ratio for SN 2014ad (1.54) is comparable to those of SN 1998bw (1.7), SN 2002ap (2) SN 2007ru (1.6) and higher than SN 2009bb (0.8) and SN 2012ap (0.9). A higher value of [O i]/[Ca ii] for SN 2014ad indicates towards higher M for the progenitor star.
3.3 Photospheric velocity
In type Ib/c SNe the expansion velocity estimtated using the Fe ii lines around 5000 Å, is treated as representative of the photospheric velocity, as the other lines are formed much above the photosphere. The high expansion velocity of the ejecta in broad-line Ic SNe results in blending of Fe ii lines making its identification difficult. In such cases, the expansion velocity measured using Si ii line is generally used as photospheric velocity.
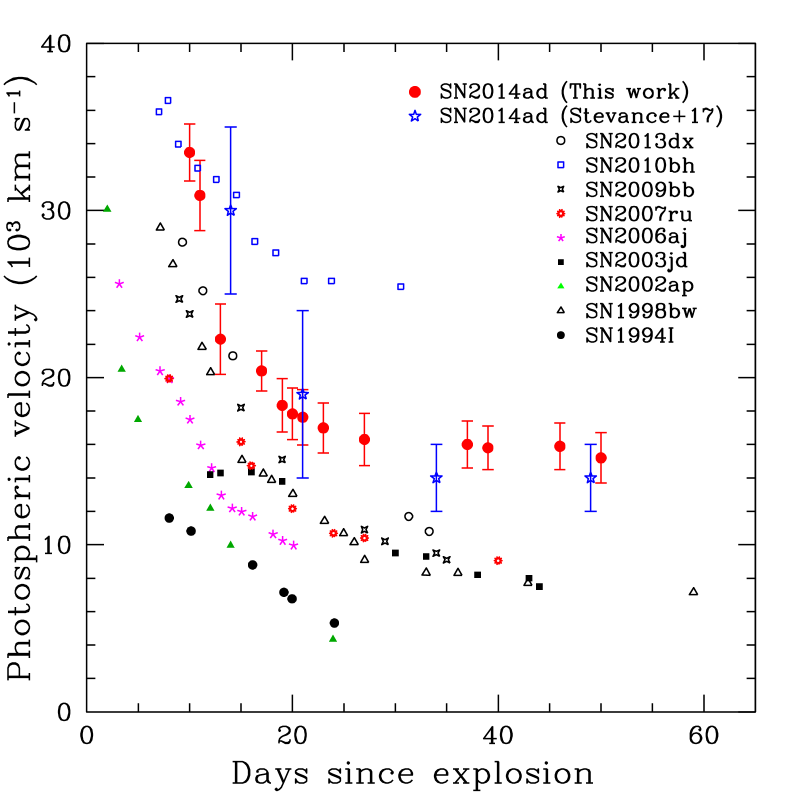
The photospheric velocity of SN 2014ad is measured using absorption trough of the Si ii 6355 Å line, in the redshift corrected spectra. During the pre-maximum phase, due to severe blending of the spectral lines, identification of even Si ii feature is difficult. Hence, velocity during the pre-maximum phase could not be measured. The position of Si ii feature is marked in the spectra shown in Fig. 6, and temporal evolution of photospheric velocity is plotted in Fig. 10. The photospheric velocity of SN 2014ad, estimated by fitting the Fe ii blend using syn++ (Stevance et al., 2017) is also plotted in Fig. 10. Our photospheric velocity is consistent with estimates of Stevance et al. (2017). The Si ii line velocity ranges from 33500 km s-1 at maximum to 15000 km s-1 at around 40 d after maximum. The Si ii line velocity of SN 2014ad showed steep decline from 33500 km s-1 to 21000 km s-1 during 10 to 15 d after the explosion. A similar drop in the expansion velocity during the first 20 days after explosion has already been noticed in other broad-line type Ic SNe.
The photospheric velocity of other supernovae have also been plotted in Figure 10 for comparison. We find that the velocity of ejecta in SN 2014ad is unusually high. Except for SN 2010bh, expansion velocity of SN 2014ad is higher than all supernovae used in comparison. Beyond 20 days after explosion, the expansion velocity of SN 2014ad flattens at 15000 km s-1, while it flattens at 25000 km s-1 for SN 2010bh, and at 8000 km s-1 for the other SNe.
3.4 Spectral fitting with syn++
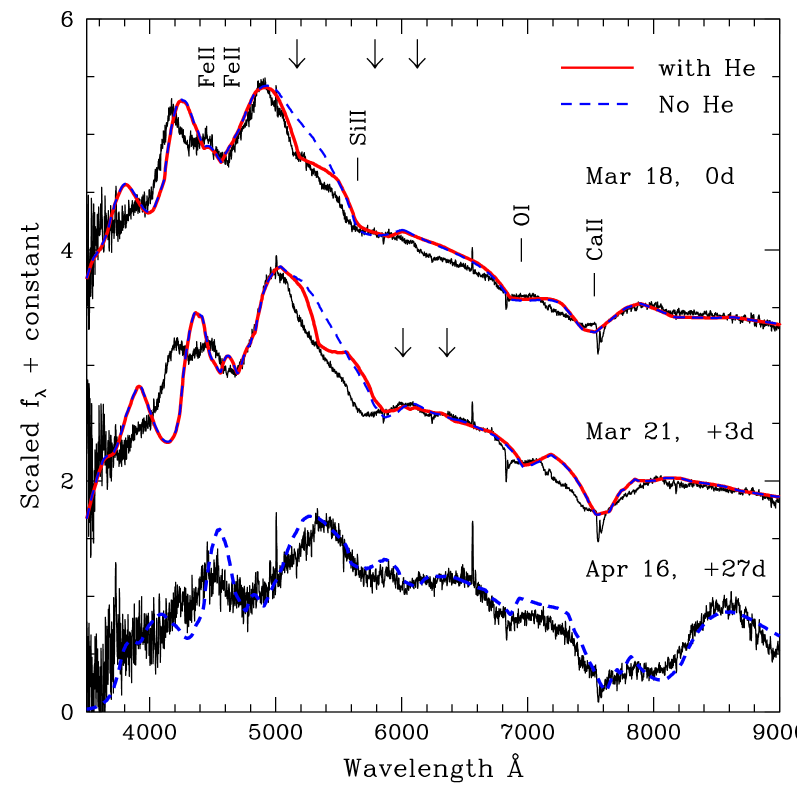
We used the syn++ code, an enhanced version of parameterized supernova spectrum synthesis code synow (Fisher, 2000), to generate synthetic spectra for SN 2014ad. The observed spectrum of SN 2014ad at maximum light is fit well with the synthetic spectrum having a photospheric velocity of 35000 km s-1 and black body temperature of 13000 K (See Fig. 11). The synthetic spectrum includes ions of O i, Mg ii, Si ii, Ca ii, Fe ii and Co ii. An excitation temperature of 6000 K was used for all the ions. Desired strength of the lines were obtained by varying the optical depth, which is an exponential function of velocity. It is noticed that the synthetic spectrum with the above species, does not fit the observed spectrum properly in the region 5000–5600 Å (shown by dashed blue line), especially the weak absorption around 5200 Å. This absorption minimum can be reproduced by introducing He i, marginally detached from the photosphere (shown by solid red line), at a velocity of 40000 km s-1. The expected locations of other He i lines 6678 Å and 7065 Å are also marked in the spectrum. However, as these lines are usually fainter as compared to 5876 Å line, it is difficult to detect them. The observed flux in the spectrum of SN 2014ad in the region bluer than 4000 Å reduces drastically. Such a flux deficit in the synthetic spectrum could not be produced by Co ii/Fe ii ions but adding Fe i improves the fit.
The best fit to the spectrum of SN 2014ad at +3 d is obtained at photospheric velocity of 25000 km s-1 and black body temperature of 10000 K. The ions included in the synthetic spectrum are the same as those used to fit the maximum light spectrum with the same excitation temperature. Similar to the case of maximum light spectrum, the fit was examined with and without adding He i. The synthetic spectrum without He i appears to be matching well the observed spectrum. This is consistent with the finding of Stevance et al. (2017), in which they did not find any indication for helium in the spectrum obtained at +4 d. An additional high velocity component of Ca ii was included at 50000 km s-1 to produce the broad feature of Ca ii NIR triplet.
The spectrum of SN 2014ad at +27 d matches well with the synthetic spectrum having a photospheric velocity of 16000 km s-1 and black body temperature of 7000 K. The ions of O i, Na i, Si ii, Ca ii, Fe i, Fe ii and Co ii are included at an excitation temperature of 6000 K each. Broad and deep absorption feature of Ca ii NIR triplet is reproduced by adding an additional high velocity component at 36000 km s-1.
The presence of He i line in the spectra of type Ic event SN 1994I was explored by Filippenko et al. (1995) and Clocchiatti et al. (1996), and its possible contamination with other species e.g. Na i, C i was discussed by Millard et al. (1999) and Sauer et al. (2006). Detection of He i has been reported in the broad-line type Ic SNe 2009bb (Pignata et al., 2011) and in 2012ap (Milisavljevic et al., 2015). The presence of He i in SN 2009bb is inferred through comparison of the optical spectra with the synthetic spectra, inclusion of helium in the synthetic spectrum is found to fit the observed spectrum better. In SN 2012ap the detection of He i in the optical spectra is supported by the presence of 10830 Å and 20581 Å lines. The spectrum of SN 2010bh showed weak absorption features in the optical and NIR spectrum, compatible with He i 5876 Å and 10830 Å lines. However, the presence of He i in SN 2010bh could not be confirmed since the 20581 Å line could not be clearly identified (Bufano et al., 2012). We have shown that inclusion of He i in the synthetic spectrum close to band maximum improves the fit marginally. An unambiguous detection of helium can be made only with NIR spectra and detailed spectral modelling.
3.5 Metallicity of the host galaxy in the supernova region
To understand the properties of the underlying region of the host galaxy, a spectrum of the supernova region was obtained on 2015 February 02, with the same settings as used for supernova observations. Narrow emission lines due to hydrogen, oxygen and sulphur from the host galaxy are clearly seen in the spectrum. The emission line fluxes were used to estimate the metallicity in the supernova region using different metallicity diagnostics available in the literature such as the calibration by McGaugh (1991), and the and prescription of Pettini & Pagel (2004). The McGaugh calibration, which uses the ratio gives an oxygen abundance of 12 + (O/H) = 8.38. The oxygen abundance estimated using the and index of Pettini & Pagel (2004) is 8.42 and 8.37, respectively. Oxygen abundance was also estimated using the host galaxy emission lines in the nebular spectrum of SN 2014ad, obtained with the Subaru telescope. It is found that it agrees well with the other estimates. The average value of 12 + (O/H) = 8.40.2, corresponds to 0.5 Z. This shows that the metallicity at the supernova region is sub-solar. Modjaz et al. (2008) have shown that GRBs are found in metal poor environment as compared to the broad-line type Ic SNe without GRBs. It is also shown that, following the strong line diagnostics of Kewley & Dopita (2002), the oxygen abundance 12 + (O/H) at the location of the broad-line SNe Ic is 8.5, which corresponds to 0.2–0.6 Z, depending on the adopted metallicity scale and solar abundance value. Our estimates of metallicity at the location of SN 2014ad is consistent with findings of Stevance et al. (2017) and Modjaz et al. (2008).
4 Bolometric Light curve
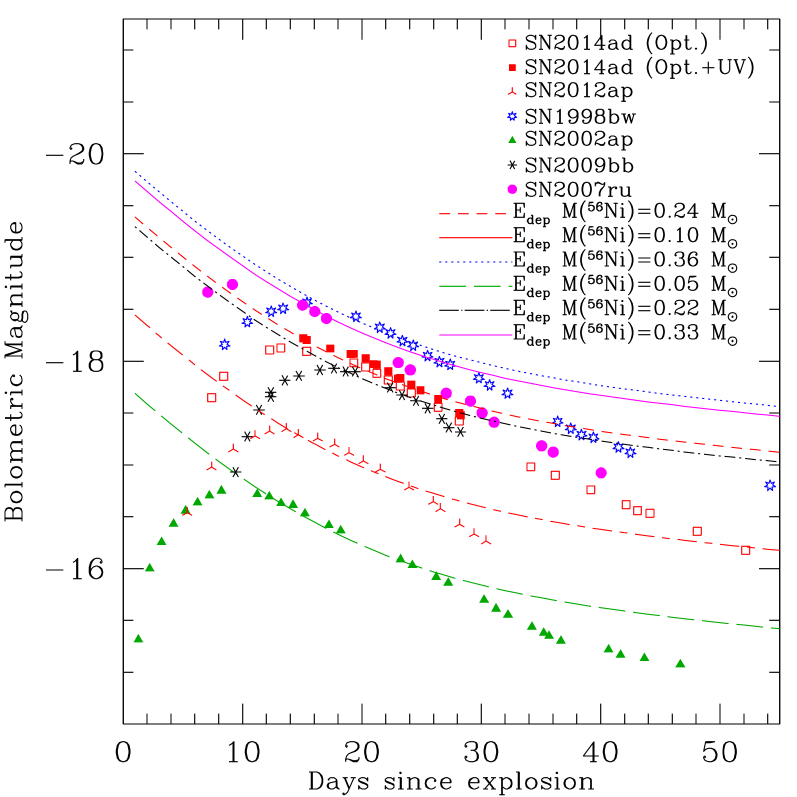
The quasi-bolometric light curve of SN 2014ad was constructed using the optical and Swift UV magnitudes reported in Section 3. The observed magnitudes were corrected for total extinction of = 0.22 mag, using the Galactic reddening law of Cardelli et al. (1989). The extinction corrected magnitudes were then converted to monochromatic flux at the filter effective wavelength, using the magnitude to flux conversion zero points from Bessell et al. (1998). The fluxes were then interpolated using the spline function and integrated from 0.31 to 0.93 . The quasi-bolometric luminosity thus obtained is used to estimate the bolometric magnitude and is plotted in Fig. 12. During JD 245,6738 to JD 245,6751, when the Swift UV data was available, the integration was carried out from 0.16 to 0.93 . The bolometric light curve of SN 2014ad peaked on JD 245,6738 with bolometric magnitude -18.10 mag. The quasi-bolometric light curve of some broad-line type Ic SNe with and without GRB, estimated in the similar way are also plotted in the figure. The early post-maximum decline of quasi-bolometric light curve of SN 2014ad is slower ((Bol) = 0.80) than SNe 2009bb, 2012ap, and it is faster than SNe 1998bw, 2002ap. The late phase (between +30 d and the last available data point) decline rate of SN 2014ad is 2.1 mag (100d)-1, which is marginally faster than SN 1998bw but slower than SN 2009bb. The slower decline during the late phase indicates that the ejecta is still thick for -rays to escape. Further, inspite of the extremely high expansion velocity during the early phase and relatively high velocity ( 15000 km s-1) during the late phase, the slowly declining bolometric light curve (indicative of efficient trapping of -rays) of SN 2014ad hints towards a massive ejecta.
An estimate of the contribution of UV ( and ) bands to bolometric luminosity is made. The first available Swift UV data point corresponds to 3 d after maximum in the band. At this epoch the UV flux contributes 10% to the bolometric flux. The UV contribution decreases to 7% at 15 days after maximum. Thus, the contribution of UV band is small even if / brightness is overestimated due to contamination by the background light. There are only few broad-line type Ic SNe for which UV observations are available, again the temporal coverage for most of them is sparse. However, for SN 2006aj the contribution of UV flux to bolometric flux is derived by Campana et al. (2006) and Cano et al. (2011). They showed that because of the shock breakout of the progenitor star, during the first few days ( 2 days) after the explosion, contribution of UV flux to the bolometric flux was high, and thereafter decayed rapidly. For SN 2014ad, the estimated UV contribution of 10% to bolometric flux at +3 d is consistent with the fraction estimated for SN 2006aj at similar epoch. In the quasi-bolometric curve presented in Fig. 12, no correction has been applied for the missing flux in the IR-bands. It is shown that the missing flux in NIR bands can contribute 20 – 25% to the bolometric flux near maximum brightness, which increases to 40 – 50% one month later (Tomita et al. 2006; Valenti et al. 2008; Cano et al. 2011). After including a contribution of 20% for the missing band in NIR, the peak bolometric magnitude of SN 2014ad is -18.32 mag.
5 Explosion parameters
The bolometric light curve derived in Section 4 along with the information about the photospheric velocity is used to estimate explosion parameters i.e. mass of ejecta (M), kinetic energy (E) and mass of 56Ni synthesized in the explosion of SN 2014ad. The explosion parameters can be derived either by detailed hydroynamical light curve and spectral modelling of these events (Iwamoto et al. 1998; Mazzali et al. 2003, 2006; Valenti et al. 2008), by fitting the analytical model of Arnett (1982) to the estimated bolometric light curve of the supernova, or using the analytical formula for total rate of energy production via 56Ni 56Co (Nadyozhin, 1994).
The energy production curves for different values of mass of 56Ni has been estimated and are plotted in Fig. 12 (thin line) alongwith the quasi-bolometric light curves. From the figure it is evident that the energy production rate for 0.24 M⊙ of 56Ni matches best to the quasi-bolometric light curve of SN 2014ad. For comparison, bolometric light curves and the best matching energy production curves corresponding to different values of 56Ni for some other well studied broad-line Ic SNe are also shown in Fig. 12, which are in good agreement with the values reported in the literature.
Alternatively, the mass of 56Ni synthesized in the explosion can also be estimated using Arnett’s formulation (1982). This formulation is applicable to the SNe for which the light curves are powered purely by radioactive decay. The model assumes that during the photospheric phase supernova ejecta expands homologously with spherical symmetry, 56Ni is located at the center without any mixing to outer layers, a single opacity over the duration of the explosion and the ejecta is radiation-pressure dominated. The expression for luminosity as a function of time, modified by Valenti et al. (2008), to incorporate the energy produced by decay of cobalt into iron, is used. The mass of 56Ni and , the effective diffusion time that determines the overall width of the bolometric light curve, are the only free parameters in the expression for luminosity. For a uniform density, the ejecta kinetic energy and the effective diffusion time scale (Arnett 1982, 1996) are given by
| (1) |
| (2) |
where, is the optical opacity, taken as 0.07 cm2g-1 (Chugai, 2000), is a constant of integration (Arnett, 1982) and is the speed of light.
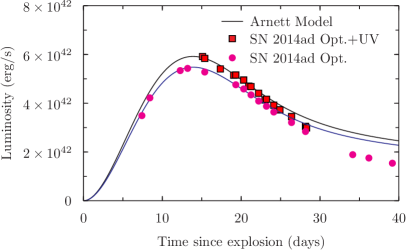
The quasi-bolometric light curve of SN 2014ad is fit with the modified Arnett’s formulation by varying mass of 56Ni and . This formulation assumes that the material is in the photospheric phase, which holds good till 30 days, hence the bolometric light curve till 30 days was considered for fitting Arnett’s model. The best model fit to the quasi-bolometric light curve is shown in Fig. 13. For the quasi-bolometric light curve, the best fit values of and mass of 56Ni are 11.6 0.6 days and 0.22 M⊙, respectively. The inclusion of Swift UV contribution to the quasi-bolometric light curve increases mass of 56Ni to 0.24 M⊙. The mass of 56Ni derived using the energy deposition curve and that using Arnett’s formulation are in good agreement.
The photospheric velocity, at the time of bolometric maximum (13 d after explosion) is measured as = 22300 2100 km s-1. The mass of ejecta estimated in this way is M = 3.3 0.8 M⊙ and the kinetic energy of explosion E = (1 0.3) 1052 ergs. The errors in the explosion parameters are estimated by taking into account the errors in and measured photospheric velocity. The mass of 56Ni and the ejecta mass for SN 2014ad matches well with the median values for broad-line Ic supernova, however, the kinetic energy is much higher than its median values for broad-line Ic SNe (0.61052 ergs) estimated by Cano (2013).
Drout et al. (2011), have proposed an empirical relation between the mass of 56Ni synthesized in the explosion and extinction corrected band absolute magnitude of the SNe,
| (3) |
where, M is the mass of 56Ni and is the extinction corrected band absolute magnitude of the supernova. The extinction corrected band absolute magnitude of SN 2014ad is 0.30 mag. This leads to the mass of 56Ni as 0.27 0.06 M⊙, which is consistent with other estimates of mass of 56Ni.
Cano (2013) suggests yet another method for estimating the explosion parameters of type Ibc SNe. In this method, the stretch and luminosity factors in filter for a given supernova is determined relative to -corrected light curves of template supernova SN 1998bw. The bolometric light curve of SN 1998bw is then scaled with the average stretch and luminosity factors. The transformed bolometric light curve is fit with analytical model of Arnett (1982) and the mass of 56Ni, mass of the ejecta and kinetic energy of explosion are determined. The advantage of using this method lies on the fact that the explosion parameters can be determined for those objects also for which data is sparse or is not available in all the optical bands. Using this method, Cano (2013) has estimated explosion parameters for a sample of GRB/XRF SNe, type Ib/c SNe and broad-line type Ic SNe.
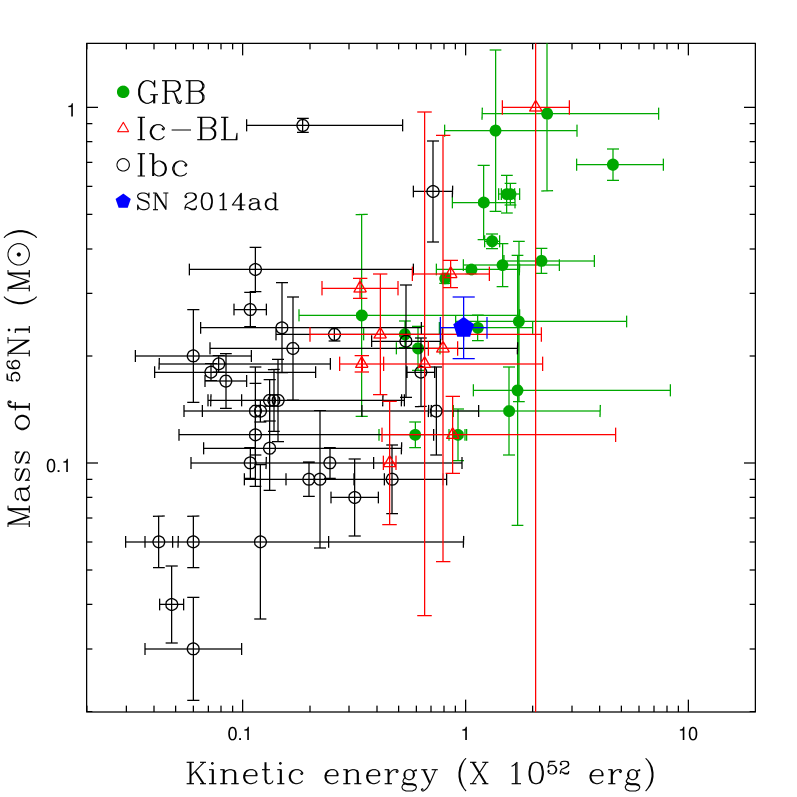
The explosion parameters from Cano (2013) are plotted in Fig. 14, 15 and 16. The parameters for SN 2014ad are also plotted in the same figures to check the position of SN 2014ad in these diagrams. It is pointed out by Toy et al. (2016), that there was a typo in the expression of E in Arnett (1982), which was later corrected by Arnett (1996). The expression used for estimating E and and Mej in this work takes it into account. As the kinetic energy E was estimated by Cano (2013) using E, their reported values of E have been scaled by a factor of 3/5 to compare with this work.
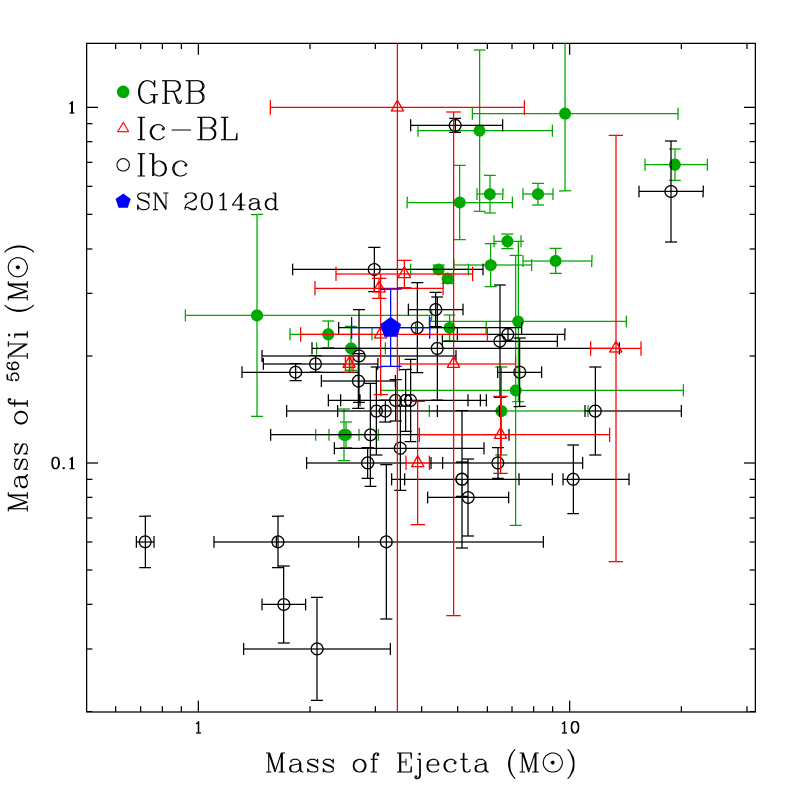
From Fig. 14 a correlation between the mass of 56Ni synthesized in the explosion and kinetic energy of explosion E is evident, objects with higher kinetic energy tend to produce more 56Ni in the explosion. The type Ibc SNe are the explosions with lower kinetic energy and the mass of 56Ni produced in them is also on the lower side, broad-line type Ic SNe exhibit higher kinetic energy and produce relatively larger 56Ni. As expected the GRB/XRF SNe are associated with extremely high kinetic energy and produce large amount of 56Ni. In the E - 56Ni plane, SN 2014ad appears closer to the GRB/XRF associated SNe than the broad-line Ic SNe. In Fig. 15 a correlation between mass of 56Ni and mass of ejecta is seen, though it is not as strong as seen in the plot between mass of 56Ni and kinetic energy of explosion. In this plot, different subclass of SNe do not occupy distinct region and there is a significant overlap.
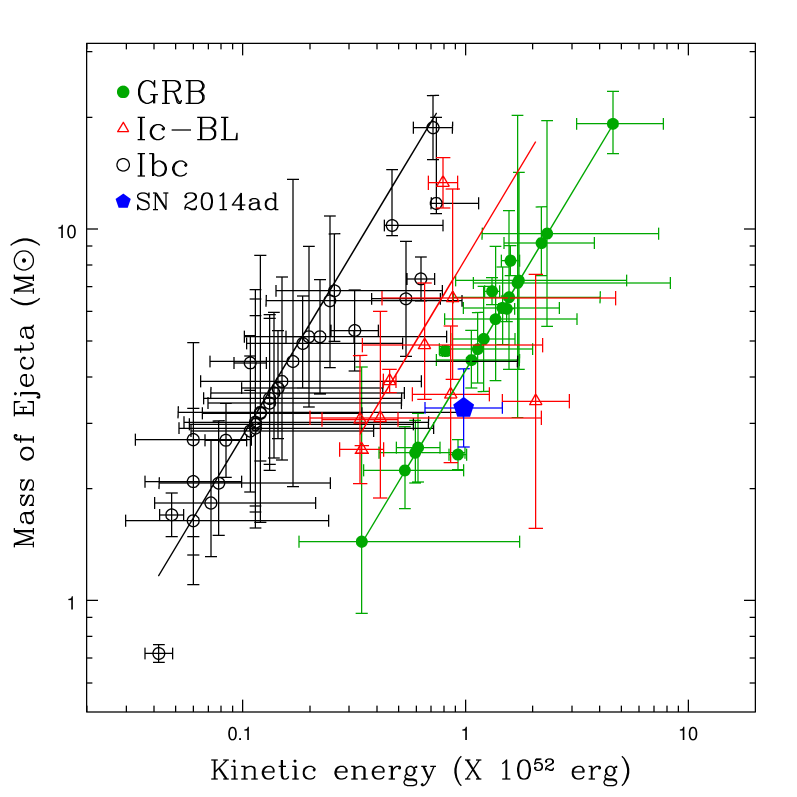
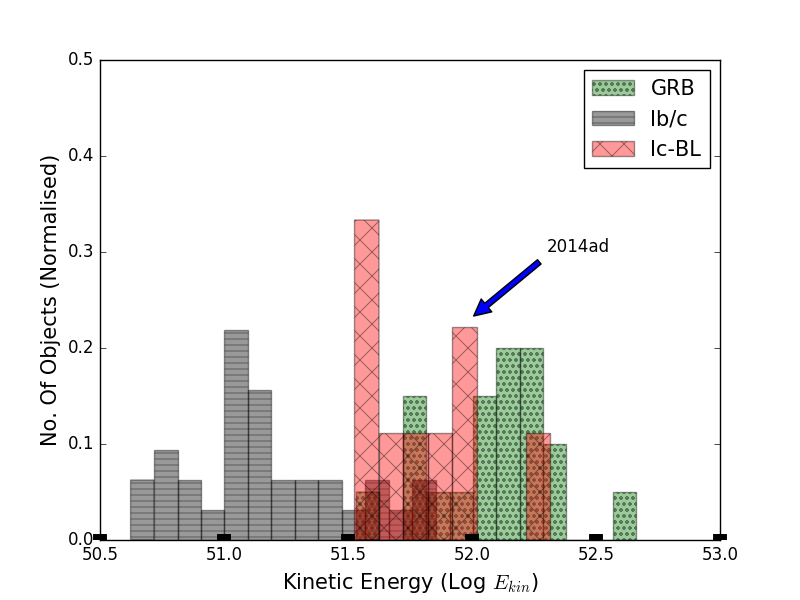
In Fig. 16 two clear sequences are seen. There is a tight correlation between M and E in case of type Ib/c SNe. Similarly, GRB/XRF SNe also show a tight correlation, but with a shift towards higher E/M ratio. Most of the broad-line Ic SNe are located in the region between the Ibc SNe and GRB/XRF associated SNe. Lyman et al. (2016) have also shown similar plots in which they have included SNe IIb, Ib, Ic and broad-line Ic. The observed tight correlation between M and E for SNe IIb, Ib and Ic was interpreted as the result of the similar photospheric velocity they exhibit. Though broad-line Ic SNe have comparable ejecta mass as those of SNe Ibc, because of their high expansion velocity they show high E/M ratio. With relatively higher kinetic energy and lower ejecta mass, SN 2014ad is located close to the strip occupied by GRB/XRF associated SNe. In Fig. 17, using the data from Cano (2013), distribution of Ib/c, broad-line Ic SNe and GRBs as a function of kinetic energy is plotted. In this distribution, with kinetic energy E = (1 0.3)1052 ergs, SN 2014ad lies close to the region occupied by GRBs.
From the above discussion it is clear that expansion velocity of the ejecta ( 22300 km s-1 at bolometric peak) and the E/M ratio ( 0.30) of SN 2014ad are high. It is larger than all other well studied broad-line Ic SNe (median value of E/M ratio 0.12). In fact, E/M ratio for SN 2014ad is even higher than GRB/XRF SNe (median value 0.24), except for SN 2010bh (GRB 100316D; Cano et al. 2011). We checked for possible association of SN 2014ad with GRB/XRF. There is no report of detection of any GRB from 19 February 2014, around the supernova location. SN 2014ad was observed with the Swift X-ray Telescope (XRT; Burrows et al. 2005) but there is no report of the detection of this supernova in X-rays too.
There are two other broad-line type Ic supernovae, SN 2009bb (Pignata et al., 2011) and SN 2012ap (Milisavljevic et al., 2015), both bright in the radio and mildly relativistic, not associated with GRB/XRF, did not show X-ray emission at late times. In both cases, helium was detected in the early-time optical spectra with photospheric velocities 20000 km s-1, during nebular phase the emission line flux ratio [O i]/[Ca ii] 1, and the metallicity of the supernova location is solar to super-solar. The explosion properties of both of these objects were shown to fall in between the normal Ibc events and SNe associated with GRBs. They were proposed to be weak-engine driven explosions, where the engine activity stops before being able to produce a successful jet breakout (Margutti et al., 2014). As the jet is not able to pierce through the stellar envelope only a small fraction of energy is dissipated at -ray frequencies, resulting in their non-detection in -ray region.
The factors which might be differentiating between the broad-line Ic without GRB and GRB associated supernova are the different lifetime of the central engine and progenitor properties (Margutti et al., 2014). The short lived engine may not be able to power the jets sufficiently enough to pierce through the envelope of the progenitor to produce a GRB, instead it can give rise to relativistic SNe (Lazzati et al., 2012). It is shown that most of the observed GRBs are associated with the metal poor environment (Modjaz et al., 2008). However, discovery of GRBs in high metallicity environment (Graham & Fruchter, 2013) indicates that though metallicity has some role, it may not be the ultimate parameter deciding the final explosion outcome (Margutti et al., 2014). The presence of helium is the other factor which affects breakout of jet. Presence of helium in SN 2009bb and SN 2012ap is an indication that the helium layers in the progenitor of these events is not fully removed. Margutti et al. (2014) have discussed the possibility that this helium layer may slow down the jet which subsequently fails to outbreak through the progenitor and results in relativistic SNe.
Some of the properties of SN 2014ad, namely, no association with GRB/XRF, high ejecta velocity, weak/no X-ray emission, are common with SN 2009bb and SN 2012ap. The nebular line flux ratio and metallicity in the supernova region of SN 2014ad is higher than SN 2009bb and SN 2012ap. Inspite of high kinetic energy and high E/M ratio, no GRB was detected with SN 2014ad. One reason for non detection of GRB with SN 2014ad may be the jet pointing away from the line of sight of the observer. The other possibility is, either the central engine was weak and short lived or some mechanism, such as presence of thin helium layer, was operational which slowed down the jet and it failed to outbreak through the progenitor.
For the very energetic broad-line type Ic supernova SN 2010ah, the explosion parameters were estimated by Mazzali et al. (2013) using spectral and light curve modelling. They inferred SN 2010ah to be an explosion of a CO core of 5–6 M⊙ and zero age main-sequence mass () of the progenitor star as 24–28 M⊙. Our estimates of the explosion parameters for SN 2014ad are similar to those of SN 2010ah indicating that the progenitor for SN 2014ad may also be a massive one. If we assume that a neutron star of 1.4–2.0 M⊙ is formed, the CO core mass is 3.9–6.1 M⊙. This mass range corresponds to the main-sequence mass of 20–25 M⊙, which is somewhat smaller than SN 2010ah. If we assume that a black hole more massive than 3 M⊙ is formed, the masses of the CO core 6 M⊙, then the 25 M⊙. Our inference of massive progenitor for SN 2014ad based on the nebular line ratio [O i]/[Ca ii] is consistent with this.
6 Summary
In this paper results based on low resolution optical spectroscopy, optical imaging and Swift UVOT imaging of broad-line type Ic supernova SN 2014ad have been presented. With an absolute band magnitude of 18.86 0.23 mag, it is brighter than normal, and most of the broad-line type Ic SNe, but fainter than GRB associated SNe. The width of the spectral features and the expansion velocity of the ejecta is found to be very high. In the early phase the expansion velocity is as high as 0.1, during the late phase also the expansion velocity is found to be higher than other objects of similar class except GRB associated SN 2010bh. The explosion parameters determined by fitting Arnett’s formulation to the derived bolometric light curve shows it to be a highly energetic explosion, however, no GRB/Xray flash was found to be associated with it. The main sequence mass of the progenitor star is estimated to be 20 M⊙.
Acknowledgement
We thank the referee for going through the manuscript carefully and providing constructive comments, which improved the manuscript. All the observers of the 2-m HCT, (operated by Indian Institute of Asrophysics), who kindly provided part of their observing time for observations of the supernova, are thankfully acknowledged. We thank Takashi Hattori, Ji Hoon Kim and the staff at the Subaru Telescope for their excellent support of the observation under S15A-078 (PI: K. Maeda). We thank Prof. David Branch for clarifying some of the doubts related to spectrum synthesis code syn++. We also thank Dr. Kuntal Mishra for providing us the code for fitting bolometric light curve. This work has been supported in part by the DST-JSPS grant DST/INT/JSPS/P-211/2016, the Grant-in-Aid for Scientific Research of JSPS (15H02075, 16H02168, 26400222, 26800100) and MEXT (25103515, 15H00788) and by World Premier International Research Center Initiative, MEXT, Japan. This work has made use of the public data in the Swift data archive and the NASA/IPAC Extragalactic Database (NED) which is operated by Jet Propulsion Laboratory, California Institute of Technology, under contract with the National Aeronautics and Space Administration (NASA).
References
- Arnett (1996) Arnett D., 1996, Supernovae and Nucleosynthesis: An Investigation of the History of Matter, from the Big Bang to the Present, by D. Arnett. Princeton: Princeton University Press, 1996.
- Arnett (1982) Arnett W. D., 1982, ApJ, 253, 785
- Bessell et al. (1998) Bessell M. S., Castelli F., Plez B., 1998, A&A, 333, 231
- Brown et al. (2009) Brown P. J. et al., 2009, AJ, 137, 4517
- Bufano et al. (2012) Bufano F. et al., 2012, ApJ, 753, 67
- Burrows et al. (2005) Burrows D. N. et al., 2005, SSRv, 120, 165
- Campana et al. (2006) Campana S. et al., 2006, Nature, 442, 1008
- Cano (2013) Cano Z., 2013, MNRAS, 434, 1098
- Cano et al. (2011) Cano Z. et al., 2011, ApJ, 740, 41
- Cardelli et al. (1989) Cardelli J. A., Clayton G. C., Mathis J. S., 1989, ApJ, 345, 245
- Chugai (2000) Chugai N. N., 2000, Astronomy Letters, 26, 797
- Clocchiatti et al. (1996) Clocchiatti A., Wheeler J. C., Brotherton M. S., Cochran A. L., Wills D., Barker E. S., Turatto M., 1996, ApJ, 462, 462
- D’Elia et al. (2015) D’Elia V. et al., 2015, A&A, 577, A116
- Drout et al. (2011) Drout M. R. et al., 2011, ApJ, 741, 97
- Filippenko (1997) Filippenko A. V., 1997, ARA&A, 35, 309
- Filippenko et al. (1995) Filippenko A. V. et al., 1995, ApJ, 450, L11
- Fisher (2000) Fisher A. K., 2000, Ph.D. thesis, Univ. Oklahoma
- Foley et al. (2003) Foley R. J. et al., 2003, PASP, 115, 1220
- Galama et al. (1998) Galama T. J. et al., 1998, Nature, 395, 670
- Graham & Fruchter (2013) Graham J. F., Fruchter A. S., 2013, ApJ, 774, 119
- Hjorth et al. (2003) Hjorth J. et al., 2003, Nature, 423, 847
- Howerton et al. (2014) Howerton S. et al., 2014, CBET, 3831
- Hunter et al. (2009) Hunter D. J. et al., 2009, A&A, 508, 371
- Iwamoto et al. (1998) Iwamoto K. et al., 1998, Nature, 395, 672
- Kashikawa et al. (2002) Kashikawa N. et al., 2002, PASJ, 54, 819
- Kewley & Dopita (2002) Kewley L. J., Dopita M. A., 2002, ApJS, 142, 35
- Kuncarayakti et al. (2015) Kuncarayakti H. et al., 2015, A&A, 579, A95
- Landolt (1992) Landolt A. U., 1992, AJ, 104, 340
- Langer (2012) Langer N., 2012, ARA&A, 50, 107
- Lazzati et al. (2012) Lazzati D., Morsony B. J., Blackwell C. H., Begelman M. C., 2012, ApJ, 750, 68
- Lyman et al. (2016) Lyman J. D., Bersier D., James P. A., Mazzali P. A., Eldridge J. J., Fraser M., Pian E., 2016, MNRAS, 457, 328
- Maeda et al. (2007) Maeda K. et al., 2007, ApJ, 658, L5
- Malesani et al. (2004) Malesani D. et al., 2004, ApJ, 609, L5
- Margutti et al. (2014) Margutti R. et al., 2014, ApJ, 797, 107
- Mazzali et al. (2000) Mazzali P. A., Iwamoto K., Nomoto K., 2000, ApJ, 545, 407
- Mazzali et al. (2013) Mazzali P. A., Walker E. S., Pian E., Tanaka M., Corsi A., Hattori T., Gal-Yam A., 2013, MNRAS, 432, 2463
- Mazzali et al. (2003) Mazzali P. A. et al., 2003, ApJ, 599, L95
- Mazzali et al. (2006) Mazzali P. A. et al., 2006, ApJ, 645, 1323
- McGaugh (1991) McGaugh S. S., 1991, ApJ, 380, 140
- Milisavljevic et al. (2015) Milisavljevic D. et al., 2015, ApJ, 799, 51
- Millard et al. (1999) Millard J. et al., 1999, ApJ, 527, 746
- Modjaz et al. (2016) Modjaz M., Liu Y. Q., Bianco F. B., Graur O., 2016, ApJ, 832, 108
- Modjaz et al. (2006) Modjaz M. et al., 2006, ApJ, 645, L21
- Modjaz et al. (2008) Modjaz M. et al., 2008, AJ, 135, 1136
- Mould et al. (2000) Mould J. R. et al., 2000, ApJ, 529, 786
- Nadyozhin (1994) Nadyozhin D. K., 1994, ApJS, 92, 527
- Nomoto et al. (2006) Nomoto K., Tominaga N., Umeda H., Kobayashi C., Maeda K., 2006, Nuclear Physics A, 777, 424
- Pandey et al. (2003) Pandey S. B., Anupama G. C., Sagar R., Bhattacharya D., Sahu D. K., Pandey J. C., 2003, MNRAS, 340, 375
- Patat et al. (2001) Patat F. et al., 2001, ApJ, 555, 900
- Perna & Loeb (1998) Perna R., Loeb A., 1998, ApJ, 509, L85
- Pettini & Pagel (2004) Pettini M., Pagel B. E. J., 2004, MNRAS, 348, L59
- Pian et al. (2006) Pian E. et al., 2006, Nature, 442, 1011
- Pignata et al. (2011) Pignata G. et al., 2011, ApJ, 728, 14
- Poole et al. (2008) Poole T. S. et al., 2008, MNRAS, 383, 627
- Poznanski et al. (2012) Poznanski D., Prochaska J. X., Bloom J. S., 2012, MNRAS, 426, 1465
- Rhoads (1999) Rhoads J. E., 1999, ApJ, 525, 737
- Richmond et al. (1996) Richmond M. W. et al., 1996, AJ, 111, 327
- Sahu et al. (2009) Sahu D. K., Tanaka M., Anupama G. C., Gurugubelli U. K., Nomoto K., 2009, ApJ, 697, 676
- Sanders et al. (2012) Sanders N. E. et al., 2012, ApJ, 756, 184
- Sauer et al. (2006) Sauer D. N., Mazzali P. A., Deng J., Valenti S., Nomoto K., Filippenko A. V., 2006, MNRAS, 369, 1939
- Schlegel et al. (1998) Schlegel D. J., Finkbeiner D. P., Davis M., 1998, ApJ, 500, 525
- Shivvers et al. (2017) Shivvers I. et al., 2017, PASP, 129, 054201
- Soderberg et al. (2006) Soderberg A. M., Nakar E., Berger E., Kulkarni S. R., 2006, ApJ, 638, 930
- Stalin et al. (2008) Stalin C. S., Hegde M., Sahu D. K., Parihar P. S., Anupama G. C., Bhatt B. C., Prabhu T. P., 2008, Bulletin of the Astronomical Society of India, 36, 111
- Stanek et al. (2003) Stanek K. Z. et al., 2003, ApJ, 591, L17
- Stevance et al. (2017) Stevance H. F. et al., 2017, MNRAS, 469, 1897
- Taubenberger et al. (2006) Taubenberger S. et al., 2006, MNRAS, 371, 1459
- Tomita et al. (2006) Tomita H. et al., 2006, ApJ, 644, 400
- Toy et al. (2016) Toy V. L. et al., 2016, ApJ, 818, 79
- Turatto (2003) Turatto M., 2003, in K. Weiler, ed., Supernovae and Gamma-Ray Bursters. Lecture Notes in Physics, Berlin Springer Verlag, Vol. 598, pp. 21–36
- Valenti et al. (2008) Valenti S. et al., 2008, MNRAS, 383, 1485
- Walker et al. (2014) Walker E. S. et al., 2014, MNRAS, 442, 2768
- Waxman (2004) Waxman E., 2004, ApJ, 602, 886